Abstract
High-Performance Liquid Chromatography (HPLC) combined with ultraviolet/visible (UV/Vis) or diode array detection (DAD) is routinely used for drug quantification in R&D around the world. However, it may lack the sensitivity required for bioanalytical studies. On the other hand, HPLC with fluorescence detection (FLD) is a cost-effective alternative that significantly increases drug signals, enabling the detection of compounds at very low concentrations. Pitavastatin is a lipid-lowering drug that contains the structure of quinoline, a highly fluorescent molecule. Recently, it has gained interest due to its pleiotropic effects on different conditions. Bearing this in mind, an HPLC-FLD method was developed and validated for the quantification of pitavastatin in human plasma. Overall, a signal gain of 54–70 times compared to that of UV detection was achieved when using fluorescence. Sample preparation included one-step protein precipitation with acetonitrile, followed by centrifugation and filtration prior to injection. Pitavastatin was separated from endogenous matrix interferents using a C18 column and by applying gradient elution. Atorvastatin was used as an internal standard. Accordingly, the method was shown to be selective, specific, and sensitive, with a lower limit of quantification of 3 ng/mL and complete absolute and relative recoveries higher than 94%. The method was linear over the wide concentration range of 3–900 ng/mL (R2 = 0.998), accurate (bias < 7.15%), and precise (RSD < 9.63%). This method allows for the therapeutic monitoring of patients treated with pitavastatin but can also support novel clinical studies of this drug in human plasma.
1. Introduction
High-Performance Liquid Chromatography (HPLC) combined with ultraviolet/visible (UV/Vis) or diode array detection (DAD) is routinely used in R&D facilities around the world. This technique is extremely versatile, allowing for the simultaneous quantification of a large pool of compounds differing in chromophores and absorption maxima in the UV-Vis range. Additionally, HPLC-DAD also provides structural information, giving insights into peak purity and identification. Notwithstanding, UV-Vis-based detection may not guarantee high sensitivity for bioanalytical studies, in which lower limits of quantification are required. On the contrary, fluorescence is a cost-affordable technique that takes advantage of the light emitted by a certain compound following electron excitation at certain wavelengths. This can be observed in intrinsic fluorescent molecules or upon derivatization (e.g., o-phthalaldehyde (OPA) reacts with primary amines and forms fluorescent isoindole derivatives). As the fluorescent signals are usually stronger, FLD lowers the limits of quantification of a chromatographic technique, bringing them closer to those of LC with mass spectrometry.
Pitavastatin is a synthetic 3-hydroxy-3-methyl glutaryl coenzyme A (HMG-CoA) reductase inhibitor prescribed to treat hyperlipidemia. There is increasing evidence that expands the therapeutic effect of this statin to several other diseases: these pleiotropic effects range from decreasing inflammation and oxidative stress to improving endothelial function, regulating angiogenesis and osteogenesis, and reducing tumor progression [1].
There are only a limited number of chromatographic methods for quantifying pitavastatin concentrations in human plasma, with the majority relying on mass detection [2,3,4,5]. One method involves the use of UV [6], and two others involve the use of fluorescence detection [7,8]. Concerning the latter, Ojha et al. used 1 mL of human plasma, liquid–liquid extraction, and an injection volume of 85 µL, while Zhou and colleagues used 100 µL of plasma, protein precipitation, and a 50 µL injection volume but no internal standard.
This work focuses on the development of an HPLC-FLD method for the quantification of pitavastatin in human plasma samples, allowing for therapeutic drug monitoring and supporting future clinical and preclinical studies of this statin.
2. Materials and Methods
2.1. Chemicals and Reagents
Pitavastatin calcium (CAS number: 147526-32-7) and atorvastatin calcium (CAS number: 134523-03-8) were kindly supplied by Hovione (Loures, Portugal) and the Tecnimede Group (Sintra, Portugal), respectively. The different drugs used for the specificity study were of analytical or HPLC grade. Acetonitrile and methanol (HPLC gradient grade) and glacial acetic acid were purchased from Honeywell and Carlo Erba Reagents (Milan, Italy), respectively. Water was ultrapurified (Ω = 18.2 MΩ.cm, TOC < 1.5 µg/L) and filtered (0.22 µm) before use (Sartorius Arium Pro, Gottingen, Germany). Human plasma was collected from healthy non-treated donors (supplied by the Centro de Sangue e da Transplantação de Coimbra, Portugal) and stored at −20 °C.
2.2. Chromatographic Equipment and Conditions
Pitavastatin was quantified using a Shimadzu Prominence Modular system equipped with a quaternary pump, an autosampler, an oven, and two sequential detectors: SPD-M20A for UV/Vis (photodiode array) and RF-20A XS for fluorescence detection. Analyte separation was conducted using a LiChroCART® Purospher Star reversed-phase column with a particle size of 3 µm, a 4 mm internal diameter, and length of 55 mm (Merck KGaA, Darmstadt, Germany). The analysis was performed using acetic acid (2% v/v)/methanol in gradient mode at 1 mL/min and 35 °C under the following conditions: 4 min (55:45), 8 min (35:65), 12 min (35:65), 15 min (55:45), and 20 min (55:45). Analyte detection was set at λex = 257 nm and λem = 421 nm for fluorescence and λmax = 250 nm for UV/Vis.
2.3. Preparation of Solutions, Calibration Standards, and Quality Control Samples
Stock solutions of each statin were prepared in methanol (1 mg/mL). Pitavastatin working solutions were then prepared via dilution at different concentrations: 0.03, 0.06, 1, 3, 6, and 9 µg/mL. Quality control (QC) solutions were prepared independently at the lower limit of quantification- (QCLLOQ), low- (QC1), medium- (QC2), and high- (QC3)-concentration levels: 0.03, 0.09, 4.5 and 7.5 µg/mL, respectively. The atorvastatin working solution was prepared at 50 µg/mL.
2.4. Sample Preparation and Extraction Procedure
Each aliquot (90 µL) of plasma was spiked with 10 µL of a working/QC solution and IS. Following the addition of 200 µL of acetonitrile, samples were vortexed for 2.5 min and centrifuged at 14,000 rpm and 4 °C. The supernatant was then filtered through a PTFE membrane (0.22 µm) before HPLC quantification.
2.5. Method Validation
The chromatographic method was validated according to the ICH M10 guideline on bioanalytical method validation and study sample analysis [9].
2.5.1. Selectivity and Specificity
Selectivity and specificity were evaluated through the analysis of blank and spiked chromatograms from six different plasma donors in terms of potential interferents at the retention times of the statins. A pool of thirty approved drugs in the clinic, potentially co-administered, were also inspected under the optimized chromatographic conditions.
2.5.2. Linearity
Calibration standards were prepared daily for six days using six plasma samples spiked with the working calibration and IS solutions. The peak area ratio between pitavastatin and atorvastatin was plotted against the corresponding nominal plasma concentrations. Data heteroscedasticity was corrected using the weighting factor with the lowest sum of absolute error amongst all the standards.
2.5.3. Accuracy and Precision
Accuracy and precision were evaluated at the intra- and inter-day levels by analyzing six replicates of each QC sample on a single day as well as on three consecutive days, respectively. The acceptance criteria were defined at a bias ≤ 15% and coefficient of variation (CV) ≤ 15% for QC1, QC2, and QC3 and a bias ≤ 20% and CV ≤ 20% for QCLLOQ.
2.5.4. Recovery and Carryover
The recovery of each statin from the matrix was determined in six samples at each QC level by comparing the concentrations from extracted samples with the equivalent extracts from post-extraction spiked samples. Carryover was inspected through the injection of blank samples after the injection of the calibration standard of the upper limit of quantification and considering the 5% and 20% limits for IS and LLOQ, respectively.
2.5.5. Stability
Sample stability (spiked plasma and processed samples) was assessed in six replicates at the different quality control levels (QCLLOQ, QC1, QC2, and QC3) under four different experimental conditions, mimicking sample handling and storage time during the analyses.
3. Results and Discussion
3.1. Method Development
The chromatographic method discussed herein was developed to quantify pitavastatin levels in human plasma. For that reason, an internal standard was introduced to guarantee the reproducibility of sample preparation. A gradient elution was implemented and refined to reduce the analysis time without compromising any chromatographic parameters (peak symmetry, retention, and resolution) due to the distinct behavior under isocratic conditions of both statins while using acetic acid (2% v/v) and methanol. Under the optimized conditions, pitavastatin elutes at 5.62 min while atorvastatin elutes at 13.65 min in a 20 min analysis.
3.2. Method Sensitivity
The detection of pitavastatin was optimized in terms of signal intensity (peak area) at the maximum experimental wavelengths (λex = 257 nm and λem = 421 nm for fluorescence and λmax = 250 nm for UV). For this, a total of four calibration curves were plotted through simple linear regression in spiked plasma samples (Figure 1A). Overall, FLD allowed for a peak area gain ranging from 54 to 70 as well as substantially lower limits of detection and quantification (0.003 vs. 0.100 µg/mL). The reference plasma concentrations for pitavastatin range from 0.031–0.081 µg/mL, thus highlighting the relevance of the FLD method [10].
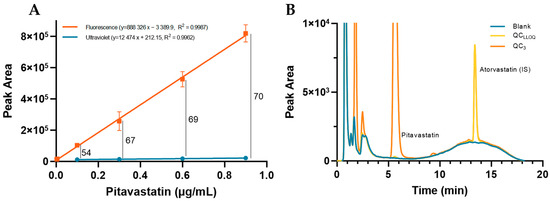
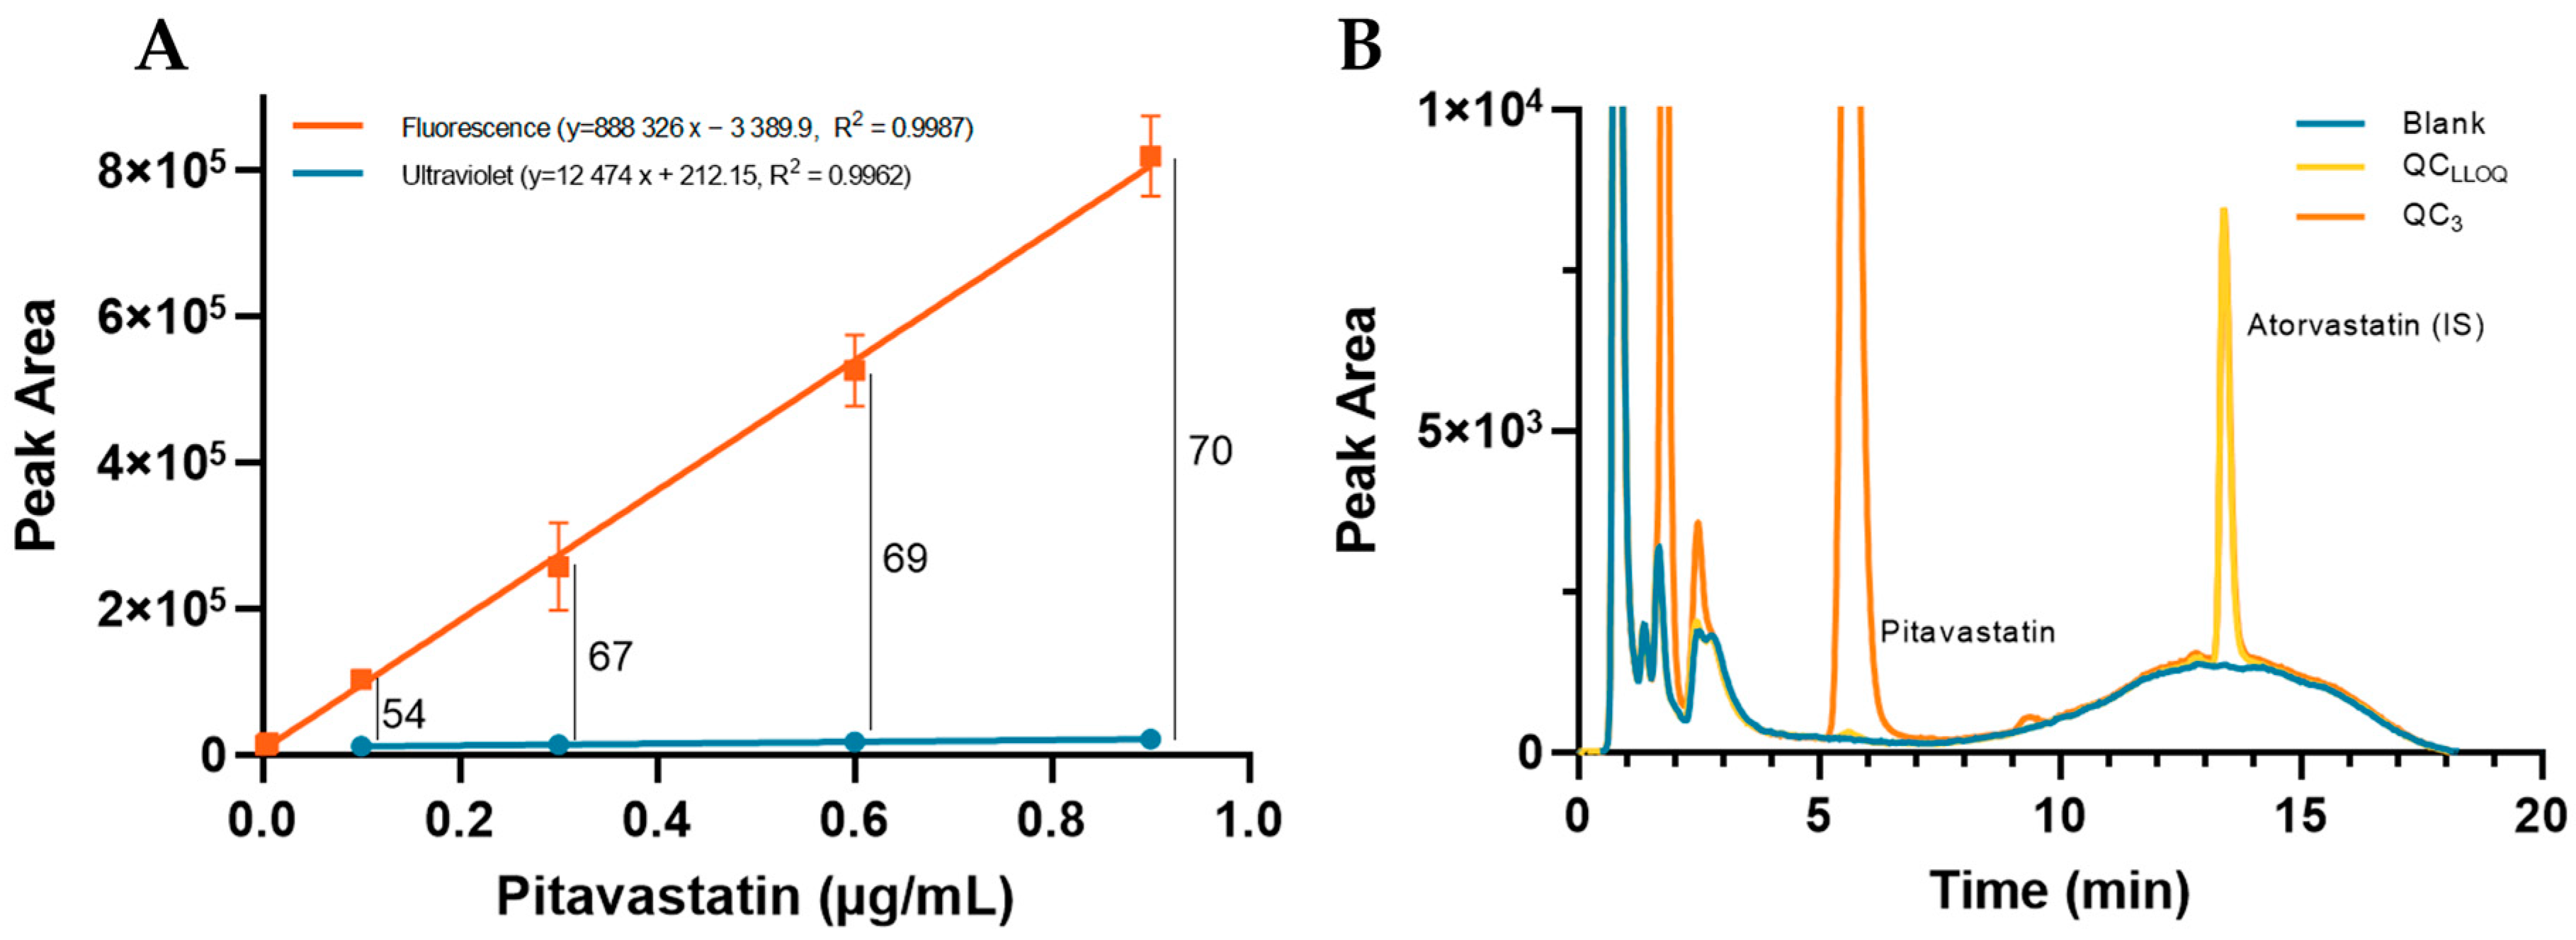
Figure 1.
(A) Sensitivity between fluorescence and photodiode array detection for pitavastatin (0.003 to 0.9 µg/mL); (B) Representative chromatogram of blank and spiked plasma samples, showing absence of peaks at the retention time of pitavastatin and atorvastatin in the former one.
3.3. Selectivity and Specificity
Selectivity was evaluated through the visual comparison of six blank plasma samples of different donors with spiked samples (QCLLOQ and QC3). No interferents were found at the retention times of pitavastatin and IS (Figure 1B). Furthermore, the method was applied to a pool of thirty different drugs commonly used in clinics to infer potential peaks that may impair the quantification of an analyte. Several compounds can be detected under the optimized conditions, displaying different retention times (Table 1). However, there are no drugs that co-elute with pitavastatin or IS, thereby guaranteeing specificity and supporting the potential use of this method in the clinic.

Table 1.
Method specificity analysis considering thirty commonly prescribed drugs in a clinical setting.
3.4. Linearity
Despite being linear, there was a significant variance within the calibration standards due to the wide range of the curve. Larger deviations at higher concentrations have a profound impact on the regression line, thus decreasing accuracy for the lower concentration levels. The calibration curves were corrected using different weighting factors, with 1/x2 resulting in the lowest sum of absolute error (380.0 (1/x2) vs. 393.7 (1/x); 396.6 (1/y2); 399.9 (1/y); 455.2 (1/√y); 457.2 (1/√x); and 866.8 (non-corrected)). This method was observed to be linear over the range of 0.003–0.9 µg/mL, with [Pita] = 8.439 peak area ratio + 0.024 and R2 = 0.998.
3.5. Accuracy and Precision
Data obtained from the intra- and inter-day accuracy and precision for QCLLOQ, QC1, QC2, and QC3 are reported in Table 2. For all the QC levels, the accuracy ranged from −6.7 to 5.97%, and the precision varied between 0.88 and 9.63%. All these results are in agreement with the ICH M10 guideline, confirming this method is both accurate and precise in quantifying pitavastatin in human plasma.
Table 2.
Intraday and inter-day accuracy and precision.
3.6. Recovery and Carryover
The absolute recovery values of pitavastatin were found to be 94.5 ± 10.7% (QCLLOQ), 94.9 ± 3.8% (QC1), 96.1 ± 1.2% (QC2), and 100.7 ± 5.3% (QC3) (n = 6). The absolute recovery for the IS was found to be 99.7 ± 4.7% (n = 18). This can be explained by the simple sample preparation step, in which the statins were fully released from the plasma sample and injected into the chromatographic system. No carryover effect was noted in the consecutive injections of blank samples following the injection of an ULOQ sample in terms of peaks at the retention times of the statins.
3.7. Stability
Sample stability was evaluated using spiked plasma samples as well as processed ones under four different conditions (spiked plasma: room temperature, 4 h, and −80 °C for 15 days; processed: autosampler, 24 h, and −20 °C for 7 days). No stability concerns were raised for both pitavastatin and the IS, as accuracy and precision were <15% for all QC levels (Table 3).
Table 3.
Stability studies on quality control samples (n = 6) in different conditions.
4. Conclusions
A highly sensitive and accurate HPLC-FLD method for pitavastatin quantification was developed and fully validated, allowing for the quantification of this statin in human plasma. The separation of pitavastatin and the internal standard (atorvastatin) was achieved after single-step protein precipitation with centrifugation and filtration. The quantification of pitavastatin via HPLC highly benefits from fluorescence detection: a 54-70-fold increase in peak area was achieved in comparison to a standard UV determination. Consequently, there was a remarkable reduction in the limit of quantification, i.e., from 0.100 (HPLC-UV/Vis) to 0.003 µg/mL, without compromising the accuracy and precision of the results. This method can be used to monitor plasma levels of pitavastatin in clinics and as the basis for novel clinical and preclinical studies involving this drug.
Author Contributions
Conceptualization, J.B. and C.V.; methodology, J.B., A.F. and C.V.; software, J.B.; validation, J.B. and C.V.; formal analysis, J.B., A.F. and C.V.; investigation, J.B.; data curation, J.B.; writing—original draft preparation, J.B.; writing—review and editing, A.F., R.V. and C.V.; visualization, J.B.; supervision, A.F., R.V. and C.V.; funding acquisition, and C.V. All authors have read and agreed to the published version of the manuscript.
Funding
This research was funded by the Portuguese Foundation for Science and Technology (FCT); the European Union; QREN, FEDER, COMPETE, and PIDDAC under iBiMED (UIDB/04501/2020, POCI-01-0145-FEDER-007628); Cardiovascular Research Unit (UID/IC/00051/2019); the projects LAQV-REQUIMTE (UIDB/50006/2020) and CENTRO-01-0145-FEDER-03075; and the Coimbra Chemistry Center, CQC (UID/QUI/00313/2020). Rui Vitorino and João Basso also acknowledge FCT for the individual fellowship grant (IF/00286/2015) and Ph.D. research grant (SFRH/BD/149138/2019), respectively.
Institutional Review Board Statement
Not applicable.
Informed Consent Statement
Not applicable.
Data Availability Statement
All data generated and analyzed are included in the published article and can be provided upon reasonable request by the corresponding author, C.V.
Conflicts of Interest
The authors declare no conflict of interest.
References
- Sahebkar, A.; Kiaie, N.; Gorabi, A.M.; Mannarino, M.R.; Bianconi, V.; Jamialahmadi, T.; Pirro, M.; Banach, M. A comprehensive review on the lipid and pleiotropic effects of pitavastatin. Prog. Lipid Res. 2021, 84, 101127. [Google Scholar] [PubMed]
- Lv, H.; Sun, J.G.; Wang, G.J.; Zhu, X.Y.; Zhang, Y.; Gu, S.H.; Liang, Y.; Sun, J. Determination of pitavastatin in human plasma via HPLC-ESI-MS/MS and subsequent application to a clinical study in healthy Chinese volunteers. Clin. Chim. Acta 2007, 386, 25–30. [Google Scholar] [PubMed]
- Chen, Y.; Zhang, W.; Huang, W.H.; Tan, Z.R.; Wang, Y.C.; Huang, X.; Zhou, H.H. Effect of a single-dose rifampin on the pharmacokinetics of pitavastatin in healthy volunteers. Eur. J. Clin. Pharmacol. 2013, 69, 1933–1938. [Google Scholar] [CrossRef] [PubMed]
- Scherf-Clavel, O.; Kinzig, M.; Stoffel, M.S.; Fuhr, U.; Sörgel, F. Quantification of adefovir and pitavastatin in human plasma and urine by LC-MS/MS: A useful tool for drug-drug interaction studies. J. Chromatogr. B 2019, 1125, 121718. [Google Scholar] [CrossRef] [PubMed]
- Wagmann, L.; Hemmer, S.; Caspar, A.T.; Meyer, M.R. Method development for quantitative determination of seven statins including four active metabolites by means of high-resolution tandem mass spectrometry applicable for adherence testing and therapeutic drug monitoring. Clin. Chem. Lab. Med. (CCLM) 2020, 58, 664–672. [Google Scholar] [CrossRef] [PubMed]
- Kojima, J.; Fujino, H.; Yosimura, M.; Morikawa, H.; Kimata, H. Simultaneous determination of NK-104 and its lactone in biological samples by column-switching high-performance liquid chromatography with ultraviolet detection. J. Chromatogr. B Biomed. Sci. Appl. 1999, 724, 173–180. [Google Scholar] [CrossRef] [PubMed]
- Ashwini, O.J.; Guttikar, S.; Vayeda, C.; Harish, P.A. Determination of pitavastatin from human plasma using high performance liquid chromatography with fluorescence detection. Chin. J. Chromatogr. 2007, 25, 715–718. [Google Scholar]
- Zhou, Q.; Chen, Q.X.; Ruan, Z.R.; Yuan, H.; Xu, H.M.; Zeng, S. CYP2C9* 3 (1075A > C), ABCB1 and SLCO1B1 genetic polymorphisms and gender are determinants of inter-subject variability in pitavastatin pharmacokinetics. Die Pharm.-Int. J. Pharm. Sci. 2013, 68, 187–194. [Google Scholar]
- European Medicines Agency. ICH Guideline M10 on Bioanalytical Method Validation and Study Sample Analysis; European Medicines Agency: Amsterdam, The Netherlands, 2022. [Google Scholar]
- Baselt, R.C.; Cravey, R.H. Disposition of Toxic Drugs and Chemicals in Man, 11th ed.; Biomedical Publications: Seal Beach, CA, USA, 2018. [Google Scholar]
Disclaimer/Publisher’s Note: The statements, opinions and data contained in all publications are solely those of the individual author(s) and contributor(s) and not of MDPI and/or the editor(s). MDPI and/or the editor(s) disclaim responsibility for any injury to people or property resulting from any ideas, methods, instructions or products referred to in the content. |
© 2023 by the authors. Licensee MDPI, Basel, Switzerland. This article is an open access article distributed under the terms and conditions of the Creative Commons Attribution (CC BY) license (https://creativecommons.org/licenses/by/4.0/).