Proceeding Paper

Sensor Device for Contactless Chemical Analysis Based on High-Frequency Inductance Coil †

1
Institute of Chemistry, St. Petersburg University, 198504 St. Petersburg, Russia
2
Laboratory of Alternative Antimicrobial Biopreparations, World-Class Research Center “Center for Personalized Medicine”, FSBSI Institute of Experimental Medicine, 197376 St. Petersburg, Russia
3
Laboratory of Peptide Chemistry, Institute of Human Hygiene, Occupational Pathology and Ecology, 188663 St. Petersburg, Russia
4
Institute for Analytical Instrumentation RAS, 198095 St. Petersburg, Russia
*
Author to whom correspondence should be addressed.
Presented at the 2nd International Electronic Conference on Chemical Sensors and Analytical Chemistry, 16–30 September 2023; Available online: https://csac2023.sciforum.net/.
Eng. Proc. 2023, 48(1), 42; https://doi.org/10.3390/CSAC2023-14886
Published: 18 September 2023

Abstract

:
In this work, we explore the analytical potential of a simple inexpensive sensor device based on the evolution of the high-frequency contactless conductometry method. This method was developed in the middle of the 20th century as one of the options to assess the electrical conductivity of samples, and it employed electrical signals registered at a specific, single AC frequency. The method did not find a wide application since the analytical signal in the developed systems was a complex function of many factors (sample conductivity, capacitive characteristics, dielectric permittivity, and magnetic properties), which was difficult to be mathematically processed. We came back to this technology with the following in mind: (1) modern electronic components enable the design of such measuring devices in a very-low-cost manner and allow registering the response signal in a whole range of AC frequencies; (2) the application of modern machine learning tools to process these signals allows for the extraction of qualitative and quantitative information about the samples. It was found that the detector has numerous capabilities such as the quantification of inorganic salts in individual aqueous solutions and in complex mixtures, the quantification of dielectric constants of organic solvents, and distinguishing the cultures of various bacteria and cancer cells.

1. Introduction

An urgent task of modern analytical chemistry is the development of simple and inexpensive devices for the analysis of real objects in non-laboratory conditions. Such devices are in demand in the chemical control of technological process, in environmental monitoring, and for the detection of drugs or explosive substances. In this way, the methods that allow for contactless and on-line analysis are preferred. A promising direction is the search for physical principles, initially oriented towards the creation of simple and inexpensive devices through electrical measurements. A high-frequency, non-contact conductometry method was developed in the middle of the 20th century [1]. The devices operate in the megahertz frequency region; the sensor response is recorded at one particular frequency. When the electrical signal is registered in the high-frequency region, the sensor response depends not only on the conductivity of the solution, as the classical conductometry does. The registered electrical signal depends, in a complex way, on the sample conductivity, dielectric constant, magnetic properties, and capacitance in the high-frequency contactless conductometry method. Thus, such devices are only applicable for conductometric titration, where the inductance coil is wound on a burette [2]. Due to the difficulty in interpreting the analytical signal, the method has not been widely used.
However, the modern component bases of electronics make it very easy to design such devices and make them very cheap, and they allow for the registration of the analytical signal in the whole spectrum of frequencies. We hypothesized that by processing such spectra (where the signal is registered at different frequencies of electric current) using chemometric methods, we will be able to obtain important analytical information about the samples used.

2. Methods

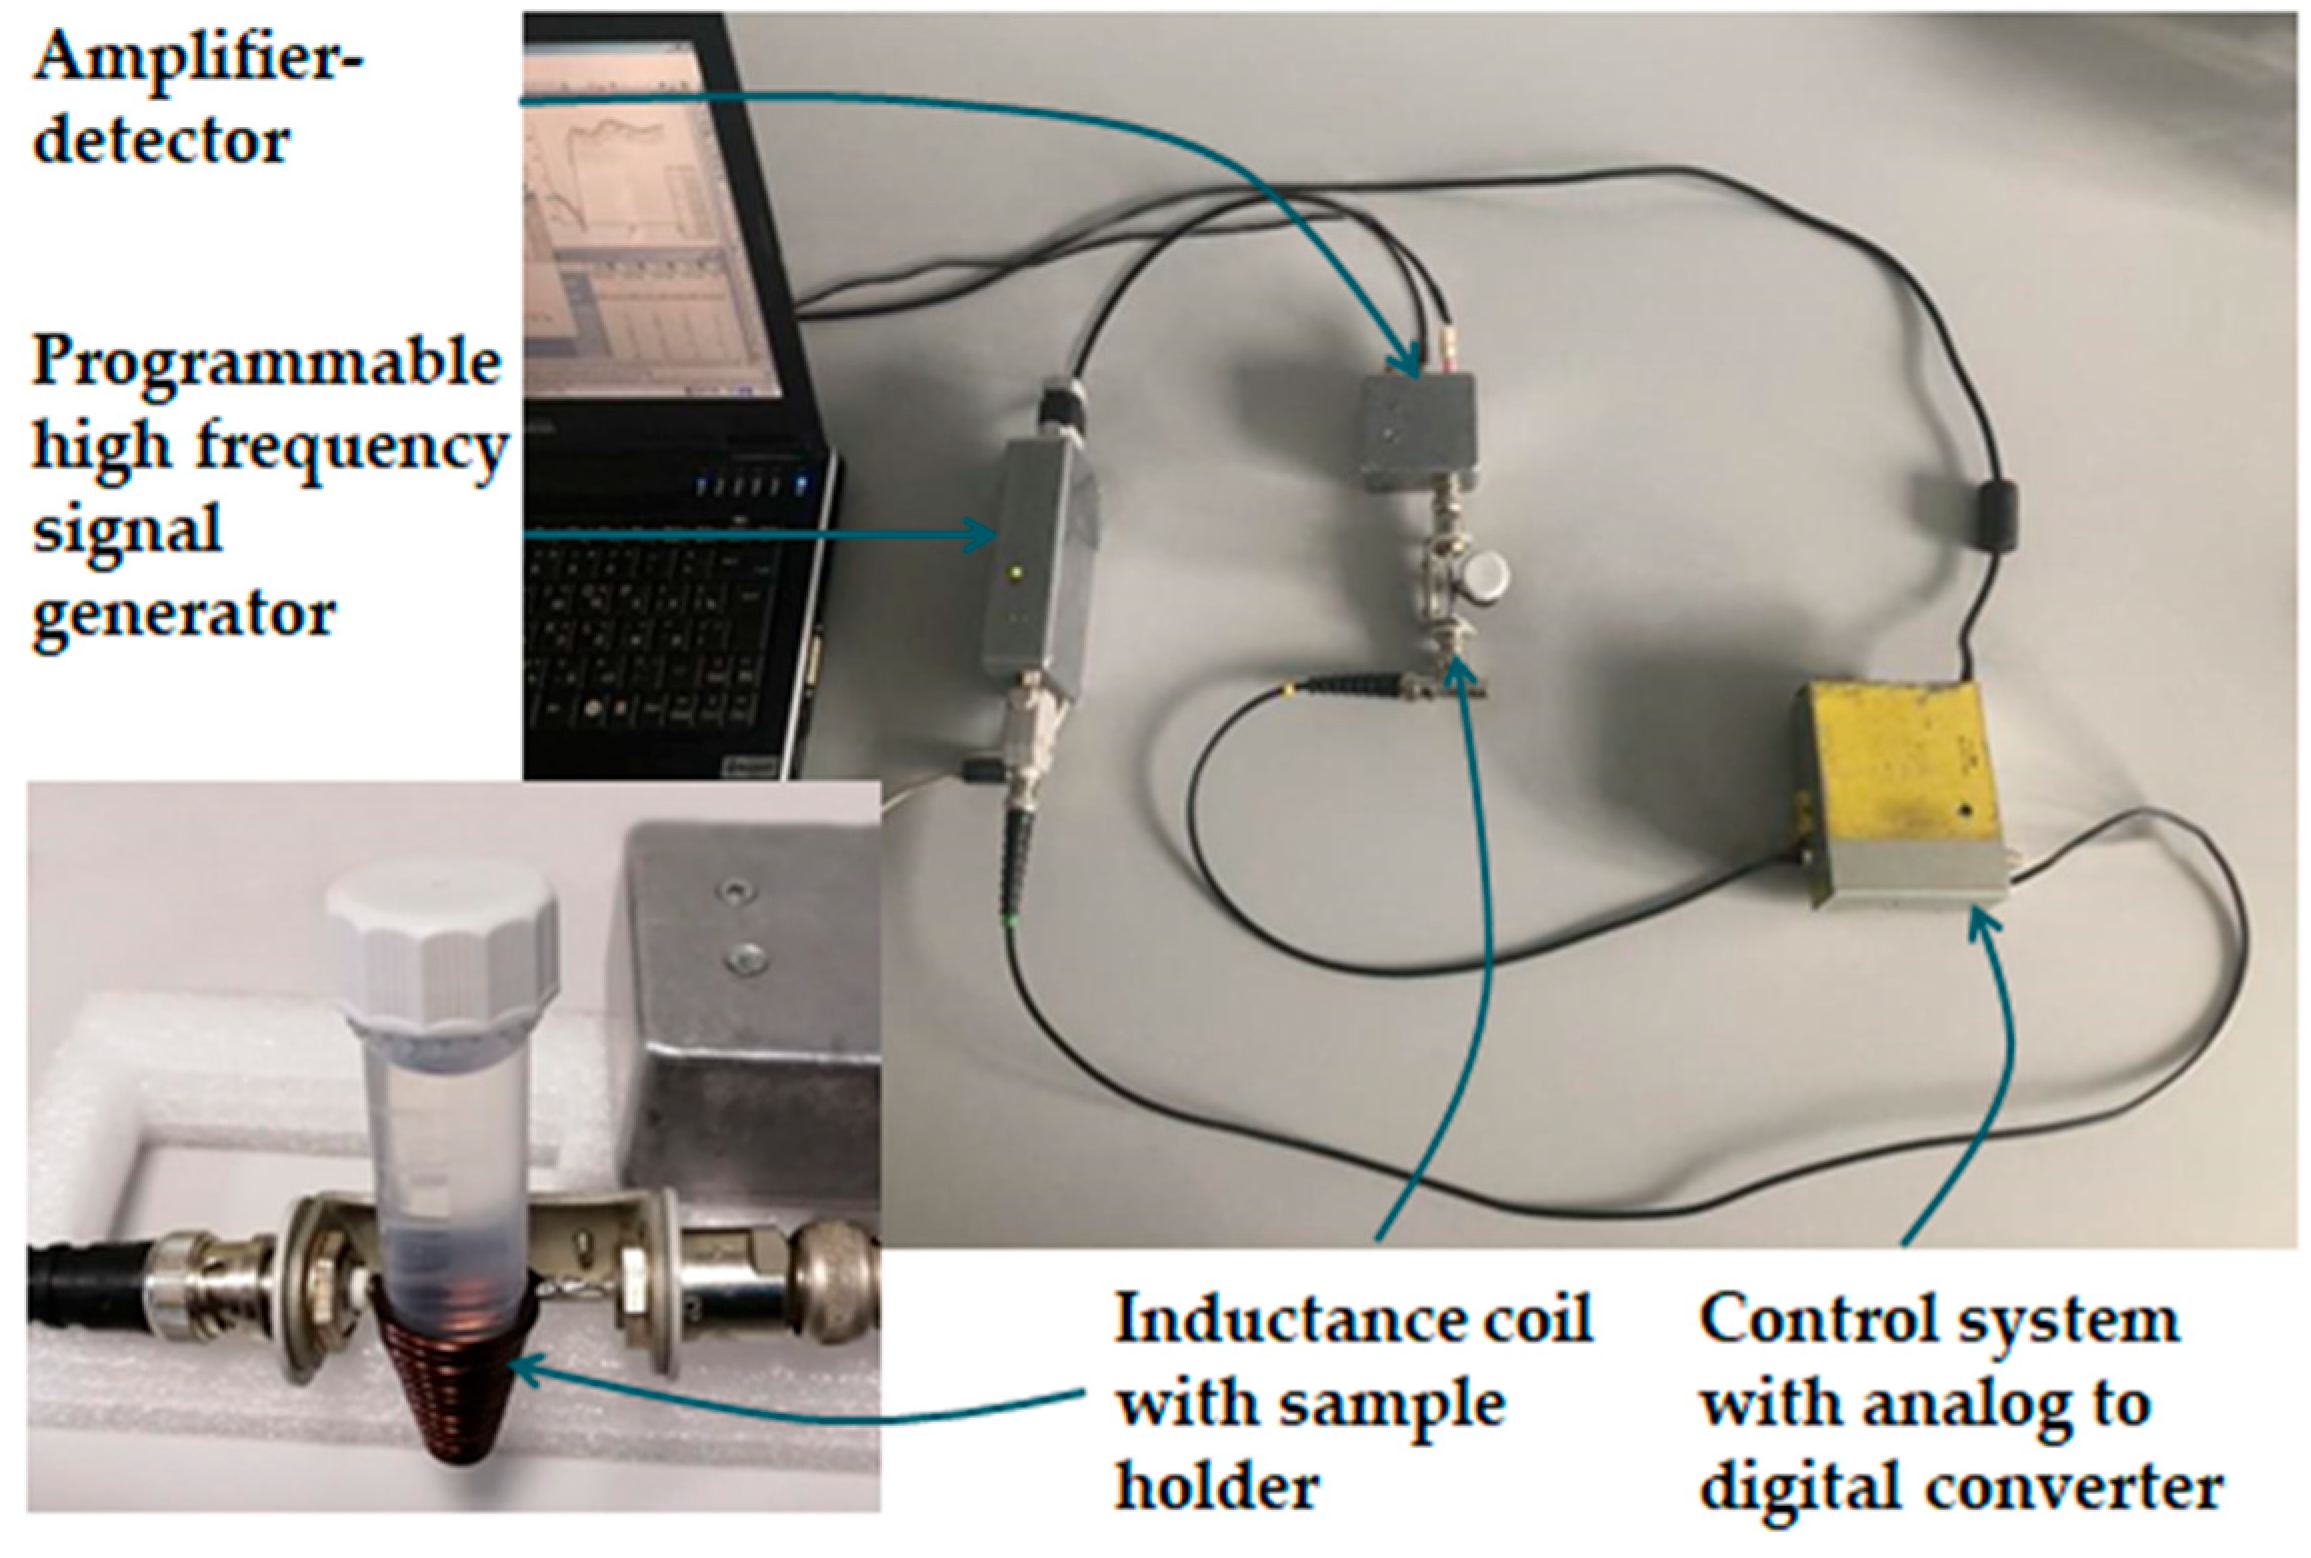
2.1. Measuring Device

We constructed a measuring device according to the proposed methodology. The visual appearance of the sensor is shown in Figure 1. The operating principle of the detector is as follows. First, the signal generator produces a sinusoidal alternating current in the frequency range of 2−112 MHz. Then, when a sample is introduced inside the coil, it becomes the core of the inductor, changing the properties of the electrical signal flowing through the coil. A receiver connected to the coil registers these changes, which depend on the properties of the sample (in particular, on the dielectric permittivity and conductivity of the sample) and can serve as a source of information for qualitative and quantitative analysis. The coil winding shape matches the shape of the bottom of the test tube, and the signal acquisition time is less than 100 ms. All measurements were performed in 5 mL Eppendorf centrifuge conical-bottom tubes with caps. The amount of sample in the tube ranged from 2 to 5 mL; this is enough to ensure that the upper level of the liquid is above the upper coil winding.
More detailed information about the measurement setup and data processing can be found in [3].

2.2. Samples

To study the features of the proposed sensor device, different types of samples were tested. These were aqueous solutions of inorganic salts, organic solvents, complex multicomponent solutions, and the cultures of various bacteria and cancer cells.
Pro-analysis-grade Ni(NO3)2 and KCl were procured from Sigma Aldrich (Steinheim, Germany). NH4NO3, AcOH, and NH4OH were obtained from “LenReaktiv” (St. Petersburg, Russia) in the highest available purity grade. Aqueous solutions of inorganic salts in 1 mol/L concentrations were prepared using weighting methods. Less concentrated solutions were prepared through the sequential dilution of the parent ones. Bidistilled water was used throughout the experiments. Acetonitrile, dimethylformamide, ethanol, acetone, 1,2-dichloroethane, tetrahydrofurane, chloroform, carbon tetrachloride, toluene, benzene, and hexane were obtained from JSVC Vekton (St. Petersburg, Russia) in the highest available purity grade and were used without further purification [3].
The preparation procedure of the complex mixtures containing NH4NO3, NH4OH, and AcOH was the following. The content of the substances in the multicomponent mixture was calculated according to the calibration mixtures design reported in [4] to ensure the absence of correlations in the content of inorganic compounds. The concentration ranges were: C(AcOH): 0.064–0.216 mol/L, C(NH4NO3): 0.325–6.451 mol/L, and C(NH4OH): 0.044–0.548 mol/L. Nine mixtures were prepared in total; the content of inorganic compounds in these mixtures is presented in Table 1. The composition of the mixtures was chosen to mimic the technological solution composition in the hydrometallurgical process.
The details on the real samples are provided in [3].

3. Results and Discussion

The measurements for the described sensor device produce a spectrum for each specific sample. Figure 2 shows a general view of this spectrum. The frequency values are plotted along the abscissa axis, and the values of the received analytical signal for each specific frequency are plotted along the ordinate axis.

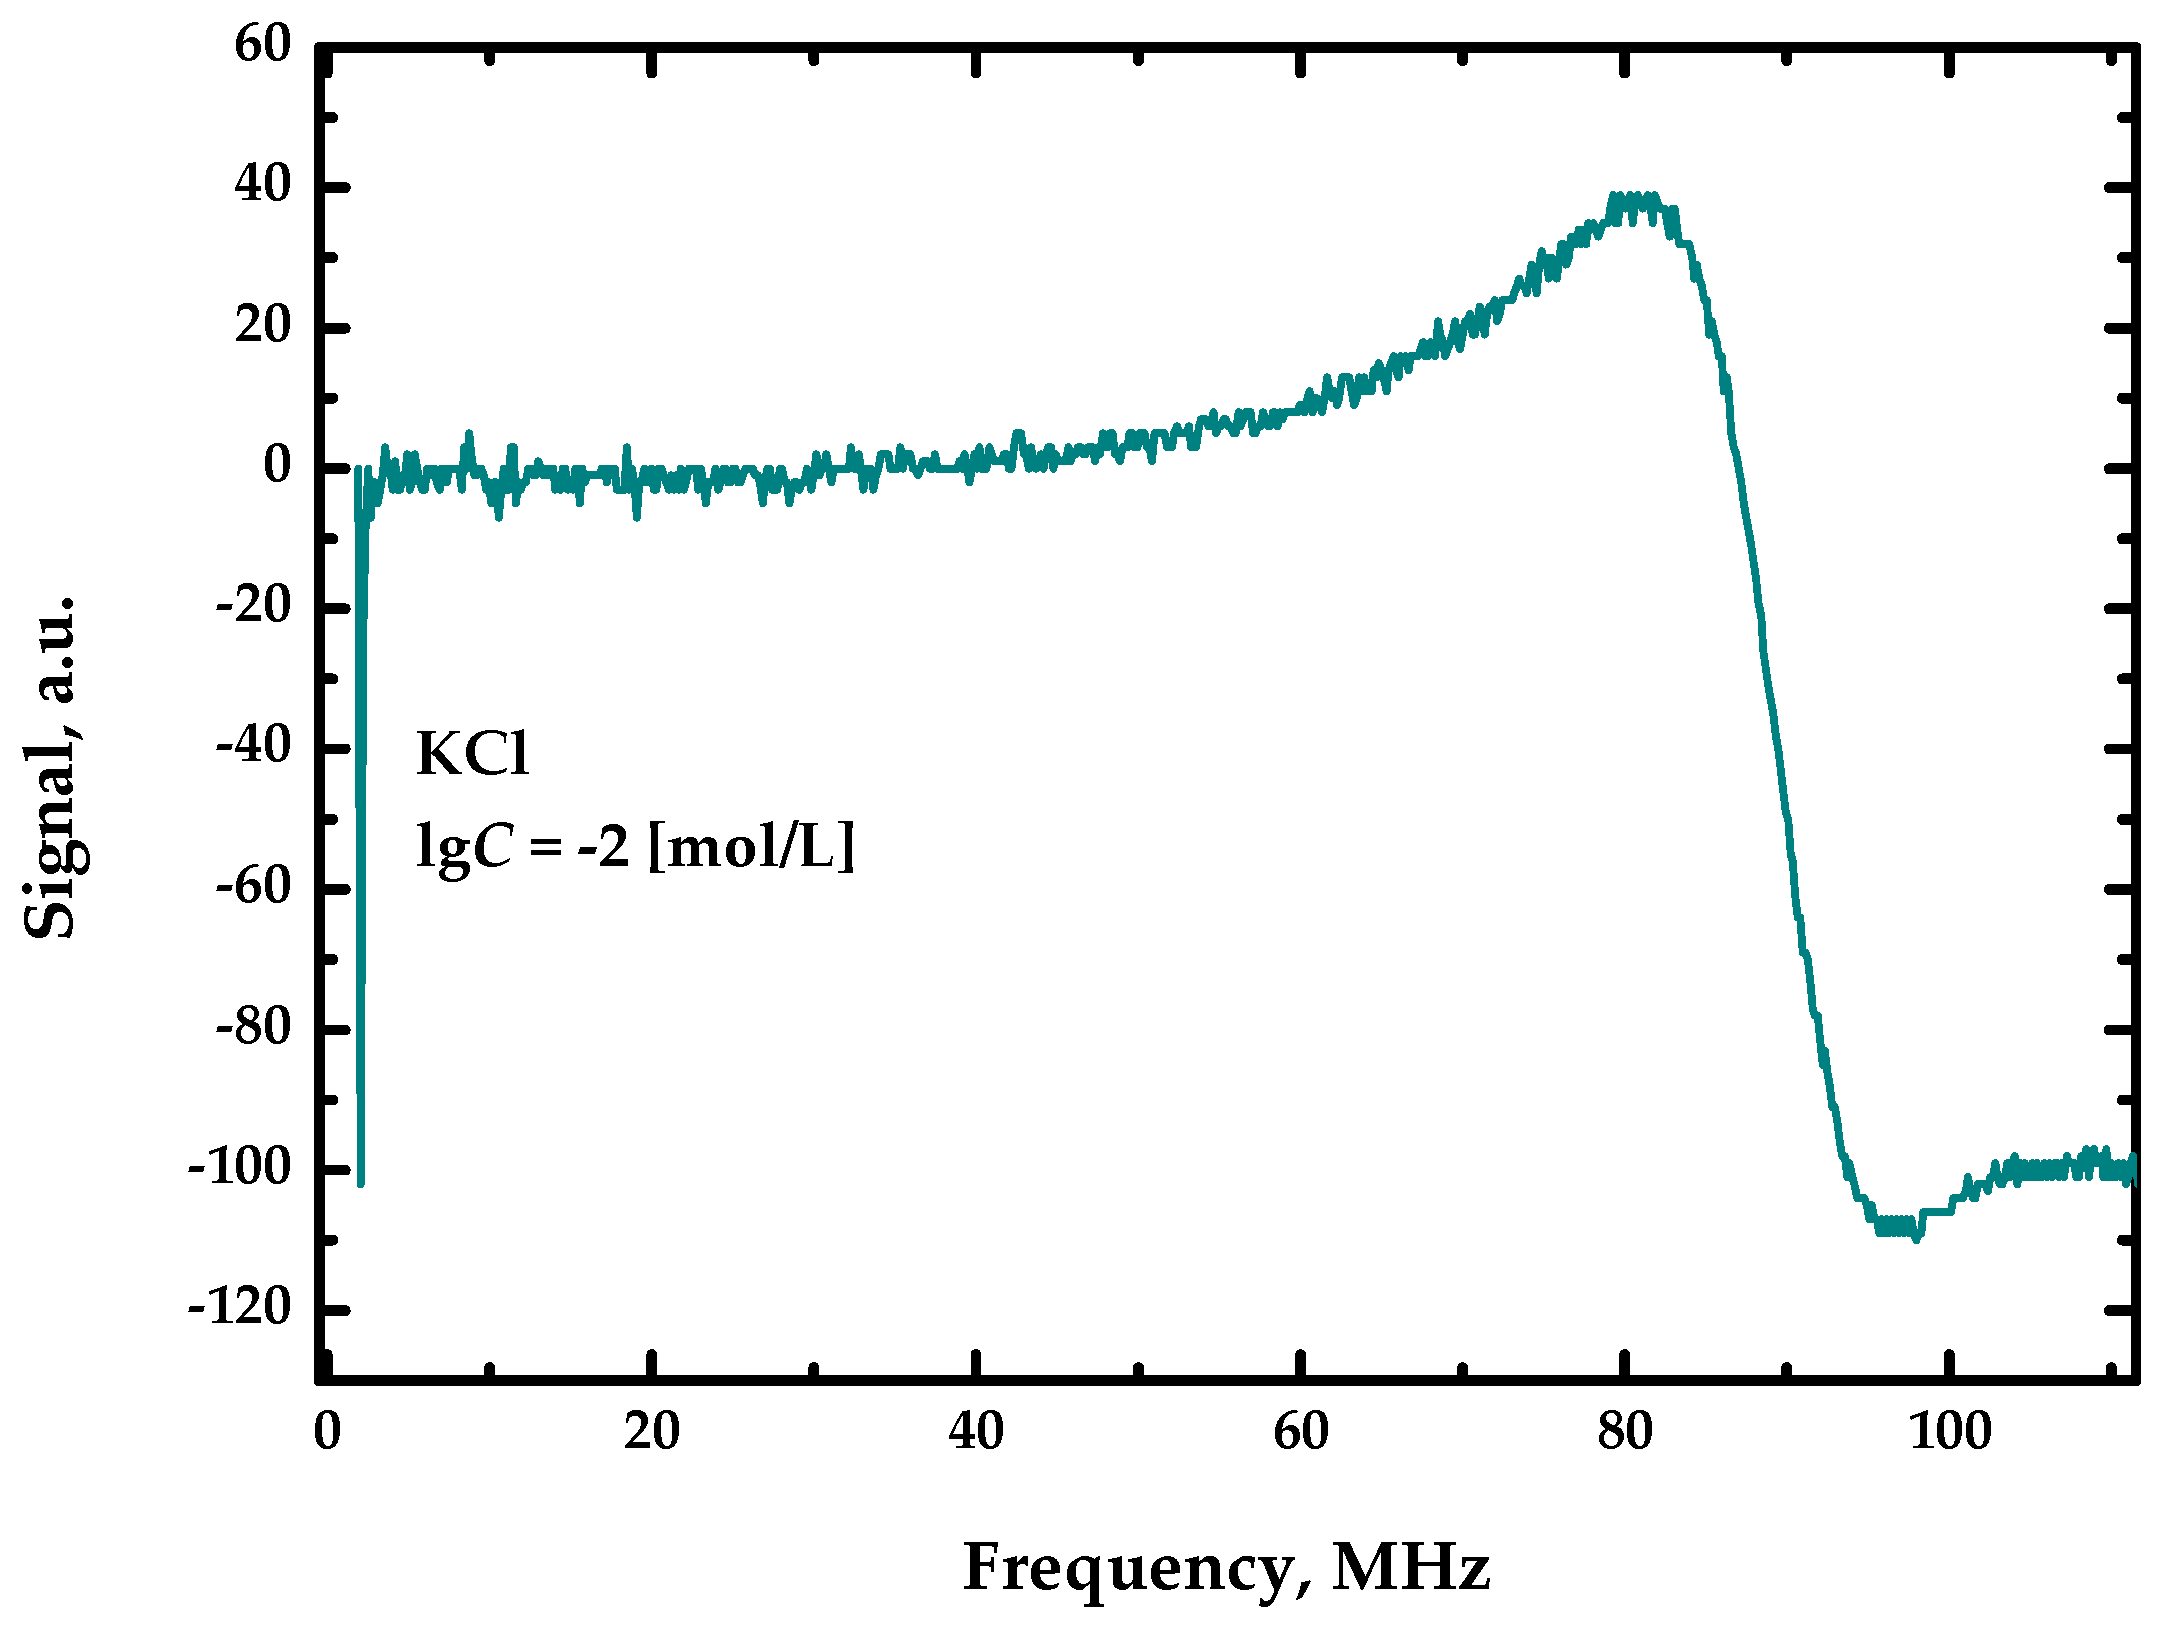
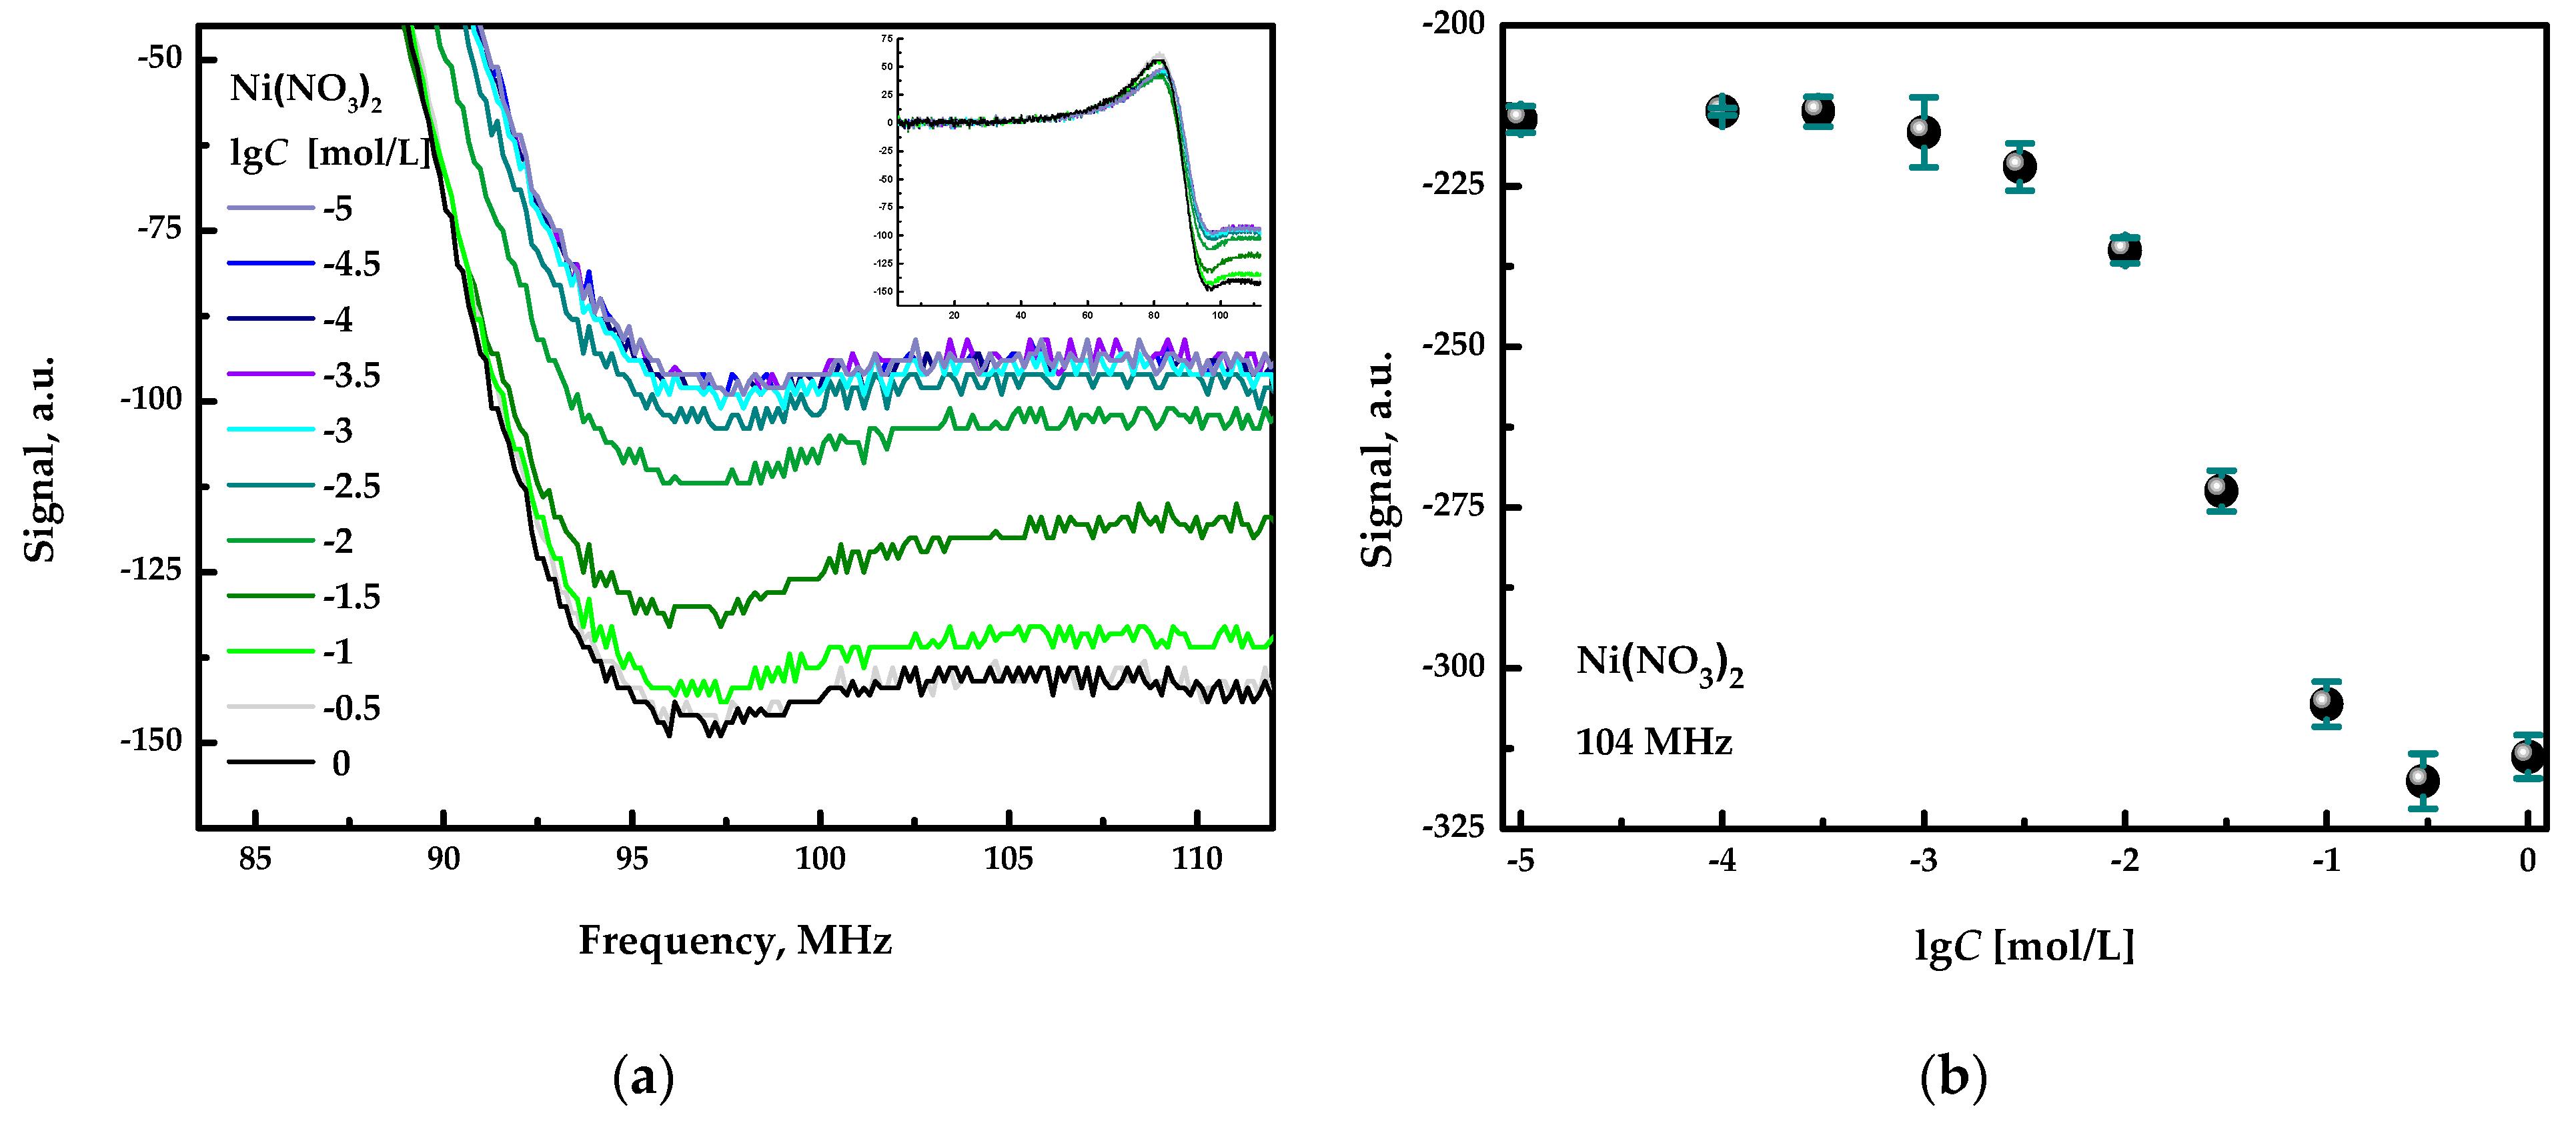
3.1. Quantification of Inorganic Salts

At first, the device was applied for the quantification of inorganic salts in individual aqueous solutions. Figure 3a shows the full spectra for Ni(NO3)2 at different concentrations (inset in the upper right corner of the plot) and the fragments of these spectra in the frequency range from 90 to 110 MHz. All spectra are similar in shape and differ in the signal intensity, depending on the salt concentration. Figure 3b shows the calibration plot obtained for nickel nitrate at the fixed signal acquisition frequency of 104 MHz. It can be seen that the detector provides a response in a broad concentration range, from approximately 10−3 mol/L to 10−1 mol/L, of a selected inorganic salt. Thus, the quantification of inorganic salts is possible in this concentration range. Examples of sensitivity to other salts can be found in [3].
At the next stage of the experiment, complex mixtures of NH4NO3, NH4OH, and AcOH were analyzed, since these mixtures are of interest for analysis in the technological hydrometallurgical process. Nine solutions were prepared and analyzed using the sensor. Partial least-squares regression (PLS) was employed to construct multivariate regression models for the quantification of particular inorganic compounds. In brief, PLS is a method of constructing a linear multivariate calibration model to correlate the matrix of the independent variable, X, with the matrix of a dependent variable, Y, by accounting for significant latent variables (LVs) and maximizing the covariance between X and Y [5]. In the context of this experiment, X is the response data matrix, i.e., a matrix consisting of analytical signal values at different frequencies; Y is a column vector containing the reference values of the measured parameter—the concentration of the inorganic compound.
Figure 4 demonstrates the “measured vs. predicted” plot for the resulting PLS model. The X-axis shows the measured C(NH4NO3) values, and the Y-axis shows the values calculated or predicted by the PLS model. The determination coefficient R2 and the root mean squared error of cross-validation (RMSECV) were employed as figures of merit to assess the model performance. It can be seen that R2 was 0.89 and RMSECV was 0.88 mol/L for this concentration range. This way, with the developed detector, we can quantify the concentration of NH4NO3 in the ternary mixture. It is noteworthy that the PLS models for the quantification of the two other components in these mixtures had unsatisfactory metrics unsuitable for practical applications.

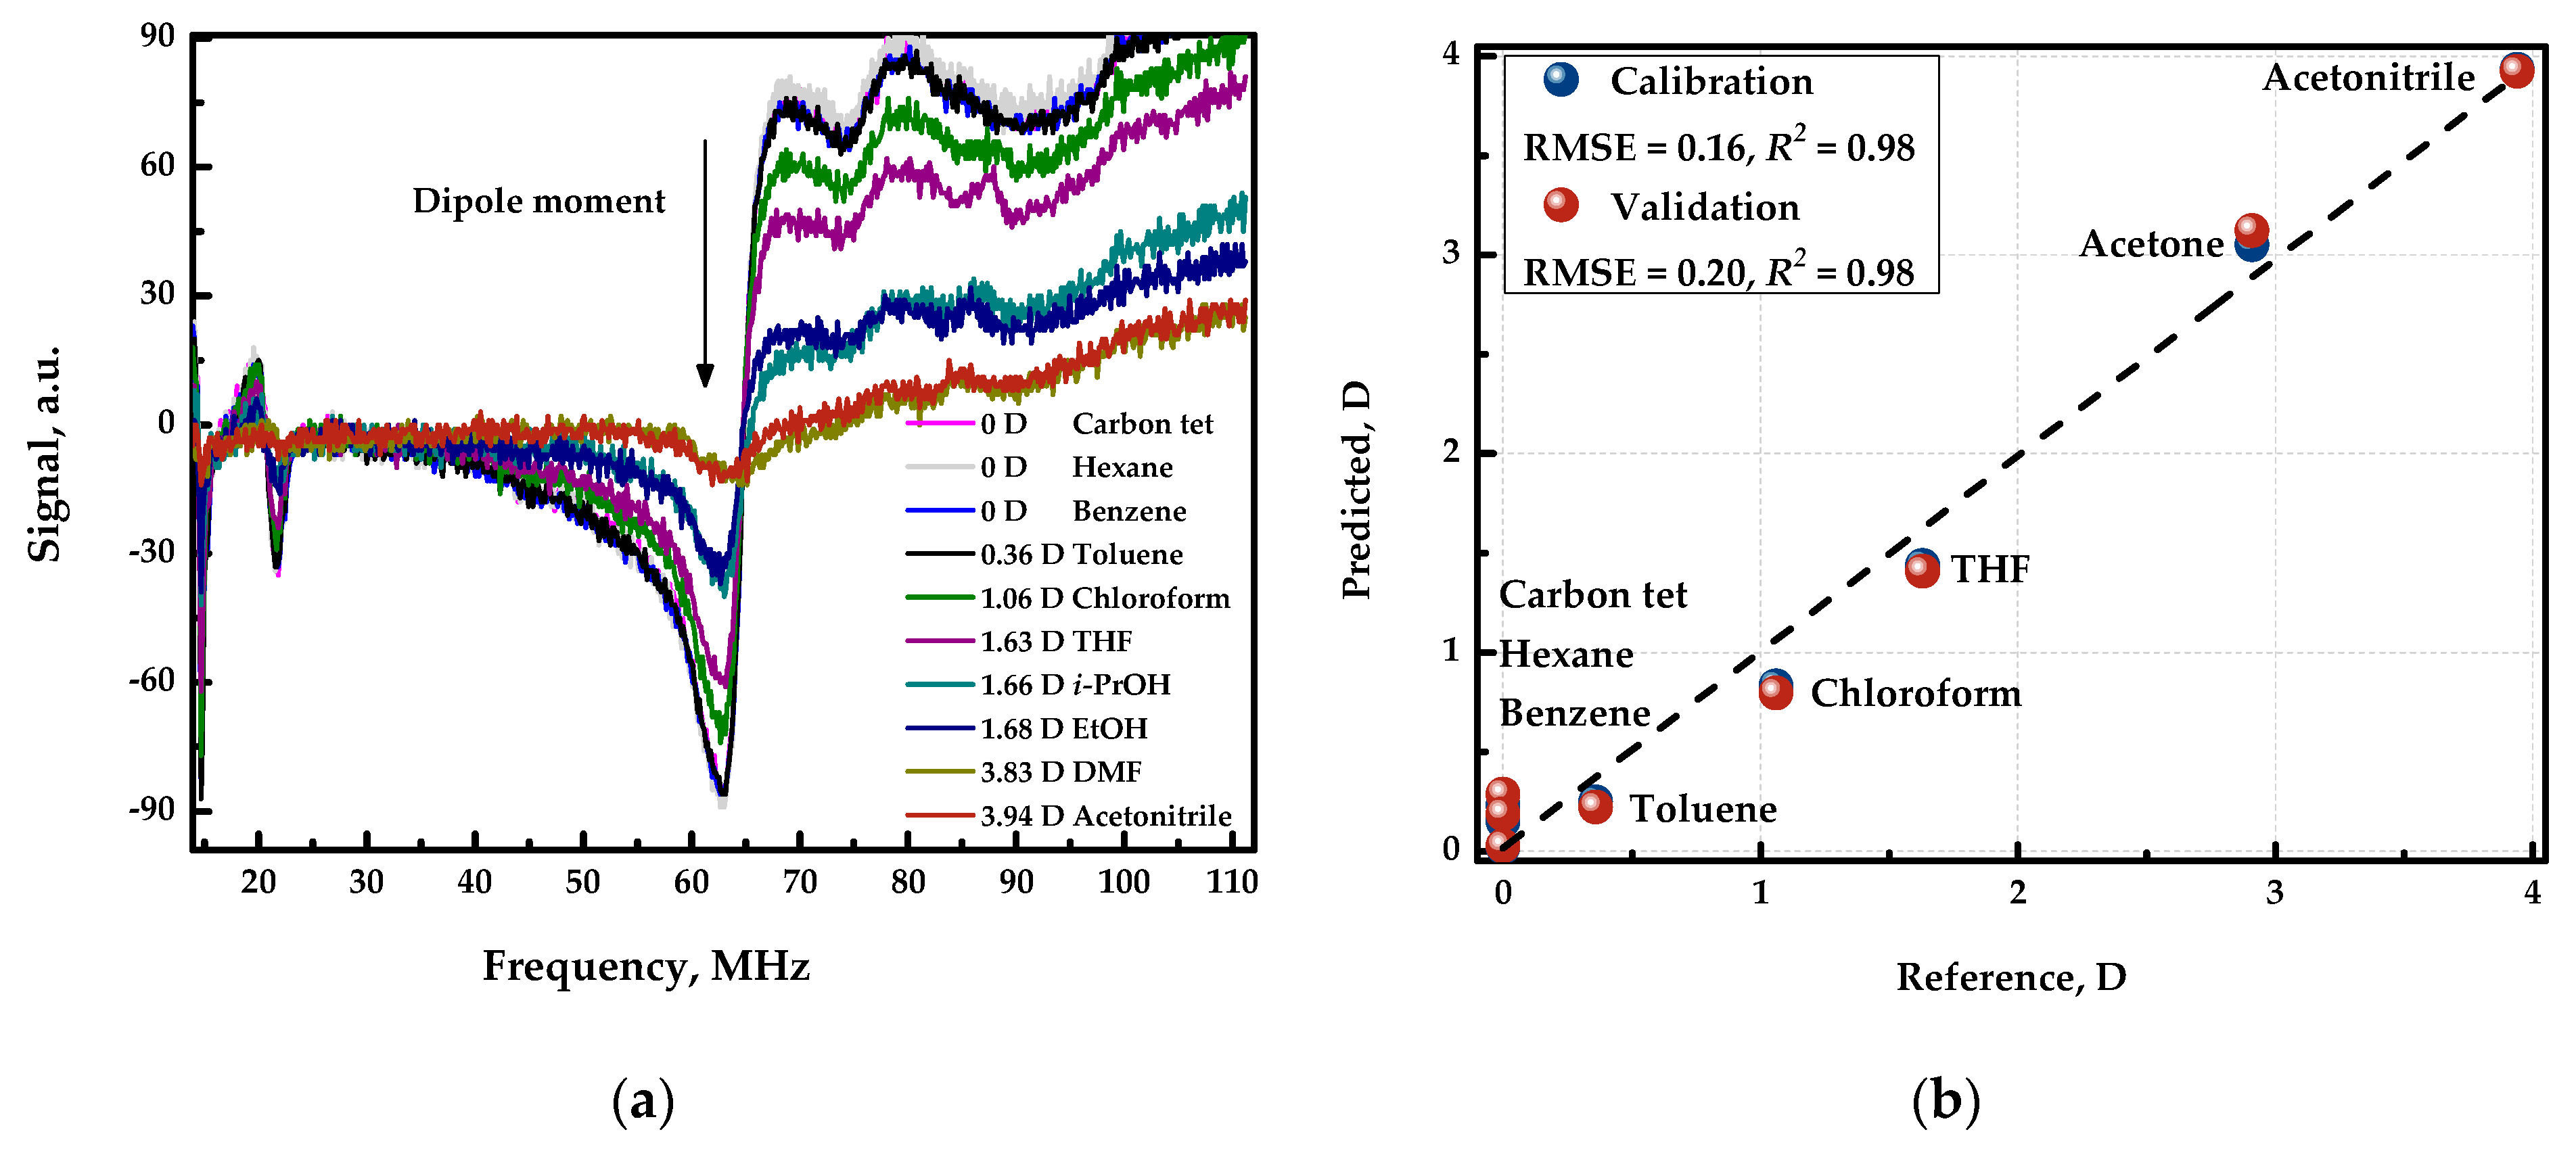
3.2. Analysis of Organic Compounds

Figure 5a shows the spectra of various organic solvents with different dipole moments. In this case, the spectra differ both in shape and intensity, which is due to the fact that the analytical signal is influenced by dielectric permitivity, which is different for organic compounds, in addition to the conductivity of the solution. Also, the dipole moment of the organic compound and the observed analytical signal were found to be correlated. Figure 5b shows the “measured vs. predicted” plot of the resulting cross-validated model. Therefore, applying chemometric data processing, namely by employing PLS regression, the detector can be used to estimate the polarity of unknown samples with an error of 0.2 Debye.

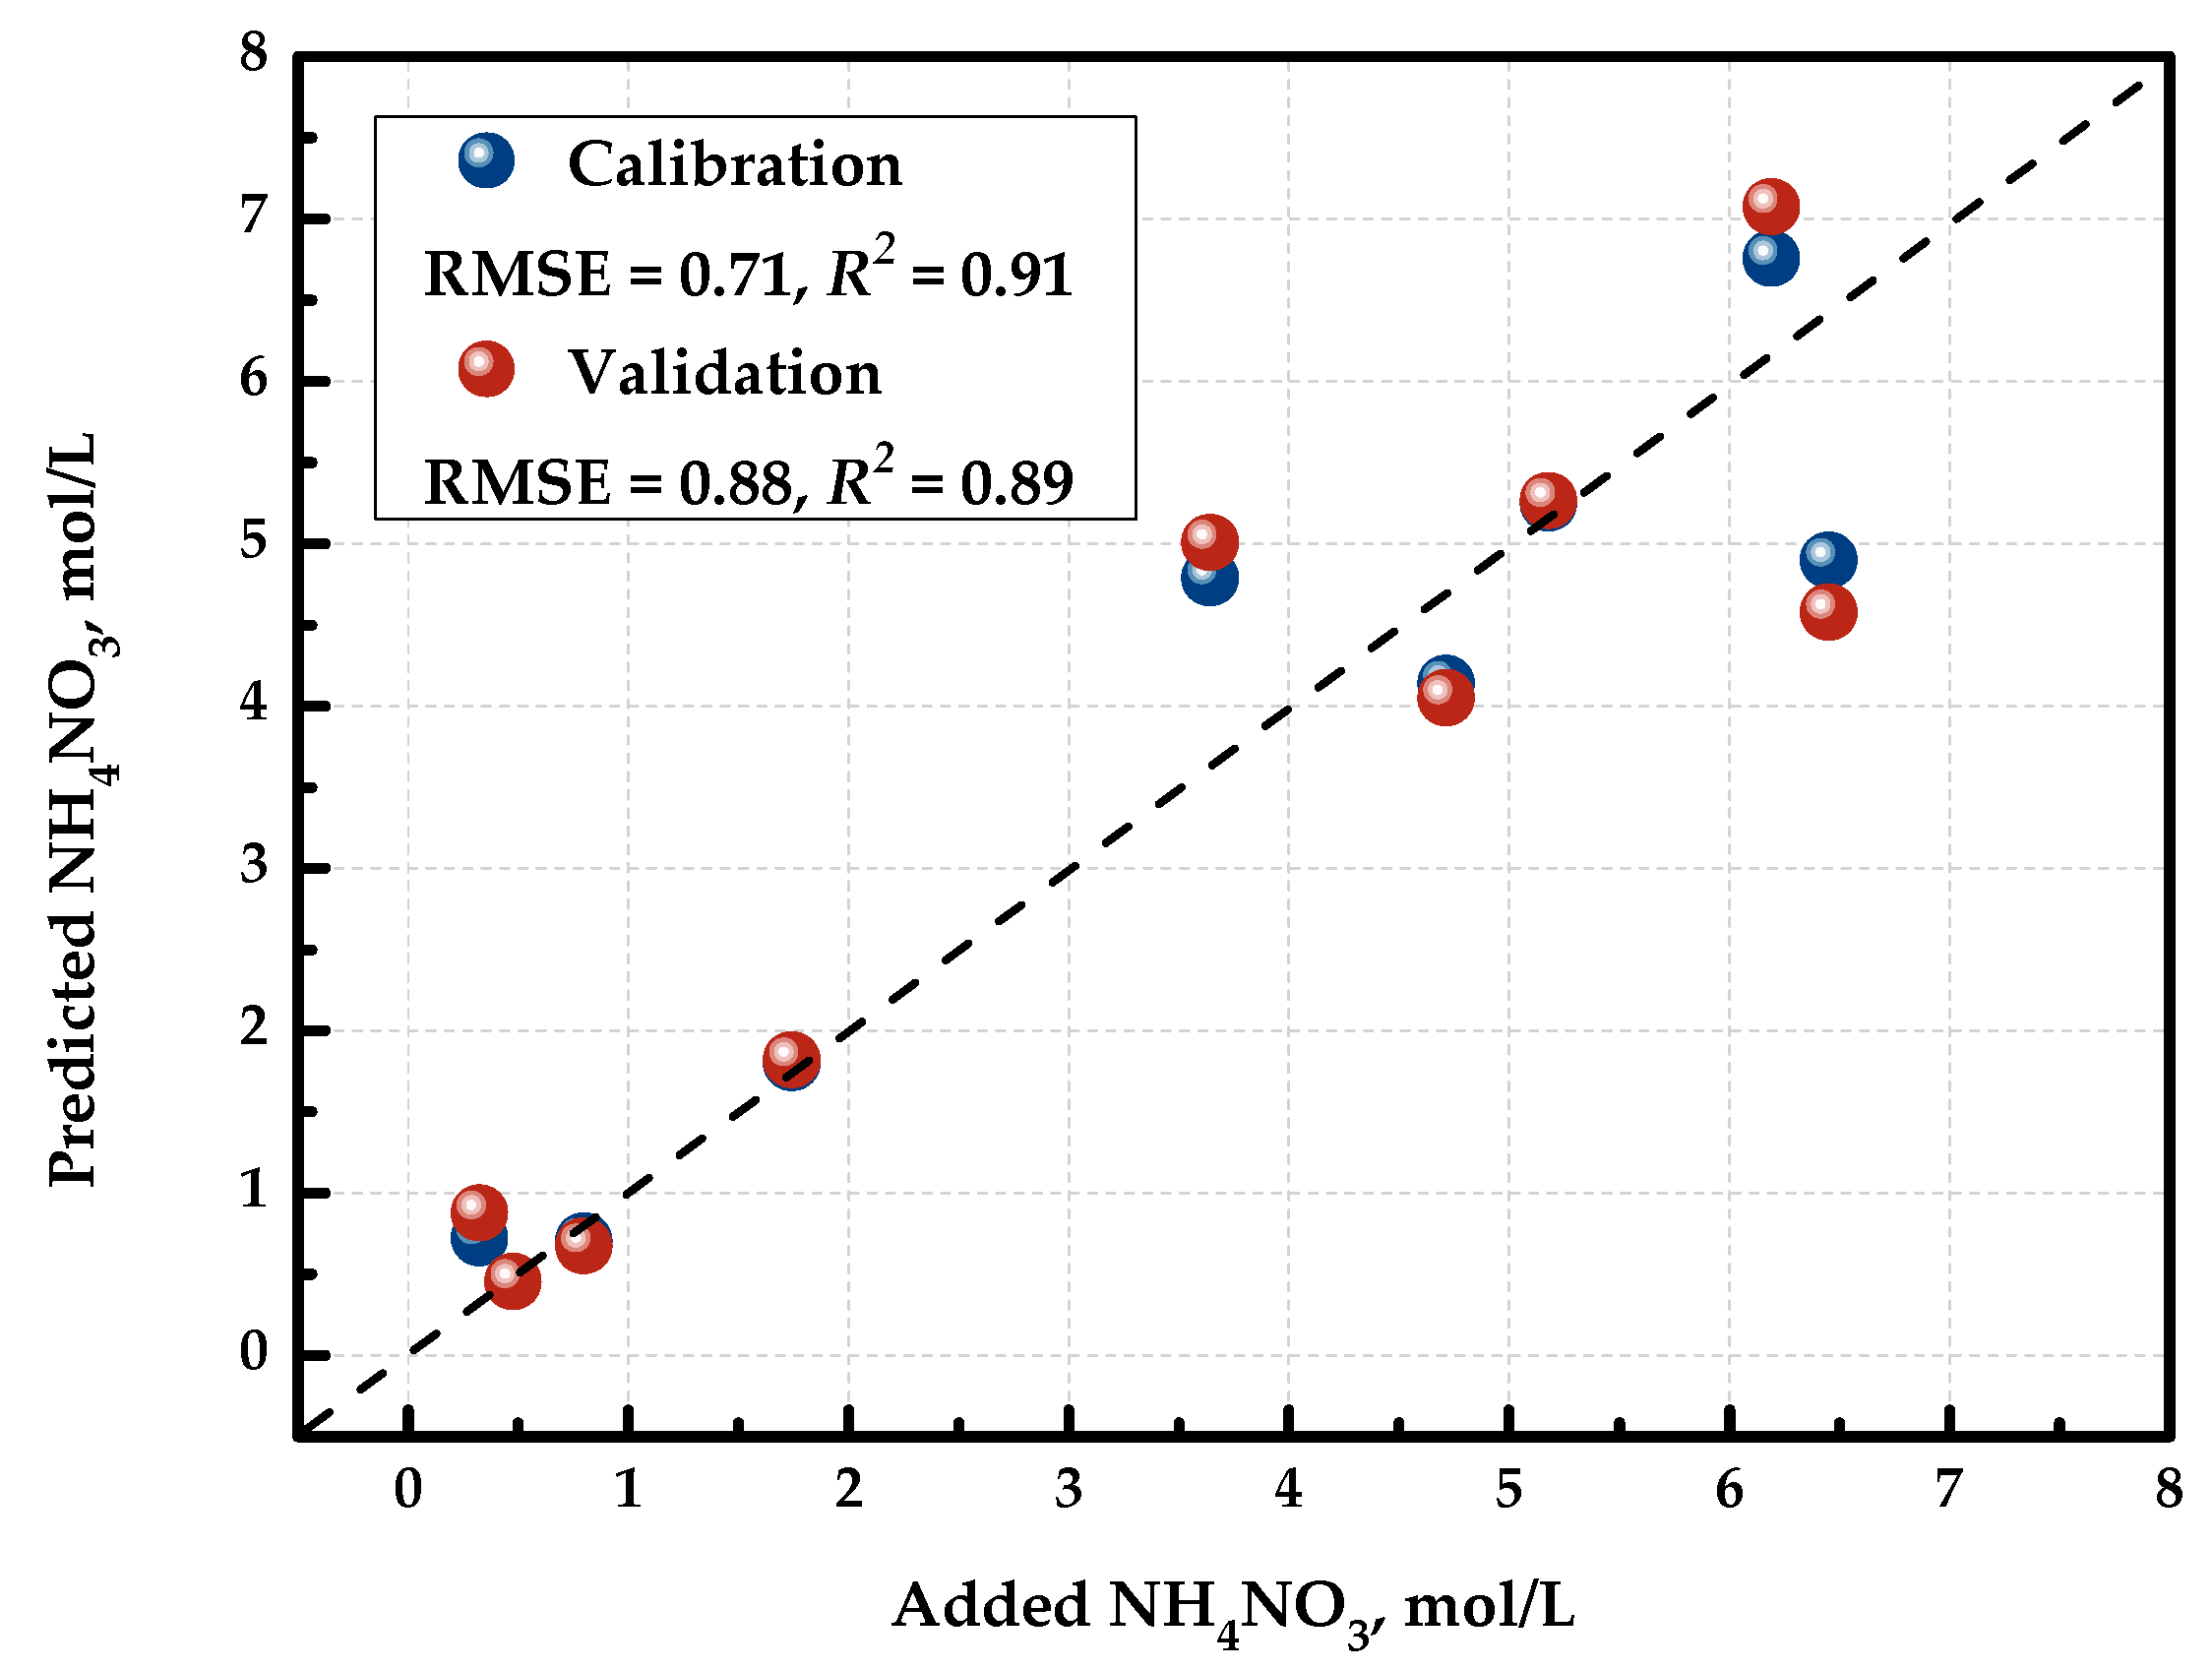
3.3. Real Sample Analysis

As a final step of this study, the developed sensor was tested for analyzing real objects. It was shown that sensor can be used to quantify integral quality parameters (fat in milk) and to quantify the content of ethanol in water−ethanol mixtures in the range of 35−45% of ethanol. Also, biological media containing different bacterial and cell cultures can be recognized by the sensor [3].

4. Conclusions

We propose a new sensor device based on an inductance coil connected to a high-frequency electric field generator (1–112 MHz) which allows us to perform the contactless registration of a signal that depends on the composition of the sample placed in the core of the coil. It is shown that the device can distinguish between samples with different physical and chemical properties.
The following advantages of the proposed principle must be pointed out. Firstly, the measurement procedure is non-contact; during the signal registration, the sample can be placed in a plastic or glass container, which eliminates the dilution or contamination of the sample. Secondly, the response time of the detector is less than 100 ms, which allows for real-time signal registration, as well as dynamic measurements in a fluid medium. Thirdly, the overall experimental layout of the device is extremely simple and inexpensive. Finally, no chemical reagents are required for analysis.

Author Contributions

Conceptualization, D.K. and V.P.; methodology, E.Y., N.M. and V.S.; software, N.M. and V.P.; formal analysis, E.Y.; investigation, V.S., M.K., E.Y. and N.M.; resources, D.K. and M.K.; writing—original draft preparation, E.Y.; writing—review and editing, D.K. and V.P.; visualization, E.Y.; supervision, D.K. and V.P.; project administration, D.K. All authors have read and agreed to the published version of the manuscript.

Funding

This research was funded by RSF, grant number 23-23-00114.

Institutional Review Board Statement

Not applicable.

Informed Consent Statement

Not applicable.

Data Availability Statement

Data is contained within the article.

Conflicts of Interest

The authors declare no conflict of interest.

References

  1. Light, T.S. Electrodeless conductivity. ACS Symp. Ser. 1989, 29, 429–441. [Google Scholar] [CrossRef]
  2. Clayton, J.C.; Hazel, J.F.; McNabb, W.M.; Schnable, G.I. A high-frequency titration apparatus. Anal. Chim. Acta 1955, 13, 487–493. [Google Scholar] [CrossRef]
  3. Yuskina, E.; Makarov, N.; Khaydukova, M.; Filatenkova, T.; Shamova, O.; Semenov, V.; Panchuk, V.; Kirsanov, D. A Simple Contactless High-Frequency Electromagnetic Sensor: Proof of Concept. Anal. Chem. 2022, 94, 11978–11982. [Google Scholar] [CrossRef] [PubMed]
  4. Kirsanov, D.; Panchuk, V.; Agafonova-Moroz, M.; Khaydukova, M.; Lumpov, A.; Semenov, V.; Legin, A. A sample-effective calibration design for multiple components. Analyst 2014, 139, 4303–4309. [Google Scholar] [CrossRef] [PubMed]
  5. Wold, S.; Sjöström, M.; Eriksson, L. PLS-regression: A basic tool of chemometrics. Chemom. Intell. Lab. Syst. 2001, 58, 109–130. [Google Scholar] [CrossRef]
Figure 1. The visual appearance of the sensor [3].
Engproc 48 00042 g001
Figure 2. General view of the spectrum.
Engproc 48 00042 g002
Figure 3. (a) Response curves registered in the aqueous solution of nickel nitrate. (b) Concentration dependence. The error bars indicate the standard deviation of the signals obtained in three replicated measurements.
Engproc 48 00042 g003
Figure 4. “Measured vs. predicted” plot for PLS model predicting the concentration of NH4NO3.
Engproc 48 00042 g004
Figure 5. (a) Response curves registered in the organic solvents with different polarity. (b) “Measured vs. predicted” plot for PLS model predicting the dipole moment.
Engproc 48 00042 g005
Table 1. The content of inorganic compounds in complex mixtures.
Solution Number NH4OH (mol/L)NH4NO3 (mol/L)AcOH (mol/L)
10.0440.3250.148
20.1725.1800.088
30.2600.4760.102
40.3404.7140.202
50.5360.7980.064
60.0856.4510.179
70.3873.6430.110
80.1891.7430.216
90.5486.1910.082
Disclaimer/Publisher’s Note: The statements, opinions and data contained in all publications are solely those of the individual author(s) and contributor(s) and not of MDPI and/or the editor(s). MDPI and/or the editor(s) disclaim responsibility for any injury to people or property resulting from any ideas, methods, instructions or products referred to in the content.

