Proceeding Paper

A Novel Approach to Fabricating a Screen-Printed Electrode Based on a Gold Nanorod–Graphene Oxide Composite for the Detection of Uric Acid †

1
Analytical Chemistry Division, Department of Chemistry, Faculty of Mathematics and Natural Sciences, IPB University, Bogor 16680, Indonesia
2
Tropical Biopharmaca Research Center, Institute of Research and Community Empowerment, IPB University, Bogor 16680, Indonesia
3
Department of Chemistry, Faculty of Mathematics and Natural Sciences, University of Indonesia, Depok 16424, Indonesia
4
Research Center for Metallurgy, National Research and Innovation Agency (BRIN), South Tangerang 15314, Indonesia
*
Author to whom correspondence should be addressed.
Presented at the 2nd International Electronic Conference on Chemical Sensors and Analytical Chemistry, 16–30 September 2023; Available online: https://csac2023.sciforum.net/.
Eng. Proc. 2023, 48(1), 24; https://doi.org/10.3390/CSAC2023-14908
Published: 28 September 2023

Abstract

:
In this study, we report the development of a technique to fabricate a screen-printed electrode (SPE) and apply it in uric acid sensing. The SPE was fabricated by printing it on a photo paper substrate using a printing technique on an office printer. In particular, the conductive ink used to print the working electrode (WE) and counter electrode (CE) consisted of graphene oxide (GO) and a gold nanorod (AuNR) material. While the reference electrode (RE) was made by applying a conductive silver paste to the fabricated SPE, the electrochemical measurement of uric acid solution using fabricated SPE GO/AuNR provided a higher signal than commercially available SPE. The electroanalytical performance of the fabricated SPE based on GO/AuNR, which was used to measure the uric acid solution, exhibited a linear range of 0.8−200 μM, a detection limit of 0.5 μM, a quantitation limit of 1.0 μM, an outstanding repeatability (% relative standard deviation) of 4.885%, and good selectivity with ascorbic acid, dopamine, glucose, urea, and sodium as interference. Furthermore, an SPE, fabricated based on GO/AuNR, was successfully employed for the determination of uric acid concentration in human urine samples using the standard addition approach.

1. Introduction

The determination of uric acid concentration in the samples of human bodily fluids (urine and serum) is one of the most important tests performed in a clinical laboratory to ensure the early diagnosis of diseases [1]. The standard methods for the detection of uric acid in clinical laboratories, such as fluorescence and chemiluminescence, have several drawbacks; they are tedious, require expensive reagents and a trained person to operate the instruments, and are difficult to use in autonomous processes [2]. One alternative method that could be developed for the rapid, reliable, and potentially early detection of uric acid is the electrochemical method, which utilizes a screen-printed electrode (SPE) instead of a traditional electrode [3]. A SPE consists of a working electrode (WE), reference (RE), and counter electrode (RE), which can be fabricated by preparing conductive ink as electrode modifiers in advance [4]. Among the various fabrication techniques for SPE fabrication, the screen-printing technique using an office inkjet printer offers an interesting approach to large-scale production due to its rapid, low-cost, scalable, easy-to-use, and versatile manufacturing process [5].
In this study, we fabricated an SPE based on composite materials, consisting of graphene oxide and gold nanorods (AuNR) as electrode modifiers, using a commercial inkjet printer. Graphene oxide has been extensively employed as an electrode material due to its unique physicochemical properties, such as high surface area and excellent thermal and electric conductivity, and possess wider potential for electrochemical investigations [6]. Meanwhile, gold nanorods (AuNR) are reported to enhance electrode conductivity by accelerating and improving electron transfer, making them suitable for a quantitative analysis, especially with regard to uric acid sensors [7]. The developed uric acid sensor from an SPE-based GO/AuNR was then investigated using electrochemical methods such as cyclic voltammetry (CV) and differential pulse voltammetry (DPV) and finally tested in the sample of human urine. This novel combination of materials for uric acid detection based on a commercially printed SPE is expected to open a new avenue for further development as an early point-of-care device.

2. Materials and Methods

Graphite powder, H2SO4, gold(III) chloride hydrate (HAuCl4.xH2O), hexadecyltrimethylammonium bromide (CTAB), NaBH4, AgNO3, ethylene glycol, monobutyl ether (EGMBE), polyvinylpyrrolidone (PVP), L-(+)-ascorbic acid, and uric acid were obtained from Sigma Aldrich (Darmstadt, Germany). NaNO3, KMnO4, H2O2 30%, glycerol, KCl, and Triton X-100 were purchased from Merck (Darmstadt, Germany). Silver powder, a paraffin block, and photo paper (merry professional glossy inkjet photo paper) were obtained from the local store. Commercial screen-printed carbon electrodes (SPCE) were purchased from DropSens (C110-NTC, Metrohm, DropSens). Deionized water was used throughout the experiments.
The electrochemical experiments were performed using PalmSens Emstat3+ Blue (PalmSens BV Randhoeve 221 3995 GA, Houten, The Netherlands). The graphene oxide (GO) sample was ground using Planetary Ball Mill PM 100 (Verder Scientific, Dusseldorf, Germany). The Raman spectrum of GO was obtained using a HORIBA HR Evolution Raman Microscope (Horiba Scientific, Kyoto, Japan) with a laser excitation wavelength at 514 nm. The absorbance spectrum of gold nanorods (AuNRs) was obtained using a Genesys 10 s UV-Vis Spectrophotometer (Thermo Scientific, Tokyo, Japan). Transmission electron microscopy (TEM) images of GO and AuNR were obtained using TECNAI G2 Spirit Twin HR-TEM (FEI Company, Hillsboro, Oregon, United States).

2.1. Synthesis of Graphene Oxide (GO) and Gold Nanorod (AuNR)

Graphene oxide was synthesized using Hummer’s method, as previously reported [8]. The resulting GO powder was ground using a planetary ball mill for 5 h at a speed of 70 rpm. Meanwhile, the synthesis of gold nanorod (AuNRs) was carried out following the seed growth method based, as previously reported [9]. Both GO powder and AuNR in deionized water were then mixed to prepare the conductive ink for the preparation of the screen-printed electrode (SPE).

2.2. Formulation of Conductive Ink for SPE Fabrication

The pattern of SPE was designed using CorelDraw X7 with reference to the the template from commercial SPCE provided by Metrohm, as displayed in Figure 1. The conductive ink for printing the working electrode (WE) and counter electrode (CE) consists of GO powder, AuNR, and organic solvents, such as glycerol, ethylene glycol, and EGMBE. The composition of ink conductive for the preparation of SPE is as follows: GO (0.25% w/w), PVP (1.25% w/w), glycerol (30% w/w), ethylene glycol (20% w/w), EGMBE (2.5% w/w), Triton X-100 (0.25% w/w), and AuNR in water (50% w/w). Meanwhile, the conductive ink for the reference electrode (RE) was prepared by mixing the silver powder with EGMBE for 2 min to obtain its final concentration of 20% w/w.

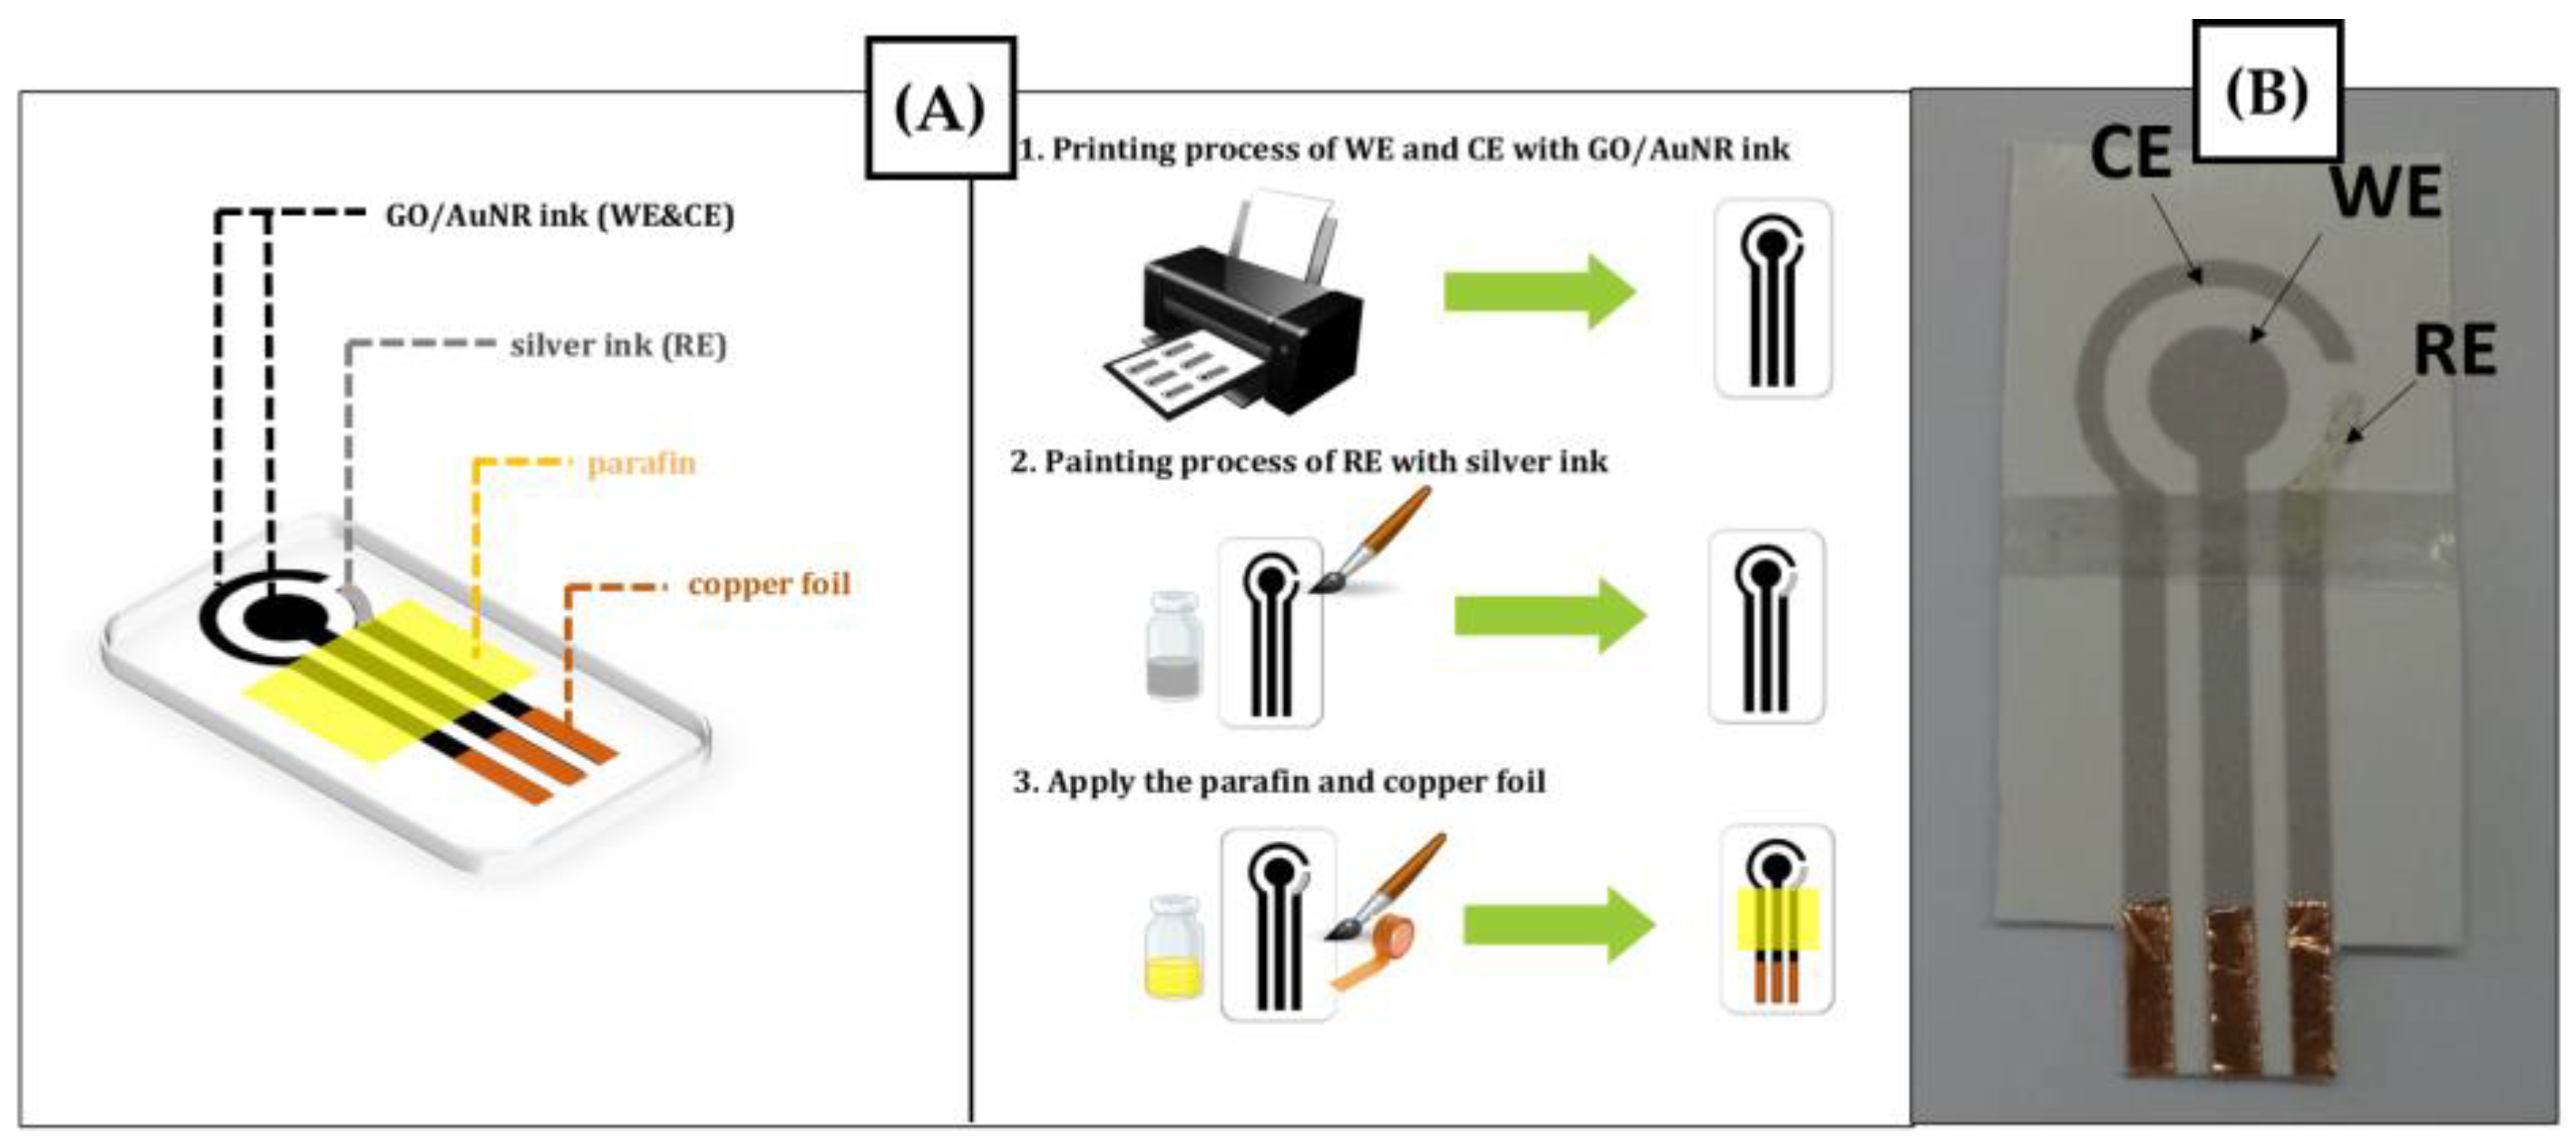
2.3. Fabrication of SPE Based on the Composite of GO/AuNR

The template of SPE was designed using CorelDraw X7 with reference to the pattern of commercial SPCE provided by Metrohm, as displayed in Figure 1A. The conductive ink was then inserted into a commercial office inkjet printer (Epson EcoTank L121 A4 Ink Tank Printer PT Epson Indonesia, Jakarta, Indonesia) with a substrate of photo paper. The printing of SPE was repeated twice to obtain the homogenous dispersion of conductive ink in the SPE pattern. Silver ink was applied to the pattern of SPE to fabricate the reference electrode. Then, the resulting SPE was dried in the oven for 3 min. Paraffin wax was applied on top of the fabricated SPE as an insulating layer, and copper foil was inserted to provide a connection path to WE, RE, and CE. Figure 1A displays the schematic illustration of the preparation of SPE based on GO/AuNR on the photo paper as a substrate. The resulting SPE based on GO/AuNR fabricated using inkjet printing is shown in Figure 1B.

2.4. Evaluation of the Analytical Performance of the Fabricated SPE

The analytical performance of the fabricated SPE was evaluated in several parameters such as linearity, limit of detection (LOD), limit of quantitation (LOQ), reproducibility, stability, and selectivity. The evaluation of electroanalytical performance was performed using a solution of 0.2 mM uric acid in a 0.1 M KCl electrolyte. To assess its applicability, the fabricated SPE was tested in a sample of human urine.
Linearity, limit of detection, and limit of quantification. Linearity was evaluated by preparing the uric acid solution in concentrations varying from 0.8 to 200 μM with 0.1 M KCl as a supporting electrolyte. Each uric acid solution was scanned in triplicate using the differential pulse voltammetry (DPV) technique at a potential window from 0 to +0.8 V, a scan rate of 50 mV s−1, a potential step of 5 mV, a potential pulse of 25 mV, and a pulse time of 0.01 s. The calibration curve from linearity was obtained from the relationship between the concentration of uric acid (x-axis) and the anodic current of uric acid oxidation (y-axis). The value of LOD was derived from the ratio between signal versus noise (S/N) as 3:1. In addition, the LOQ value was determined by the ratio of S/N as 10:1.
Reproducibility and stability. The reproducibility was determined by measuring 50 μM uric acid solution using five different electrodes of SPE based on GO/AuNR. Meanwhile, sensor stability was evaluated by analyzing 50 μM uric acid solution for five consecutive days using a similar electrode. All electrochemical experiments were performed under optimum conditions using the DPV technique.
Selectivity. Selectivity was evaluated by analyzing 50 μM uric acid solution with the presence of several interfering species, such as ascorbic acid, dopamine, urea, and sodium, using the DPV technique. The experimental conditions used in the selectivity studies had a potential range from 0 to +1 V, a scan rate of 50 mV s−1, a potential step of 5 mV, a potential pulse of 25 mV, and a time pulse of 0.01 s.
Analysis of Uric Acid in the Human Urine Samples. The electroanalytical performance of an SPE based on GO/AuNR for uric acid measurements was performed from a healthy human sample. The sample of human urine was diluted 50 times. Then, 5 mL of diluted urine was spiked with the standard solution of uric acid in 0.1 M KCl to obtain a final concentration of 5–50 μM. The sample of human urine was measured using the DPV technique at the potential range from 0 to +1 V, a scan rate of 50 mV s−1, a potential step of 5 mV, a potential pulse of 25 mV, and a time pulse of 0.01 s. The concentration of uric acid in the sample of human urine was determined based on the linear regression equation of the standard addition method:
x-intersep = −CA. (V0/Vf)
where CA is the spiked concentration of uric acid, V0 is the initial volume of the human urine sample before the spiking process, and Vf is the final volume of the human urine sample after the spiking process.

3. Results and Discussions

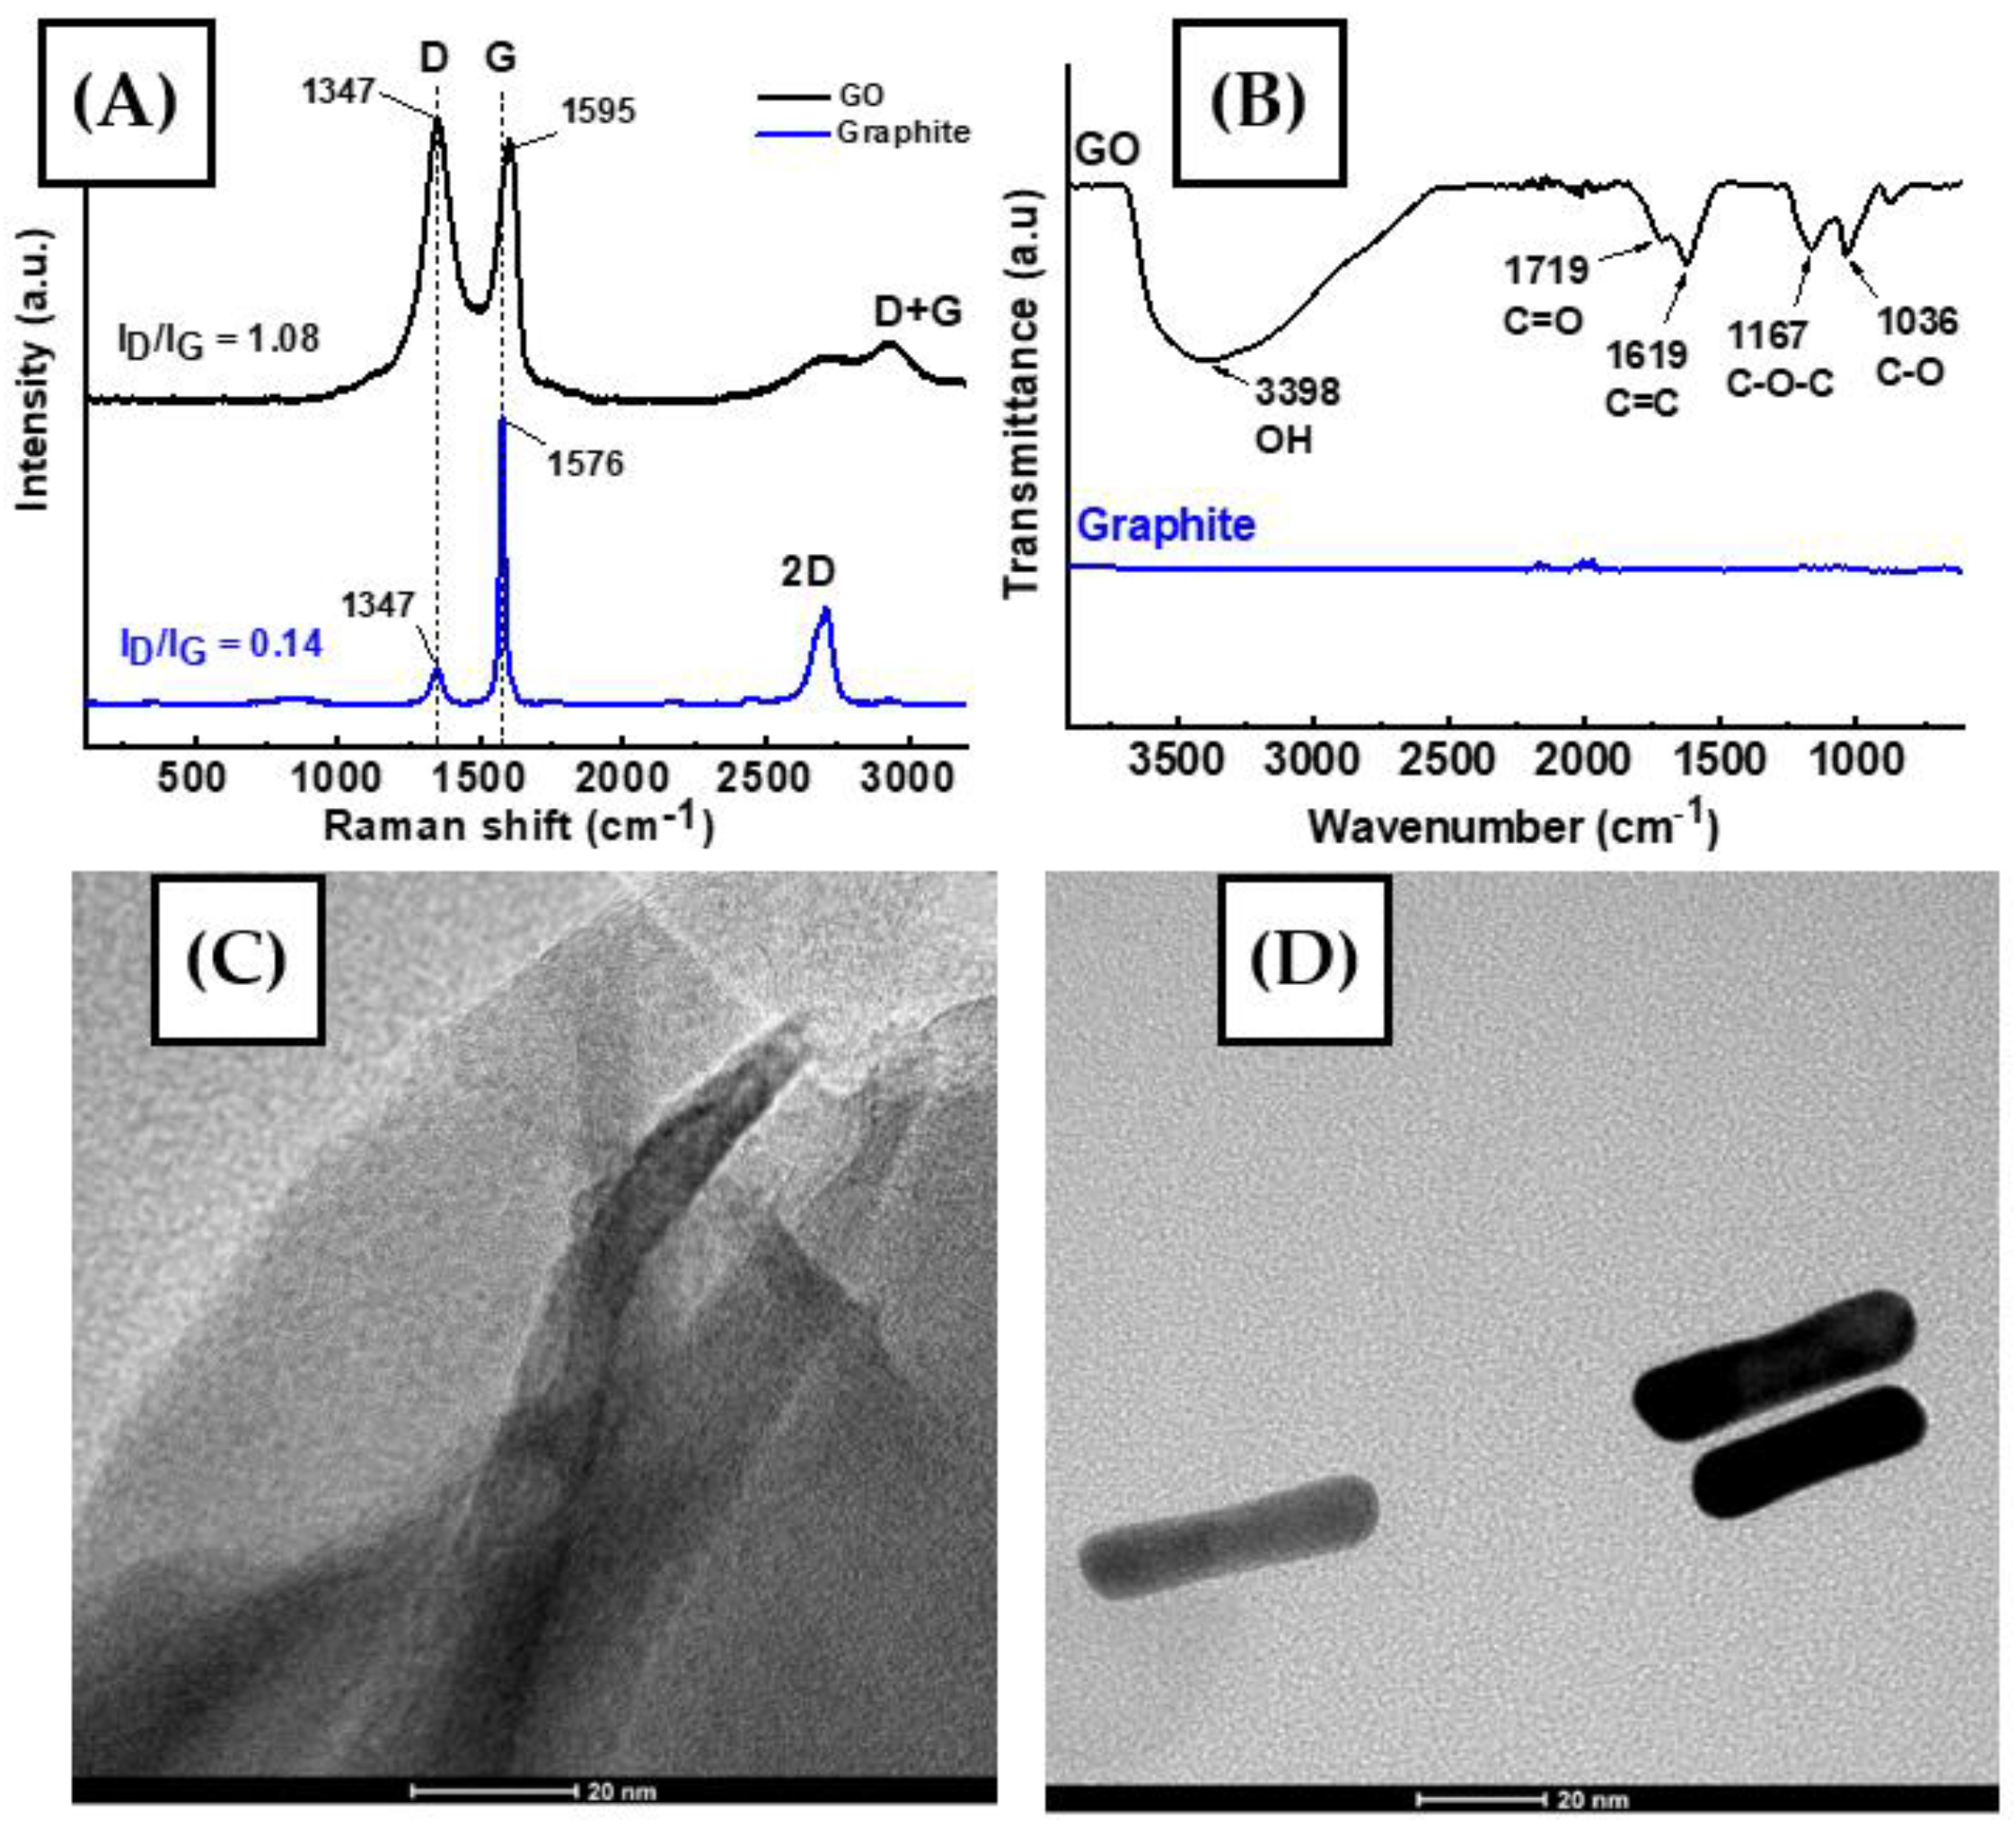
3.1. Characterization of GO and AuNR

Raman analysis was performed in GO to identify the presence of three characteristic peaks of carbon-based materials: the D, G, and 2D bands. The D band is associated with the presence of carbon sp2, which corresponds to a defect or vacancy in the carbon structure. The G band is correlated with vibrations in sp2 hybridized carbon atoms, and the 2D band indicates the number of graphene layers [10]. As seen in Figure 2A, graphite has several Raman peaks at 1575 cm−1 (G band), 1347 cm−1 (D band), and 2707 cm−1 (2D band), which indicate the significance of carbon materials [11]. Meanwhile, when graphite was converted to GO, a higher intensity in the 2D band and a lower intensity in the G band were reflected in their Raman spectra. This is due to the disturbance in the graphite structure, which resulted in the introduction of new functional groups, such as carboxylic, hydroxyl, and epoxide groups [12]. In addition, the presence of oxygen atoms in graphite structure changes the hybridization from sp2 to sp3 [13]. Moreover, the ratio intensity of ID/IG increased from 0.14 (graphite) to 1.08 (GO), which confirms the successful conversion of graphite to sp3-hybridized carbon atoms in the graphene layer [14]. Furthermore, the reduced intensity of 2D from GO to graphite denotes the decreasing number of graphene layers in the GO structure.
FT-IR analysis was performed by scanning the infrared region (1000–4000 cm−1) to observe the structural changes when graphite oxidized in GO materials. Based on the IR spectra, as shown in Figure 2B, the GO spectrum has several vibration peaks at 3398 cm−1 (O-H stretching), 1719 cm−1 (C=O stretching), 1619 cm−1 (C=C aromatic stretching), 1167 cm−1 (C-O-C stretching), and 1036 cm−1 (C-O stretching) [15,16]. The existence of these functional groups in GO indicates the structural changes in its graphene layers compared to the few absorption signals observed in graphite spectra [17].
TEM images were obtained from graphene oxide and the synthesized gold nanorods (AuNR), as shown in Figure 2C,D. It can be seen that the morphology of graphene oxide resembles thin layers folded in the edges (Figure 2C), while the calculated ratio of length vs. width of 300 AuNPs is 3.4, as displayed in Figure 2D.

3.2. Fabrication of SPE Based on GO/AuNR Using an Inkjet Printer

The composition of conductive ink was prepared by mixing 2.5 mg/mL of GO with 10 mL of AuNR solution by adding several additives, such as glycerol, ethylene glycol, and ethylene glycol monobutyl ether (EGMBE). These organic solvents were added to obtain homogenous and stable ink which can prevent GO precipitation, resulting in an easier evaporation of composite solution on the SPE template [18]. Polyvinyl pyrrolidone (PVP) was also added to the mixture of conductive ink as a binder, while Triton X-100 has a function to reduce the surface tension of the composite [19]. The resulting viscosity of conductive ink is 5 mPas, similar to the viscosity of a commercial ink printer. Prior to the insertion of the prepared conductive ink into the inkjet printer, the composite solution was filtered using a syringe filter PVDF 0.45 μm to remove any small particulates [20]. Then, this GO/AuNR-based conductive ink was employed to fabricate the working electrode (WE) and the counter electrode (CE). Meanwhile, silver ink was applied to the SPE pattern to fabricate the reference electrode (RE) and dried in an oven at 80 °C to make sure that the ink solvent completely evaporated. The last step of SPE fabrication is to apply paraffin wax to define the surface area of the electrode and the conductive pathway produced by connecting a copper foil to the WE, RE, and CE.

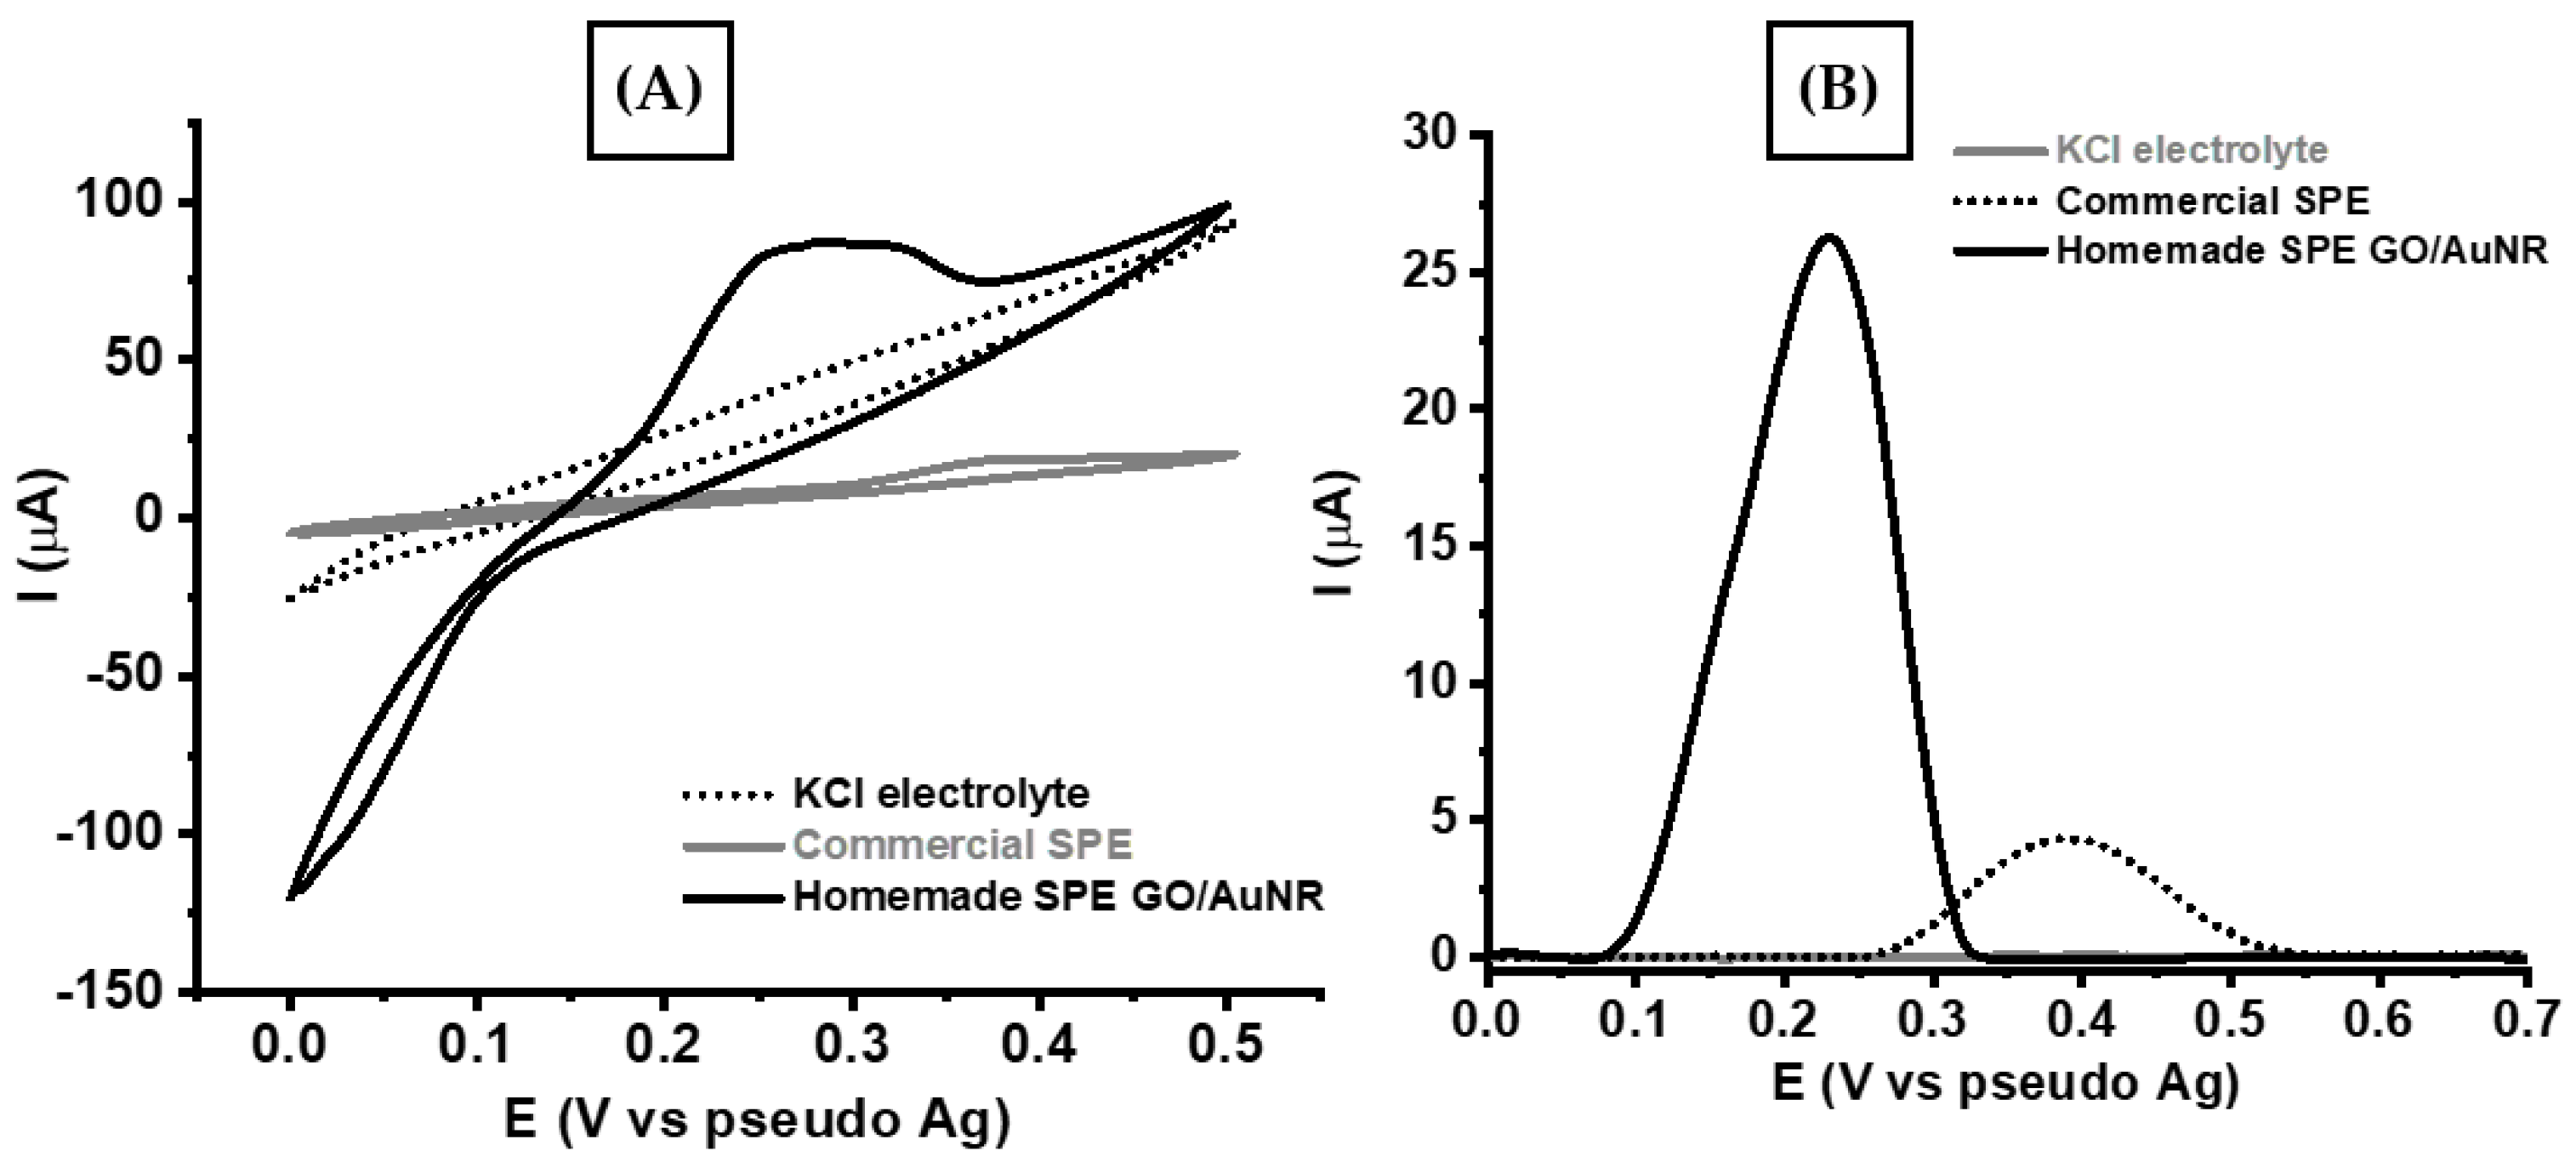
3.3. Electrochemical Investigation of Uric Acid Oxidation Using SPE-Based GO/AuNR

The electrochemical performance of commercial SPCE and SPE-based GO/AuNR was evaluated by measuring 0.2 mM uric acid in 0.1 M KCl using both voltammetric techniques (CV and DPV). The parameters used for the CV technique were similar with a potential range from 0 to +0.5 V (vs. Ag/AgCl), a potential step of 0.005 V, and a scan rate of 50 mV s−1. As shown in Figure 3A, the anodic peak of uric acid oxidation was detected at 0.38 V (vs. Ag/AgCl) using commercial SPCE and at 0.25 V (vs. Ag/AgCl) using SPE-based GO/AuNR. In addition, the observed current of uric acid oxidation at SPE-based GO/AuNR is shown to be 7 times higher than that measured with commercial SPCE.
Next, DPV was chosen to further investigate uric acid oxidation due to its higher sensitivity by reducing the capacitive current to provide a sharper oxidation current than that derived from the role of GO in forming hydrogen bonds and π-π interactions with uric acid. AuNR is used as an electron transfer channel to the surface of modified electrode [21,22].

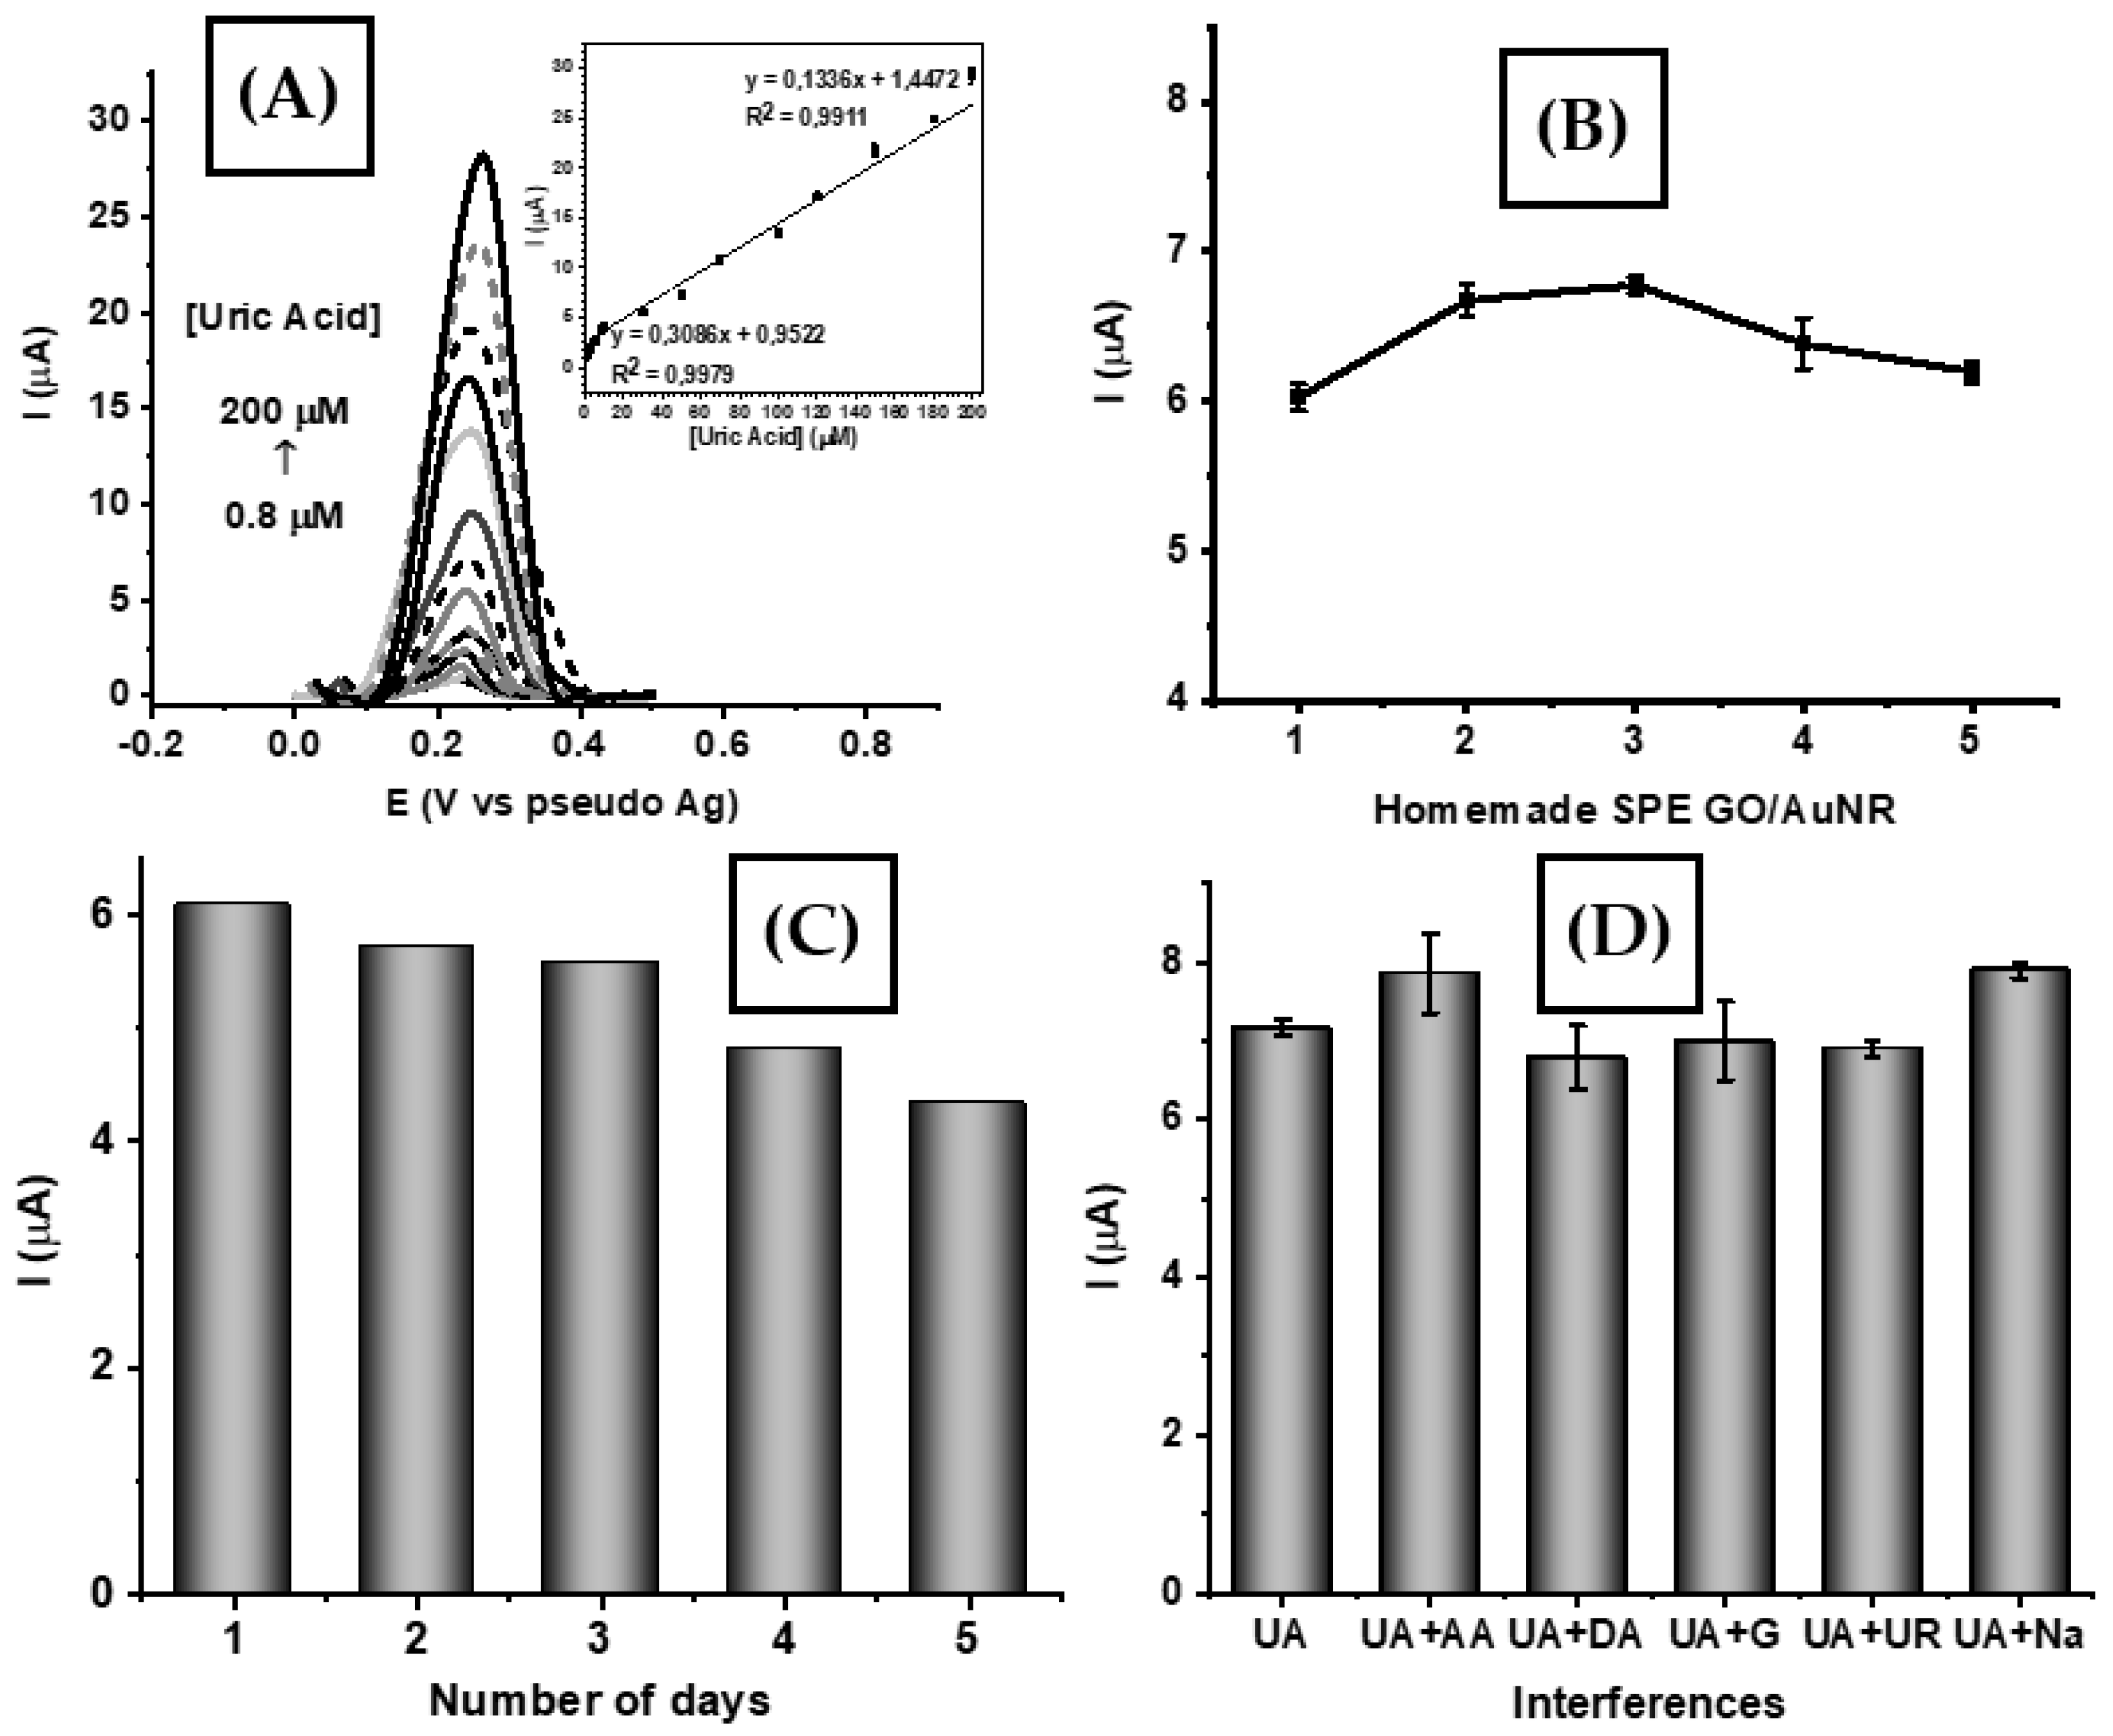
3.4. Analytical Performance of SPE-Based GO/AuNR

The electrochemical performance of SPE-based GO/AuNR was evaluated using several analytical parameters, such as linearity, limit of detection (LOD), limit of quantification (LOQ), reproducibility, stability, and selectivity. Based on Figure 4A, it is clear the peak current linearly increases with the increasing concentration of uric acid. There are two linear regression equations obtained from DPV measurements of uric acid in a concentration range of 0.2–10 μM (Ipa (μA) = 0.3086 (μM) + 0.9522; R2 = 0.9979) and 10–200 μM (Ioks (μA) = 0.1336 (μM) + 1.4472 (R2 = 0.9911). All measurements of uric acid were performed in triplicate experiments. Then, the values of LOD and LOQ were calculated to be 0.5 μM and 1.0 μM, respectively. In addition, Table 1 shows a comparison of the electroanalytical performance of the proposed sensor for the uric acid sensor with that of previously reported sensors. This tables shows that the proposed sensor displays a comparable performance to the other sensors in terms of linear range, LOD, and LOQ.
The reproducibility of the proposed sensor was evaluated by measuring 50 μM uric acid in 0.1 M KCl using five different electrodes. According to Figure 4B, the value of the relative standard deviation (RSD) is 4.89%. Meanwhile, electrode stability was investigated by measuring 50 μM uric acid in 0.1 M KCl for 5 consecutive days, resulting in an RSD value of 7.42%, as shown in Figure 4C. Furthermore, sensor selectivity was studied by measuring 50 μM uric acid in 0.1 M KCl in the presence of several interfering chemicals, such as ascorbic acid, dopamine, glucose, urea, and sodium. As shown in Figure 4D, the response current of SPE-based GO/AuNR displayed a negligible change when the interfering species was added to an equal concentration of uric acid. This indicates that the proposed sensor could maintain its current response in the presence of interfering chemicals. In addition, Table 2 displays the value of relative standard deviation (RSD), which is in the acceptable analytical range of 94–110%. Therefore, it can be concluded that the proposed uric acid sensor shows a good reliability for sensing purposes and may have the potential to be applied in real samples.

3.5. Analysis of Real Samples

The proposed uric acid sensor (SPE-based GO/AuNR) was employed to determine the uric acid content in samples of human urine. Initially, human urine samples were diluted 50 times and spiked with uric acid using the standard addition method. Figure 5 displays the resulting voltammogram of uric acid measurements from human urine samples using the standard addition method with the corresponding calibration plot (y = 0.1278x + 3.9397; R2 = 0.9952). Based on this regression equation, the concentration of uric acid in the sample of human urine was calculated as 3.086 mM. The uric acid concentration in the sample of human urine was also determined in a clinical laboratory and reported to be 3.45 mM. Therefore, it can be concluded that SPE-based GO/AuNR may have the potential to be employed in real applications as a uric acid sensor.

4. Conclusions

This study summarizes the fabrication of a screen-printed electrode (SPE)-based on GO/AuNR composite has been demonstrated using a commercial inkjet printer for uric acid detection. The fabricated uric acid sensor shows good analytical performance in terms of linearity (0.8–200 μM), limit of detection (0.5 μM), and limit of quantification (1.0 μM) when it was investigated using the differential pulse voltammetry (DPV) technique. In addition, the fabricated uric acid sensor also shows acceptable reproducibility, stability, and selectivity in the presence of several potential interfering ions (such as ascorbic acid, dopamine, glucose, urea, and sodium). The proposed sensor was ultimately applied to detect the concentration of uric acid in the sample of human urine, the results of which are comparable with those obtained from the clinical laboratory. Thus, it can be inferred that the developed method for uric acid detection using SPE-based GO/AuNR may have the potential to be applied in real applications.

Author Contributions

B.R.P.: methodology, writing—review, and editing, supervision, H.S.: draft preparation, data curation, methodology, W.T.W.: funding acquisition, supervision, E.R.: supervision, M.K.: review, editing. All authors have read and agreed to the published version of the manuscript.

Funding

This research received no external funding.

Institutional Review Board Statement

Not applicable.

Informed Consent Statement

Not applicable.

Data Availability Statement

Not applicable.

Conflicts of Interest

The authors declare no conflict of interest.

References

  1. Moravcik, O.; Dvorak, M.; Kuban, P. Autonomous capillary electrophoresis processing and analysis of dried blood spots for high-throughput determination of uric acid. Anal. Chim. Acta 2023, 1267, 341390. [Google Scholar] [CrossRef] [PubMed]
  2. Wang, Q.; Wen, X.; Kong, J. Recent progress on uric acid detection: A review. Crit. Rev. Anal. Chem. 2020, 50, 359–375. [Google Scholar] [CrossRef] [PubMed]
  3. Verman, G.; Singhai, S.; Rai, P.K.; Gupta, A. A simple approach to develop a paper-based biosensor for real-time uric acid detection. Anal. Methods 2023, 15, 2955–2963. [Google Scholar] [CrossRef] [PubMed]
  4. Wahyuni, W.T.; Putra, B.R.; Heryanto, R.; Rohaeti, E.; Yanto, D.H.Y.; Fauzi, A. A simple approach to fabricate a screen-printed electrode and its application for uric acid detection. Int. J. Electrochem. Sci. 2021, 16, 210221. [Google Scholar] [CrossRef]
  5. Liu, Y.; Hao, J.; Zheng, X.; Shi, C.; Yang, H. Screen printing of stretchable silver nanomaterial inks for a stable human-machine interface. J. Mater. Chem. C. 2023, 11, 5009–5017. [Google Scholar] [CrossRef]
  6. Anindya, W.; Wahyuni, W.T.; Rafi, M.; Putra, B.R. Electrochemical sensor based on graphene oxide/PEDOT:PSS composite modified glassy carbon electrode for environmental nitrite detection. Int. J. Electrochem. Sci. 2023, 18, 100034. [Google Scholar] [CrossRef]
  7. Husna, R.; Kurup, C.P.; Ansari, M.A.; Mohd-Naim, N.F.; Ahmed, M.U. An electrochemical aptasensor based on AuNRs/AuNWs for sensitive detection of apolipoprotein A-1 (ApoA1) from human serum. RSC Adv. 2023, 13, 3890–3898. [Google Scholar] [CrossRef]
  8. Akhavan, O.; Bijanzad, K.; Mirsepah, A. Synthesis of graphene from natural and industrial carbonaceous waste. RSC Adv. 2014, 4, 20441–20448. [Google Scholar] [CrossRef]
  9. Nikoobakht, B.; El-Sayed, M.A. Preparation and growth mechanism of gold nanorods (NRs) using seed-mediated growth method. Chem. Mater. 2002, 15, 1957–1962. [Google Scholar] [CrossRef]
  10. Oliveira, A.E.F.; Braga, G.B.; Tarley, C.R.T.; Pereira, A.C. Thermally reduced graphene oxide: Synthesis, studies and characterization. J. Mater. Sci. 2018, 53, 12005–12015. [Google Scholar] [CrossRef]
  11. Ossonon, B.D.; Belanger, D. Synthesis and characterization of sulfophenyl-functionalized reduced graphene oxide sheets. RSC Adv. 2017, 7, 27224–27234. [Google Scholar] [CrossRef]
  12. Khine, Y.Y.; Wen, X.; Jin, X.; Foller, T.; Joshi, R. Functional groups in graphene oxide. Phys. Chem. Chem. Phys. 2022, 24, 26337–26355. [Google Scholar] [CrossRef] [PubMed]
  13. Muzyka, R.; Drewniak, S.; Pustelny, T.; Chrubasik Gryglewicz, G. Characterization of graphite oxide and reduced graphene oxide obtained from different graphite precursors and oxidized by different methods using Raman spectroscopy. Materials 2018, 11, 1050. [Google Scholar] [CrossRef]
  14. Vecera, P.; Eigler, S.; Kolesnik-Gray, M.; Krstic Vierck, A.; Maultzsch, J.; Schafer, R.A.; Hauke, F.; Hirsch, A. Degree of functionalization dependence of individual Raman intensities in covalent graphene derivatives. Sci. Rep. 2017, 7, 45165. [Google Scholar] [CrossRef]
  15. Larraza, I.; Ugarte, L.; Fayanas, A.; Gabilondo, N.; Arbelaiz, A.; Corcuera, M.A.; Eceiza, A. Influence of process parameters in graphene oxide obtention on the properties of mechanically strong alginate nanocomposites. Materials 2020, 13, 1081. [Google Scholar] [CrossRef] [PubMed]
  16. Shahriary, L.; Athawale, A.A. Graphene oxide synthesized by using modified Hummers approach. Int. J. Renew. Energy Environ. 2014, 2, 58–63. [Google Scholar]
  17. Li, J.; Yan, Q.; Zhang, X.; Zhang, J.; Cai, Z. Efficient conversion of lignin waste to high value bio-graphene oxide nanomaterials. Polymers 2019, 11, 623. [Google Scholar] [CrossRef]
  18. Li, Y.-L.; Guo, X.; Feng, X.-J.; Li, L.-H. Graphene oxide for inkjet-printing technology. Appl. Mech. Mater. 2015, 748, 77–80. [Google Scholar] [CrossRef]
  19. Li, P.; Cheng-An, T.; Wang, B.; Huang, J.; Li, T.; Wang, J. Preparation of graphene oxide-based ink for inkjet printing. J. Nanosci. Nnaotechnol. 2018, 18, 713–718. [Google Scholar] [CrossRef]
  20. Molazemhosseini, A.; Magagnin, L.; Vena, P.; Liu, C.-C. Single-use disposable electrochemical label-free immunosensor for detection of glycated hemoglobin (HbA1c) using differential pulse voltammetry (DPV). Sensors 2016, 16, 1024. [Google Scholar] [CrossRef]
  21. Safitri, H.; Wahyuni, W.T.; Rohaeti, E.; Khalil, M.; Marken, F. Optimization of uric acid detection with Au nanorod-decorated graphene oxide (GO/AuNR) using response surface methodology. RSC Adv. 2022, 12, 25269–25278. [Google Scholar] [CrossRef]
  22. Azimzadeh, M.; Rahaie, M.; Nasirizadeh, N.; Ashtari, K.; Naderi-Manesh, H. An electrochemical nanobiosensor for plasma miRNA-155, based on graphene oxide and gold nanorod, for early detection of breast cancer. Biosens. Bioelectron. 2016, 77, 99–106. [Google Scholar] [CrossRef]
  23. Shanmugam, R.; Aniruthan, S.; Yamunadevi, V.; Nellaiappan, S.; Amali, A.J.; Suresh, D. Co-N/Zn@NPC derived from bimetallic zeolitic imidazolate frameworks: A dual mode simultaneous electrochemical sensor for uric acid and ascorbic acid. Surf. Interfaces 2023, 40, 103103. [Google Scholar] [CrossRef]
  24. Muhammad, F.; Dik, G.; Kolak, S.; Gedik, K.K.; Bakar, B.; Ulu, A.; Ates, B. Design of highly selective, and sensitive screen-printed electrochemical sensor for detection of uric acid with uricase immobilized polycaprolactone/polyethylene imine electrospun nanofiber. Electrochim. Acta 2023, 439, 141675. [Google Scholar] [CrossRef]
  25. Reddy, Y.V.M.; Sravani, B.; Agarwal, S.; Gupta, V.K.; Madhavi, G. Electrochemical sensor for detection of uric acid in the presence of ascorbic acid and dopamine using the poly(DPA)/SiO2@Fe3O4 modified carbon paste electrode. J. Electroanal. Chem. 2018, 820, 168–175. [Google Scholar] [CrossRef]
  26. Soleh, A.; Kanatharana, P.; Thavarungkul, P.; Limbut, W. Novel electrochemical sensor using a dual-working electrode system for simultaneous determination of glucose, uric acid, and dopamine. Microchem. J. 2020, 153, 105479. [Google Scholar] [CrossRef]
  27. Charithra, M.M.; Manjunatha, J.G.G.; Raril, C. Surfactant modified graphite paste electrode as an electrochemical sensor for the enhanced voltammetric detection of estriol with dopamine and uric acid. Adv. Pharm. Bull. 2020, 10, 247–253. [Google Scholar] [CrossRef]
  28. Putra, B.R.; Nisa, U.; Heryanto, R.; Rohaeti, E.; Khalil, M.; Izzataddini, A.; Wahyuni, W.T. A facile electrochemical sensor based on a composite of electrochemically reduced graphene oxide and a PEDOT:PSS modified glassy carbon electrode for uric acid detection. Anal. Sci. 2022, 38, 157–166. [Google Scholar] [CrossRef] [PubMed]
  29. Mazzara, F.; Patella, B.; Aiello, G.; O’Riordan, A.; Torino, C.; Vilasi, A.; Inguanta, R. Electrochemical detection of uric acid and ascorbic acid using r-GO/NPs based sensors. Electrochim. Acta 2021, 388, 138652. [Google Scholar] [CrossRef]
  30. Sohouli, E.; Khosrowshahi, E.M.; Radi, P.; Naghian, E.; Rahimi-Nasrabadi, M.; Ahmadi, F. Electrochemical sensor based on modified methylcellulose by graphene oxide and Fe3O4 nanoparticles: Application in the analysis of uric acid content in urine. J. Electroanal. Chem. 2020, 877, 114503. [Google Scholar] [CrossRef]
Figure 1. (A) Schematic illustration of the fabrication process of SPE based on GO/AuNR using an inkjet printing technique; (B) the result of the SPE fabricated using an inkjet printing technique.
Engproc 48 00024 g001
Figure 2. The spectrum of graphite and graphene oxide (GO) for (A) Raman and (B) FT-IR spectra, TEM images for (C) GO, and (D) gold nanorod (AuNR).
Engproc 48 00024 g002
Figure 3. Voltammograms were obtained using (A) CV and (B) DPV techniques for the measurements of 0.2 mM uric acid in 0.1 M KCl via commercial SPCE and SPE based-GO/AuNR.
Engproc 48 00024 g003
Figure 4. (A) Voltammograms obtained from uric acid measurements in different concentrations (0.8–200 μM) in 0.1 M KCl using SPE-based GO/AuNR. Inset: the linear regression between peak current and uric acid concentration. (B) Reproducibility of uric acid measurements of 50 μM using five different electrodes. (C) Stability of uric acid measurements at a concentration of 50 μM over 5 days consecutive days. (D) Variation in response current using a uric acid measurement in the presence of several interferences, such as ascorbic acid (AA), dopamine (DA), glucose (G), urea (UR), and sodium (Na) when measured with SPE-based GO/AuNR.
Engproc 48 00024 g004
Figure 5. Voltammogram response of the sample of human urine spiked with increasing concentration of uric acid (0–50 μM) in 0.1 M KCl and measured using SPE-based GO/AuNR. The inset is the resulting calibration plot.
Engproc 48 00024 g005
Table 1. Comparison of analytical performance of the proposed sensor or uric acid with other sensors.
ElectrodeLinear Range (μM)LOD (μM)LOQ (μM)Ref.
Co-N/Zn@NPC 10.1–14.7 5 × 10−41.6 × 10−3[23]
PCL/PEI/UOx/QD 25–52.03.9613.1[24]
Poly(DPA 3) SiO2@Fe3O41.2–1.80.41.2[25]
Chi/GOx/PB-G 410–300.110.38[26]
OXL-9 540–1201.44.7[27]
ErGO/PEDOT:PSS 610–100 1.083.61[28]
rGO/AuNPs10–5003.610.95[29]
MC-GO 7-Fe3O40.5–1400.170.5[30]
GO/AuNR0.8–200 0.51.0This work
1 Nanoporous carbon. 2 Polycaprolactone/polyethylene imine/uricase/quantum dot. 3 dipicolinic acid. 4 chitosan/glucose oxidase/Prussian blue-graphite. 5 Octoxynol-9. 6 Electrochemically reduced graphene oxide/poly(3,4-ethylenedioxythiophene):poly(styrenesulfonate). 7 Methylcellulose/graphene oxide.
Table 2. The effect of interference in the selectivity studies and its recovery values for the measurement of 50 μM uric acid.
InterferenceThe Concentration Ratio (Uric Acid/Interference)Iox Uric Acid (μA)% Recovery
--7.162 ± 0.2-
Ascorbic acid 1:17.855 ± 0.8109.7 ± 1.9
Dopamine1:16.789 ± 0.794.8 ± 12.6
Glucose1:16.997 ± 0.897.7 ± 13.6
Urea1:16.902 ± 0.196.4 ± 3.6
Sodium1:17.893 ± 0.2110.2 ± 5.3
Disclaimer/Publisher’s Note: The statements, opinions and data contained in all publications are solely those of the individual author(s) and contributor(s) and not of MDPI and/or the editor(s). MDPI and/or the editor(s) disclaim responsibility for any injury to people or property resulting from any ideas, methods, instructions or products referred to in the content.

