Proceeding Paper

Classification of Teas Using Different Feature Extraction Methods from Signals of a Lab-Made Electronic Nose †

by
Irari Jiménez-López
,
Jeniffer Molina-Quiroga
and
Juan Manuel Gutiérrez
*
Bioelectronics Section, Department of Electrical Engineering, CINVESTAV-IPN, Mexico City 07360, Mexico
*
Author to whom correspondence should be addressed.
Presented at the 2nd International Electronic Conference on Chemical Sensors and Analytical Chemistry, 16–30 September 2023; Available online: https://csac2023.sciforum.net/.
Eng. Proc. 2023, 48(1), 20; https://doi.org/10.3390/CSAC2023-14933
Published: 12 October 2023

Abstract

:
Tea and herbal infusions are the most consumed non-alcoholic beverages worldwide and possess bioactive components with multiple health benefits. They are categorized into different classes that depend on their elaboration process, origin, and components. Commonly, analytical methods are employed to classify tea according to its chemical composition using liquid and gas chromatography–mass spectrometry, among others. Novel methods, such as electronic noses (e-noses), effectively provide real-time and objective monitoring of odors for extended periods of time. This work aimed to classify eight different types of tea (green, white, black, spearmint, mint, hibiscus, lemongrass, and chamomile) using two feature extraction methods and two pattern recognition analyses that were compared. A total of 34 tea samples were analyzed using an e-nose consisting of an olfactometer as a sample-handling system, seven chemo-resistive gas sensors, and a 12-bit analog-to-digital converter. Tea samples were measured 10 times to ensure repeatability, resulting in a database of 340 tea measures with 2499 samples each per sensor. Data were preprocessed using Principal Component Analysis (PCA) and Parallel Factor Analysis (PARAFAC). The information extracted was classified using an Artificial Neural Network (ANN) and k-nearest neighbor (k–NN). The best architecture in ANN and distance in k-NN were demonstrated through 10 k-fold cross-validation. The classification rate was 93% in ANN and PCA, 73% in ANN and PARAFAC, 94% in k-NN and PCA, and 84% in k-NN and PARAFAC. This demonstrates that conventional PCA is better than complex PARAFAC. Our findings not only contribute to the field of tea and herbal infusion classification but also underscore the potential of e-nose systems for discriminating between diverse tea types and herbal infusions based on their odor profiles.
Keywords:
tea; e-nose; PCA; PARAFAC; ANN; k-NN

1. Introduction

Tea is the world’s most consumed aromatic, non-alcoholic beverage after water. It is common to refer to tea and herbal infusions as equal, yet the term tea focuses on the Camellia sinensis. Teas are classified into different groups depending on their manufacturing process. On the other hand, herbal teas and infusions are made with the fruits, flowers, and leaves of a variety of plants [1]. They possess multiple human health functions, like antioxidation, anti-inflammation, and immune regulation, among others [2]. There are biochemical components responsible for the color, taste, and aroma of tea; those related to the aroma are named volatile organic compounds (VOCs) [3].
Commonly, analytical methods like GC-MS and FT-IR spectrometry are employed in the industry to classify products according to their chemical composition [4,5]. A new concept of analytical methods that has emerged over recent years is known as electronic noses (e-noses), which identify odors by detecting the “fingerprint” of a chemical compound.
E-noses are a new concept in analytical procedures that have arisen recently. They identify scents by detecting the “fingerprint” of a chemical component. These systems are often composed of a gas sensor array to detect odors and a processing data tool to analyze the information [6]. Currently, e-noses consider one subsystem related to sampling handling to deliver odors to the sensor array. Today, e-noses are employed in several applications, including for medicine, healthcare, food, and beverages [7].
The data processing stage is one of the most important components in e-nose development since it helps to generate a coherent and useful response. Often, this data processing and modeling is based on the use of an ANN, k-NN, a support vector machine (SVM), and random forest (RF), to name a few. Nevertheless, the signals from e-noses are characterized by their high dimensionality and non-stationary regions that demand feature extraction methods focused on reducing data. For this purpose, data could undergo mathematical transformations such as PCA, PARAFAC [8], and multi-way analysis, to mention the most widespread approaches.
This work implements a processing strategy that employs PCA and PARAFAC techniques to extract data features from an e-nose that analyzes tea samples and compares their relevance using two recognition models based on ANN and k-NN.

2. Materials and Methods

2.1. Instrumentation and Data Collection

The tea database was obtained using a lab-made e-nose consisting of an olfactometer that controlled the odor stimuli and injected the sample’s VOCs into a chamber containing seven metal oxide sensors (MOXs) from MQ-series. These sensors detect various gases, including carbon monoxide, liquefied petroleum gas, natural gas, alcohol, benzene, methane, and hydrogen. The voltage values were obtained by an acquisition board with a 12-bit analog-to-digital converter at a 5 Hz sampling frequency and a Raspberry Pi 3+B single-board computer [9]. The set of samples was comprised of 34 unblended tea samples from commercial brands. Teas were categorized into eight classes: green, white, black, spearmint, mint, hibiscus, lemongrass, and chamomile. Each tea sample (4.5 g) was placed in the e-nose platform for analysis. Then, odor stimuli started and lasted for 500 s, distributed as follows: 5 s for rest, 35 s for odor stimulation, and 460 s for relaxation. As a result, 2499 samples were collected for each tea and sensor.
Each tea was sampled and recorded 10 times to analyze the experiment’s repeatability. After every experiment, the sensor chamber was cleaned ten times with pure air. Finally, the database was established as a tridimensional matrix of 2499 samples, 340 records (34 teas × 10 repetitions), and 7 sensors.

2.2. Data Feature Extraction and Modeling

E-nose data were analyzed using PCA and PARAFAC methods to reduce dimensionality and extract relevant features designed to improve the classification task. PCA finds the linear correlation between the original data variables to produce new uncorrelated linear combinations of these variables using an orthogonal transformation [10], whereas PARAFAC is a multi-way data decomposition method that is closely related to PCA and applied to higher-order arrays [11].
One of the goals of these techniques is to determine the representative number of components that better represent the original data. For PCA, significant principal components (PCs) could be chosen based on accumulative variance since the algorithm typically orders them according to the most relevant variance; in this way, the first PCs usually represent the maximum variation present in the original variables. On the other hand, PARAFAC assumes the existence of a triple path in the data and determines a unique solution so that the components can be rearranged and scaled arbitrarily [11]. For the selection of the optimal components, a diagnostic test is usually based on a core consistency diagnostic (CORCONDIA) [12].
Two different classification models were used after the feature extraction stage, allowing us to identify patterns in the data. The first was ANN, which is based on the supervised learning approach [13]. Its optimization was achieved using a standard trial-and-error process, whereby several parameters are fine-tuned to determine the best configuration to achieve the performance. The second was k-NN, a popular supervised model that finds a group of k objects in the training set that are near the test object. k-NN orders the information by computing distances between feature values [14].
In this way, four combinations were performed: PCA–ANN, PCA–k-NN, PARAFAC–ANN, and PARAFAC–k-NN. A k-fold cross-validation (k = 10) was carried out to determine these classification models’ classification capability to compare their performance. Considering that the tea classes did not have the same number of samples, each class was split separately to ensure that the folds contained at least one sample of each type. The training matrix was built using 306 observations, while the test matrix included 34 teas. The training data were normalized in the interval of [0, 1], and the maximum and minimum values obtained were used to normalize test data.
Finally, for each case, a confusion matrix was calculated to determine performance metrics: accuracy, precision, recall or sensitivity, and specificity [15].

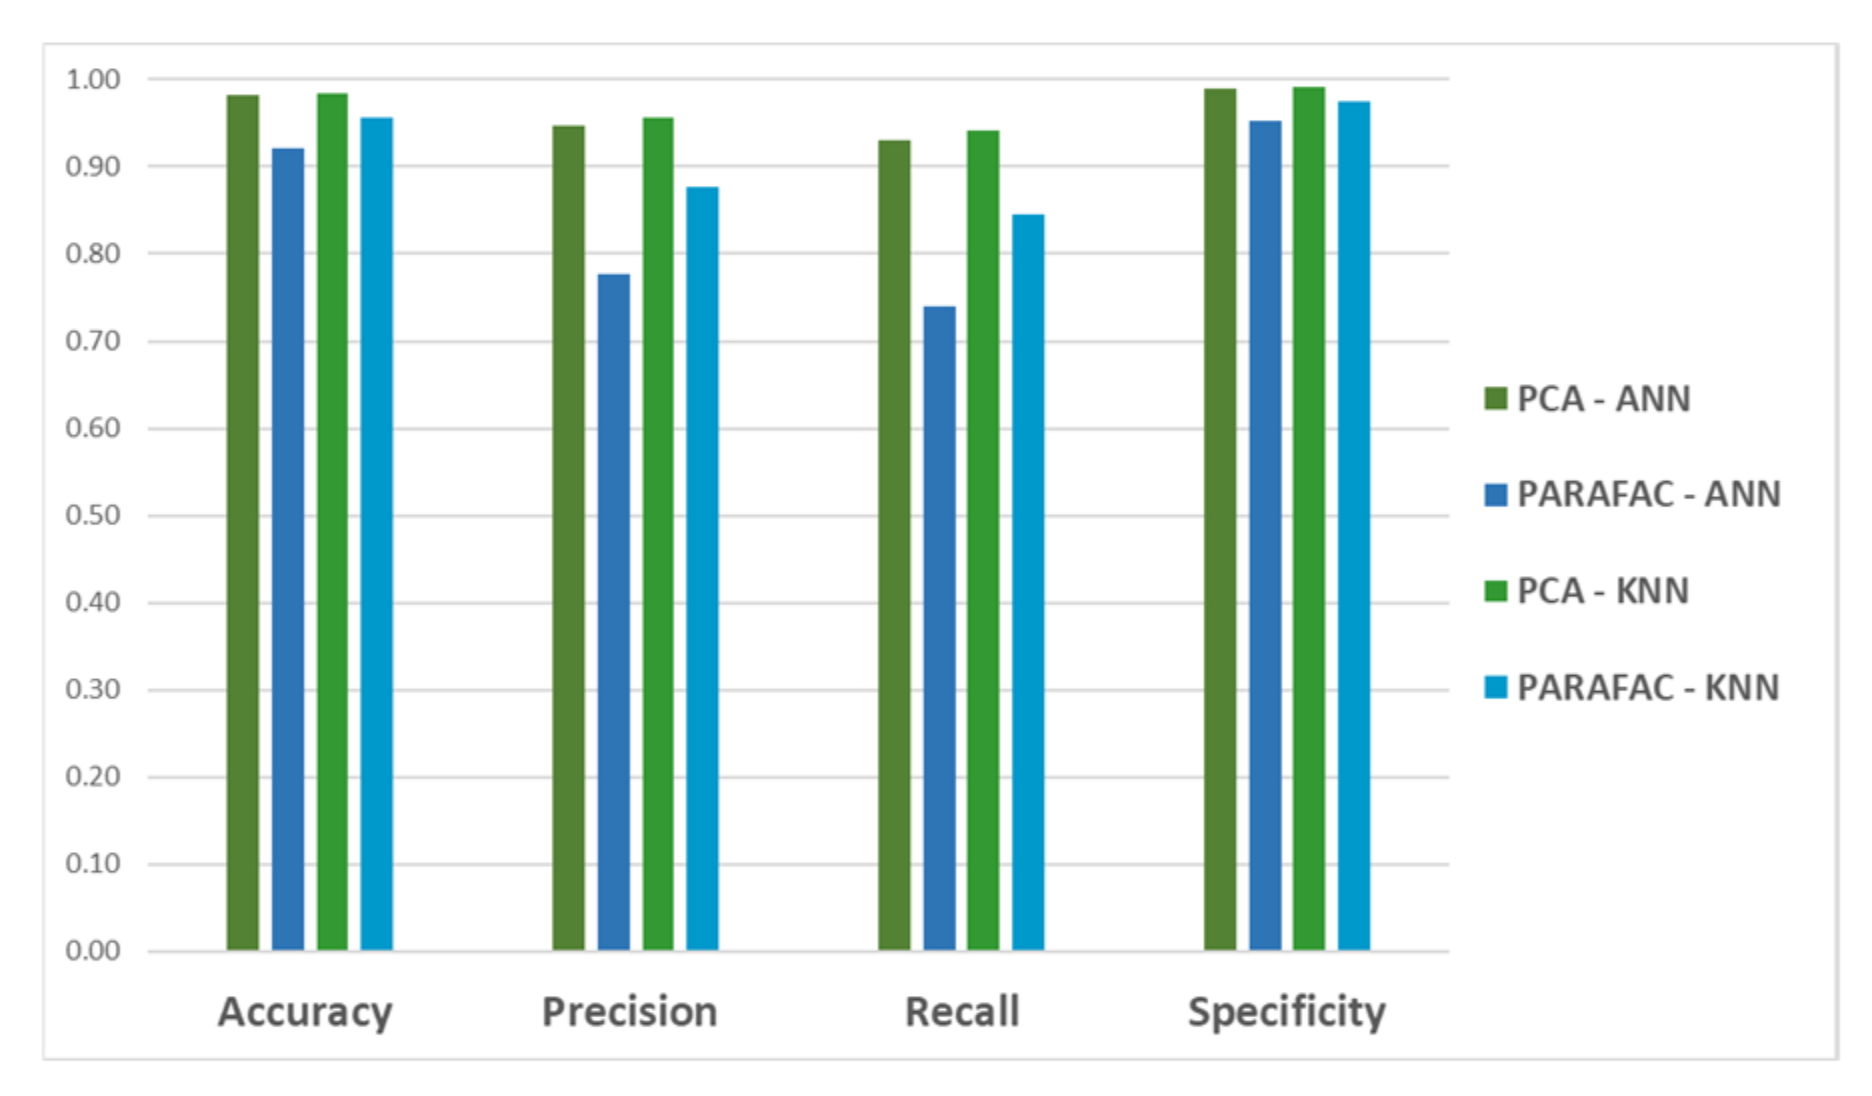
3. Results and Discussion
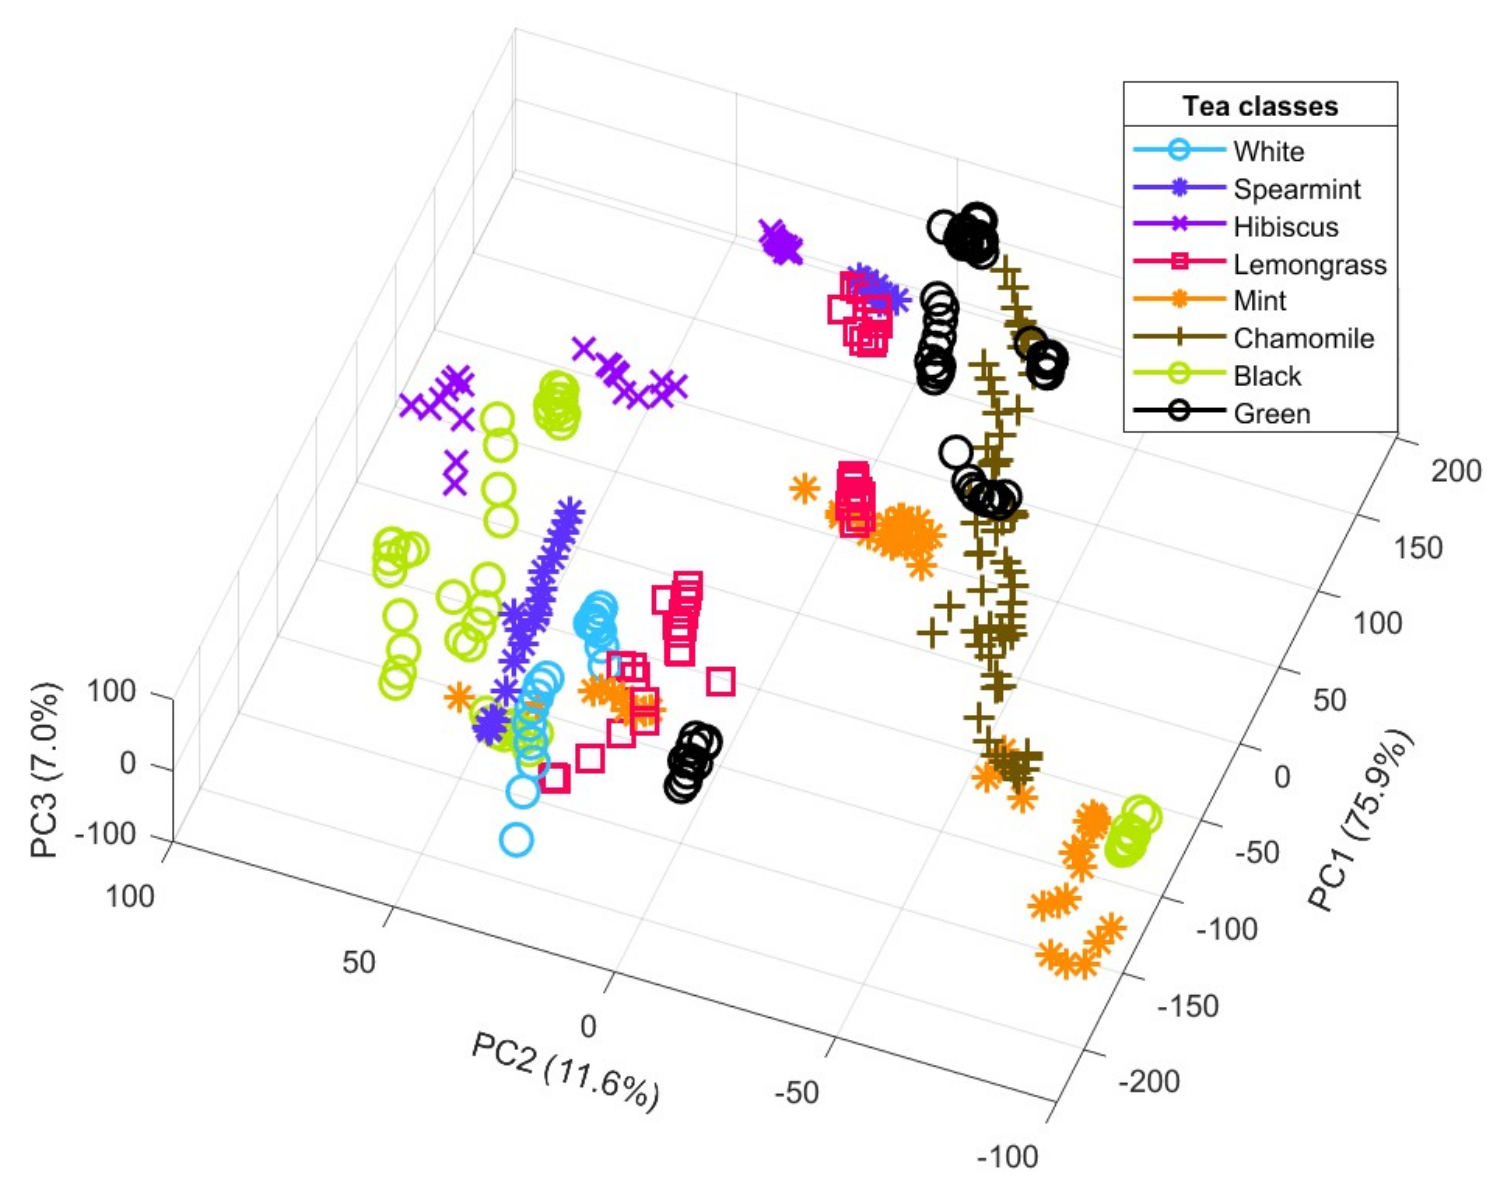
Data processing was performed on an AMD Ryzen computer. Different algorithms were written by the authors in MATLAB (Math Work, Natick, MA, USA, version R2022b) using two different toolboxes for the routines: Machine Learning Toolbox v12.0 and Deep Learning Toolbox v14.1. In addition, Eigenvector PLS_toolbox v7.8 was used to calculate PARAFAC components.

3.1. PCA Results

Data were organized in a two-dimensional array for PCA, with the rows denoting teas and the columns denoting measurements for each sensor. In this way, PCA was applied to a matrix of dimensions of 340 × 17,493. Figure 1 shows a PCA plot with the first three PCs, representing an accumulated explained variance of ca. 94.6%. As observed, different clusters are partially identified as the eight tea classes measured using MOXs. Considering that the first three components failed to achieve the recommended 95% of the accumulated explained variance [16], a total of four PCs (ca. 96.8%) were used to feed the classification models.

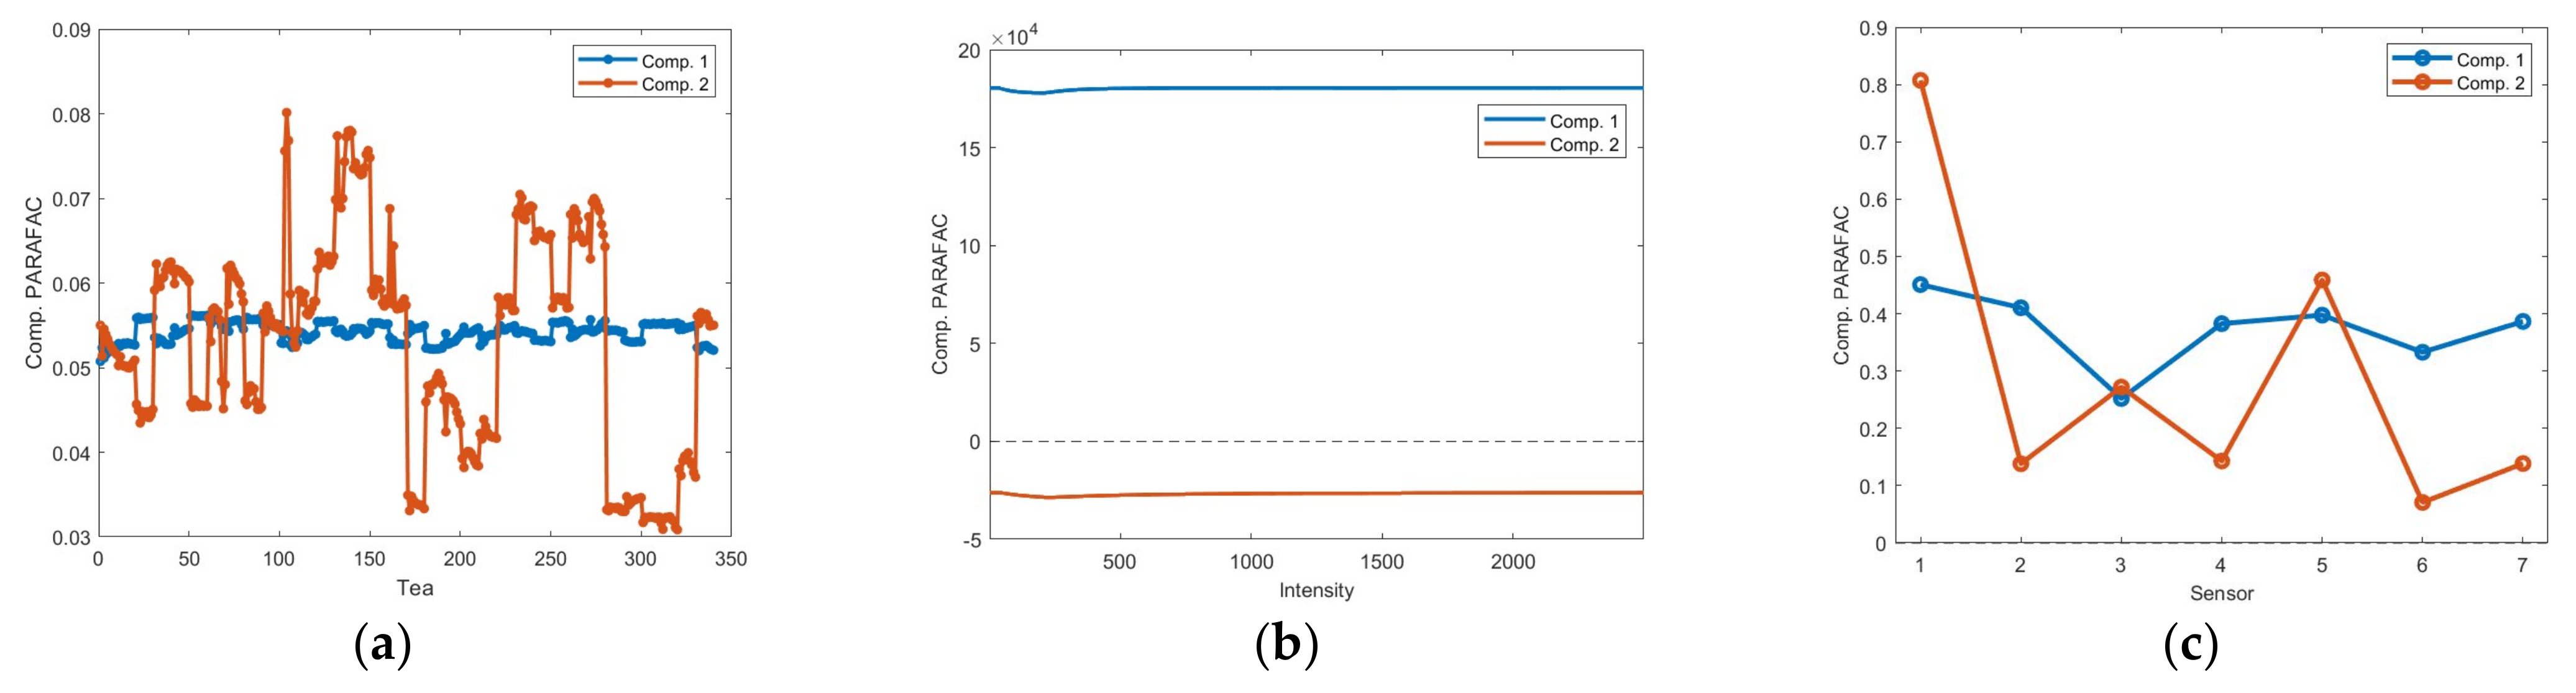
3.2. PARAFAC Results

PARAFAC analysis was performed on the formed tridimensional matrix described in Section 2.1. To choose the appropriate number of components, a CORCONDIA evaluation was performed, achieving a core consistency value of 99.2%. This result was close to the 100% described in the literature [12]. Figure 2 shows the PARAFAC components of each loading matrix. The tea loadings represent tea variability; the intensity matrix shows changes in voltage values; finally, the sensor loadings describe the responses of each sensor. As can be seen, in order of importance, the obtained loading can be listed as follows: 1. Loadings for sensor; 2. Loadings for tea; 3. Loadings for intensities. The loadings for the sensor have the highest values and indicate which of the sensors contributes the most to detecting the teas. Sensors 1 and 5 (MQ-7 and MQ-9) for component 2 provide the most, according to Figure 2c. Then, the loadings for tea indicate which teas are dominant in each component. In this case, the teas with the highest loadings for component 2 are the most influential. Therefore, sensors 1 and 5 contribute to the detection of such teas. The loadings for intensities are less representative. In this case, component 1 is significantly predominant over component 2, and most of the intensities contribute equally.
PCA and PARAFAC data features were employed to feed pattern recognition models. Either the ANN architectures or the parameters of k-NN were selected from initial proposals and tuned through an iterative process. Optimized models were verified using the 10 k-fold cross-validation technique.
Final ANN architectures were composed of six layers (4 × 35 × 40 × 14 × 5 × 1) using PCs and (2 × 30 × 40 × 20 × 5 × 1) considering PARAFAC components. The first layer corresponded to input data and the last to tea classes. Both architectures employed logsig, tansig, logsig, logsig, tansig, and purelin activation functions, respectively. Both models were adjusted by applying a resilient backpropagation training algorithm and defining the proper learning rate and error values. In this way, such values for PCA–ANN were 0.002 and 0.02; meanwhile, for PARAFAC–ANN, they were 0.09 and 0.09, respectively.
A 10-fold cross-validation procedure was performed to validate the classification capability of the models. Each k-fold uses the same fit criterion, where the weights and biases were initialized randomly before the training process. Each result was saved and averaged and class metrics were calculated. Table 1 shows the mean confusion matrix and performance metrics results for PCA–ANN and PARAFAC–ANN.
Lastly, k-NN modeling was implemented using the Euclidean distance by defining three neighbors to classify different types of tea. As in the case of ANN models, a k-fold cross-validation was carried out to reveal the variability of model classification against different dataset sequences. Table 2 shows the mean confusion matrix and performance metrics results for PCA–k-NN and PARAFAC–k-NN.
The reported tables show that the classes with the highest accuracy were white tea with 100% for PCA–ANN, 99% for PARAFAC–ANN, 100% for PCA–k-NN, and 99% for PARAFAC–k-NN and green tea with 99% for PCA–ANN, 96% for PARAFAC–ANN, 100% for PCA–k-NN, and 96% for PARAFAC–k-NN. In comparison, black tea generally remained above 94%. The above metrics denote that the models correctly identify the different types of tea. Nevertheless, the algorithm occasionally mislabels the samples since the teas are extracted from the same plant and some share specific VOCs. The difference between them is the manufacturing process, which provides chemical changes [17] On the other hand, the algorithms fail to identify whether the tea is hibiscus or lemongrass, likely because they share VOCs such as linalool, limonene, and hexanal, among others [18,19].
Figure 3 shows the average performance metrics for every model, exhibiting the difference between models and the achieved rates per metric. As can be observed, higher metrics were obtained using a combination of PCA–ANN and PCA–k-NN; the accuracy for both pattern recognition algorithms is above 98%, suggesting that PCA successfully extracts the most relevant information for the classification in this dataset. On the other hand, the combinations with PARAFAC achieved the lowest metrics, possibly because three-dimensional analysis includes irrelevant information about the data rather than meaningful features, as shown in Figure 2b.

4. Conclusions

In this work, two feature extraction methods, PCA and PARAFAC, and two classification techniques, ANN and k-NN, were compared to provide information about the processing techniques employed to enhance the classification accuracy of the e-nose in predicting eight types of tea and infusions instead of focusing on one type of tea (black or green tea), as is conventional in other works. The obtained classification results show that feature extraction using PCA yields superior metrics than using PARAFAC components; this was corroborated by the results of the PCA–ANN combination, which achieved the highest accuracy. This fact is mainly related to particularities in the dataset, and we know this because PARAFAC found that one of the dimensions of the information (intensities) is not representative. Therefore, using only the variance as the main feature allows better data evaluation. Although both techniques focused on discrimination tasks related to qualitative analyses, current results encourage the study of the quantitative analyses of chemical species, considering the content of VOCs in tea. In this way, e-noses could be sensitive to the mixture of VOCs per tea, allowing their possible quantification from acquired MOX signals. The combination of an appropriate sensor array and a processing system gives the e-noses competitive systems with which to evaluate and identify food products instead of using standard methods. The shift toward advanced sensory technologies underlines not only the importance of this line of research but also its potential for improving both qualitative and—in future works—quantitative evaluation in the field of tea and herbal infusion classification.

Author Contributions

Experimental methodology, research, writing, and figures, I.J.-L. and J.M.-Q.; research, conceptualization, supervision, writing-review and editing, J.M.G. All authors have read and contributed to revising the paper. All authors have read and agreed to the published version of the manuscript.

Funding

Irari Jiménez-López (No. CVU: 1076736) and Jeniffer Molina-Quiroga (No. CVU: 861491) express their gratitude to the Mexican National Council of Humanities, Science and Technology (CONAHCYT) for financially supporting this work through a Master and PhD scholarship.

Institutional Review Board Statement

Not applicable.

Informed Consent Statement

Not applicable.

Data Availability Statement

Not applicable.

Acknowledgments

The authors express their gratitude to CINVESTAV-IPN for providing the experimentation facilities and specially to Luis Valdez.

Conflicts of Interest

The authors declare no conflict of interest.

References

  1. Ponce, M.d.V.; Cina, M.; López, C.; Cerutti, S. Polyurethane Foam as a Novel Material for Ochratoxin A Removal in Tea and Herbal Infusions–A Quantitative Approach. Foods 2023, 12, 1828. [Google Scholar] [CrossRef]
  2. Tang, G.Y.; Meng, X.; Gan, R.Y.; Zhao, C.N.; Liu, Q.; Feng, Y.B.; Li, S.; Wei, X.L.; Atanasov, A.G.; Corke, H.; et al. Health Functions and Related Molecular Mechanisms of Tea Components: An Update Review. Int. J. Mol. Sci. 2019, 20, 6196. [Google Scholar] [CrossRef] [PubMed]
  3. Liu, Y.; Guo, C.; Zang, E.; Shi, R.; Liu, Q.; Zhang, M.; Zhang, K.; Li, M. Review on herbal tea as a functional food: Classification, active compounds, biological activity, and industrial status. J. Future Foods 2023, 3, 206–219. [Google Scholar] [CrossRef]
  4. Chen, W.; Hu, D.; Miao, A.; Qiu, G.; Qiao, X.; Xia, H.; Ma, C. Understanding the aroma diversity of Dancong tea (Camellia sinensis) from the floral and honey odors: Relationship between volatile compounds and sensory characteristics by chemometrics. Food Control 2022, 140, 109103. [Google Scholar] [CrossRef]
  5. Yousefbeyk, F.; Ebrahimi-Najafabadi, H.; Dabirian, S.; Salimi, S.; Baniardalani, F.; Azmian Moghadam, F.; Ghasemi, S. Phytochemical Analysis and Antioxidant Activity of Eight Cultivars of Tea (Camellia sinensis) and Rapid Discrimination with FTIR Spectroscopy and Pattern Recognition Techniques. Pharm. Sci. 2023, 29, 100–110. [Google Scholar] [CrossRef]
  6. Persaud, K.; Dodd, G. Analysis of discrimination mechanisms in the mammalian olfactory system using a model nose. Nature 1982, 299, 352–355. [Google Scholar] [CrossRef] [PubMed]
  7. Covington, J.A.; Marco, S.; Persaud, K.C.; Schiffman, S.S.; Nagle, H.T. Artificial Olfaction in the 21st Century. IEEE Sens. J. 2021, 21, 12969–12990. [Google Scholar] [CrossRef]
  8. Padilla, M.; Montoliu, I.; Pardo, A.; Perera, A.; Marco, S. Feature extraction on three way enose signals. Sens. Actuators B Chem. 2006, 116, 145–150. [Google Scholar] [CrossRef]
  9. Valdez, L.F.; Gutiérrez, J.M. Chocolate Classification by an Electronic Nose with Pressure Controlled Generated Stimulation. Sensors 2016, 16, 1745. [Google Scholar] [CrossRef] [PubMed]
  10. Jolliffe, I.T. Introduction. In Principal Component Analysis, 2nd ed.; Springer: New York, NY, USA, 2006; pp. 1–6. [Google Scholar]
  11. Acar, E.; Yener, B. Unsupervised Multiway Data Analysis: A Literature Survey. IEEE Trans. Knowl Data Eng. 2009, 21, 6–20. [Google Scholar] [CrossRef]
  12. Bro, R.; Kiers, H.A.L. A new efficient method for determining the number of components in PARAFAC models. J. Chemom. 2003, 17, 274–286. [Google Scholar] [CrossRef]
  13. Mahmood, L.; Ghommem, M.; Bahroun, Z. Smart Gas Sensors: Materials, Technologies, Practical Applications, and Use of Machine Learning—A Review. J. Appl. Comput. Mech. 2023, 9, 775–803. [Google Scholar] [CrossRef]
  14. Kaushal, S.; Nayi, P.; Rahadian, D.; Chen, H.-H. Applications of Electronic Nose Coupled with Statistical and Intelligent Pattern Recognition Techniques for Monitoring Tea Quality: A Review. Agriculture 2022, 12, 1359. [Google Scholar] [CrossRef]
  15. Hossin, M.; Sulaiman, M.N. A Review on Evaluation Metrics for Data Classification Evaluations. Int. J. Data Min. Knowl. Manag. Process 2015, 5, 1–11. [Google Scholar] [CrossRef]
  16. Li, B.; Gu, Y. A Machine Learning Method for the Quality Detection of Base Liquor and Commercial Liquor Using Multidimensional Signals from an Electronic Nose. Foods 2023, 12, 1508. [Google Scholar] [CrossRef] [PubMed]
  17. Wong, M.; Sirisena, S.; Ng, K. Phytochemical profile of differently processed tea: A review. J. Food Sci. 2022, 87, 1925–1942. [Google Scholar] [CrossRef] [PubMed]
  18. Jirovetz, L.; Jaeger, W.; Remberg, G.; Espinosa-Gonzalez, J.; Morales, R.; Woidich, A.; Nikiforov, A. Analysis of the volatiles in the seed oil of Hibiscus sabdariffa (Malvaceae) by means of GC-MS and GC-FTIR. J. Agric. Food Chem. 1992, 40, 1186–1187. [Google Scholar] [CrossRef]
  19. Skaria, B.P.; Joy, P.P.; Mathew, S.; Mathew, G.; Joseph, A.; Joseph, R. Major Sources of Aromatic Oils. In Aromatic Plants, 1st ed.; New India Publishing Agency: New Delhi, India, 2007; pp. 100–109. [Google Scholar]
Figure 1. PCA score plot of the three first components from eight tea classes.
Engproc 48 00020 g001
Figure 2. PARAFAC results: loadings for (a) tea, (b) intensities, and (c) sensor.
Engproc 48 00020 g002
Figure 3. Metric comparison of all the classification models.
Engproc 48 00020 g003
Table 1. Confusion matrix and classification rate of PCA and PARAFAC using ANN.
ClassesWhiteSpearmi.HibiscusLemong.MintChamomi.BlackGreenCR
FE1*FE2**FE1FE2FE1FE2FE1FE2FE1FE2FE1FE2FE1FE2FE1FE2FE1FE2
True classWhite100900100000000000001.000.99
Spearmint009086.6103.3010000000000.990.96
Hibiscus003.36.686.6606.66.602006.63.30000.970.93
Lemongrass00057.512.58557.57.517.507.500000.970.87
Mint000002220945841604000.980.85
Chamomile0000000508.393.37558.31.63.30.980.88
Black000000020801210074040.980.91
Green000000000001.658.395900.990.96
Total0.980.92
Predicted class
FE1* = PCA. FE2** = PARAFAC. CR = classification rate.
Table 2. Confusion matrix and classification rate of PCA and PARAFAC using k-NN.
ClassesWhiteSpearmi.HibiscusLemong.MintChamomi.BlackGreenC.R.
FE1*FE2**FE1FE2FE1FE2FE1FE2FE1FE2FE1FE2FE1FE2FE1FE2FE_1FE_2
True classWhite10095000005000000001.000.99
Spearmint001009000010000000000.990.98
Hibiscus003.309073.303.3013.306.66.63.3000.990.97
Lemongrass02.57.57.5008077.512.510000002.50.970.94
Mint00200226927800414000.970.91
Chamomile00000003.30091.686.6008.3100.980.95
Black000000000160010084000.990.95
Green000000000008.30010091.60.980.96
Total0.980.96
Predicted class
FE1* = PCA. FE2** = PARAFAC.
Disclaimer/Publisher’s Note: The statements, opinions and data contained in all publications are solely those of the individual author(s) and contributor(s) and not of MDPI and/or the editor(s). MDPI and/or the editor(s) disclaim responsibility for any injury to people or property resulting from any ideas, methods, instructions or products referred to in the content.

