1. Introduction
The quality of milk is determined by the quantitative content of its nutrients. The amount of fat in milk is an indicator of various cow diseases, such as ketosis [
1] or acidosis [
2]. Therefore, the fat content must be monitored carefully during milk collection and throughout all stages of dairy production.
There are various methods for determining the fat content in milk. Chemical methods are commonly applied, e.g., the Gerber method [
3] and the Röse-Gottlieb method [
4]. Optical spectroscopy in the mid-infrared region [
5] has gained popularity among the instrumental methods of milk analysis. However, despite their high analytical accuracy, these methods are complex, labor-intensive, and expensive. The development of new simple and inexpensive analyzers for fast and accurate analysis is an urgent task in the dairy industry.
The visible and short-wave near-infrared (Vis/SW-NIR) region is the most promising for milk analysis [
6,
7,
8,
9] because it is possible to create easy-to-use and cost-effective devices that function in this spectral region consisting of light-emitting diodes (LED), optical fibers, 3D-printed parts, and photodetectors [
10,
11,
12,
13,
14]. The possibility of using the 400–1100 nm region for the determination of fat and protein content has been shown in our previous work [
9].
In the present study, a novel RGB sensor composed of three LEDs, a photoresistor, and the Arduino Nano microcontroller was developed to quantify fat in milk [
15]. The proposed prototype was applied for analysis of homogenized and raw milk. A linear regression model, partial least-squares (PLS) regression, and multiple linear regression (MLR) were tested and compared to assess the sensor performance. This simplified technology showed an acceptable determination accuracy of fat content in milk and can be further used for milk quality control.
2. Materials and Methods
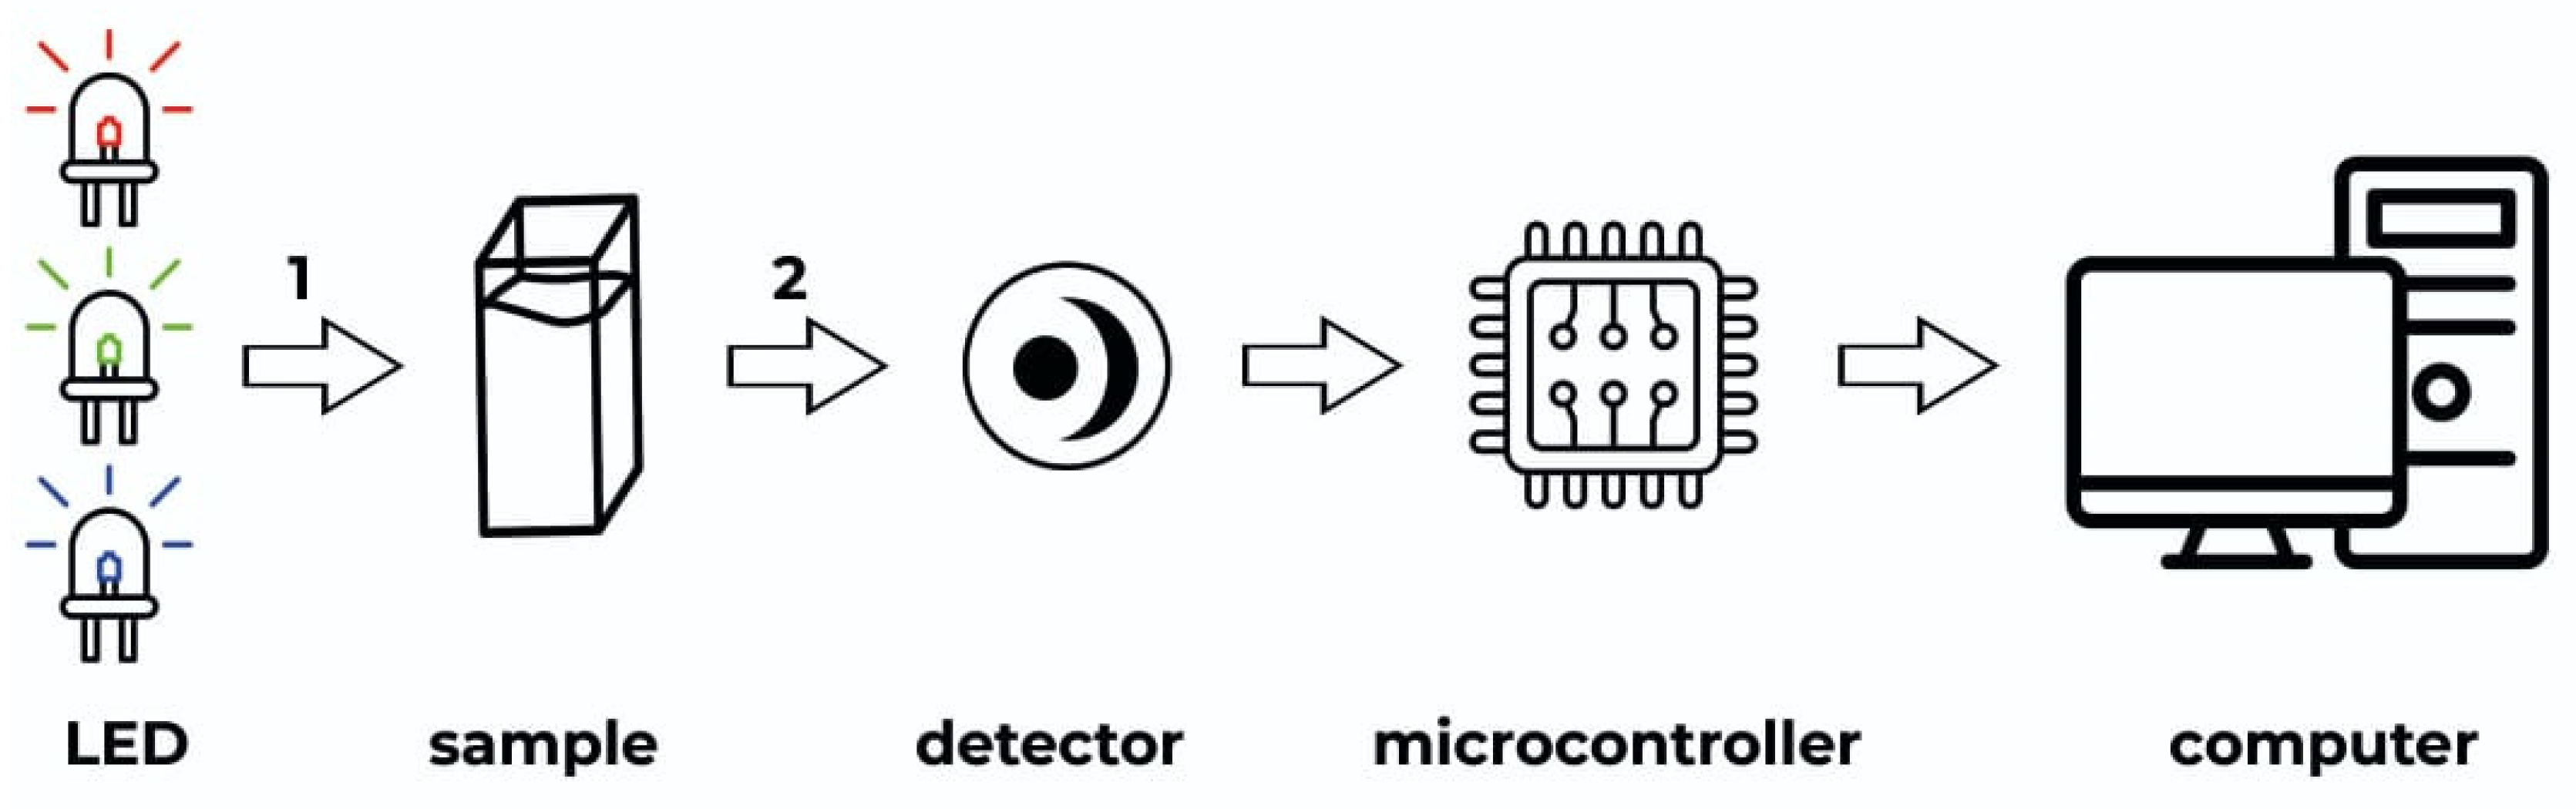
The developed LED sensor consists of several modules and operates in an automatic mode provided by the Arduino Nano microcontroller. Red (R), green (G), and blue (B) LEDs are used as a light source. A photoresistor detects light passing through the sample. The initial analytical signal is the voltage drop generated at the photoresistor output. The data are then transferred to a computer using the serial port of the microcontroller via a USB cable for further data analysis.
Two calibration sets of milk samples were prepared to test the capability of the developed analyzer to determine the fat content in milk. The first one was prepared by mixing two packages of normalized cow’s milk with different fat content purchased from a supermarket. The full dataset consists of 10 samples with varying fat content from 1.5 to 3.2% with a 0.19% step. The second set consisted of twenty-nine raw milk samples obtained from the Samara Oblast Agro-Industrial Complex Support Center (Samara, Russia). The fat content in these samples ranged from 3.1 to 6.01%. A tablet of Broad Spectrum Microtabs II preservative was added to the milk samples to prevent spoilage, giving the samples a pink color. Reference analysis of fat content in raw milk was performed on a CombiFossTM7 (FOSS Electric, Hilleroed, Denmark).
The sensor prototype works as follows. A milk sample with a volume of 3 mL is placed in a glass cuvette with an optical path of 10 mm. The cuvette is inserted into the slot and covered with a lid from above, and the examined sample is alternately illuminated with three LEDs. A USB cable is used to connect the sensor to a computer and a serial port monitor is displayed. The detected data are digitized, filtered by averaging, and tabulated to the port every 100 ms. The power of the light passing through the cuvette with the sample is proportional to the value of the output data. The detected signals reflect alternating pulses of LED irradiation at different wavelengths with the emission maxima at 631 nm for the red, 531 nm for the green, and 466 nm for the blue channels.
To test the reproducibility of the measurement, a new portion of milk from each sample was taken and measured three times. Each measurement took about 10 s, because the sensor outputs the readings continuously, and thus, 10 measurements were taken and averaged. Next, the three measurements were also averaged. Therefore, one sample is represented by one measurement in the regression models.
To relate the analytical signal response of the LED sensor to the fat content, the calibration models were trained using a linear regression for individual sensor channels, PLS regression [
16], and MLR [
17] for a combination of three channels. The performance of PLS and MLR models was estimated by leave-one-out cross-validation (CV). Root mean-square error (RMSE) of calibration (RMSEC) and cross-validation (RMSECV), as well as the coefficients of determination (R
2), were used to compare the model performances.
3. Results
In accordance with the proposed experimental setup (
Figure 1), the light from three LEDs alternately illuminated the milk sample and the transmitted light was registered with a single photometric detector. The voltage from the detector was then read using the microcontroller and transmitted to the computer.
The responses of the RGB LED sensor for the homogenized milk dataset are shown in
Figure 2. It can be seen that the samples in
Figure 2 lie presumably in the order of increasing fat content for all three channels, although the distribution is more uniform for the red channel.
Firstly, the univariate regression models were built to find the relationship between the response of each channel and fat content. The linear regression equation relating the sensor response and the fat content for the red channel is y = 522.87x + 10938 with R2 = 0.98, for the green channel it is y = 489.6x + 13556 with R2 = 0.94, and for the blue channel it is y = 286.62x + 16756 with R2 = 0.71. Thus, the red channel was the most sensitive to milk fat content, the green channel performed slightly worse, and the blue channel was the least informative.
The next step of the study was to apply multivariate regression methods, such as PLS and MLR, to relate the response for all three channels to fat content. The difference in the size distribution of colloidal milk particles, especially fat globules, influences the spectra, as was shown in our previous work [
9]. The combination of different wavelengths allows us to take this effect into account and obtain adequate models. The combination of the three channels led to significant improvement of PLS prediction accuracy compared to univariate models: RMSECV was 0.08% with R
2CV = 0.98 (
Figure 3A). The validation statistics of MLR (RMSECV = 0.10% and R
2CV = 0.97) were very similar to PLS regression and, thus, the algorithm can also be successfully used to analyze data from optical multisensor systems, confirming our previous statements [
18].
A calibration set of raw milk samples was measured using the developed RGB sensor, and 4 evident outliers were removed from 29 milk samples at the preliminary modelling stage. The PLS statistics (
Figure 3B) for the three sensor channels were also better (RMSECV = 0.37% and R
2CV = 0.72), as in the case of homogenized milk, than individual sensor channel results. The worse PLS statistics for the raw milk could be related to the large variation in fat globule size in natural raw milk, which increases the wavelength dependence of light scattering [
9]. The presence of a preservative that gave the samples a pink color presented an additional complexity. In addition, the content of other milk components such as protein and lactose also varied. At this high level of complexity, a much larger number of samples are required to train a calibration model, but building a global model was not the goal of the present study.
4. Conclusions
A portable desktop analyzer for the determination of fat content in milk has been developed using cost-effective components: LEDs, a photoresistor, an Arduino Nano microcontroller, and a few other easily available components. Homogenized and raw milk sample sets were used to test the performance of the developed sensor within the task of fat content determination. The univariate models relating the response of each channel and fat content showed that the red channel was the most informative. The combination of the three channels gave significantly better PLS statistics. MLR can also be successfully used to analyze multisensor data when the number of samples is smaller than the number of variables (wavelengths).
The prototype was deliberately constructed for the most practicable visible light region. The RGB analysis can also be used any digital camera images [
19] even smartphone-based. Further improvements of the sensor prototype include optimization of the number and central wavelengths of the LEDs and expansion of the spectral region towards the NIR and mid-infrared.
Author Contributions
Conceptualization, A.B. and I.I.; methodology, I.I. and A.S.; formal analysis, A.S., A.P. and J.K.; investigation, A.S., A.P., M.S., Y.S., N.S. and J.K.; data curation, A.S. and A.B.; writing—original draft preparation, M.S., A.S., A.B. and I.I.; visualization, A.S. and M.S.; supervision, A.B., I.I. and A.S. All authors have read and agreed to the published version of the manuscript.
Funding
The work was supported by the Ministry of Science and Higher Education of the Russian Federation (theme No. FSSE-2023-0003) as part of the state task of the Samara State Technical University.
Institutional Review Board Statement
Not applicable.
Informed Consent Statement
Not applicable.
Data Availability Statement
Not applicable.
Acknowledgments
The authors would like to thank the Samara Oblast Agro-Industrial Complex Support Center for providing research milk samples.
Conflicts of Interest
The authors declare no conflict of interest.
References
- Heuer, C.; Schukken, Y.H.; Dobbelaar, P. Postpartum body condition score and results from the first test day milk as predictors of disease, fertility, yield, and culling in commercial dairy herds. J. Dairy Sci. 1999, 82, 295–304. [Google Scholar] [CrossRef] [PubMed]
- Plaizier, J.C.; Krause, D.O.; Gozho, G.N.; McBride, B.W. Subacute ruminal acidosis in dairy cows: The physiological causes, incidence and consequences. Vet. J. 2008, 176, 21–31. [Google Scholar] [CrossRef] [PubMed]
- ISO 11870:2009; Milk and Milk Products—Determination of Fat Content—General Guidance on the Use of Butyrometric Methods. ISO: Geneva, Switzerland, 2009. Available online: https://www.iso.org/obp/ui/#iso:std:iso:11870:ed-2:v1:en (accessed on 15 June 2023).
- ISO 8381:2000; Milk-Based Infant Foods—Determination of Fat Content—Gravimetric Method. ISO: Geneva, Switzerland, 2000. Available online: https://www.iso.org/ru/standard/27796.html?browse=tc (accessed on 15 June 2023).
- ISO 9622:2013|IDF 141:2013; Milk and Liquid Milk Products—Guidelines for the Application of Mid-Infrared Spectrometry. ISO: Geneva, Switzerland, 2013. Available online: https://www.iso.org/standard/56874.html (accessed on 15 June 2023).
- Tsenkova, R.; Atanassova, S.; Ozaki, Y.; Toyoda, K.; Itoh, K. Near-infrared spectroscopy for biomonitoring: Influence of somatic cell count on cow’s milk composition analysis. Int. Dairy J. 2001, 11, 779–783. [Google Scholar] [CrossRef]
- Šašić, S.; Ozaki, Y. Short-wave near-infrared spectroscopy of biological fluids. 1. Quantitative analysis of fat, protein, and lactose in raw milk by partial least-squares regression and band assignment. Anal. Chem. 2001, 73, 64–71. [Google Scholar] [CrossRef] [PubMed]
- Kalinin, A.V.; Krasheninnikov, V.N. Portable milk product quality analyzer based on spectrometry in the near IR range. J. Appl. Spectrosc. 2008, 75, 288–294. [Google Scholar] [CrossRef]
- Bogomolov, A.; Melenteva, A. Scatter-based quantitative spectroscopic analysis of milk fat and total protein in the region 400–1100 nm in the presence of fat globule size variability. Chemom. Intell. Lab. Syst. 2013, 126, 129–139. [Google Scholar] [CrossRef]
- Prasanth, P.; Viswan, G.; Bennaceur, K. Development of a low-cost portable spectrophotometer for milk quality analysis. Mater. Today 2021, 46, 4863–4868. [Google Scholar] [CrossRef]
- Angrasari, F.; Arifin, A.; Abdullah, B. Fabrication of milk fat sensor based on plastic optical fiber. J. Phys. Conf. Ser. 2019, 1341, 082038. [Google Scholar] [CrossRef]
- Ragni, L.; Iaccheri, E.; Cevoli, C.; Berardinelli, A. Spectral-sensitive pulsed photometry to predict the fat content of commercialized milk. J. Food Eng. 2016, 171, 95–101. [Google Scholar] [CrossRef]
- Yang, B.; Guo, W.; Liang, W.; Zhou, Y.; Zhu, X. Design and evaluation of a miniature milk quality detection system based on UV/Vis spectroscopy. J. Food Compos. Anal. 2022, 106, 104341. [Google Scholar] [CrossRef]
- Yang, B.; Huang, X.; Yan, X.; Zhu, X.; Guo, W. A cost-effective on-site milk analyzer based on multispectral sensor. Comput. Electron. Agric. 2020, 179, 105823. [Google Scholar] [CrossRef]
- Surkova, A.; Shmakova, Y.; Salukova, M.; Samokhina, N.; Kostyuchenko, J.; Parshina, A.; Ibatullin, I.; Artyushenko, V.; Bogomolov, A. LED-Based Desktop Analyzer for Fat Content Determination in Milk. Sensors 2023, 23, 6861. [Google Scholar] [CrossRef] [PubMed]
- Wold, S.; Sjöström, M.; Eriksson, L. PLS-regression: A basic tool of chemometrics. Chemom. Intell. Lab. Syst. 2001, 58, 109–130. [Google Scholar] [CrossRef]
- Esbensen, K.H. Multivariate Data Analysis—In Practice, 5th ed.; CAMO Process AS: Oslo, Norway, 2001. [Google Scholar]
- Surkova, A.; Bogomolov, A.; Legin, A.; Kirsanov, D. Calibration transfer for LED-based optical multisensor systems. ACS Sens. 2020, 5, 2587–2595. [Google Scholar] [CrossRef] [PubMed]
- Kucheryavskiy, S.; Melenteva, A.; Bogomolov, A. Determination of fat and total protein content in milk using conventional digital imaging. Talanta 2014, 121, 144–152. [Google Scholar] [CrossRef] [PubMed]
| Disclaimer/Publisher’s Note: The statements, opinions and data contained in all publications are solely those of the individual author(s) and contributor(s) and not of MDPI and/or the editor(s). MDPI and/or the editor(s) disclaim responsibility for any injury to people or property resulting from any ideas, methods, instructions or products referred to in the content. |
© 2023 by the authors. Licensee MDPI, Basel, Switzerland. This article is an open access article distributed under the terms and conditions of the Creative Commons Attribution (CC BY) license (https://creativecommons.org/licenses/by/4.0/).


 ,
, 


