Abstract
This study suggests using wearable activity trackers to identify mobility patterns in chronic complex patients (CCPs) and investigate their relation with the Barthel index (BI) to assess functional decline. CCPs are individuals who suffer from multiple, chronic health conditions that often lead to a progressive decline in their functional capacity. As a result, CCPs frequently require the use of healthcare and social resources, placing a significant burden on the healthcare system. Evaluating mobility patterns is critical for determining a CCP’s functional capacity and prognosis. To monitor the overall activity levels of CCPs, wearable activity trackers have been proposed. Utilizing the data gathered by the wearables, time series clustering with dynamic time warping (DTW) is employed to generate synchronized mobility patterns of the mean activity and coefficient of variation profiles. The research has revealed distinct patterns in individuals’ walking habits, including the time of day they walk, whether they walk continuously or intermittently, and their relation to BI. These findings could significantly enhance CCPs’ quality of care by providing a valuable tool for personalizing treatment and care plans.
1. Introduction
Chronic complex patients (CCPs) are characterized by a set of comorbidities that often lead to progressive functional decline, as well as increased use of healthcare and social resources. In addition, CCPs tend to be older adults with a high degree of polypharmacy, which can exacerbate underlying health conditions. The assessment of functional decline in CCPs can be an important tool for healthcare professionals to tailor treatment and care for these patients.
The mobility patterns observed in CCPs are linked to their functional capacity, determined by the Barthel index (BI) and, consequently, to their prognosis [1,2]. Given that modifications in CCPs’ mobility patterns can indicate changes in their functional status, they can serve as valuable prognostic factors. Therefore, the BI has been identified as a reliable measure of CCPs’ functional capacity and prognosis, highlighting the crucial role of mobility patterns in assessing and predicting CCPs’ clinical outcomes.
Taking this into account, the aim of this study is to examine the relationship between declining mobility and alterations in a patient’s clinical status. Given the importance of measuring activity levels, wearable activity trackers are proposed to assess the mobility of CCPs. In particular, the research sought to evaluate the various mobility patterns, derived from the data gathered, of CCPs and their connection to the BI. To accomplish this goal, the study was designed as a descriptive study. Ethical approval was obtained from the regional health organization before the study began.
The combination of synchronized mobility patterns with the BI is a unique and original approach that allows healthcare professionals to identify temporal variations in patient movement and underlying factors affecting patient mobility.
The study presented in this paper is part of the chronic-IoT project, which is a coordinated effort funded by the Ministry of Science, Innovation and Universities, through the 2019 Research Challenges call of the State Research Agency (ref. PID2019-110747RB-C21). With a duration of 36 months, from June 2020 to the end of May 2023, the work conducted in chronic-IoT is based on the development and validation of behavioral models, based on machine learning (ML) and the IoT environment, to predict changes in the functional capacity of CCPs through the analysis of mobility patterns measured by activity wristband devices.
This collaborative project involved the participation of two institutions in Spain: the Virgen del Rocío University Hospital (HUVR) in Seville and the Institute for Research in Technology (IIT) at ICAI School of Engineering (ICAI) of Universidad Pontificia Comillas in Madrid. As a coordinator, HUVR played a crucial role in the project, leveraging its expertise in healthcare to contribute to the research objectives. Meanwhile, IIT at ICAI brought its technological knowledge and research capabilities to the table, complementing HUVR’s strengths.
The present paper is organized as follows: Section 2 provides a literature review of prior research studies that investigated the utilization of wearable activity trackers and DTW time series clustering in medical contexts. Section 3 outlines the methodology employed in the research concerning data collection, data pre-processing and time series clustering. Section 4 presents the findings of the research, which are then followed by the conclusions in Section 5.
2. Literature Review
Over the years, the use of wearable activity trackers has garnered significant attention in the healthcare industry, particularly in the assessment of the physical conditions of patients. There have been many approaches to try to relate physical condition and wearables. Specially, as mentioned in [3], patient monitoring and behavioral changes are two main topics regarding the use of wearables in medical research. Wearables have the potential to provide continuous, objective, and non-invasive monitoring of a patient’s physiological parameters. Moreover, the validity of the measures taken by the wearables have been studied regarding steps taken [4], heart rate [5] or sleep quality [6]. Combined, this type of technology can aid in the early detection and management of chronic diseases, improving the overall health outcomes of patients.
As previously noted, two of the most extensively studied areas are patient monitoring and behavioral changes. Numerous studies have investigated the utility of wearable activity trackers as a tool for monitoring patient information. Within this domain, some studies have examined the feasibility of using wearables to monitor patients during rehabilitation [7,8]. Additionally, other studies have explored how data collected by wearable activity trackers can be leveraged to provide feedback that facilitates faster planning and intervention [9].
In the context of research on behavioral changes in relation to wearable technology, the most commonly explored approach involves investigating whether wearable activity trackers have a positive effect on physical activity [10]. However, there are relatively few articles that focus on the relationship between the data collected from wearables and the deterioration of patient health [11].
Regarding the wearable device used in this study, a commercially available device was utilized instead of a medical one. Similarly, ref. [12] examined the acceptance and usage of commercially available wearable activity trackers among adults over 50 with chronic illnesses. The study found that while participants generally perceived the devices as easy to use, they identified challenges in maintaining sustained use.
On the other hand, ML is considered one of the most prominent fields in light of the development of data-driven solutions aimed at gaining a better understanding of a variety of problems. In recent years, the utilization of ML has experienced exponential growth across diverse domains, including healthcare [13], finance [14], and marketing [15]. Among the different ML techniques available, time series analysis is the most relevant area for this paper’s objective, characterizing time variable mobility patterns. DTW is a widely adopted metric for measuring the distance between time series data, even if there are differences in length or phase. Originally introduced in the field of data mining [16], DTW has found numerous applications in various domains, including speech recognition and medicine.
In the field of biomedical signal processing, it has been used to analyze electrocardiograms (ECGs) to classify ECG frames [17,18]. In addition, DTW has been employed to cluster EEG waveforms, and has been demonstrated to be effective in discriminating between waves with minor disparities in frequency, amplitude, peak location, or initial phase [19]. In comparison to other methods that rely on waveform features or peak-aligned difference computation, DTW resulted in more homogeneous clusters, as demonstrated in experimental studies involving stimulated and actual EEG data.
DTW has also shown promise in applications related to human movement analysis, such as gait analysis. For example, ref. [20] used DTW to compare the gait patterns of patients with Parkinson’s disease and healthy controls, identifying significant differences between the two groups.
In addition, to the best of our knowledge, the methodology that integrates pattern mobilities with the BI represents a distinctive and original approach. Furthermore, a novel methodology based on cross-correlation is proposed for the synchronization of DTW mobility patterns, which are treated as circular data. This method allows for the identification of temporal variations in the movement of patients and enables the creation of a synchronized representation of these patterns, providing insights into the underlying factors that contribute to patient mobility. By utilizing this approach, healthcare professionals can better understand the progression of patient mobility and develop effective interventions to enhance patient outcomes.
3. Methodology
This section describes the methodology used to obtain the study results. It covers data collection and data pre-processing including aggregating and smoothing to generate the mean and coefficient of variation (CV) mobility profiles. These profiles are clustered using a K-means clustering algorithm based on DTW distances and a decision tree analysis is used to understand obtained patterns.
3.1. Data Collection
During the first phase of the study, patients were recruited based on their BI scores, measuring a patient’s ability to perform daily activities whereby higher scores indicate greater independence.The patients were divided into three groups based on their BI scores: those with total dependence (A) (BI ≤ 20), severe dependence (B) (BI in (20, 60]), and moderate/mild dependence or independence (C) (BI > 60). The study included a total of 36 patients from the Internal Medicine Department of the Virgen del Rocio University Hospital of Seville, all of whom met the criteria of chronic patients with complex health needs defined according to the Integrated Patient Care Process of the Andalusian Ministry of Health. Patients in a situation of agony, those with limited vital prognosis, and psychiatric or neurodegenerative diseases were excluded from the study. Moreover, some patients were excluded from the analysis due to a lack of data.
Out of the considered participants, 64% were male and 36% were female. It was found that 16/36 (≈44%) of the patients had BI of type B, while the other 20/36 (≈56%) had an BI of type C. No patients of index A were considered due to the limited range of movement. The mean age of male participants was 75.78 years (SD = 7.15), while the mean age of female participants was 74.69 years (SD = 9.82).
The second phase of the study involved the implementation of an Internet of Things (IoT) infrastructure to collect patient mobility measures. After careful consideration, the most appropriate technology for their needs was selected. The IoT-based infrastructure consisted of wearables to measure the mobility activities of patients, with a focus on minimizing disruption to their daily routines. Wearables allowed the researchers to measure physical activity through the number of steps taken, cardiac activity and the sleep time of the 36 patients in the study.
3.2. Data Pre-Processing
As previously indicated, the wearable activity tracker is capable of collecting information on a patient’s number of steps taken, heart rate, and sleep duration. The device automatically captures the number of steps and heart rate at irregular intervals, which are subsequently aggregated into fixed intervals to maintain consistent data granularity.
3.2.1. Activity Profiles Based on the Mean
To generate the mean activity profiles, the number of steps taken are added in one-hour intervals, and the median heart rate is computed for the same interval. Additionally, in an attempt to ensure data quality, in cases where the median heart rate is missing, the number of steps is also marked as empty. This procedure is implemented because a null heart rate value might indicate that the wearable device is not properly positioned, thereby possibly resulting in inaccurate measurements. In terms of sleep data, the activity tracker provides daily information on the total duration and quality of sleep, which is further categorized into multiple variables.
Based on data collected every hour over multiple days per each patient, the mean step profile is constructed. The mean steps profiles are generated after smoothing the time series. In order to smooth the time series, a centered rolling window with a size of three is computed. After this, data is grouped by the hour such that each patient has a mean representation of their activity throughout a 24 h period. The resulting data allows us to gain insights into a CCP’s physical activity levels and obtain a more accurate picture of their daily activity patterns as shown in Figure 1.

Figure 1.
Generation of the 24 h mean profiles for CIOTC5.
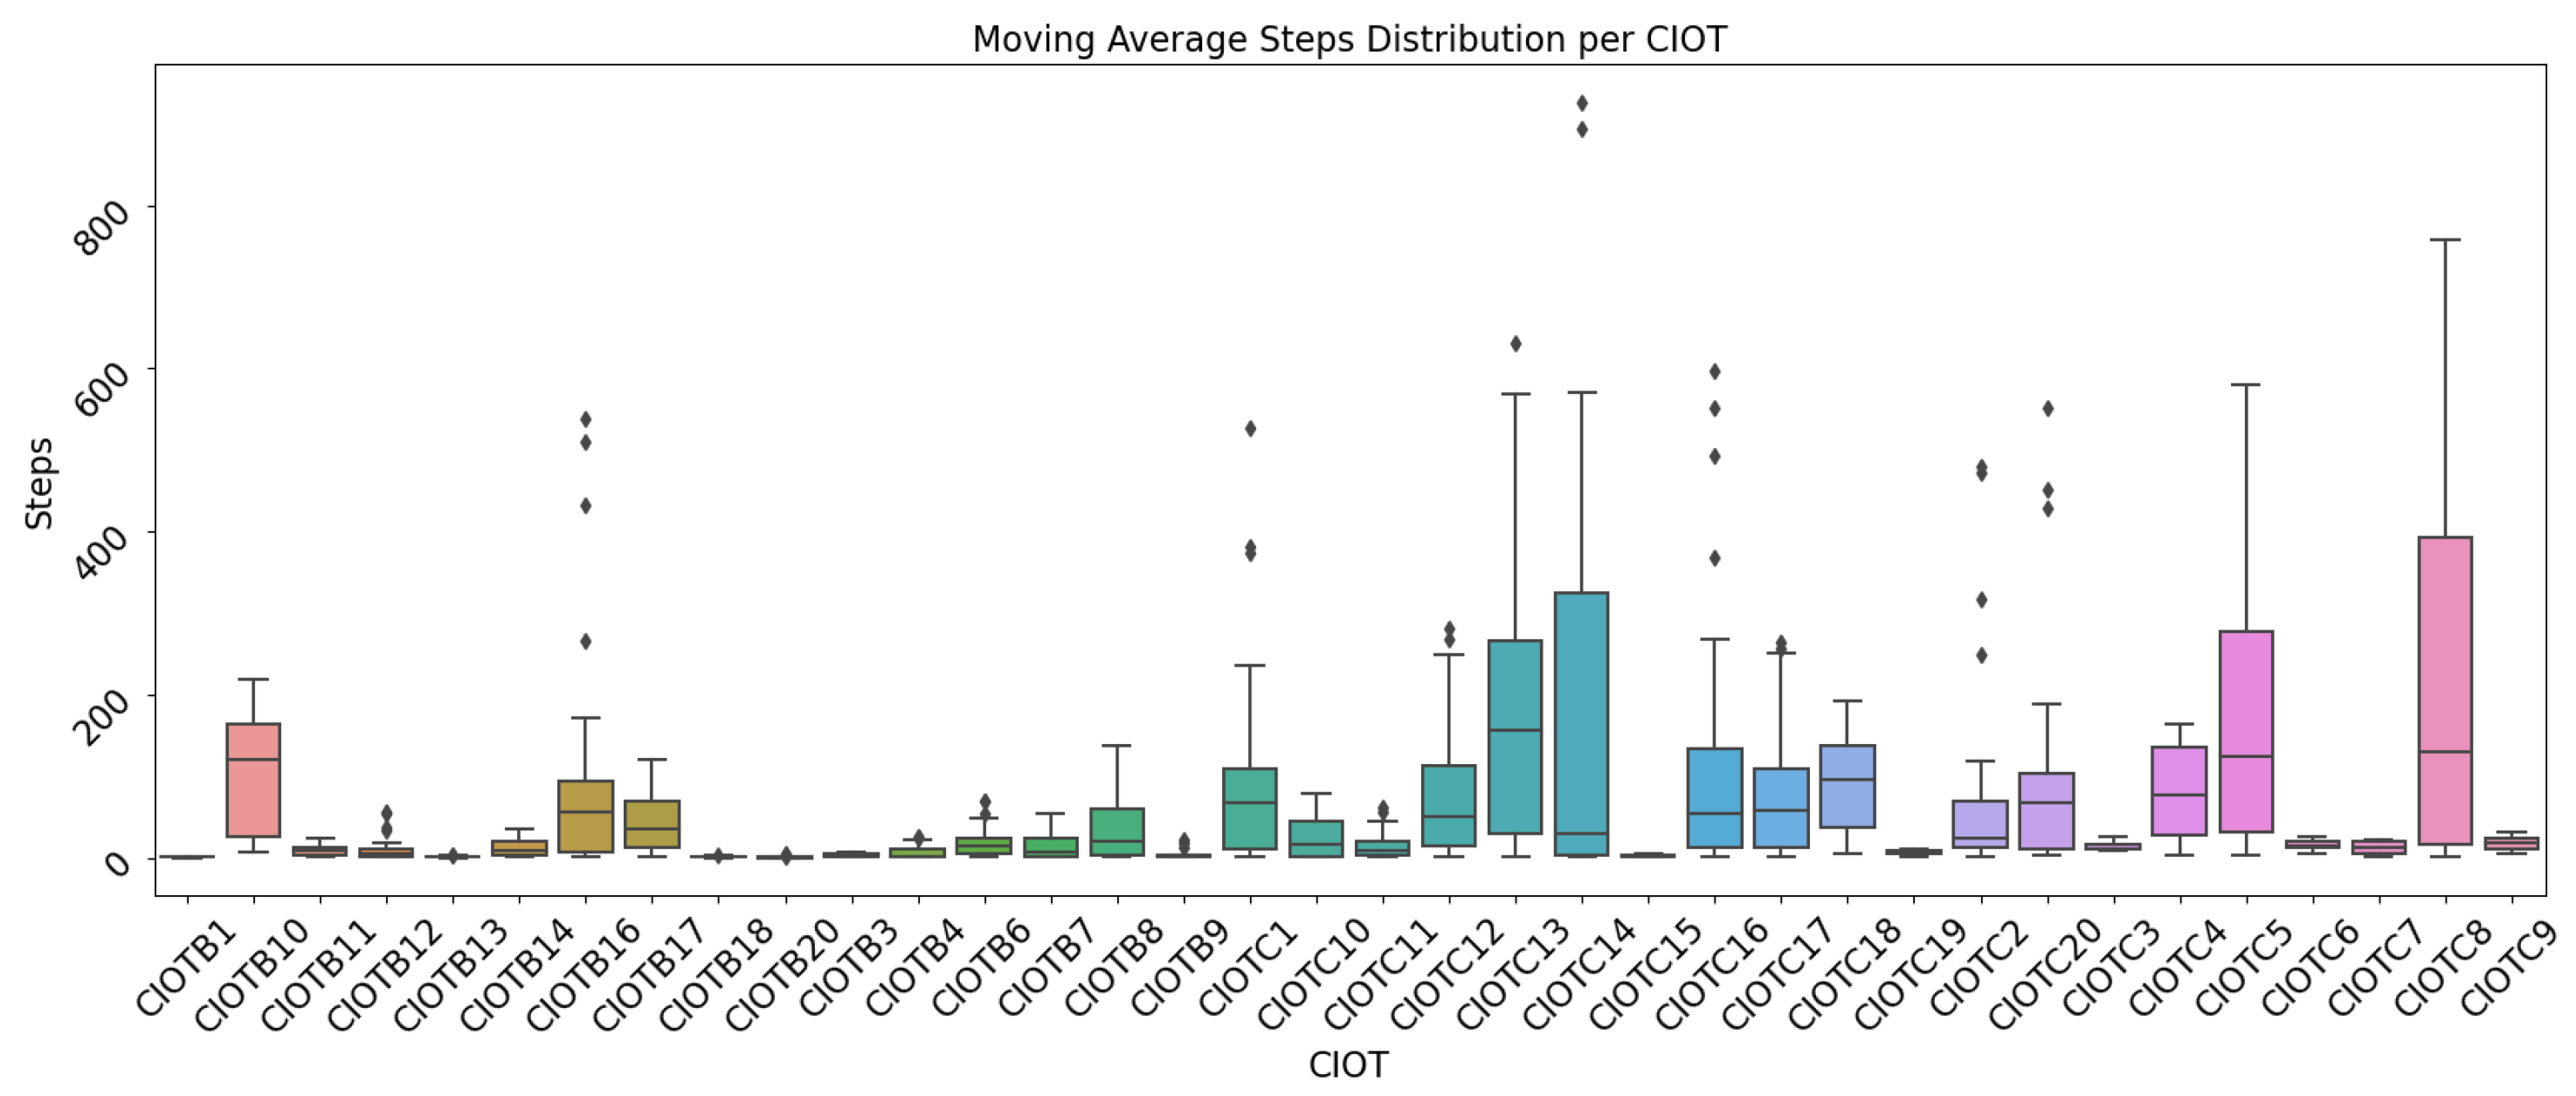
Furthermore, it is worth noting that, given that the objective of the study is to understand mobility patterns and not just the raw number of steps, it is necessary to normalize the mean step count curves in order to compare them across the patients. This difference is even more noticeable between patients with a BI of type B and type C, as the latter group tends to have a much higher mean step count volume (Figure 2). To address this, a normalization process was performed by subtracting the minimum value and dividing by the range (max–min). This transformation ensures that all values fall between 0 and 1 for each patient.
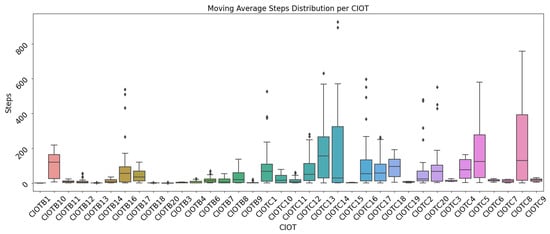
Figure 2.
The distribution of steps per day and CIOT after the application of a moving average.
Given that sleep data are only available on a daily basis, the median values were computed for each patient to obtain a general representation of their sleep patterns and quality. Among all the available sleep-related data, the focus was on the median amount of sleep, which was further divided into deep sleep, shallow sleep, REM and wake time, as well as the median bedtime and wake-up time. These variables provide insight into the overall sleep patterns of the patients, including the duration and quality of their sleep, as well as their sleep–wake cycle.
3.2.2. Activity Profiles Based on the Coefficient of Variation
In addition to the 24 h mean profiles presented earlier, the CV profiles were also incorporated. Specifically, for each day in the dataset from 00:00 to 23:59, the CV was calculated for each day and hour-based on the aggregated 5 min data, and then the median was computed for all hours for a given patient.
To obtain smoother profiles, a centered moving average with a window size of three was applied to the 24 h CV profiles. As a result, each curve represents the smoothed median CV for each hour and patient. Missing values are assigned for cases where there is no movement during a specific hour or when the mean is zero.
3.3. Time Series Clustering Using DTW
Time series clustering is a powerful analytical technique used to identify patterns and relationships among time series data. By grouping similar time series together, this method can help extract meaningful insights and reveal underlying patterns that may not be visible when examining individual series in isolation.
In this case, since the goal is to generate mobility patterns based on the normalized average hourly profiles for each patient, a temporal clustering algorithm was used to identify existing mobility patterns. For this study, the time series K-means algorithm from the tslearn library was applied, as it is widely regarded as a standard in the literature [21,22]. However, it is important to note that other methods could have been considered as well.
It is essential to highlight that time-shifts are insignificant within a certain range of maximum hours, as the goal is to create mobility patterns independent of the specific hour and primarily based on shape. Therefore, DTW is the preferred distance function to measure the similarity between time series.
DTW evaluates the similarity between two time series by finding the best alignment between them, which involves time-axis stretching or compressing. This method is well-suited for the current study, as a group of patients may demonstrate similar mobility patterns with only slight variations in time. Given this scenario, a Sakoe–Chiba [23] radius of 3 h was considered as mobility patterns may be slightly out-of-sync by a few hours, yet still exhibit significant differences between the morning and afternoon.
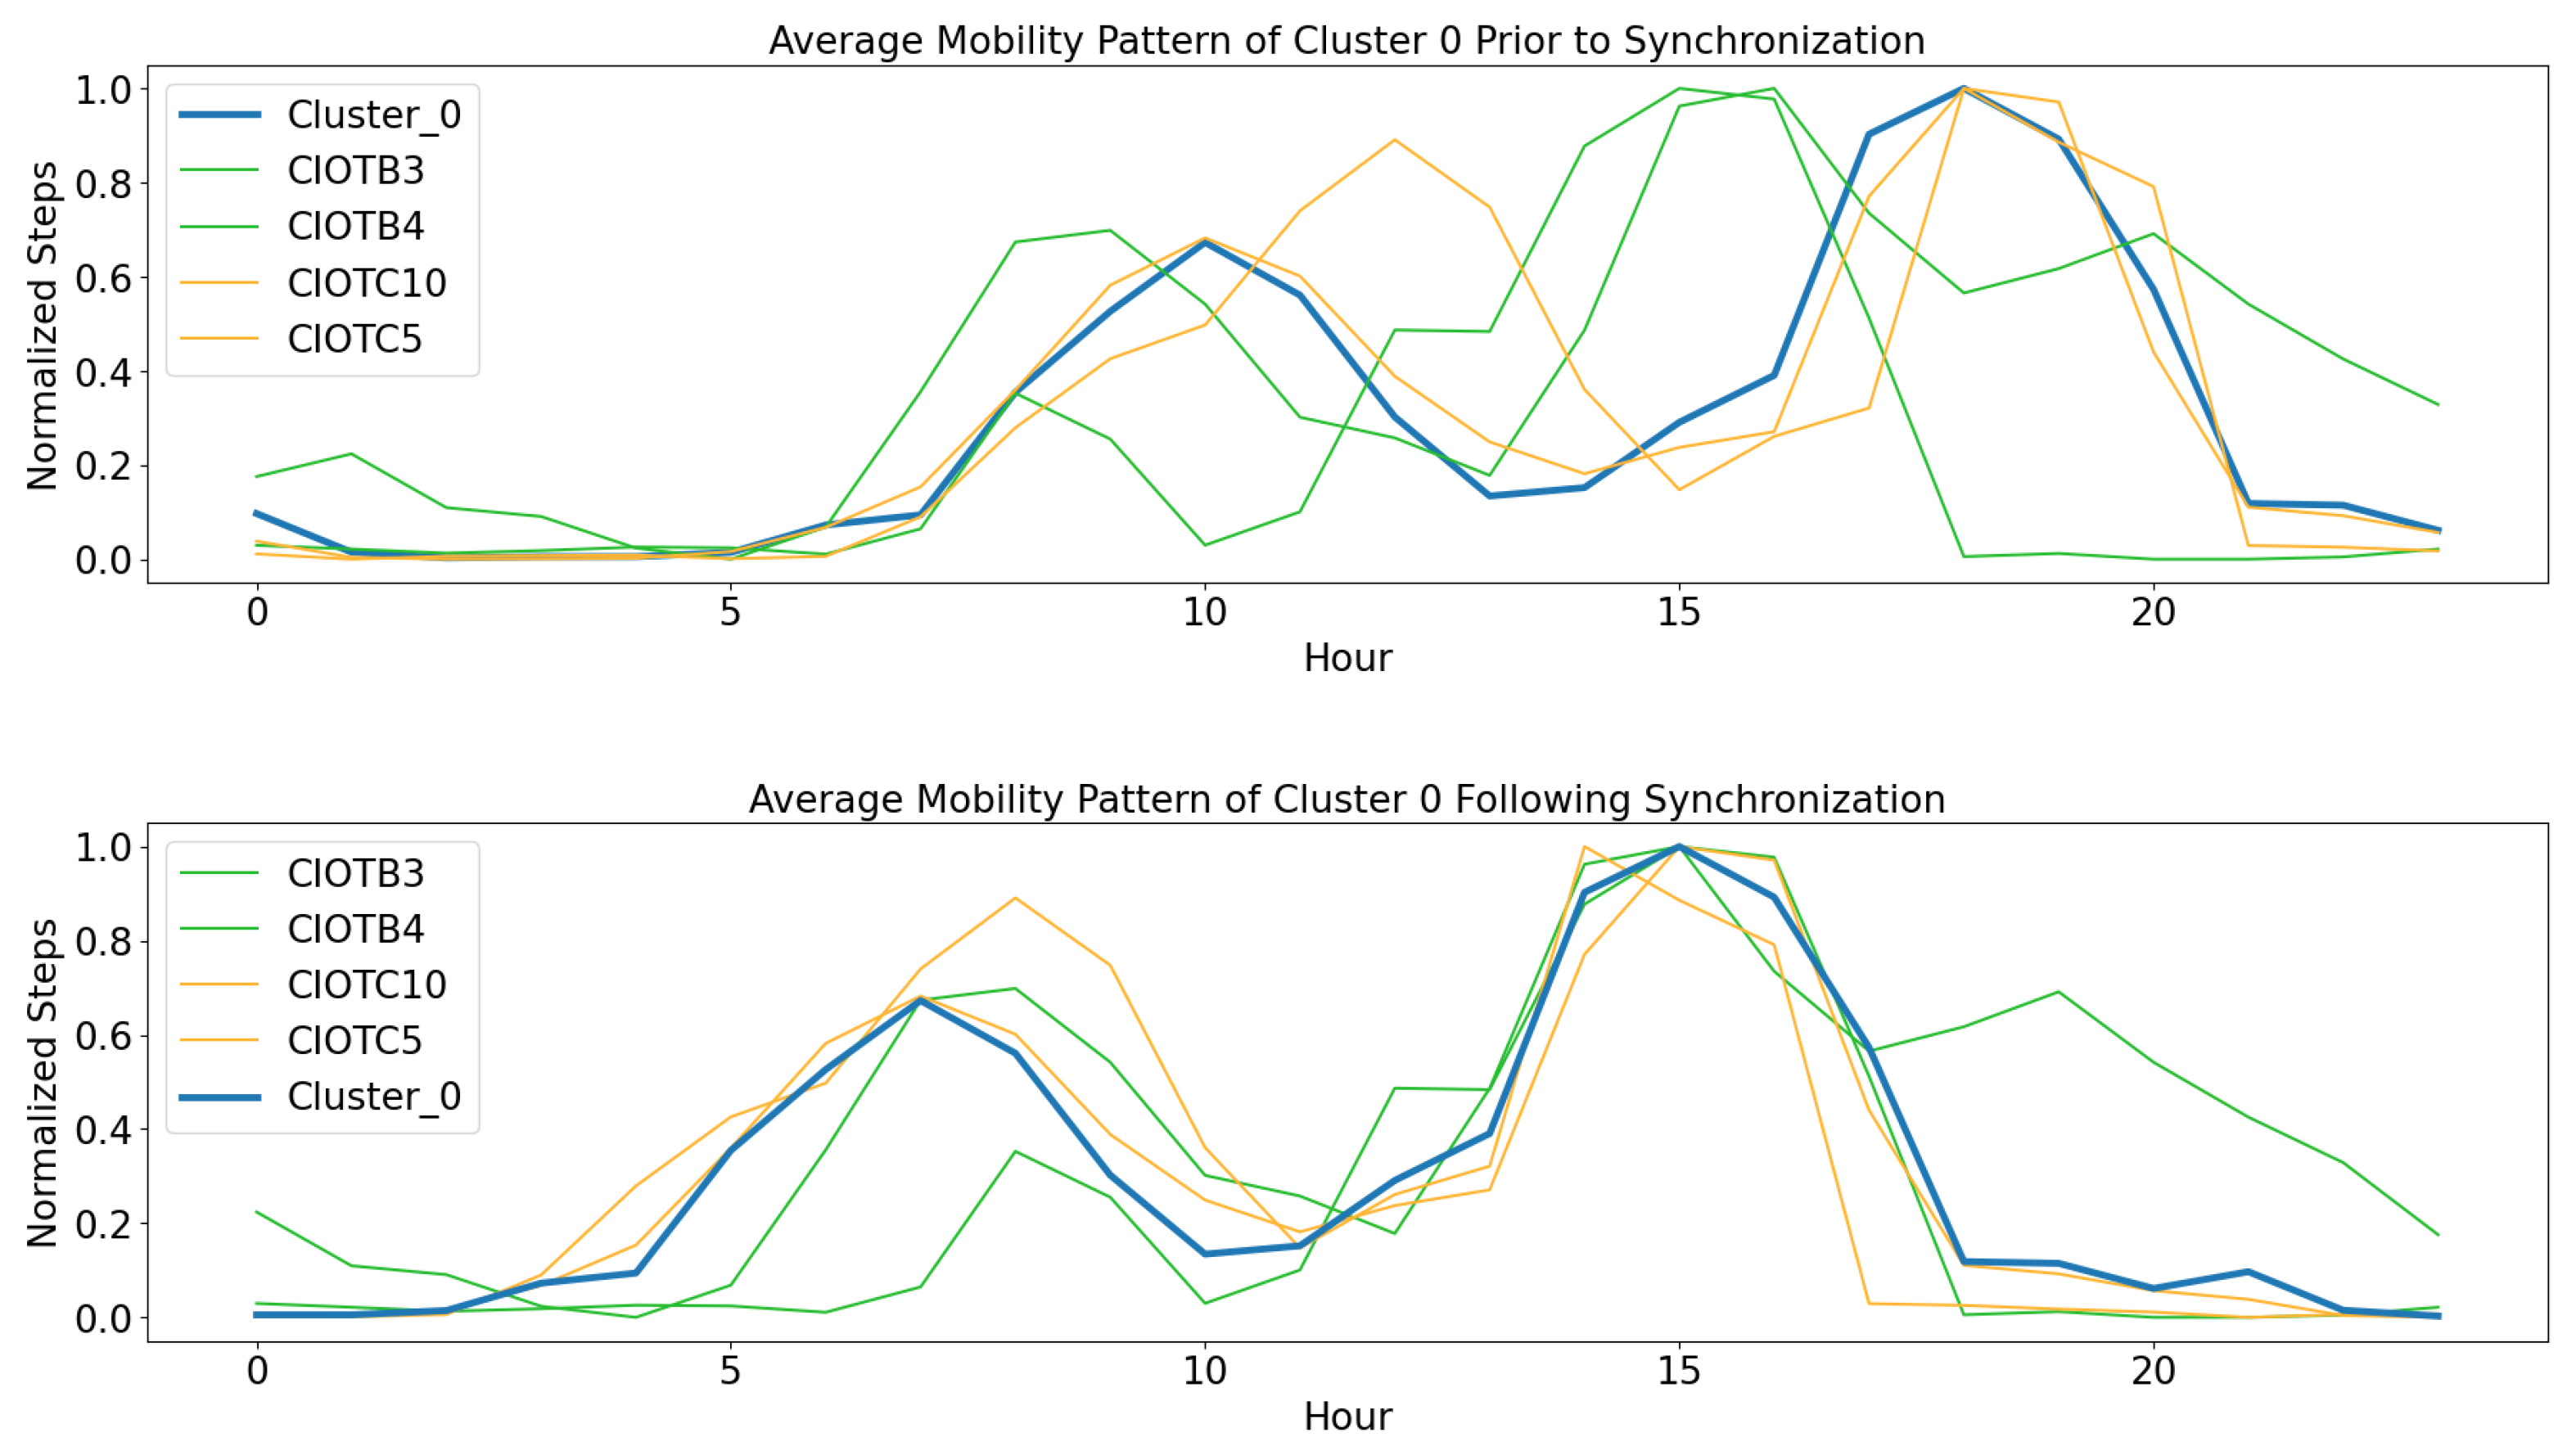
To synchronize time series data following the creation of clusters, cross-correlation was employed to determine the optimal time lags for comparing both series. The objective was to move the mobility patterns through the time-axis in order to find the best alignment in terms of correlation. Cross-correlation is a mathematical function that measures the similarity between two signals as a function of the time lag applied to one of them [24]. Once the optimal time lag has been determined, the time series can be synchronized by shifting one of the series by the optimal time lag.
When examining the mobility patterns of individuals, it is useful to consider the average mobility patterns over a 24 h cycle. However, due to differences in individual sleep and work schedules, these patterns may not necessarily align perfectly with each other. This can result in a phase shift, where the 24 h cycle of one individual is shifted forward or backward relative to another individual.
To account for these phase shifts, it is useful to treat the 24 h cycle as circular data. In circular data, the end of the cycle precedes the beginning, forming a continuous circle rather than a linear sequence. This allows for the accurate representation of phase shifts and the analysis of cyclic patterns as observed in Figure 3.
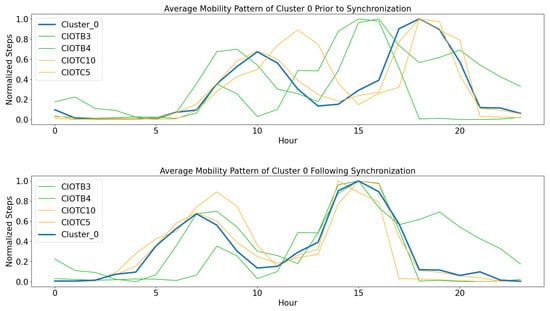
Figure 3.
Cross-correlation synchronization of DTW clustering.
4. Results
This section presents the mean mobility patterns resulting from the application of DTW time series K-means. Additionally, the clusters derived from the CV profiles are presented. Finally, a comparison of cluster members is made to better understand the relationship between the distribution of steps and walking behavior.
4.1. Clustering Mean Activity Profiles
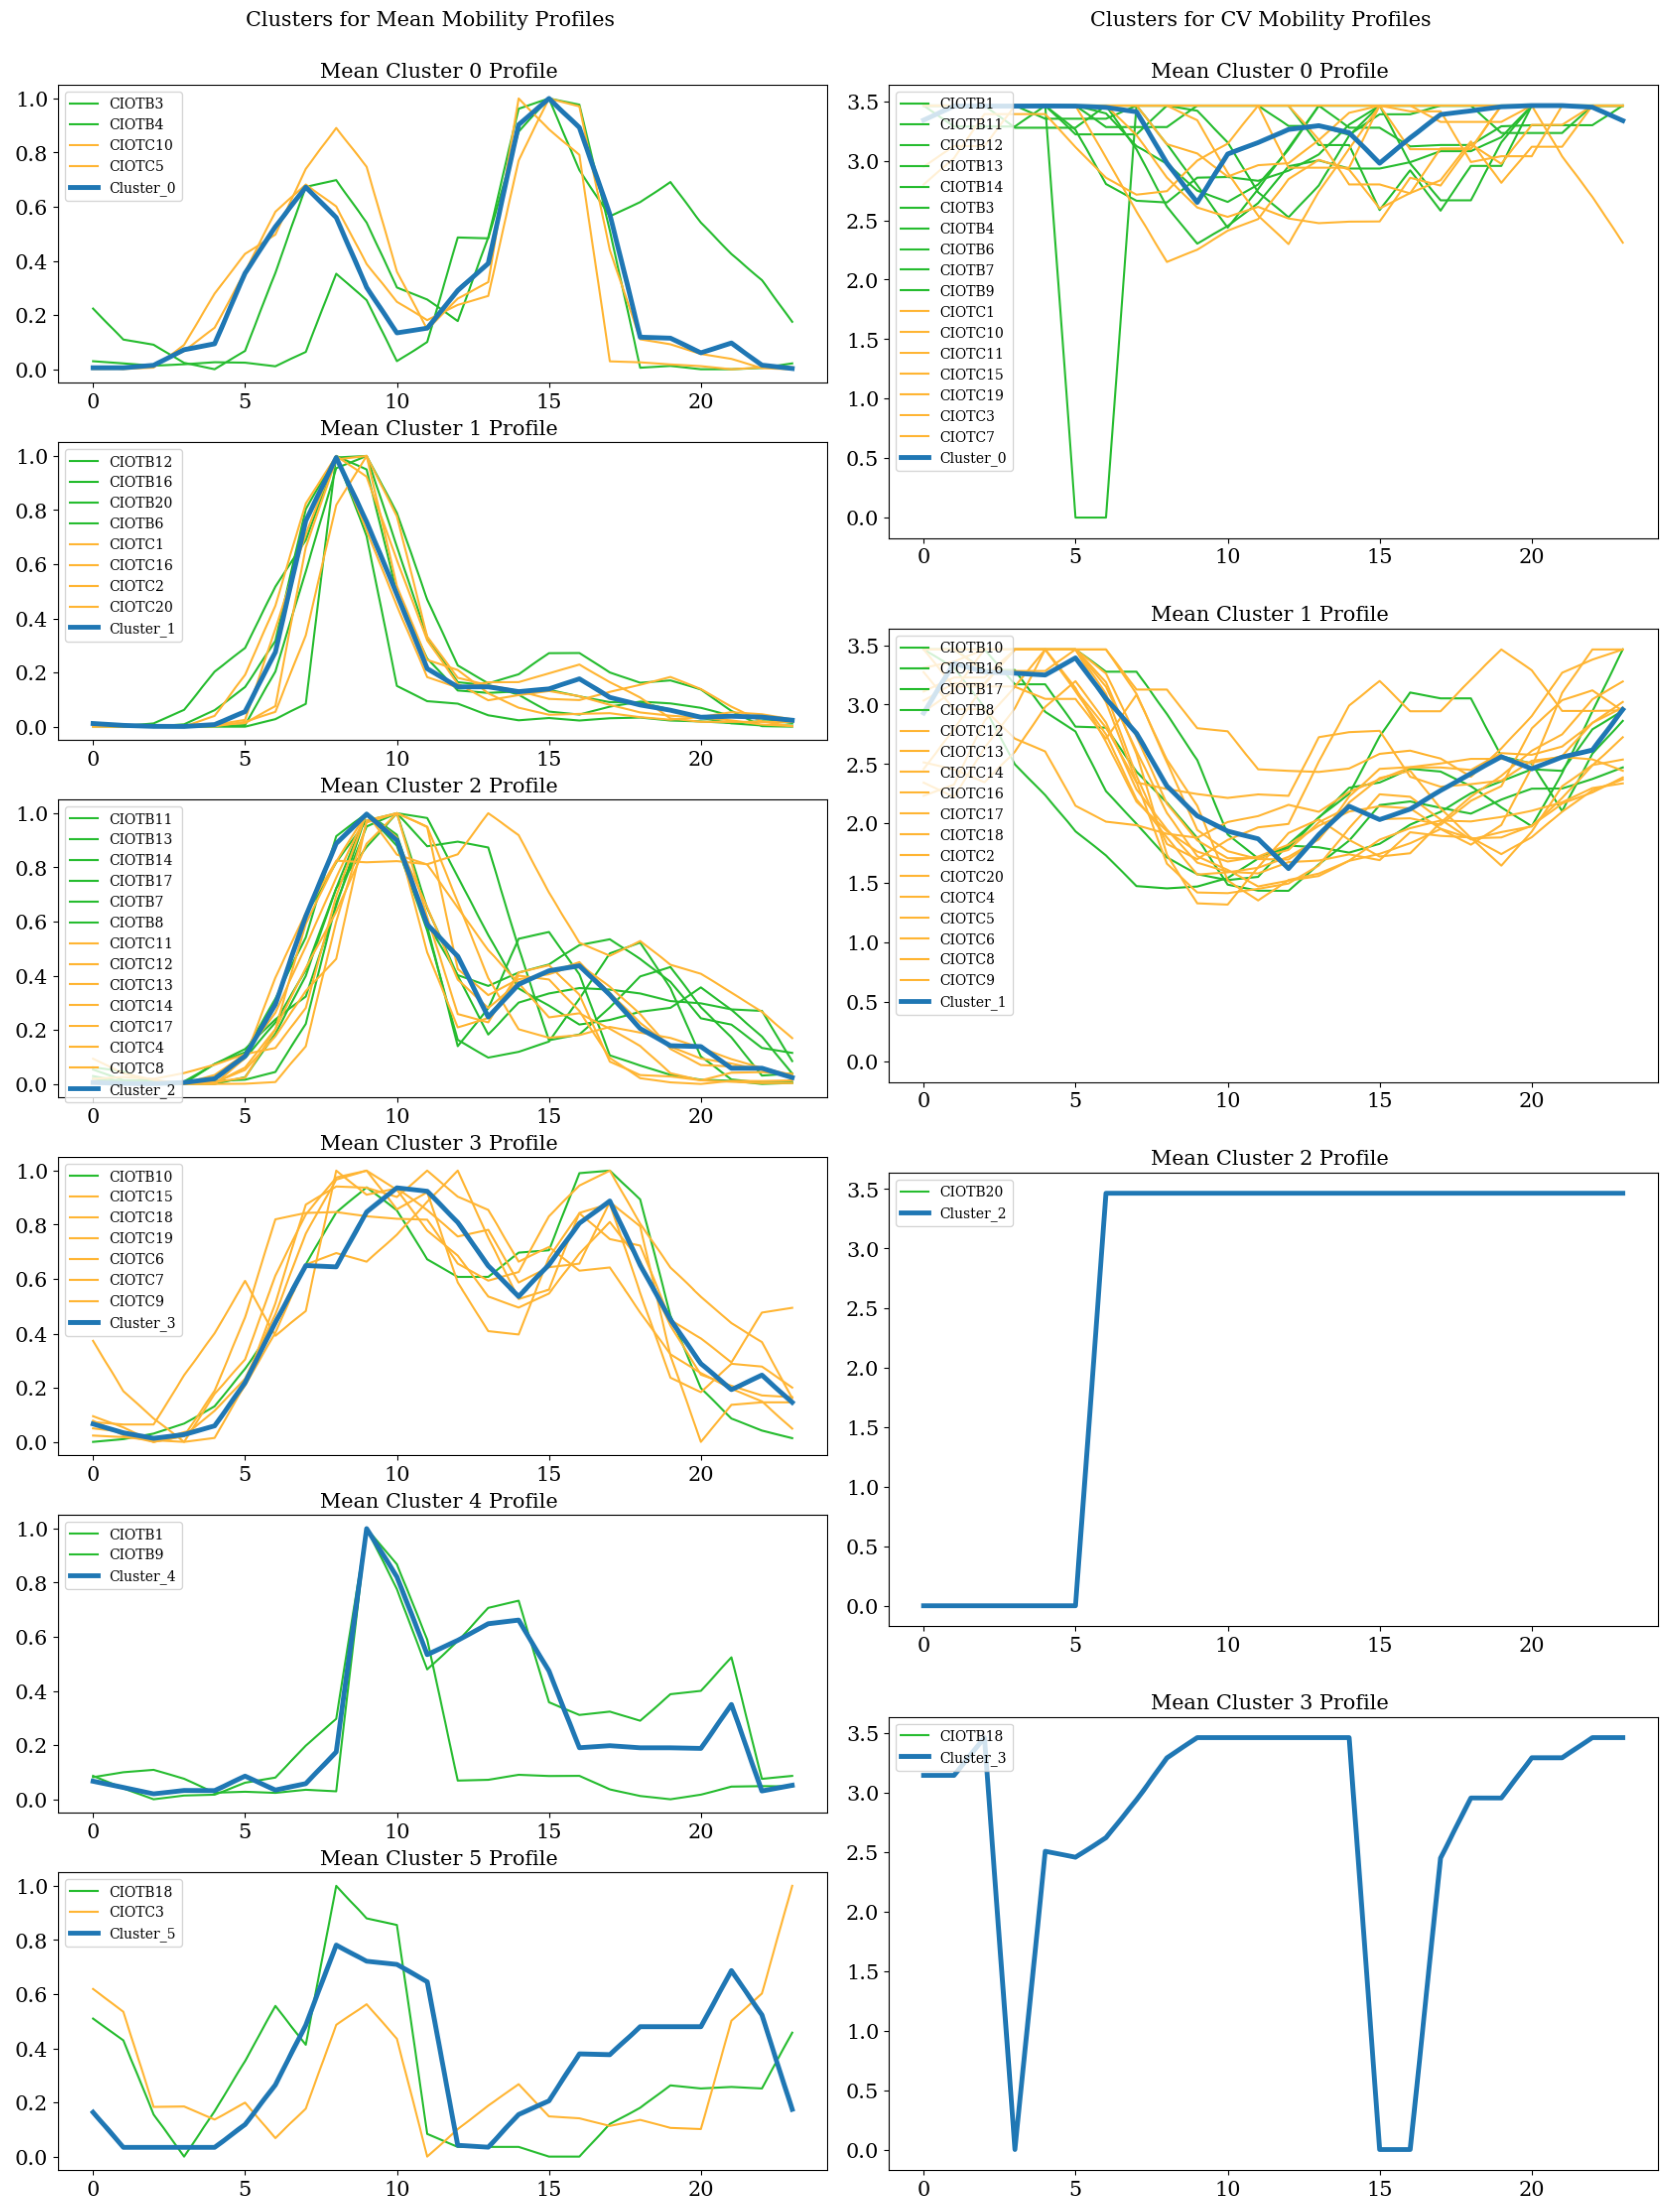
After running the time series K-means algorithm considering the DTW clustering distance and a Sakoe–Chiba radius of three, six clusters were selected using the elbow methodology. The mobility patterns acquired are shown in Figure 4. According to Table 1, cluster 3, which represents patients with a more stable daily mobility pattern, appears to be associated with a BI of type C.
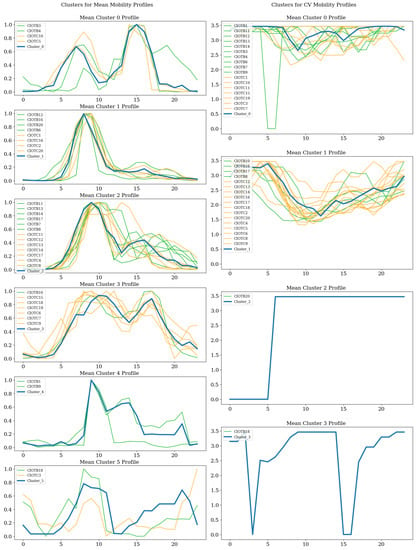
Figure 4.
Comparison of the clusters of mean and coefficient of variation (CV) activity profiles.

Table 1.
Distribution of sample percentages across Barthel types within each of the most populated clusters.
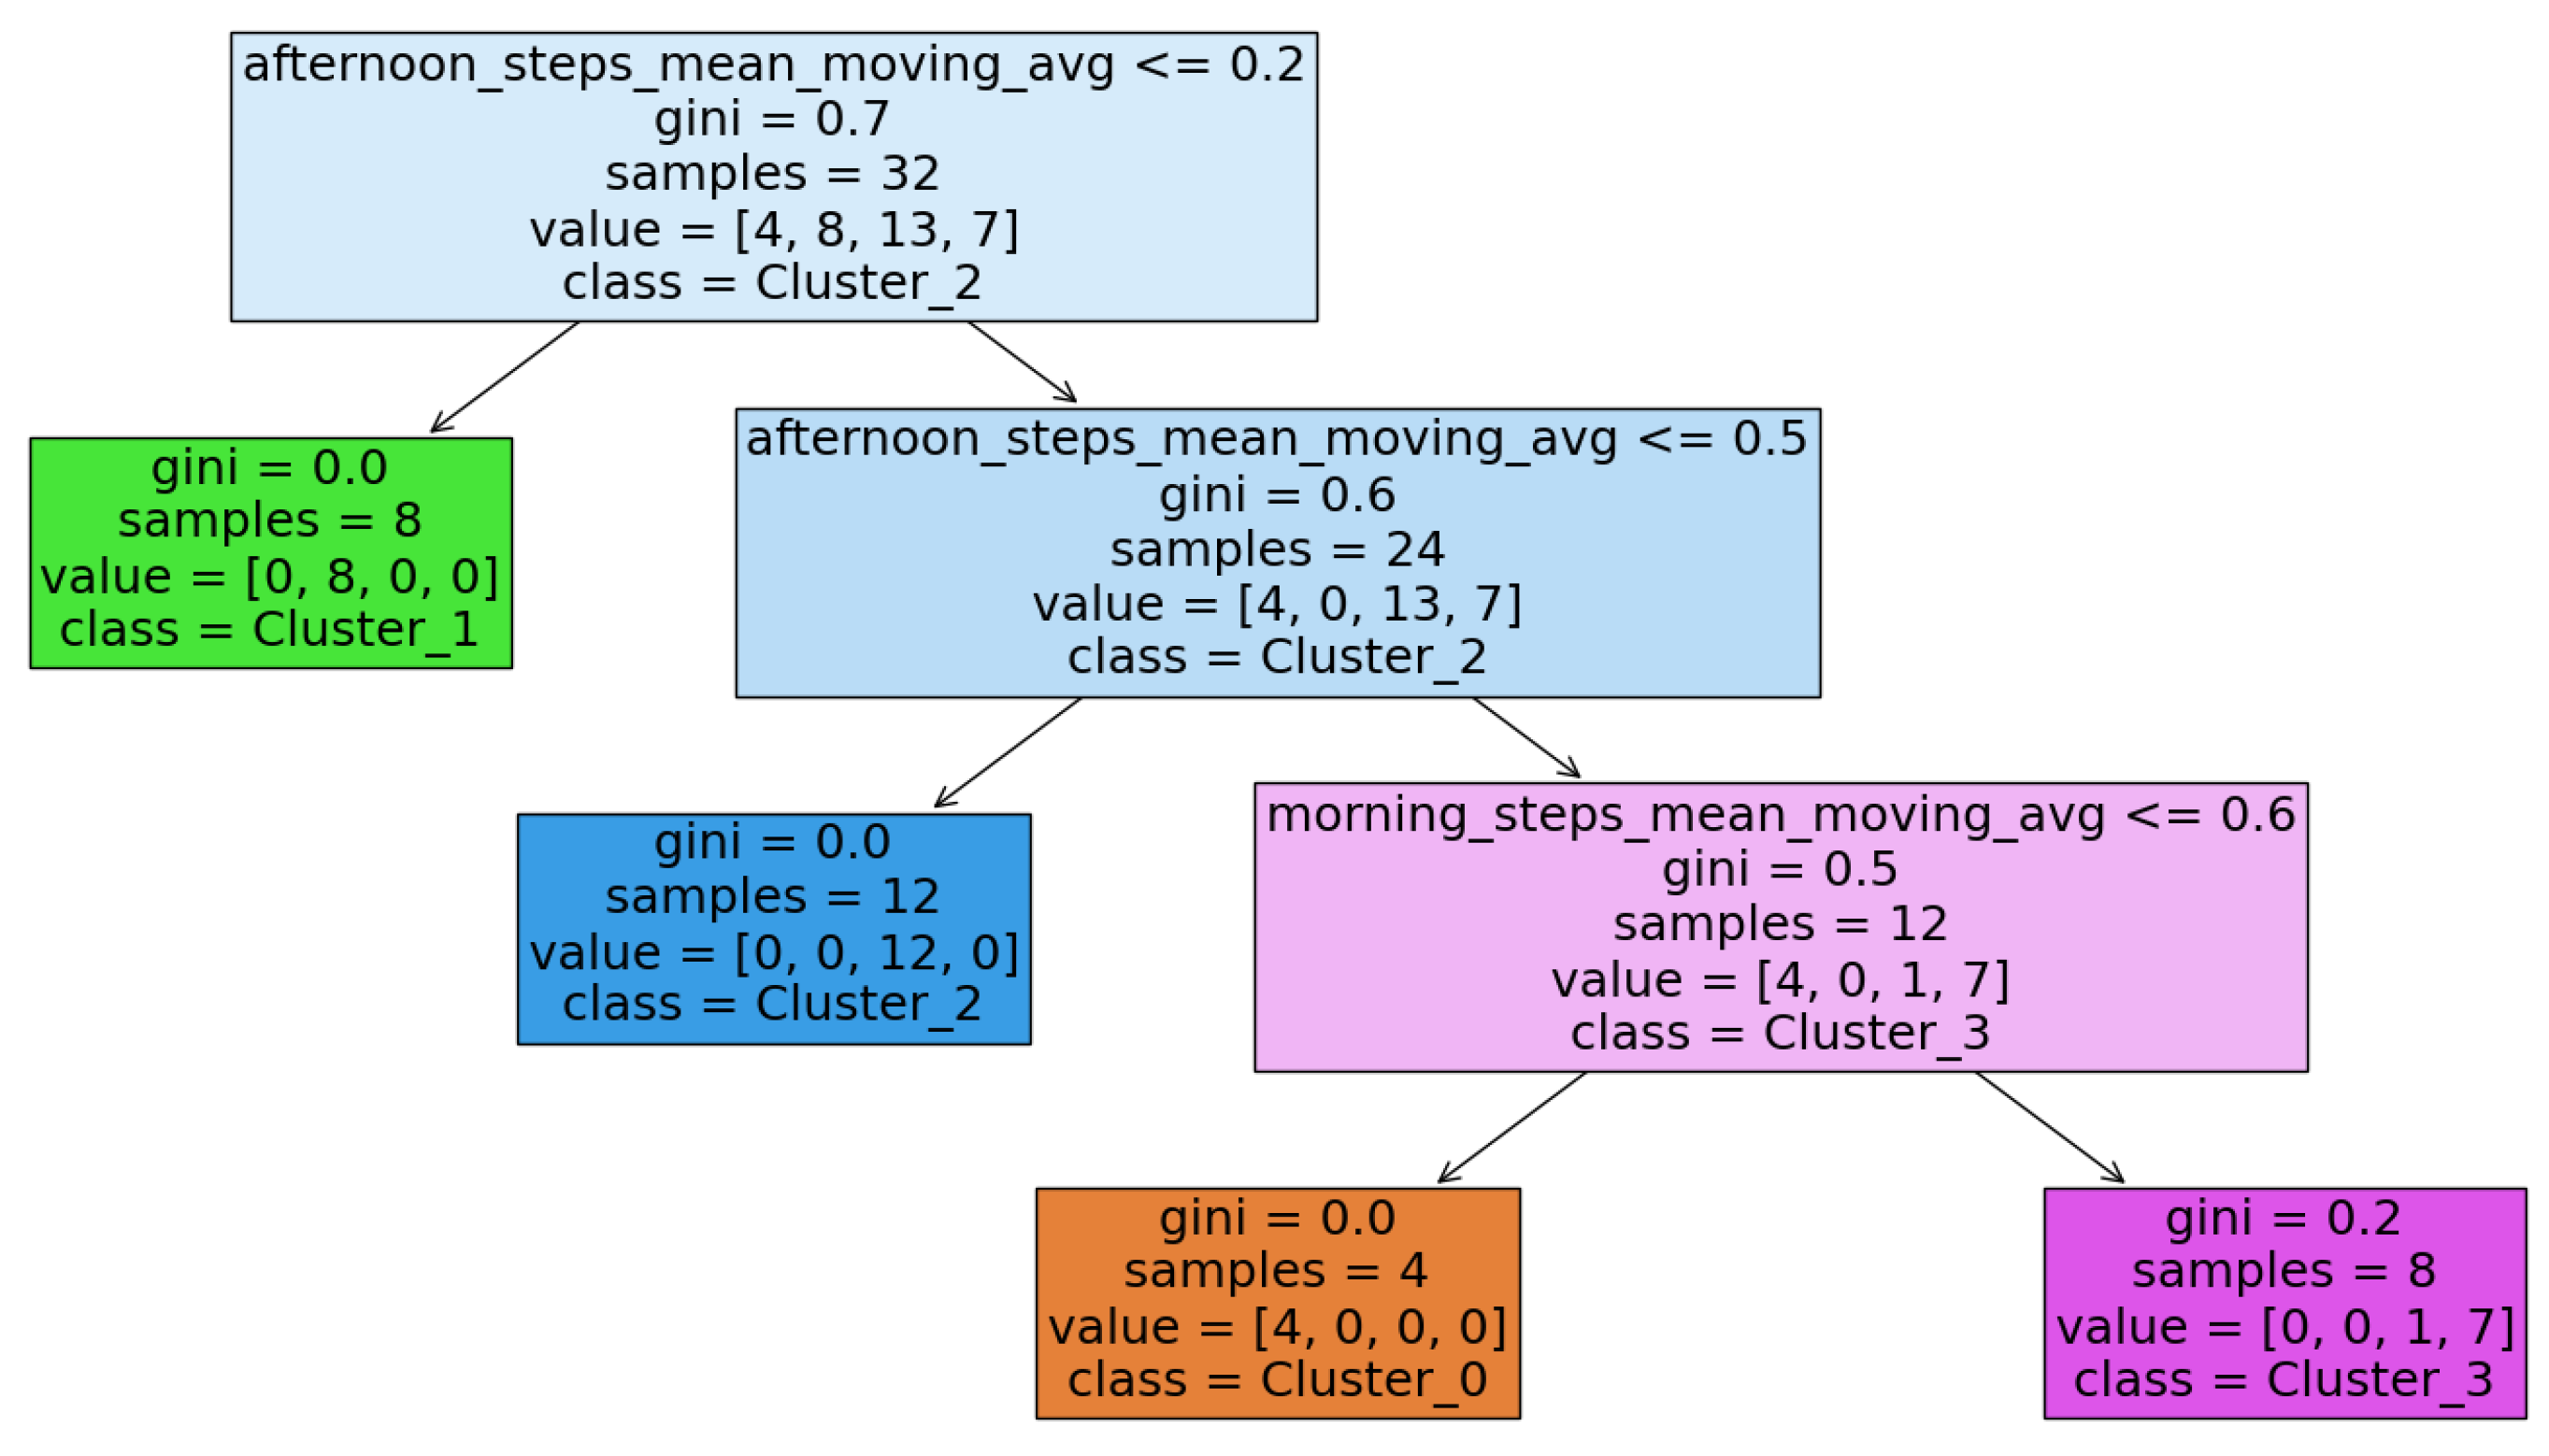
To investigate this relationship further, a decision tree was trained to predict the cluster to which a given patient belongs based on their sleep and mobility patterns (see Figure 5). By examining the splits made by the decision tree, it is possible to gain an insight into the different mobility patterns present in the dataset. To optimize the hyperparameters of the decision tree, a stratified K-fold approach was used with k = 5, accounting for both the criterion (gini or entropy) and the minimum impurity decrease. Our analysis revealed that the optimal hyperparameters for the decision tree were gini as the criterion and a minimum impurity decrease of 0.06.
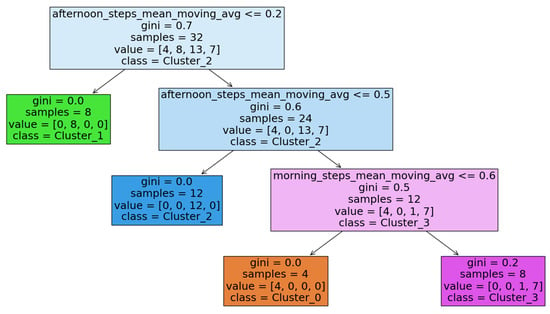
Figure 5.
Decision tree for patient classification into the four main clusters.
The features considered in the tree were the median sleep time, (divided into deep sleep, shallow sleep, REM, and wake time), the median hour of sleeping, the median hour of waking up, and the mean normalized steps divided into four sections: Dawn , Morning , Afternoon , and Night . Note that normalized steps were used here; therefore, how much each patient was walking during the afternoon relative to their overall walking patterns was evaluated.
It was discovered that the primary disparity between the clusters was the average normalized steps taken during the afternoon. When fewer steps were taken during the afternoon, the patient was categorized into cluster 1. Following this division, patients were classified based on the number of steps taken during the afternoon. If the normalized steps taken during the afternoon exceeded 0.5, indicating considerable movement during that time, patients were classified into either cluster 3 or 0, depending on their activity levels during the morning. Conversely, patients who were not as active during the afternoon were classified as cluster 2.
4.2. Clustering Coefficient of Variation Activity Profiles
The objective of the clustering analysis performed above was to characterize the distinct patterns of mobility in terms of the average amount of walking by each patient during each hour. However, these clusters lack information on the variability of mobility within each patient. It is important to recognize that patients do not all walk in the same way, and thus it is necessary to consider both the mean and variance for each hour. This approach allows for discrimination not only by the amount of movement within each hour but also by the type of movement performed, such as whether it is continuous or interrupted. In cases where movement is interrupted during a one-hour span, the standard deviation within the data collected every 5 min will be higher than in cases where movement is constant, resulting in a standard deviation closer to zero.
To address these differences, a DTW time series K-means clustering was performed based on the hourly median of the CV for every day. The analysis in Figure 4 and Table 2 indicates the presence of two predominant patterns of physical activity with respect to the CV. The primary distinguishing feature between cluster 0, predominantly composed of patients with a BI of type B, and cluster 1, with patients having a BI of type C, is the reduced variability in the duration of morning and afternoon walks. This finding suggests that patients in these clusters may exhibit more consistent patterns of locomotion, as opposed to a start–stop movement pattern.

Table 2.
Distribution of sample percentages across Barthel types within each of the most populated clusters.
4.3. Relation between Mean and CV Profiles
To gain a better understanding of the correlation between clusters based on the CV and 24 h mobility patterns, reference can be made to the Sankey diagram presented in Figure 6. It is noteworthy that patients in cluster 3 of the mean profiles appear to correspond to those in cluster 1 of the CV profiles. Upon analyzing the decision tree depicted in Figure 5 and the clusters shown in Figure 4, it becomes evident that patients with more stable movement patterns, without significant differences between morning and afternoon, tend to walk in a more continuous manner. Furthermore, there appears to be a relationship between the BI and CV cluster. In an attempt to establish this relationship statistically, a two-sample z-test for proportions was performed with a 90% confidence interval, resulting in statistical significance [25].

Figure 6.
Correlation between clusters predominantly populated by 24 h mobility patterns and the cluster generated regarding the CV.
5. Conclusions
In this study, we analyzed the different patterns of mobility and their relationship with the patient’s clinical status. Specifically, we intended to build a better understanding of how CCPs move through the day and how it can be related to their BI.
To do so, a time series clustering algorithm was used using 24 h mean and CV profile data using DTW as the similarity measure. It was found that there are four main patterns of mobility, considering the mean profiles, depending on their levels of movement during the morning and afternoon. Moreover, those clusters can be related to those obtained using the CV patterns and it was concluded that patients with greater mobility during the afternoon seem to have a more continuous way of walking rather than a start–stop pattern. Specifically, those who tend to walk in a more continuous way were mostly related to a BI of type C.
Overall, this study highlights the potential for using wearables to gather data on patient mobility and clinical condition, which could be used to improve the care provided to chronic patients with complex health needs. The study’s findings could contribute to the growing body of research on how technology can be used to monitor and improve patient health outcomes.
Lastly, future research may further analyze the relationship between the information provided by the activity tracker and the detection of patient degradation based on the mobility patterns described in this study.
Author Contributions
Conceptualization, A.P.-M., E.F.S.-Ú., J.P., C.A.-R. and C.H.-Q.; methodology, A.P.-M., E.F.S.-Ú. and J.P.; software, A.P.-M.; validation, E.F.S.-Ú.; formal analysis, A.P.-M., E.F.S.-Ú. and J.P.; investigation, A.P.-M.; resources, C.A.-R. and C.H.-Q.; data curation, A.P.-M., E.F.S.-Ú., J.P., C.A.-R. and C.H.-Q.; writing—original draft preparation, A.P.-M.; writing—review and editing, A.P.-M., E.F.S.-Ú., J.P., R.P., C.R.-M., A.M., C.A.-R. and C.H.-Q.; visualization, A.P.-M.; supervision, E.F.S.-Ú. and J.P.; project administration E.F.S.-Ú., C.A.-R. and C.H.-Q.; funding acquisition, E.F.S.-Ú., J.P., R.P., C.R.-M., A.M., C.A.-R. and C.H.-Q. All authors have read and agreed to the published version of the manuscript.
Funding
This work was supported by the chronic-IoT project (Agencia Estatal de Investigación, PID2019-110747RB-C21/ AEI/10.13039/501100011033), which has received funding from the Ministry of Science, Innovation and Universities of the Government of Spain and the State Research Agency. Also, this research has been co-supported by the Carlos III National Institute of Health, through the IMPaCT-Data program (code IMP/00019), and through the Platform for Dynamization and Innovation of the Spanish National Health System industrial capacities and their effective transfer to the productive sector (code PT20/00088), both co-funded by European Regional Development Fund (FEDER) ‘A way of making Europe’.
Institutional Review Board Statement
Not applicable.
Informed Consent Statement
Informed consent was obtained from all subjects involved in the study.
Data Availability Statement
Restrictions apply to the availability of these data. The data were obtained from households participating in the chronic-IoT project (Agencia Estatal de Investigación, PID2019-110747RB-C21/AEI/10.13039/501100011033). The dataset is neither public nor available in the way that it has been used as a source in this article.
Conflicts of Interest
The authors declare no conflict of interest.
References
- Silguero, S.A.A.; Martínez-Reig, M.; Arnedo, L.G.; Martínez, G.J.; Rizos, L.R.; Soler, P.A. Enfermedad crónica, mortalidad, discapacidad y pérdida de movilidad en ancianos españoles: Estudio FRADEA. Rev. Esp. Geriatr. Gerontol. 2014, 49, 51–58. [Google Scholar] [CrossRef] [PubMed]
- Cech, D.J.; Martin, S. Functional Movement Development across the Life Span, 3rd ed.; W.B. Saunders: Saint Louis, MO, USA, 2012. [Google Scholar] [CrossRef]
- Shin, G.; Jarrahi, M.H.; Fei, Y.; Karami, A.; Gafinowitz, N.; Byun, A.; Lu, X. Wearable activity trackers, accuracy, adoption, acceptance and health impact: A systematic literature review. J. Biomed. Inform. 2019, 93, 103153. [Google Scholar] [CrossRef] [PubMed]
- Alinia, P.; Cain, C.; Fallahzadeh, R.; Shahrokni, A.; Cook, D.; Ghasemzadeh, H. How Accurate Is Your Activity Tracker? A Comparative Study of Step Counts in Low-Intensity Physical Activities. JMIR Mhealth Uhealth 2017, 5, e106. [Google Scholar] [CrossRef] [PubMed]
- Martín-Escudero, P.; Cabanas, A.M.; Dotor-Castilla, M.L.; Galindo-Canales, M.; Miguel-Tobal, F.; Fernández-Pérez, C.; Fuentes-Ferrer, M.; Giannetti, R. Are Activity Wrist-Worn Devices Accurate for Determining Heart Rate during Intense Exercise? Bioengineering 2023, 10, 254. [Google Scholar] [CrossRef] [PubMed]
- Siyanbade, J.; Abdulrazak, B.; Sadek, I. Unobtrusive Monitoring of Sleep Cycles: A Technical Review. BioMedInformatics 2022, 2, 204–216. [Google Scholar] [CrossRef]
- Cook, D.J.; Thompson, J.E.; Prinsen, S.K.; Dearani, J.A.; Deschamps, C. Functional Recovery in the Elderly After Major Surgery: Assessment of Mobility Recovery Using Wireless Technology. Ann. Thorac. Surg. 2013, 96, 1057–1061. [Google Scholar] [CrossRef] [PubMed]
- Roe, J.; Salmon, L.; Twiggs, J. Objective measure of activity level after total knee arthoplasty with the use of the `Fitbit’ device. Orthop. J. Sport. Med. 2016, 4, 2325967116S00012. [Google Scholar] [CrossRef]
- Shinde, A.M.; Gresham, G.K.; Hendifar, A.E.; Li, Q.; Spiegel, B.; Rimel, B.; Walsh, C.S.; Tuli, R.; Piantadosi, S.; Figlin, R.A. Correlating wearable activity monitor data with PROMIS detected distress and physical functioning in advanced cancer patients. J. Clin. Oncol. 2017, 35, e21689. [Google Scholar] [CrossRef]
- Washington, W.D.; Banna, K.M.; Gibson, A.L. Preliminary efficacy of prize-based contingency management to increase activity levels in healthy adults. J. Appl. Behav. Anal. 2014, 47, 231–245. [Google Scholar] [CrossRef] [PubMed]
- Lunney, M.; Wiebe, N.; Kusi-Appiah, E.; Tonelli, A.; Lewis, R.; Ferber, R.; Tonelli, M. Wearable Fitness Trackers to Predict Clinical Deterioration in Maintenance Hemodialysis: A Prospective Cohort Feasibility Study. Kidney Med. 2021, 3, 768–775.e1. [Google Scholar] [CrossRef] [PubMed]
- Mercer, K.; Giangregorio, L.; Schneider, E.; Chilana, P.; Li, M.; Grindrod, K. Acceptance of Commercially Available Wearable Activity Trackers Among Adults Aged Over 50 and With Chronic Illness: A Mixed-Methods Evaluation. JMIR mHealth uHealth 2016, 4, e7. [Google Scholar] [CrossRef] [PubMed]
- Shehab, M.; Abualigah, L.; Shambour, Q.; Abu-Hashem, M.A.; Shambour, M.K.Y.; Alsalibi, A.I.; Gandomi, A.H. Machine learning in medical applications: A review of state-of-the-art methods. Comput. Biol. Med. 2022, 145, 105458. [Google Scholar] [CrossRef] [PubMed]
- Ahmed, S.; Alshater, M.M.; Ammari, A.E.; Hammami, H. Artificial intelligence and machine learning in finance: A bibliometric review. Res. Int. Bus. Financ. 2022, 61, 101646. [Google Scholar] [CrossRef]
- Ngai, E.W.; Wu, Y. Machine learning in marketing: A literature review, conceptual framework, and research agenda. J. Bus. Res. 2022, 145, 35–48. [Google Scholar] [CrossRef]
- Berndt, D.J.; Clifford, J. Using Dynamic Time Warping to Find Patterns in Time Series. In Proceedings of the KDD Workshop, Seattle, WA, USA, 31 July–1 August 1994. [Google Scholar]
- Huang, B.; Kinsner, W. ECG frame classification using dynamic time warping. In Proceedings of the IEEE CCECE2002. Canadian Conference on Electrical and Computer Engineering. Conference Proceedings (Cat. No.02CH37373), Winnipeg, MB, Canada, 12–15 May 2002; Volume 2, pp. 1105–1110. [Google Scholar] [CrossRef]
- Yao, X.; Wei, H.L. A Modified Dynamic Time Warping (MDTW) and Innovative Average Non-self Match Distance (ANSD) Method for Anomaly Detection in ECG Recordings. In Recent Advances in AI-Enabled Automated Medical Diagnosis; CRC Press: Boca Raton, FL, USA, 2022; pp. 281–303. [Google Scholar]
- Huang, H.C.; Jansen, B. EEG waveform analysis by means of dynamic time-warping. Int. J.-Bio-Med. Comput. 1985, 17, 135–144. [Google Scholar] [CrossRef] [PubMed]
- Steinmetzer, T.; Bonninger, I.; Priwitzer, B.; Reinhardt, F.; Reckhardt, M.C.; Erk, D.; Travieso, C.M. Clustering of Human Gait with Parkinson’s Disease by Using Dynamic Time Warping. In Proceedings of the 2018 IEEE International Work Conference on Bioinspired Intelligence (IWOBI), San Carlos, Costa Rica, 18–20 July 2018; pp. 1–6. [Google Scholar] [CrossRef]
- Tavenard, R.; Faouzi, J.; Vandewiele, G.; Divo, F.; Androz, G.; Holtz, C.; Payne, M.; Yurchak, R.; Rußwurm, M.; Kolar, K.; et al. Tslearn, A Machine Learning Toolkit for Time Series Data. J. Mach. Learn. Res. 2020, 21, 1–6. [Google Scholar]
- Hastie, T.; Tibshirani, R.; Friedman, J. The Elements of Statistical Learning; Springer Series in Statistics; Springer: New York, NY, USA, 2001. [Google Scholar]
- Sakoe, H.; Chiba, S. Dynamic programming algorithm optimization for spoken word recognition. IEEE Trans. Acoust. Speech Signal Process. 1978, 26, 43–49. [Google Scholar] [CrossRef]
- Weisstein, E.W. Cross-Correlation. MathWorld—A Wolfram Web Resource. 2003. Available online: http://mathworld.wolfram.com/Cross-Correlation.html (accessed on 23 February 2023).
- Stine, R.; Foster, D. Statistics for Business: Decision Making and Analysis; Addison-Wesley: Boston, MA, USA, 2011. [Google Scholar]
Disclaimer/Publisher’s Note: The statements, opinions and data contained in all publications are solely those of the individual author(s) and contributor(s) and not of MDPI and/or the editor(s). MDPI and/or the editor(s) disclaim responsibility for any injury to people or property resulting from any ideas, methods, instructions or products referred to in the content. |
© 2023 by the authors. Licensee MDPI, Basel, Switzerland. This article is an open access article distributed under the terms and conditions of the Creative Commons Attribution (CC BY) license (https://creativecommons.org/licenses/by/4.0/).


