
Geodynamic Modeling in Central America Based on GNSS Time Series Analysis—Special Case: The Nicoya Earthquake (Costa Rica, 2012) †

 ,
,  , , and
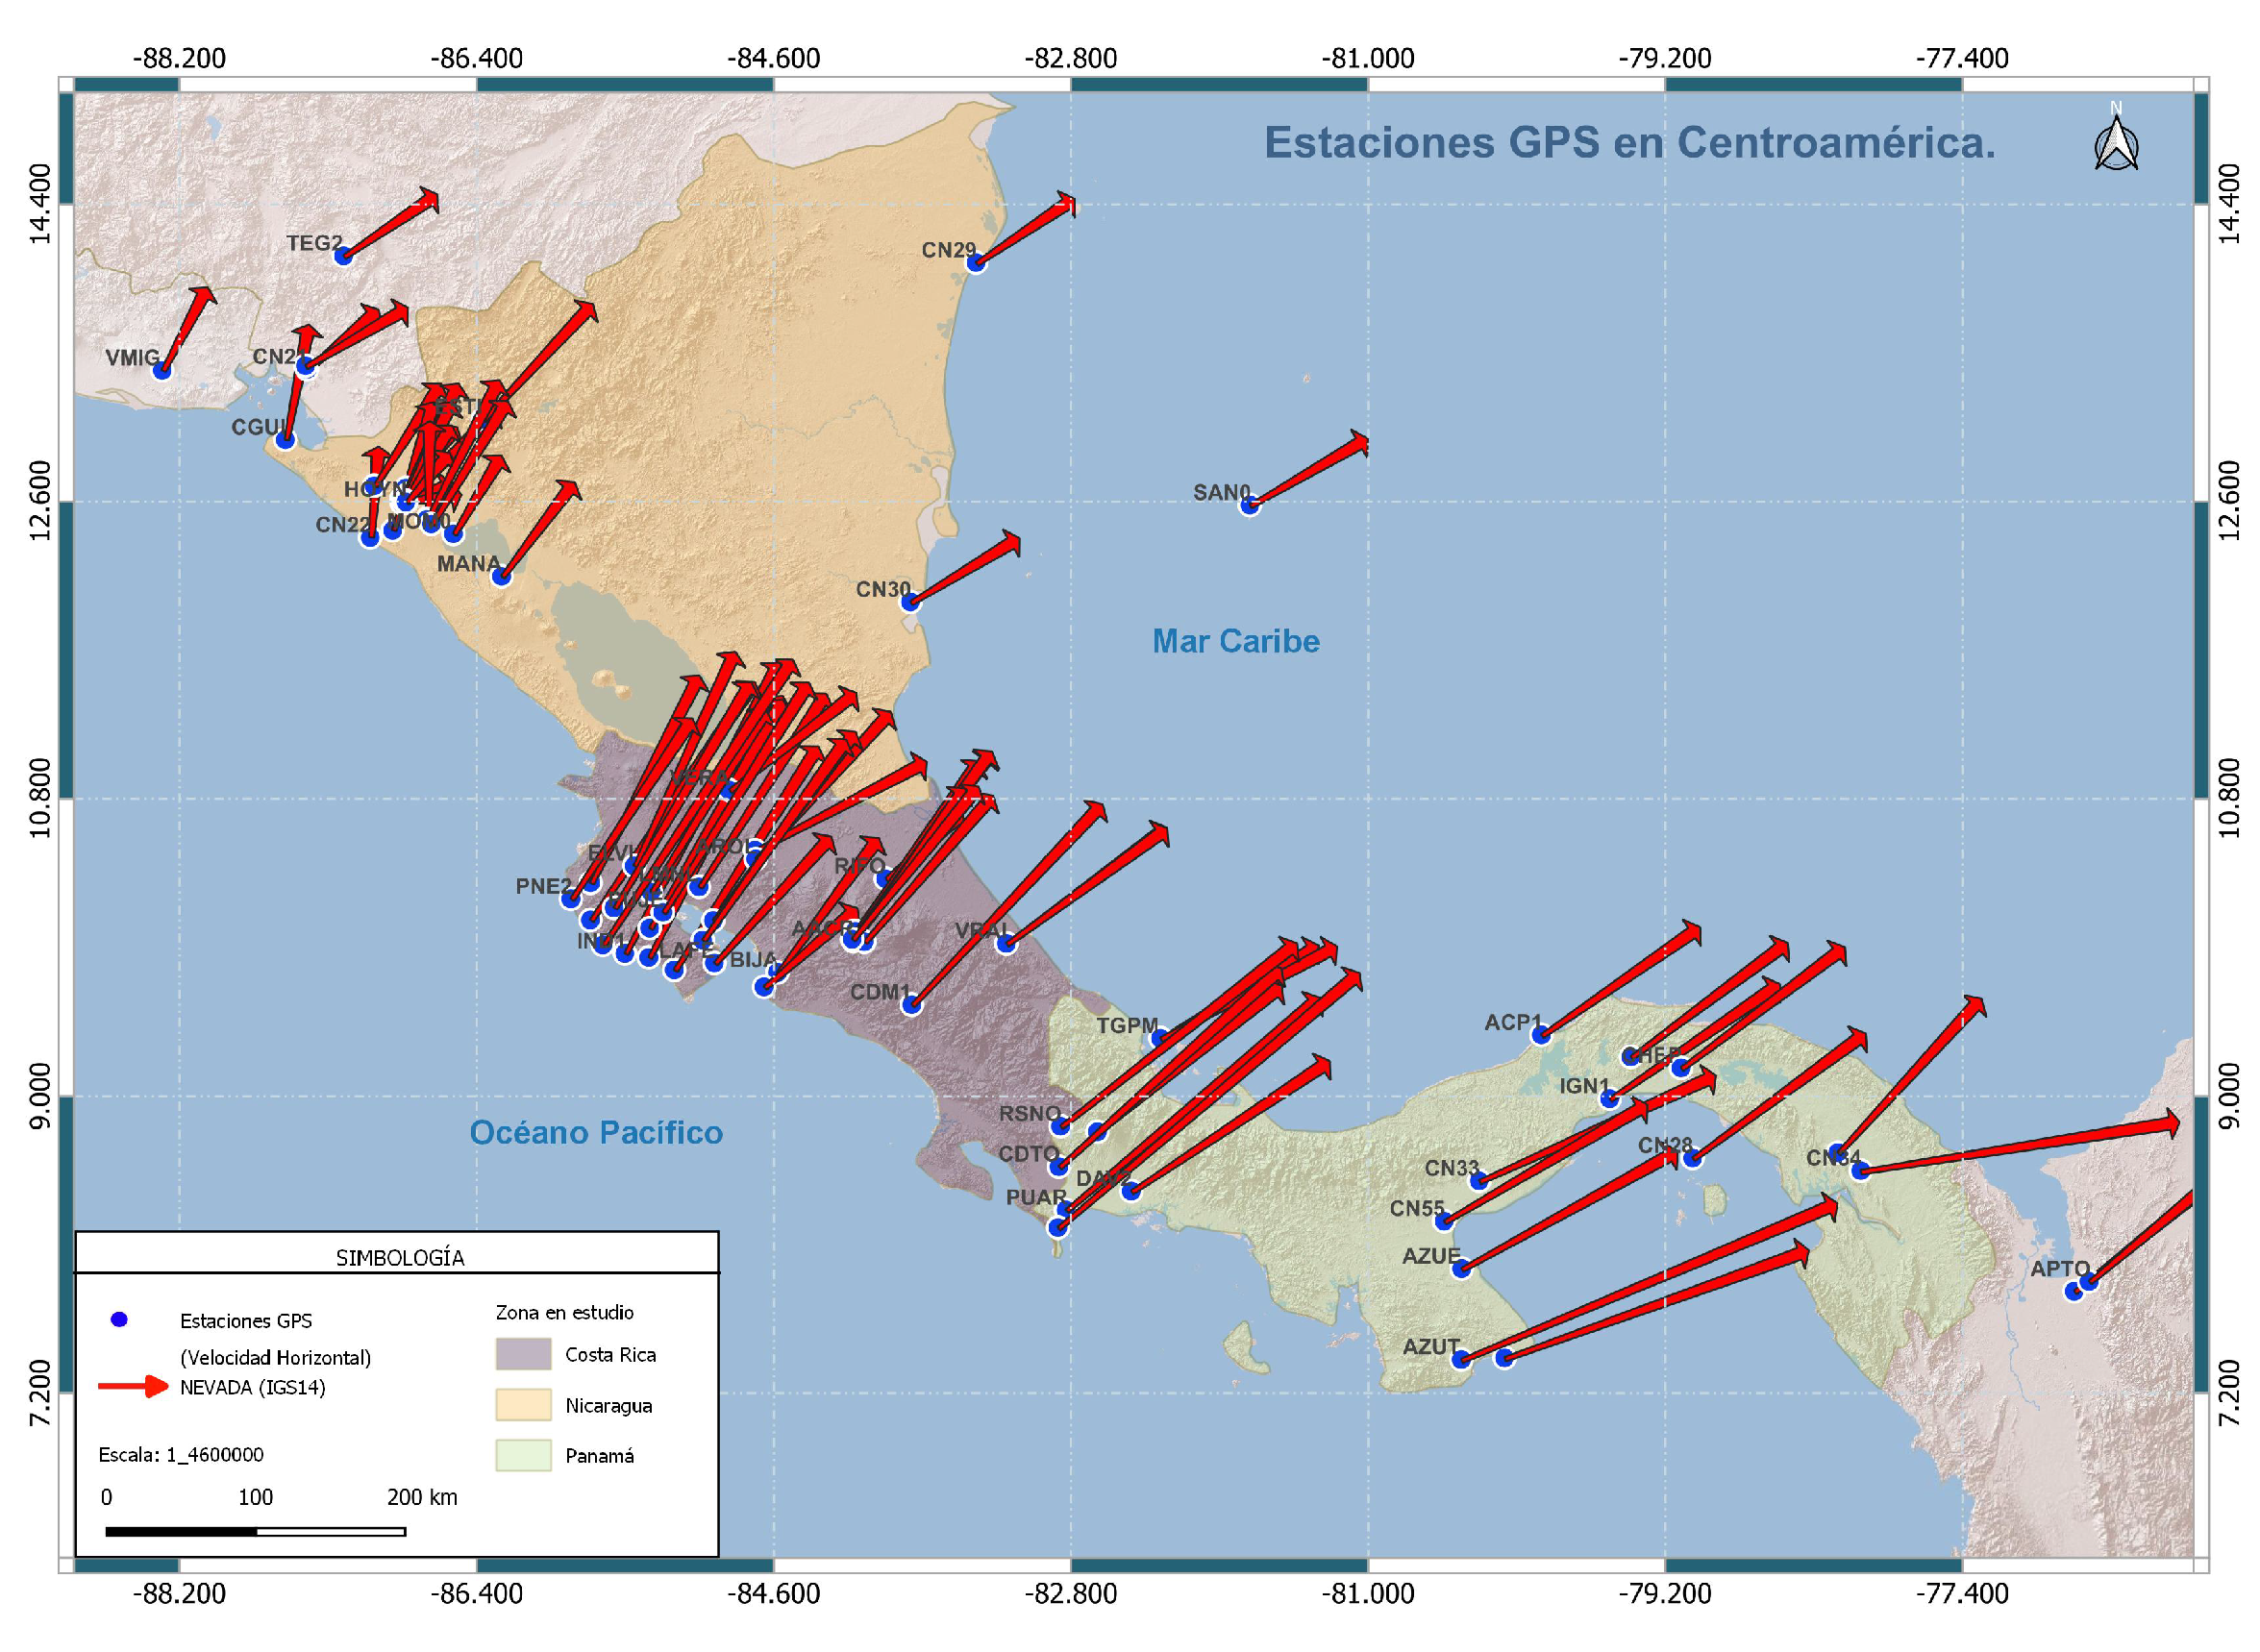
Abstract
1. Introduction
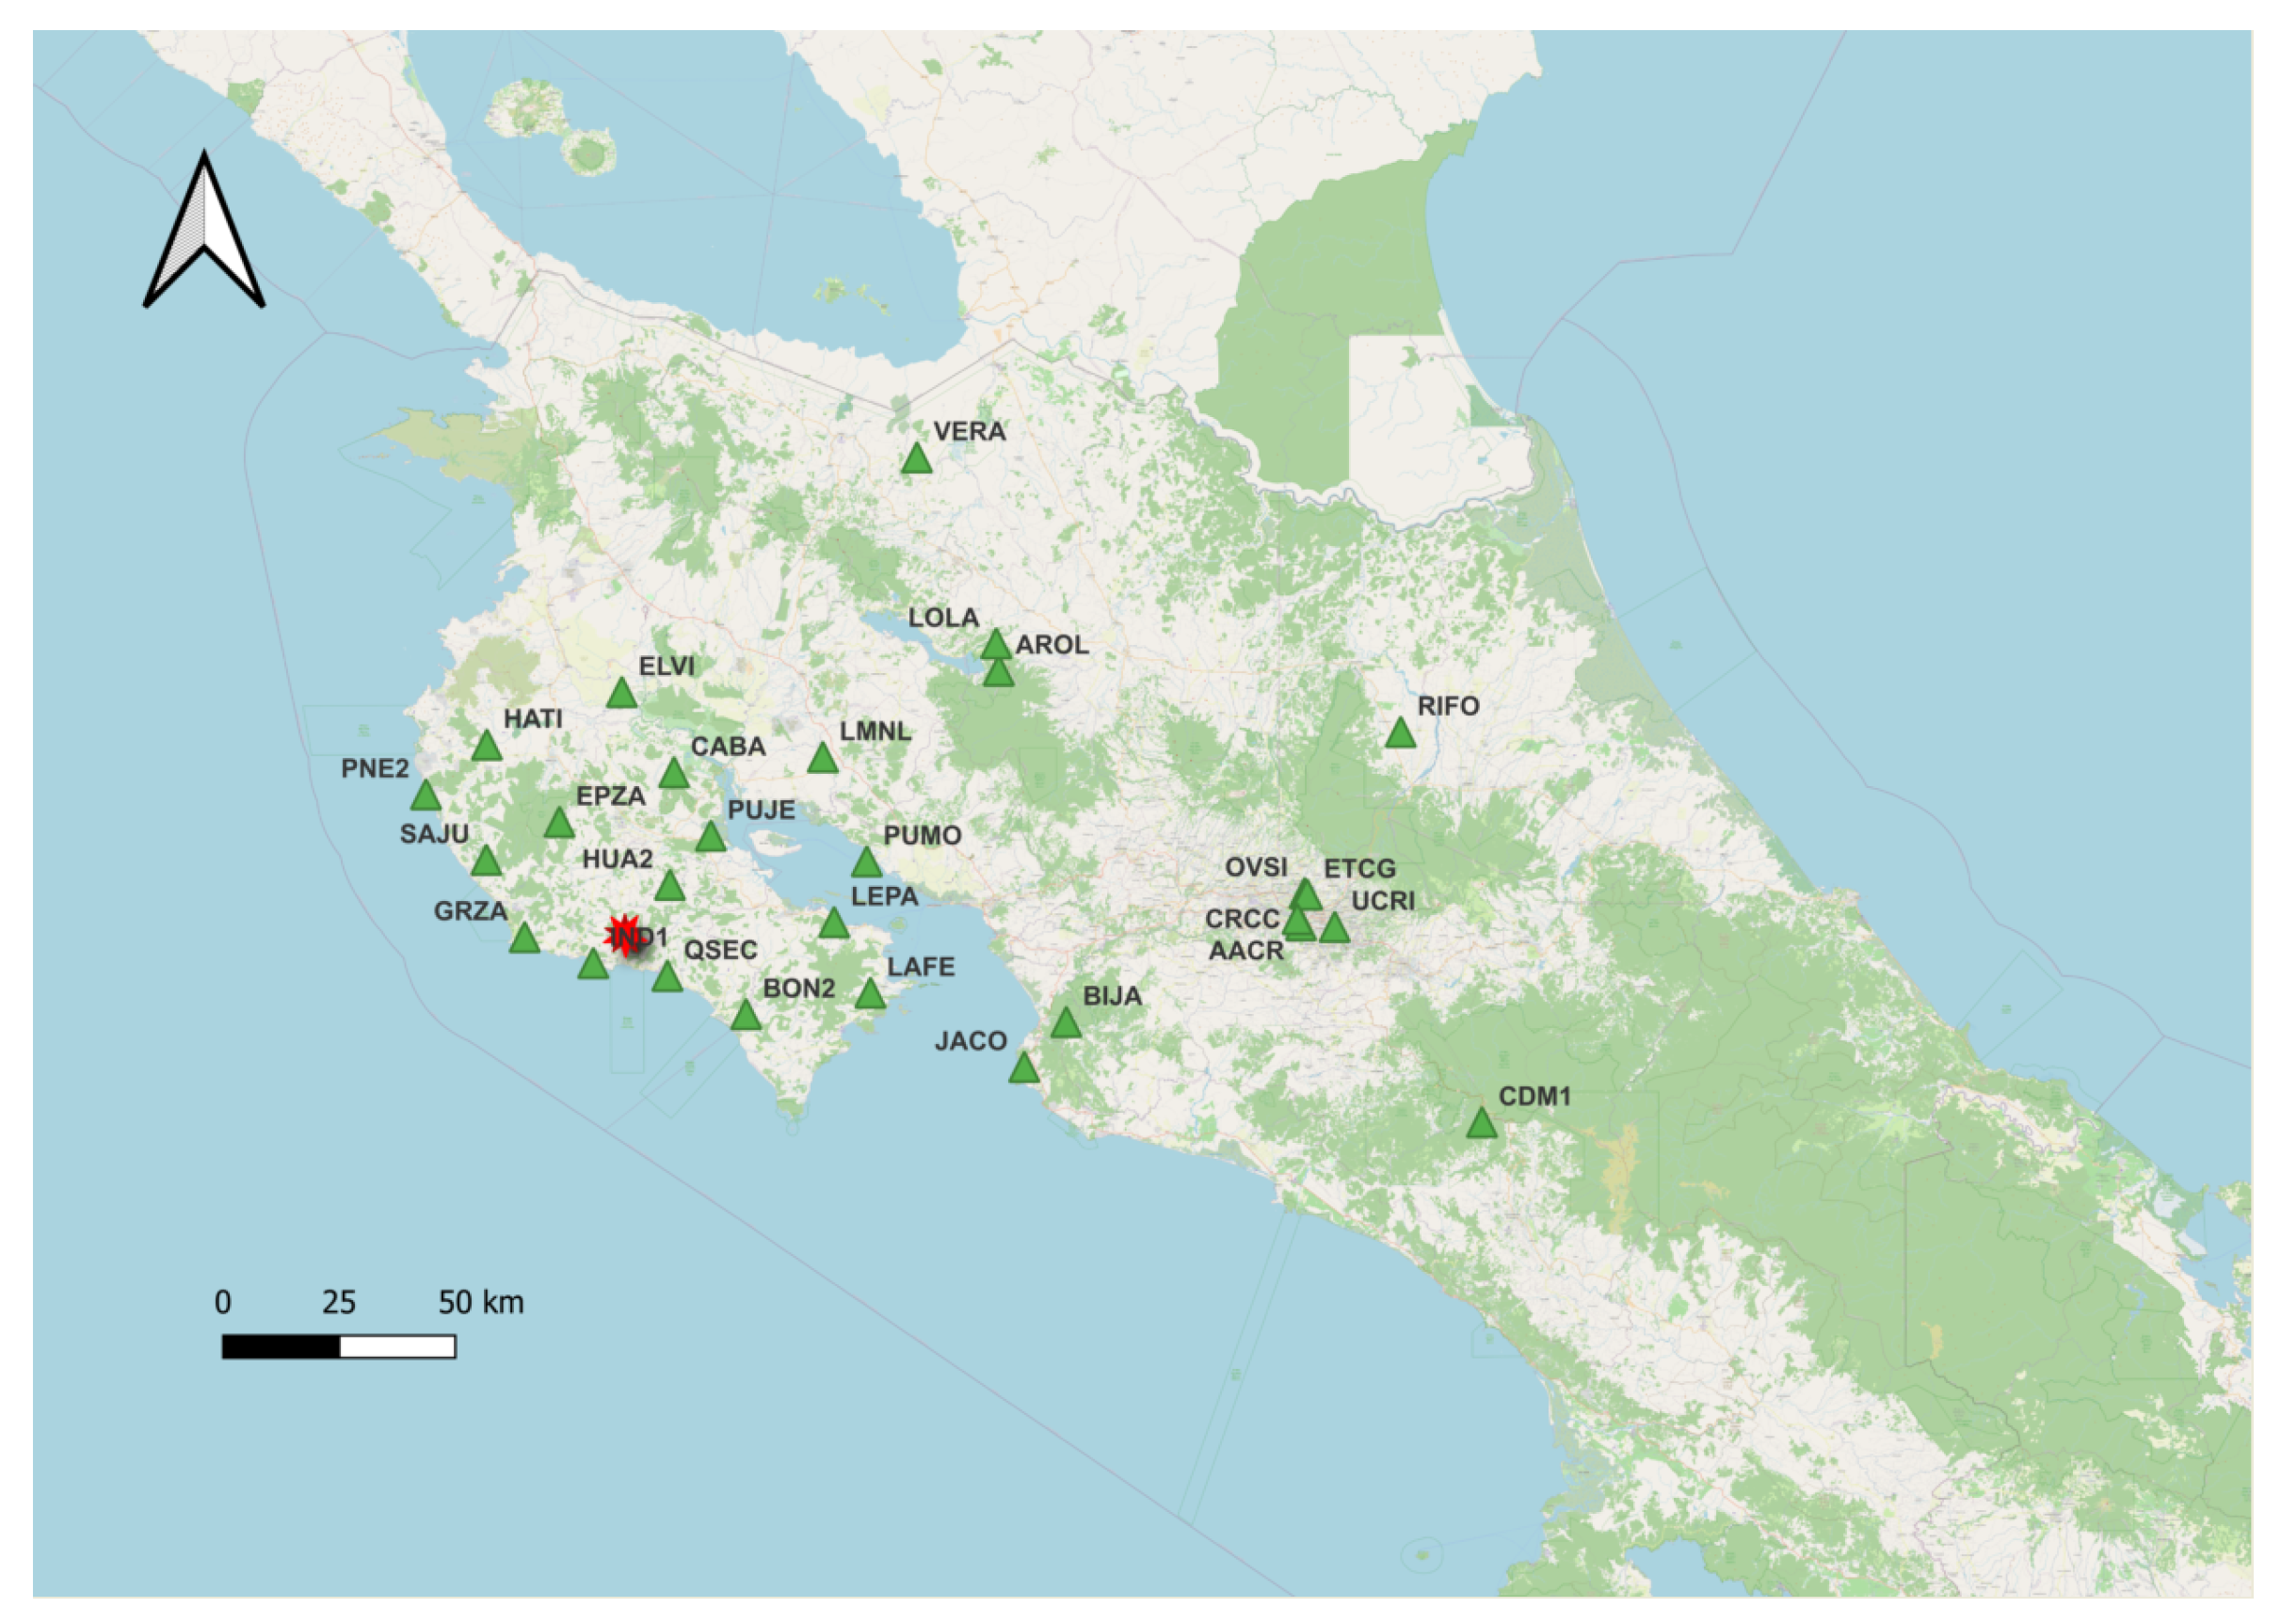
2. Data Collection
3. Methodology
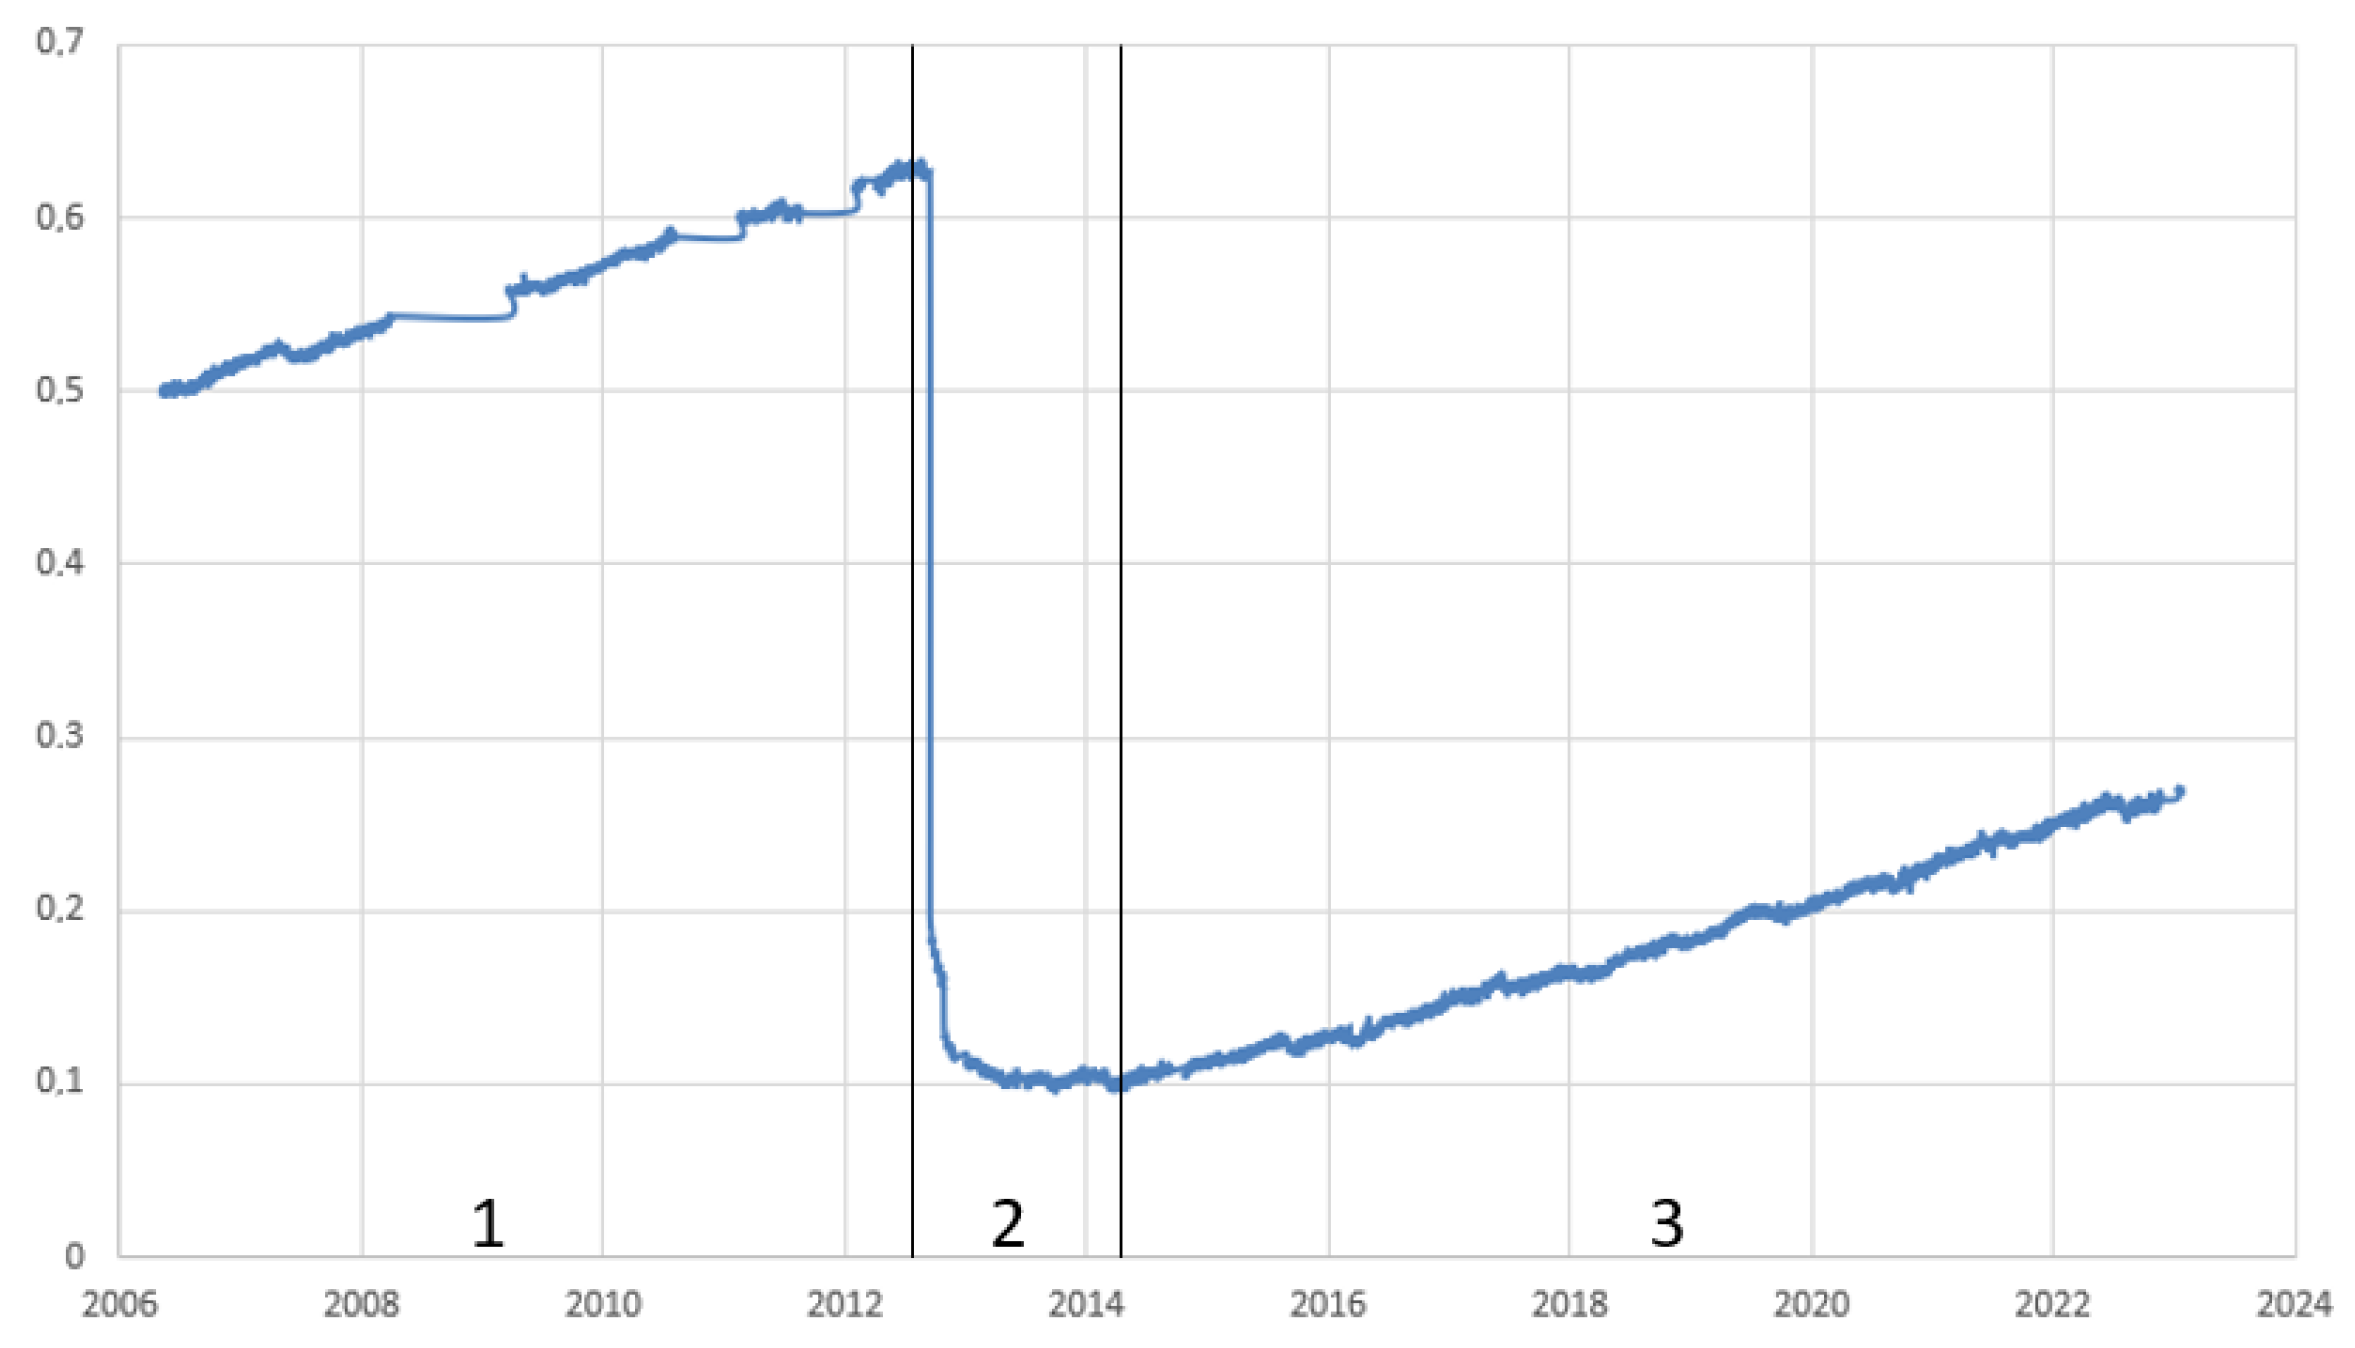
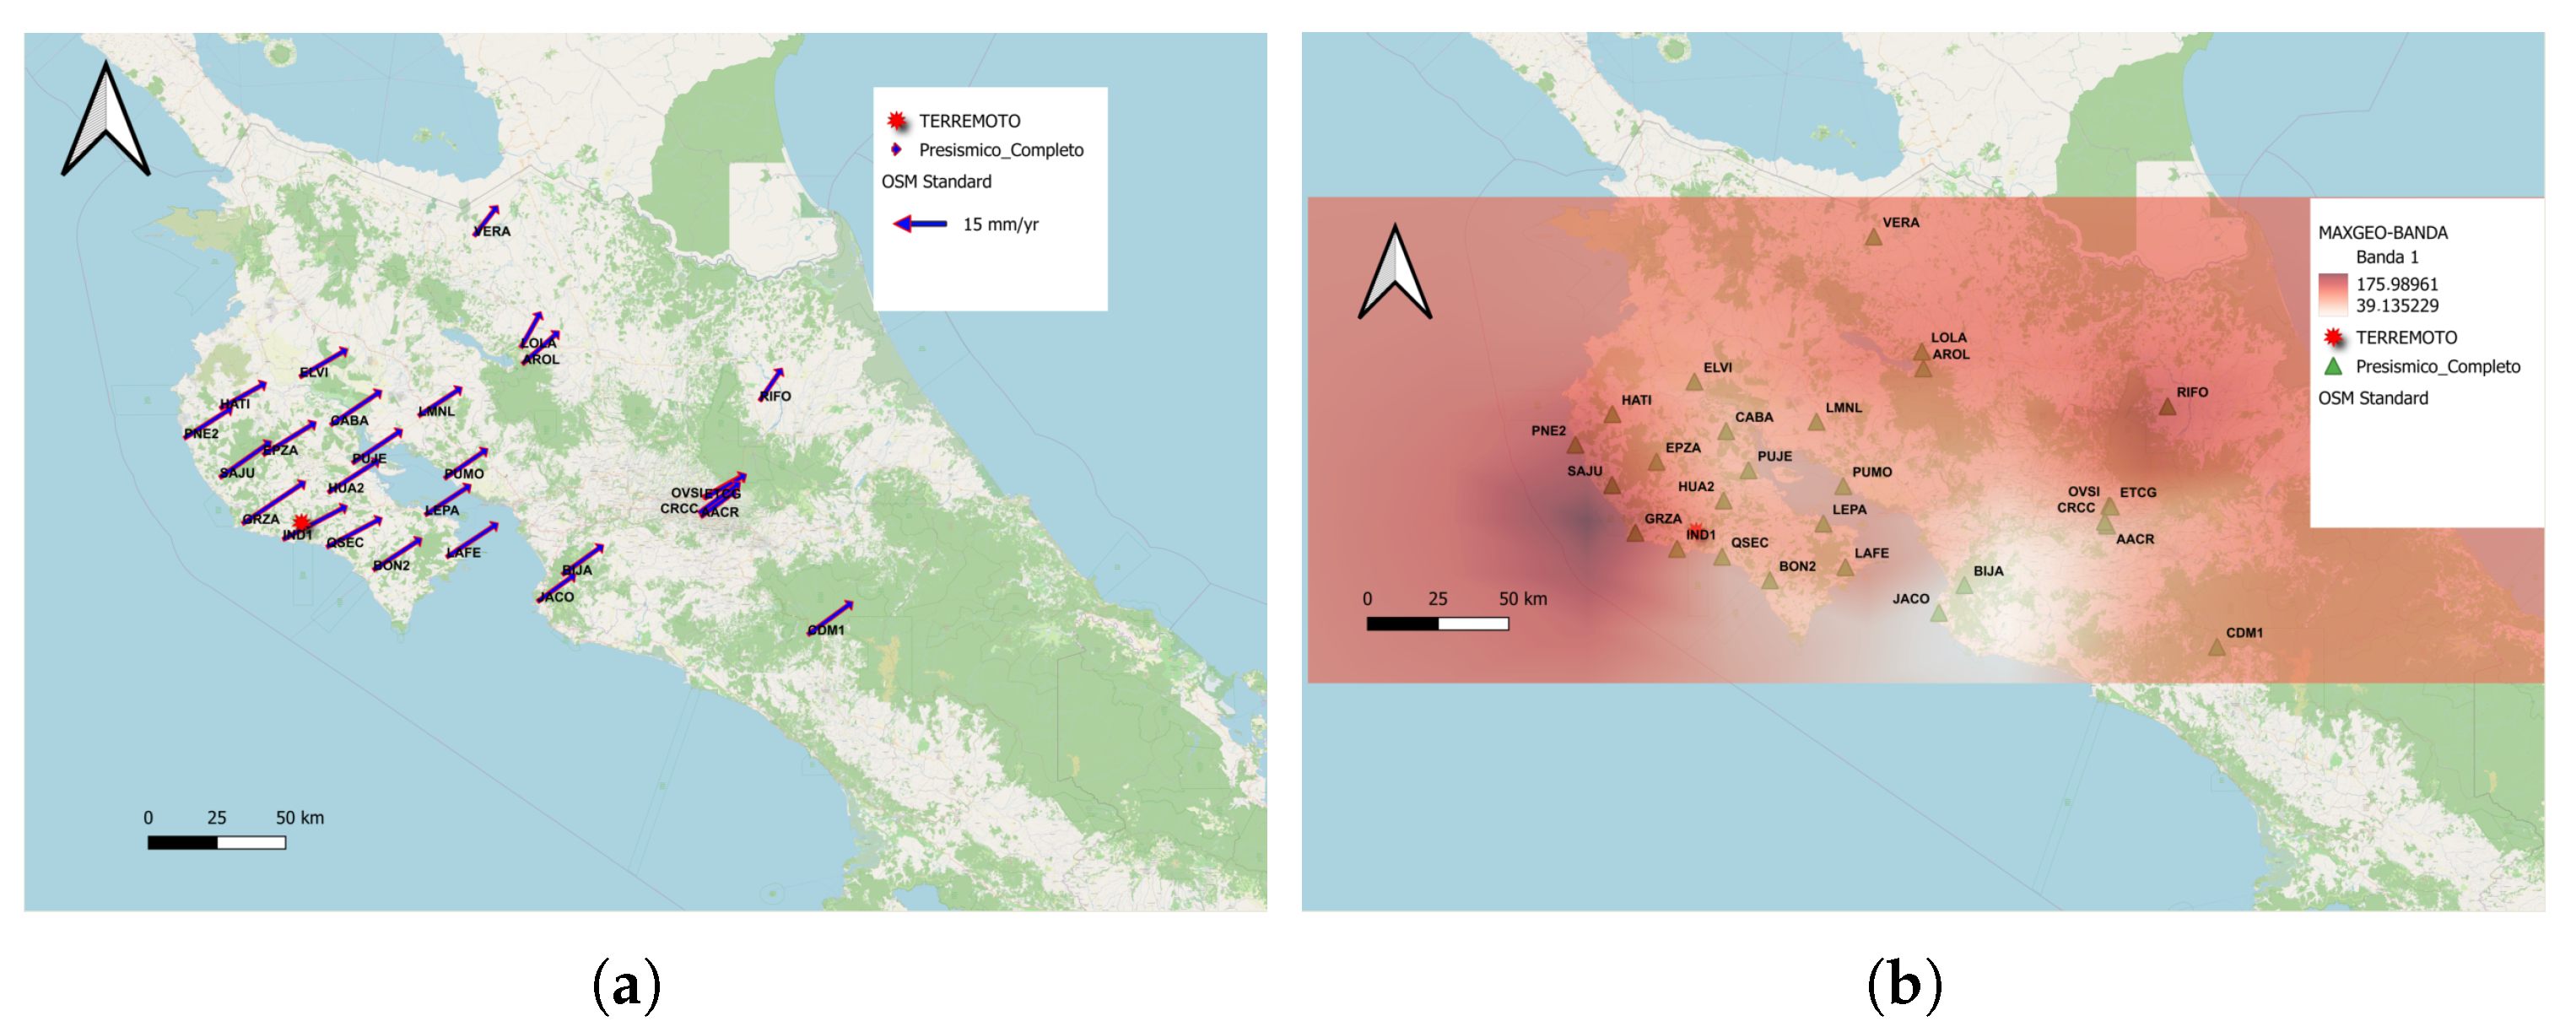
4. Analysis of the Series Affected by the Earthquake
5. Conclusions
Author Contributions
Funding
Institutional Review Board Statement
Informed Consent Statement
Data Availability Statement
Acknowledgments
Conflicts of Interest
References
- Burke, K.; Fox, P.J.; Şengör, A.M.C. Buoyant ocean floor and the evolution of the Caribbean. J. Geophys. Res. 1978, 83, 3949–3954. [Google Scholar] [CrossRef]
- James, K.H. Arguments for and against the Pacific origin of the Caribbean Plate: Discussion, finding for an inter-American origin. Geológica Acta Int. Earth Sci. J. 2006, 4, 279–302. Available online: https://www.redalyc.org/pdf/505/50540216.pdf (accessed on 24 April 2023).
- Pindell, J.; Dewey, J.F. Permo-triassic reconstruction of western Pangea and the evolution of the Gulf of Mexico/Caribbean region. Tectonics 1982, 1, 179–211. [Google Scholar] [CrossRef]
- Barrera-Lopez, C.V.; Mooney, W.D.; Kaban, M.K. Regional geophysics of the Caribbean and northern South America: Implications for tectonics. Geochem. Geophys. Geosystems 2022, 23, e2021GC010112. [Google Scholar] [CrossRef]
- van Benthem, S.; Govers, R.; Spakman, W.; Wortel, R. Tectonic evolution and mantle structure of the Caribbean. J. Geophys. Res. Solid Earth 2013, 118, 3019–3036. [Google Scholar] [CrossRef]
- Molnar, P.; Sykes, L.R. Tectonics of the Caribbean and middle America regions from focal mechanisms and seismicity. Geol. Soc. Am. Bull. 1969, 80, 1639–1684. [Google Scholar] [CrossRef]
- García-Reyes, A.; Dyment, J. Structure, age, and origin of the Caribbean Plate unraveled. Earth Planet. Sci. Lett. 2021, 571, 117100. [Google Scholar] [CrossRef]
- DeMets, C. A new estimate for present-day Cocos-Caribbean plate motion: Implications for slip along the Central American volcanic arc. Geophys. Res. Lett. 2001, 28, 4043–4046. [Google Scholar] [CrossRef]
- DeMets, C.; Gordon, R.G.; Argus, D.F. Geologically current plate motions. Geophys. J. Int. 2010, 181, 1–80. [Google Scholar] [CrossRef]
- Outerbridge, K.C.; Dixon, T.H.; Schwartz, S.Y.; Walter, J.I.; Protti, M.; Gonzalez, V.; Rabbel, W. A tremor and slip event on the Cocos-Caribbean subduction zone as measured by a global positioning system (GPS) and seismic network on the Nicoya Peninsula, Costa Rica. J. Geophys. Res. Solid Earth 2010, 115, B10. [Google Scholar] [CrossRef]
- LaFemina, P.; Dixon, T.H.; Govers, R.; Norabuena, E.; Turner, H.; Saballos, A.; Mattioli, G.; Protti, M.; Strauch, W. Fore-arc motion and Cocos Ridge collision in Central America. Geochem. Geophys. Geosyst. 2009, 10, Q05S14. [Google Scholar] [CrossRef]
- Norabuena, E.; Dixon, T.H.; Schwartz, S.; DeShon, H.; Newman, A.; Protti, M.; Gonzalez, V.; Dorman, L.; Flueh, E.R.; Lundgren, P. Geodetic and seismic constraints on seismogenic zone processes in Costa Rica. J. Geophys. Res. 2004, 109, B11403. [Google Scholar] [CrossRef]
- Barckhausen, U.; Ranero, C.R.; von Huene, R.; Cande, S.C.; Roeser, H.A. Revised tectonic boundaries in the Cocos Plate off Costa Rica: Implications for the segmentation of the convergent margin and for plate tectonic models. J. Geophys. Res. Solid Earth 2001, 106, 19207–19220. [Google Scholar] [CrossRef]
- Protti, M.; McNally, K.; Pacheco, J.; Gonzalez, V.; Montero, C.; Segura, J.; Schillinger, W. The March 25, 1990 (Mw = 7.0, ML = 6.8), earthquake at the entrance of the Nicoya Gulf, Costa Rica: Its prior activity, foreshocks, aftershocks, and triggered seismicity. J. Geophys. Res. Solid Earth 1995, 100, 20345–20358. [Google Scholar] [CrossRef]
- Malservisi, R.; Schwartz, S.Y.; Voss, N.; Protti, M.; Gonzalez, V.; Dixon, T.H.; Voyenko, D. Multiscale postseismic behavior on a megathrust: The 2012 Nicoya earthquake, Costa Rica. Geochem. Geophys. Geosyst. 2015, 16, 1848–1864. [Google Scholar] [CrossRef]
- Protti, M.; González, V.; Newman, A.V.; Dixon, T.H.; Schwartz, S.Y.; Marshall, J.S.; Owen, S.E. Nicoya earthquake rupture anticipated by geodetic measurement of the locked plate interface. Nat. Geosci. 2014, 7, 117–121. [Google Scholar] [CrossRef]
- Yue, H.; Lay, T.; Schwartz, S.Y.; Rivera, L.; Protti, M.; Dixon, T.H.; Newman, A.V. The 5 September 2012 Nicoya, Costa Rica Mw 7.6 earthquake rupture process from joint inversion of high-rate GPS, strong-motion, and teleseismic P wave data and its relationship to adjacent plate boundary interface properties. J. Geophys. Res. Solid Earth 2013, 118, 5453–5466. [Google Scholar] [CrossRef]
- Satake, K. Mechanism of the 1992 Nicaragua tsunami earthquake. Geophys. Res. Lett. 1994, 21, 2519–2522. [Google Scholar] [CrossRef]
- Jiang, Y.; Wdowinski, S.; Dixon, T.H.; Hackl, M.; Protti, M.; Gonzalez, V. Slow slip events in Costa Rica detected by continuous GPS observations, 2002–2011. Geochem. Geophys. Geosyst. 2012, 13, 8–13. [Google Scholar] [CrossRef]
- Brodsky, E.E.; Mori, J. Creep events slip less than ordinary earthquakes. Geophys. Res. Lett. 2007, 34, L16309. [Google Scholar] [CrossRef]
- Dixon, T.H.; Jiang, Y.; Malservisi, R.; McCaffrey, R.; Voss, N.; Protti, M.; Gonzalez, V. Earthquake and tsunami forecasts: Relation of slow slip events to subsequent earthquake rupture. Proc. Natl. Acad. Sci. USA 2014, 111, 17039–17044. [Google Scholar] [CrossRef] [PubMed]
- Xie, S.; Dixon, T.H.; Protti, M.; Malservisi, R.; Jiang, Y.; Muller, C. Shallow versus deep slow slip events on the Nicoya megathrust observed with GPS. In AGU Fall Meeting Abstracts; American Geophysical Union: Washington, DC, USA, 2020; Volume 2020, pp. 003–0018. [Google Scholar]
- Linkimer, L.; Barquero, R.; Vargas, A.; Rojas, W.; Taylor, M.; Araya, M.C. Actividad sísmica en Costa Rica durante el 2012. Rev. Geológica América Cent. 2013, 49, 141–148. [Google Scholar] [CrossRef]
- Takahashi, H. Static strain and stress changes in Eastern Japan due to 2011 off thePacific coast of Tohoku Earthquake, as derived from GPS data. Earth Planets Space 2011, 63, 741–744. [Google Scholar] [CrossRef]
- Kulkarni, M.N.; Radhakrishnan, N.; Rai, D. Global positioning system in disastermonitoring of Koyna Dam, western Maharashtra. Surv. Rev. 2006, 37, 490–497. [Google Scholar] [CrossRef]
- Blewitt, G.; Hammond, W.C.; Kreemer, C. Harnessing the GPS data explosion for interdisciplinary science. Eos 2018, 99. [Google Scholar] [CrossRef]
- Blewitt, G.; Kreemer, C.; Hammond, W.C.; Gazeaux, J. MIDAS robust trendestimator for accurate GPS station velocities without step detection. J. Geophys. Res. Solid Earth 2016, 121, 2054–2068. [Google Scholar] [CrossRef]
- Barba, P.; Rosado, B.; Ramírez-Zelaya, J.; Berrocoso, M. Comparative Analysis of Statistical and Analytical Techniques for the Study of GNSS Geodetic Time Series. Eng. Proc. 2021, 5, 21. [Google Scholar]
- Ramírez-Zelaya, J.; Peci, L.M.; Fernández-Ros, A.; Rosado, B.; Pérez-Peña, A.; Gárate, J.; Berrocoso, M. Q–Str2–Models: A software in PyQGIS to obtain Stress–Strain models from GNSS geodynamic velocities. Comput. Geosci. 2023, 172, 105308. [Google Scholar] [CrossRef]


Disclaimer/Publisher’s Note: The statements, opinions and data contained in all publications are solely those of the individual author(s) and contributor(s) and not of MDPI and/or the editor(s). MDPI and/or the editor(s) disclaim responsibility for any injury to people or property resulting from any ideas, methods, instructions or products referred to in the content. |
© 2023 by the authors. Licensee MDPI, Basel, Switzerland. This article is an open access article distributed under the terms and conditions of the Creative Commons Attribution (CC BY) license (https://creativecommons.org/licenses/by/4.0/).
Share and Cite
Barba, P.; Pérez-Méndez, N.; Ramírez-Zelaya, J.; Rosado, B.; Jiménez, V.; Berrocoso, M. Geodynamic Modeling in Central America Based on GNSS Time Series Analysis—Special Case: The Nicoya Earthquake (Costa Rica, 2012). Eng. Proc. 2023, 39, 84. https://doi.org/10.3390/engproc2023039084
Barba P, Pérez-Méndez N, Ramírez-Zelaya J, Rosado B, Jiménez V, Berrocoso M. Geodynamic Modeling in Central America Based on GNSS Time Series Analysis—Special Case: The Nicoya Earthquake (Costa Rica, 2012). Engineering Proceedings. 2023; 39(1):84. https://doi.org/10.3390/engproc2023039084
Chicago/Turabian StyleBarba, Paola, Nely Pérez-Méndez, Javier Ramírez-Zelaya, Belén Rosado, Vanessa Jiménez, and Manuel Berrocoso. 2023. "Geodynamic Modeling in Central America Based on GNSS Time Series Analysis—Special Case: The Nicoya Earthquake (Costa Rica, 2012)" Engineering Proceedings 39, no. 1: 84. https://doi.org/10.3390/engproc2023039084
APA StyleBarba, P., Pérez-Méndez, N., Ramírez-Zelaya, J., Rosado, B., Jiménez, V., & Berrocoso, M. (2023). Geodynamic Modeling in Central America Based on GNSS Time Series Analysis—Special Case: The Nicoya Earthquake (Costa Rica, 2012). Engineering Proceedings, 39(1), 84. https://doi.org/10.3390/engproc2023039084