Abstract
The purpose of this research was to determine how we can optimize both customer and seller experiences in a super shop using hyperautomation technology. Here, a smart bot was employed to speed up responses of simple consumer queries by utilizing natural language processing in real time. We also used machine learning frameworks, such as XGBoost, linear regression, random forest, and hybrid models together, to predict future product demand. In addition, data mining methods, such as the Apriori algorithm, FP growth algorithm, and GSP algorithm, were used to find out which algorithm can be used to determine the right way to place a product to increase the super shop sale.
Keywords:
hyperautomation; data mining; machine learning; NLP; voice bot; time-series analysis; hybrid model 1. Introduction
Hyperautomation is a business-driven automation process that combines artificial intelligence, machine learning, and robotic process automation, which can solve repetitive task patterns efficiently. In this research, we used this technology to improve a super shop in terms of service to the customers and for the internal improvement of customer-to-seller communications. Mainly three methodologies were used. For RPA, a voice bot was used, and for AI and ML data mining algorithms, prediction and forecasting were used.
The key contributions of this research are:
- (1)
- The voice bot and the product placement will help the customer to find their desired product very easily in an efficient way;
- (2)
- Product sales forecasting will help the super shop to maintain proper stock levels of products under high demand according to the market need.
2. Related Works
2.1. Chatbot and Voice Recognition Systems
The chatbot, Doly, uses NLP to converse with users and its accuracy increases with user inputs [1]. Chatbots can handle any format and generally provide accurate responses [2]. Python is needed to create BLTK tools, and adapters can employ techniques such as the dynamic programming method’s edit distance and naive Bayes classifier. Chatbots can reduce effort and response times, but they are sometimes not well known and can be erroneous, causing communication gaps and cost difficulties. Chatbot performance can be improved with conversation success measures.
2.2. Product Placement
Store managers usually put the most profitable goods on the top. Chen, M. found the contrary [3], i.e., customer attention is focused laterally and vertically in stores. According to Y. Ito and S. Kato [4], recognizing product connection in order picking can improve the shopping timing, and the order picking travel time is very high if the products are not placed wisely. Xiang used GSP to predict enterprise dynamic costs. In a changing market, it is crucial to know how to informatize to meet consumers’ brand preferences [5].
2.3. Product Sales Forecasting
Linear regression, a basic yet famous forecasting technique, was used to forecast the sales of a big superstore with an accuracy rate of 84% [6]. According to Ramachandra [7], when the dataset was balanced and using random forest regressor, it let them anticipate nonlinear trends and estimate black Friday sales with an 83.6% accuracy. XGBoost, another nonlinear algorithm, forecasts the short-term power load in [8]. To do so, a combination of K-means clustering, CART, and XGBoost with temperature and date factors were used.
3. Methodology
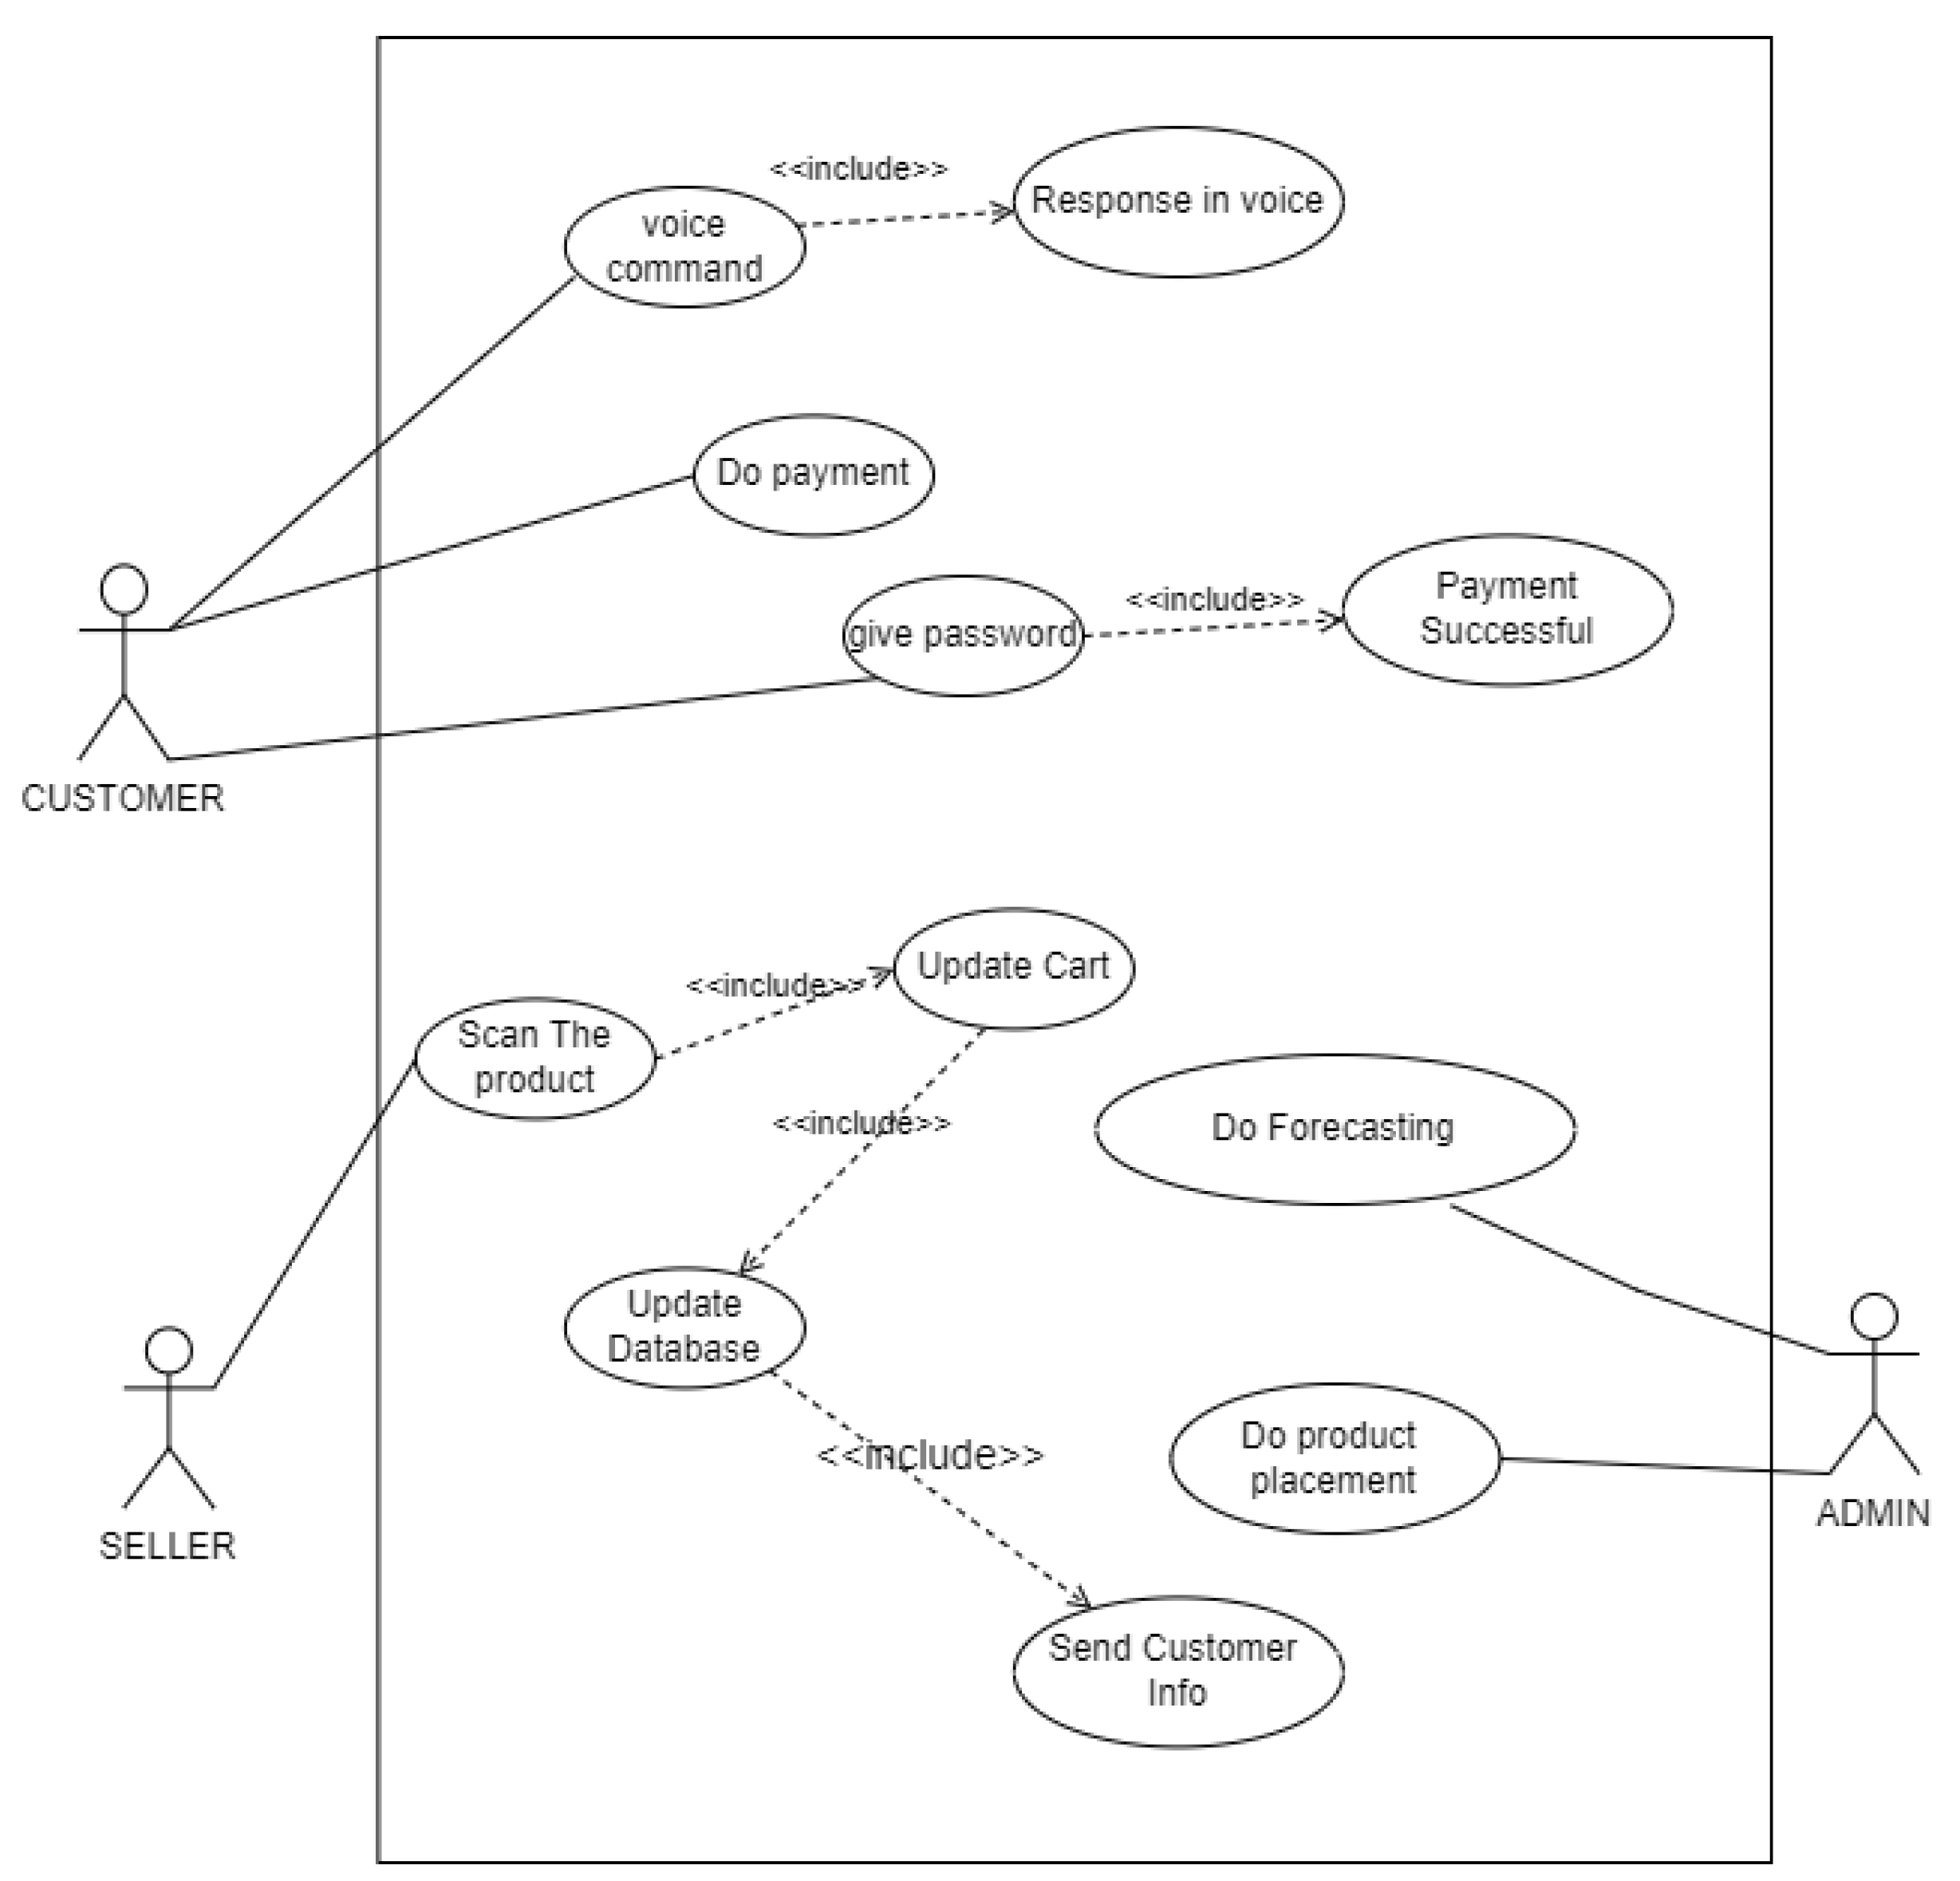
The use case diagram as shown in Figure 1 is our overall system.

Figure 1.
Super shop management system diagram.
3.1. Data Description
The real-world data source was from the Pran group “Daily shopping megastore”. It contains information from the shop’s sales from January 2022 through to December 2022 and contains 158,293 rows and 10 columns in total.
3.2. Data Preprocessing
3.2.1. Product Placement
In the dataset, we did not come across any null values. Later on, we simplified the presentation of our complete dataset by converting the data from the column that we were using into a list and applied one hot encoding to it.
3.2.2. Product Sales Forecasting (Daily)
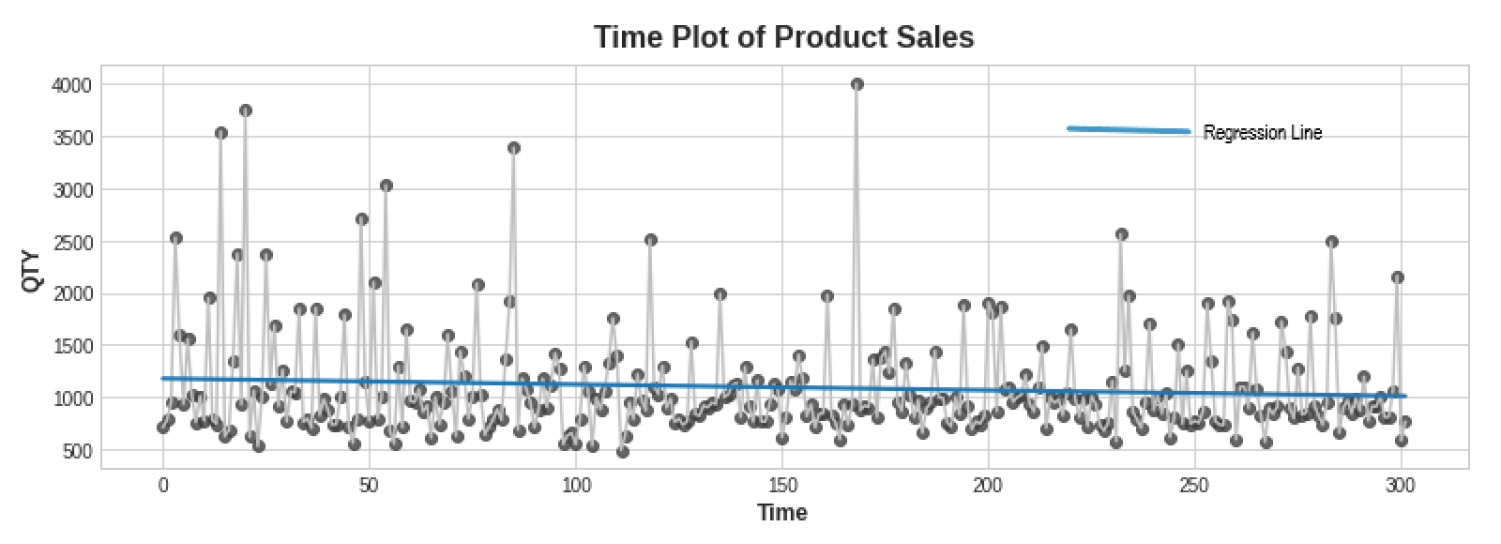
To create a time-series data frame, we performed null checking and removed the irrelevant column. Then, we transformed the date column to a date time datatype with a day as the period. Next, we summed up the daily total quantity sold with regard to the date column and transformed the resultant column into integer type. The Dickey–Fuller test revealed data stationarity with a p-value of less than 0.05. A time plot supports the claim in Figure 2.
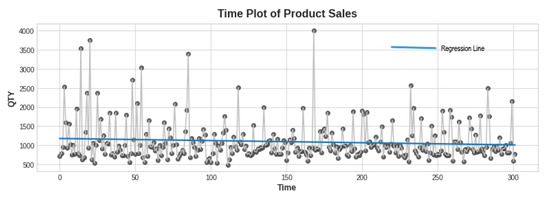
Figure 2.
Product sales time plotting.
Time steps and delays are important features of time-series forecasting. We created a supervised dataset using the shift function to retrieve daily sales delayed numbers.
3.2.3. Hybrid Preprocessing
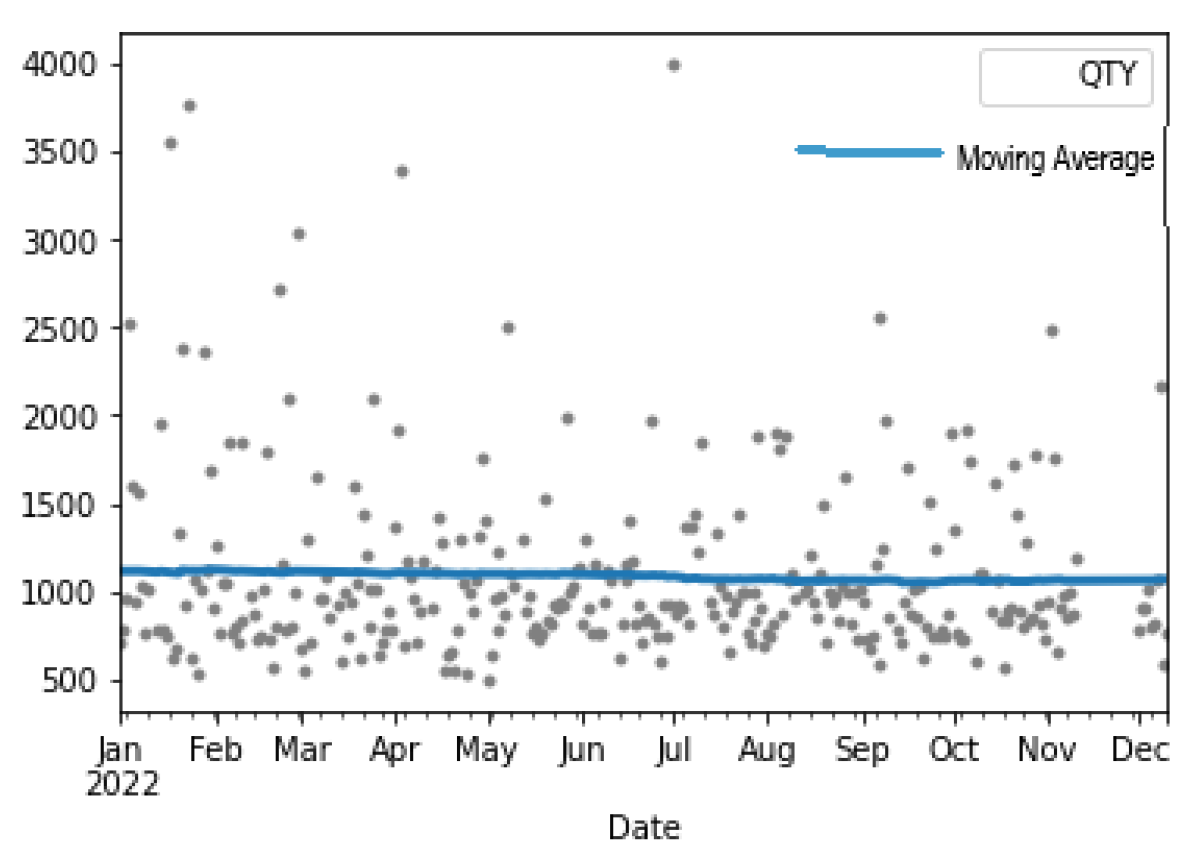
Figure 3 below is a moving average graph, which we used to try to figure out the dataset’s overall trend.

Figure 3.
Moving average graph of the entire dataset.
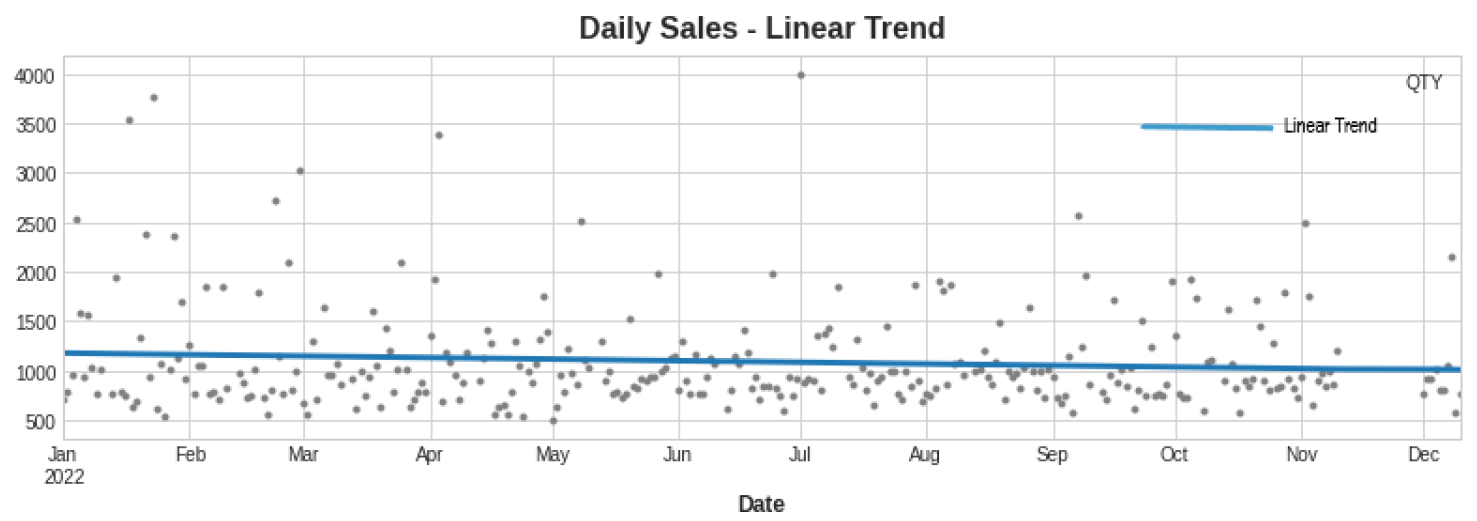
A linear trend, which is steady because data are stationary, is analogous to the current trend. As a result, we implemented a deterministic process of order = 1. Since the trend formed below is now analogous to the one generated above, we can deduce that a linear trend might be an asset to the hybridization method. We utilized training data from the previous (301 − 90) = 211 days and test data from the previous 90 days in both the standalone and hybrid implementations. The generated trend is shown in Figure 4.
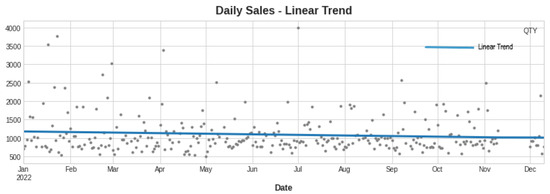
Figure 4.
Linear trend generation.
3.3. Model Specification
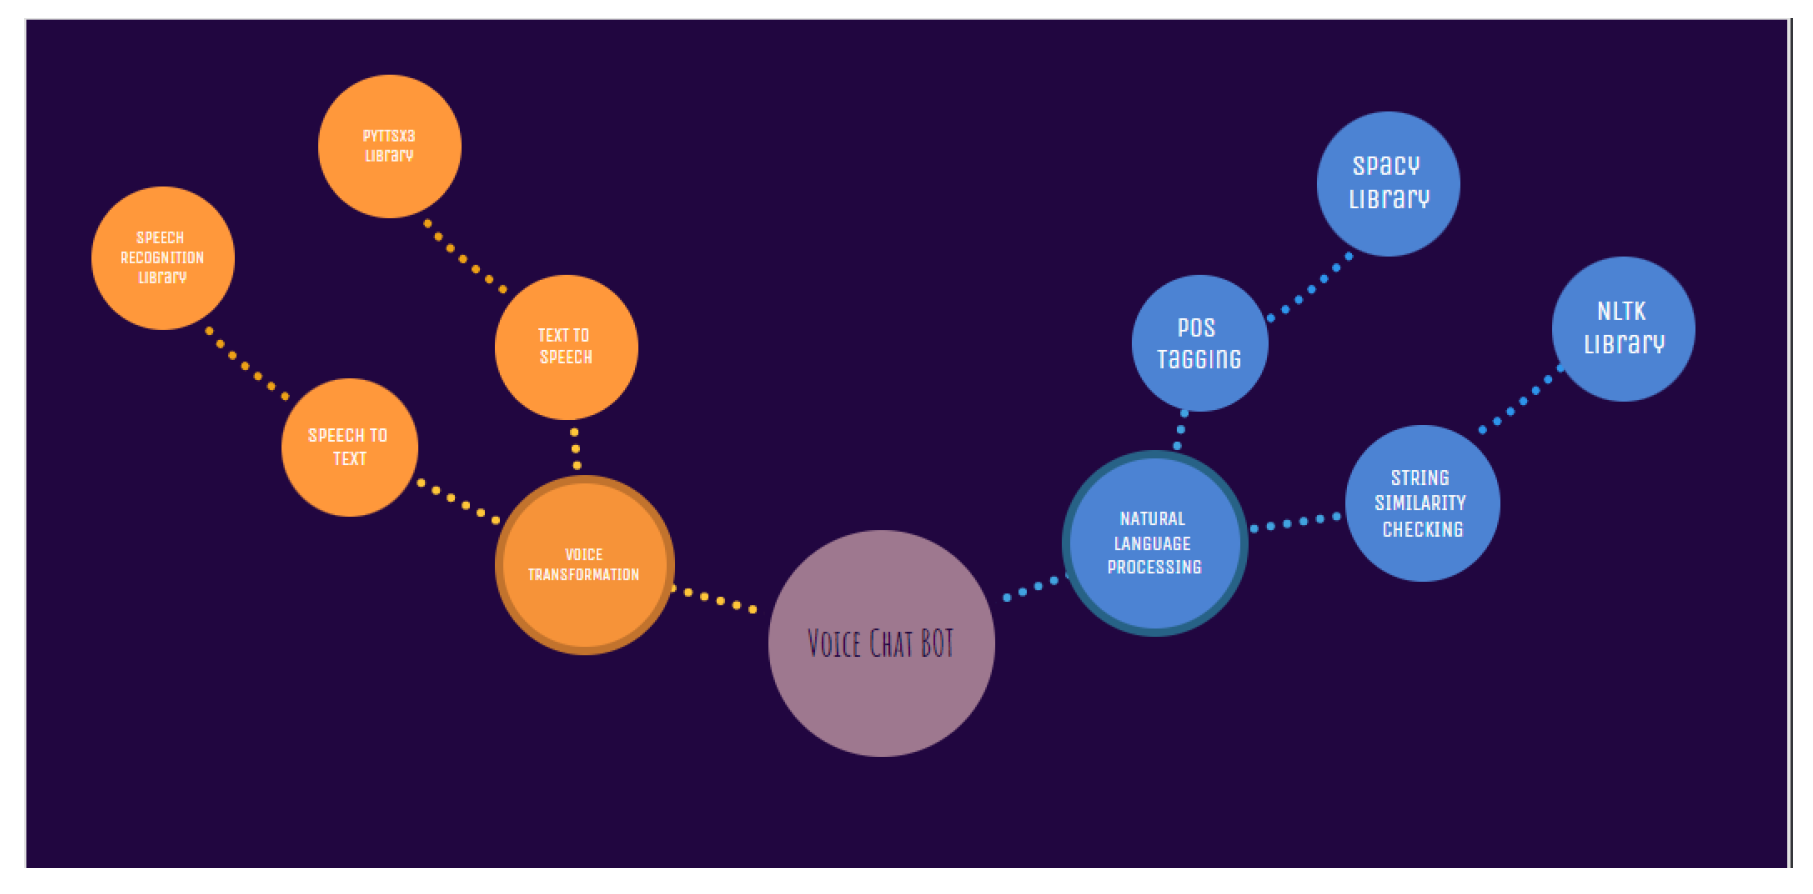
Since the voice chatbot is a well-known AI-based software used by many successful software companies, we decided to include it in this hyperautomation project, where it largely worked based on two essential concepts: to participate in conversation with our customers and to answer their questions. Voice bots follow spoken commands. The voice bot technology recognizes and transcribes the input voice. The voice bot then responds to requests by text and converts them to voice. In The Figure 5, concepts of a voice bot has been explained in workflow. of voice chat bot.
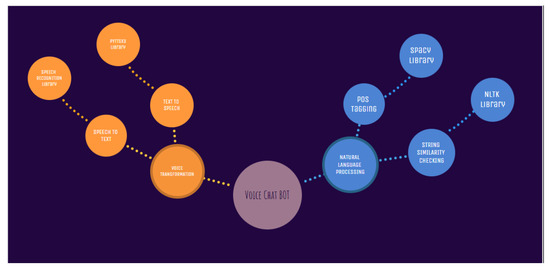
Figure 5.
The concepts of a voice bot.
Workflow: PyAudio, SpeechRecognition, and pandas must be installed to create an ideal voice chatbot. Spacy beats NLTK was used for word tokenization and POS tagging. POS tagging extracts relevant text and stores it in variables. NLTK’s ‘bleu’ function compares extracted data to dictionary data. The voice bot responds with the closest comparison. Lastly, the pyttsx3 library speaks the responded text.
3.3.1. Product Placement
Market basket analysis, a data mining method, is used in retail to identify purchase trends. We used the Apriori algorithm, FP growth algorithm, and GSP algorithm.
Implementation: We used all our three algorithms in our dataset, which contains the daily sales information of a super shop. By going through the data of first 10 months of sales, we tried to establish the relations between different products and product categories. Several metrics, including support, confidence, and lift, are utilized by data mining algorithms to extract these rules.
Support refers to the frequency of an item set in the transaction dataset.
Confidence indicates how often a rule appears to be true.
Lift is a measure that tells us the probability of consequent increases or decreases given the purchase of the antecedent.
We accepted rules that meet these measures’ minimal thresholds. We tested which method found all the rules faster using different minimum support and minimum confidence levels.
3.3.2. Product Sales Forecasting
In this research, three algorithms were chosen to perform forecasting: linear regression, random forest, and XGBoost.
Implementation: After importing the libraries and preprocessing, we implemented linear regression. As mentioned before, simple linear regression is
The algorithm learns the weight of each feature and picks the weight and bias depending on the best fit goal during training. After training, we fitted and predicted the model to obtain an approximation forecast to test using the test dataset. Next, we used the decision tree-based random forest. This renowned classification model worked effectively with our dataset to average the tree output. This training used bagging. This minimized overfitting. The Gini index determined this algorithm’s root node. This showed dataset impurity. The formula for this is
Then, we calculated the weighted Gini index, which is the total Gini index of a particular branch. The feature with lowest Gini index is chosen as the root node. Entropy can be used to calculate impurity. After setting up n estimators and the max depth parameter, which are the number of decision trees and their depth, we applied the model. Trees produced better quality but took longer. The gradient-boosted decision tree method XGBoost followed. Decision trees were used to determine this. Unlike random forest, XGBoost may change a leaf node into an if condition if it helps the model, as judged by the loss function. After the max depth, this method prunes backward. The loss function is as follows:
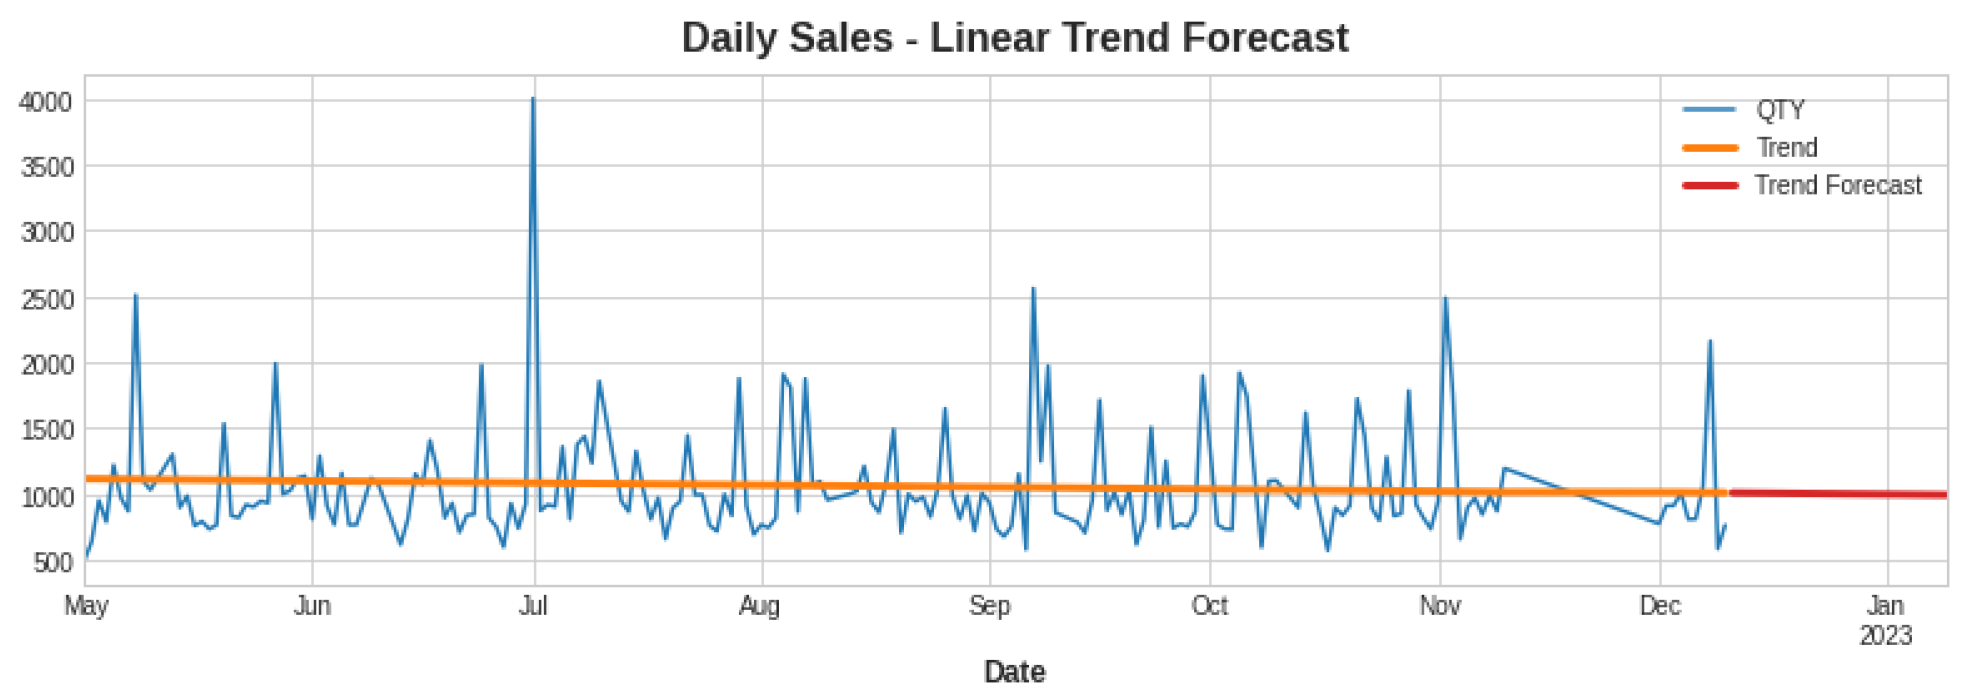
As a result, this improved the efficiency on the whole. Next, we attempted to see whether we could improve the performance by combining linear-random forest and linear-XGBoost in a hybrid model. In summary, linear regression was used initially for both training and prediction. We then used linear regression to make forecasts about the X train-1. Then, we used the residual series to fit a second model, which was the following: train the model of target series—the predicted series from the first model. Then, we used this information to forecast using the second model that we fitted with the additional feature values (X Train-2). At this point, we combined the two forecasts to form a unified one. Here, as said above, we obtained a linear trend; thus, we trained it using linear regression, and the overall trend for the out-of-bounds sample is shown in Figure 6.
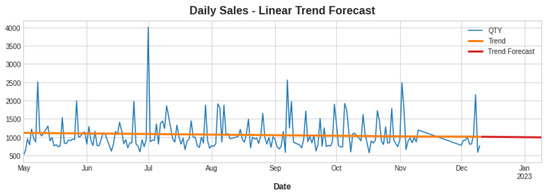
Figure 6.
Linear trend forecast.
Therefore, we extrapolated the trend and then removed it by transforming y and applying the next model on the error series.
4. Results
4.1. Voice Chat Bot
Text-to-voice was performed with pyttsx3. GTTS, IBM Watson Text to Speech, and Amazon Polly are online libraries that convert text to voice. With a local speech engine, pyttsx3 can work offline. Hence, our voice chatbot can speak without the internet. The Spacy library was used for part-of-speech tagging because it tokenizes words quickly and accurately. Nltk’s bleu function is more accurate than Spacy’s similarity function since it compares the voice input text to the dataset’s reference data.
4.2. Product Placement
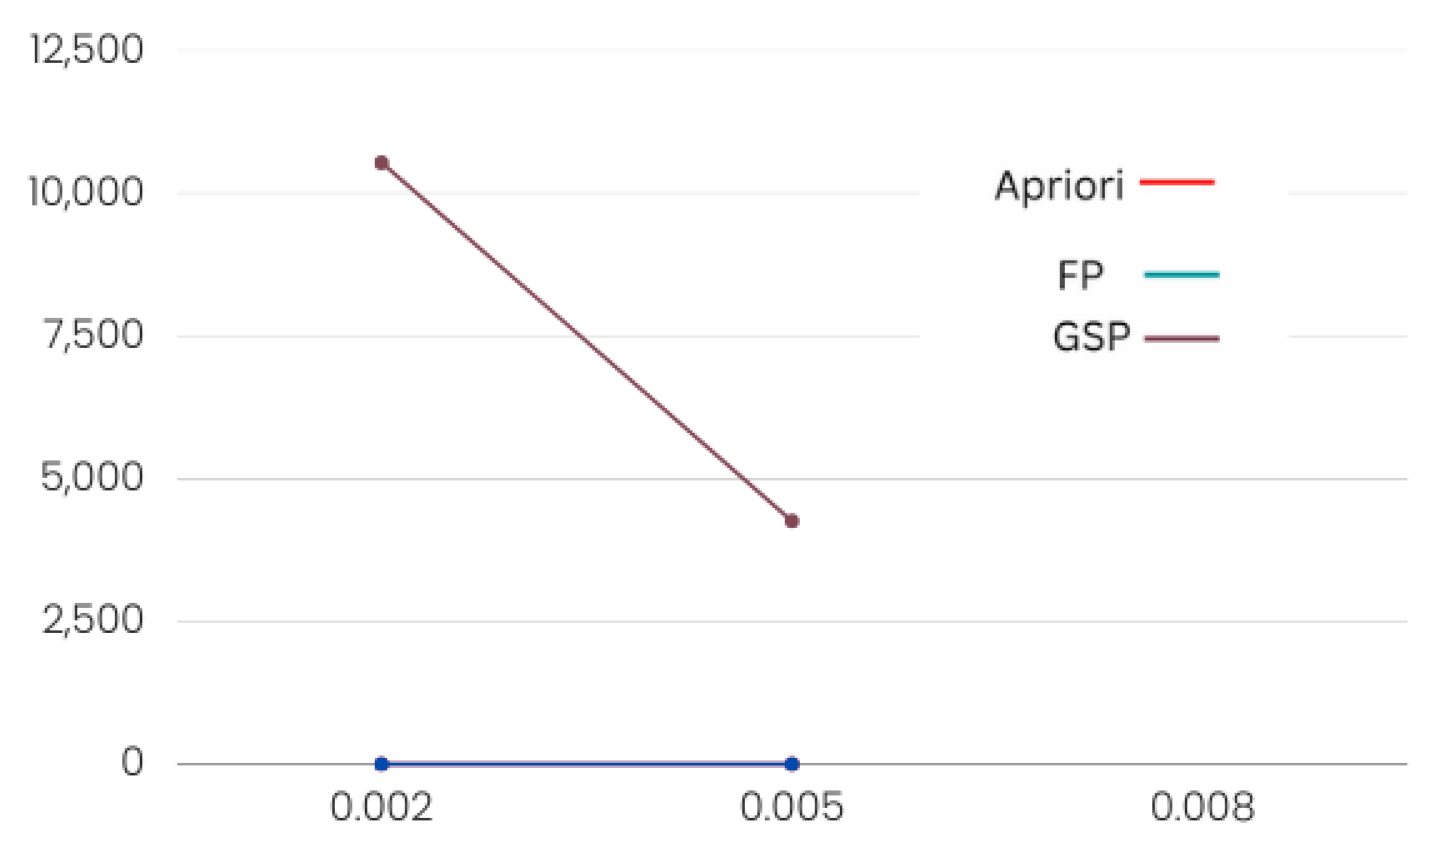
The FP growth algorithm outperformed Apriori and GSP. In Table 1 and Table 2, it is clear that, while verifying with different minimum support values, the Apriori and FP growth algorithms took almost the same amount of time. However, FP growth produced more rules. The Apriori algorithm runtime rose exponentially with transactions. The FP growth algorithm’s runtime exponentially grew with transactions. The FP growth method generated rules faster than the GSP and Apriori algorithms since it only iterates the dataset twice, while the other two algorithms iterate the dataset multiple times to generate rules.

Table 1.
Product category.
Table 2.
Product name.
As the FP growth algorithm in Figure 7 and Figure 8 performed better in comparison to the other two, we suggest using this algorithm for finding product placement rules.
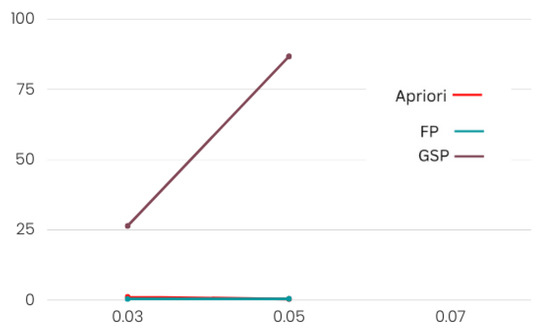
Figure 7.
Product category performance.
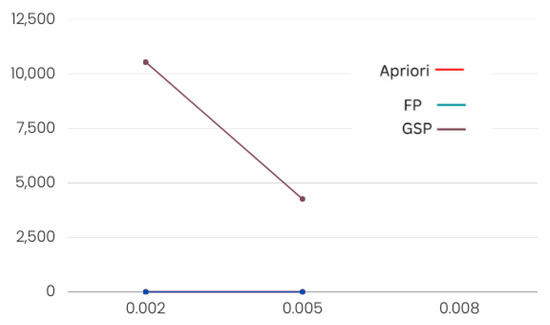
Figure 8.
Product name performance.
4.3. Product Sales Forecasting
We evaluated the algorithms using mean absolute error, root mean squared error, and mean absolute percentage error. All three individual algorithms exhibited bad performance. Hybridization improved both models to a 90% accuracy. This is because linear regression assists XGBoost and random forest in learning how to extrapolate trends beyond the training data. Mean absolute error measures the forecast-to-actual difference, but unfavorable outcomes are possible. Mean squared error may be used to calculate distance, although the unit is squared. Root mean squared error removes this. Finally, we calculated the total error using the mean absolute percentage error to interpret the forecast.
where At is the actual value, Ft is the forecasted value, and n is the number of summation iterations.
where xi is observations from the time series, xi bar is the estimated time series, and n is the number of nonmissing data points.
In the following, we verify the performance of the models using these metrics.
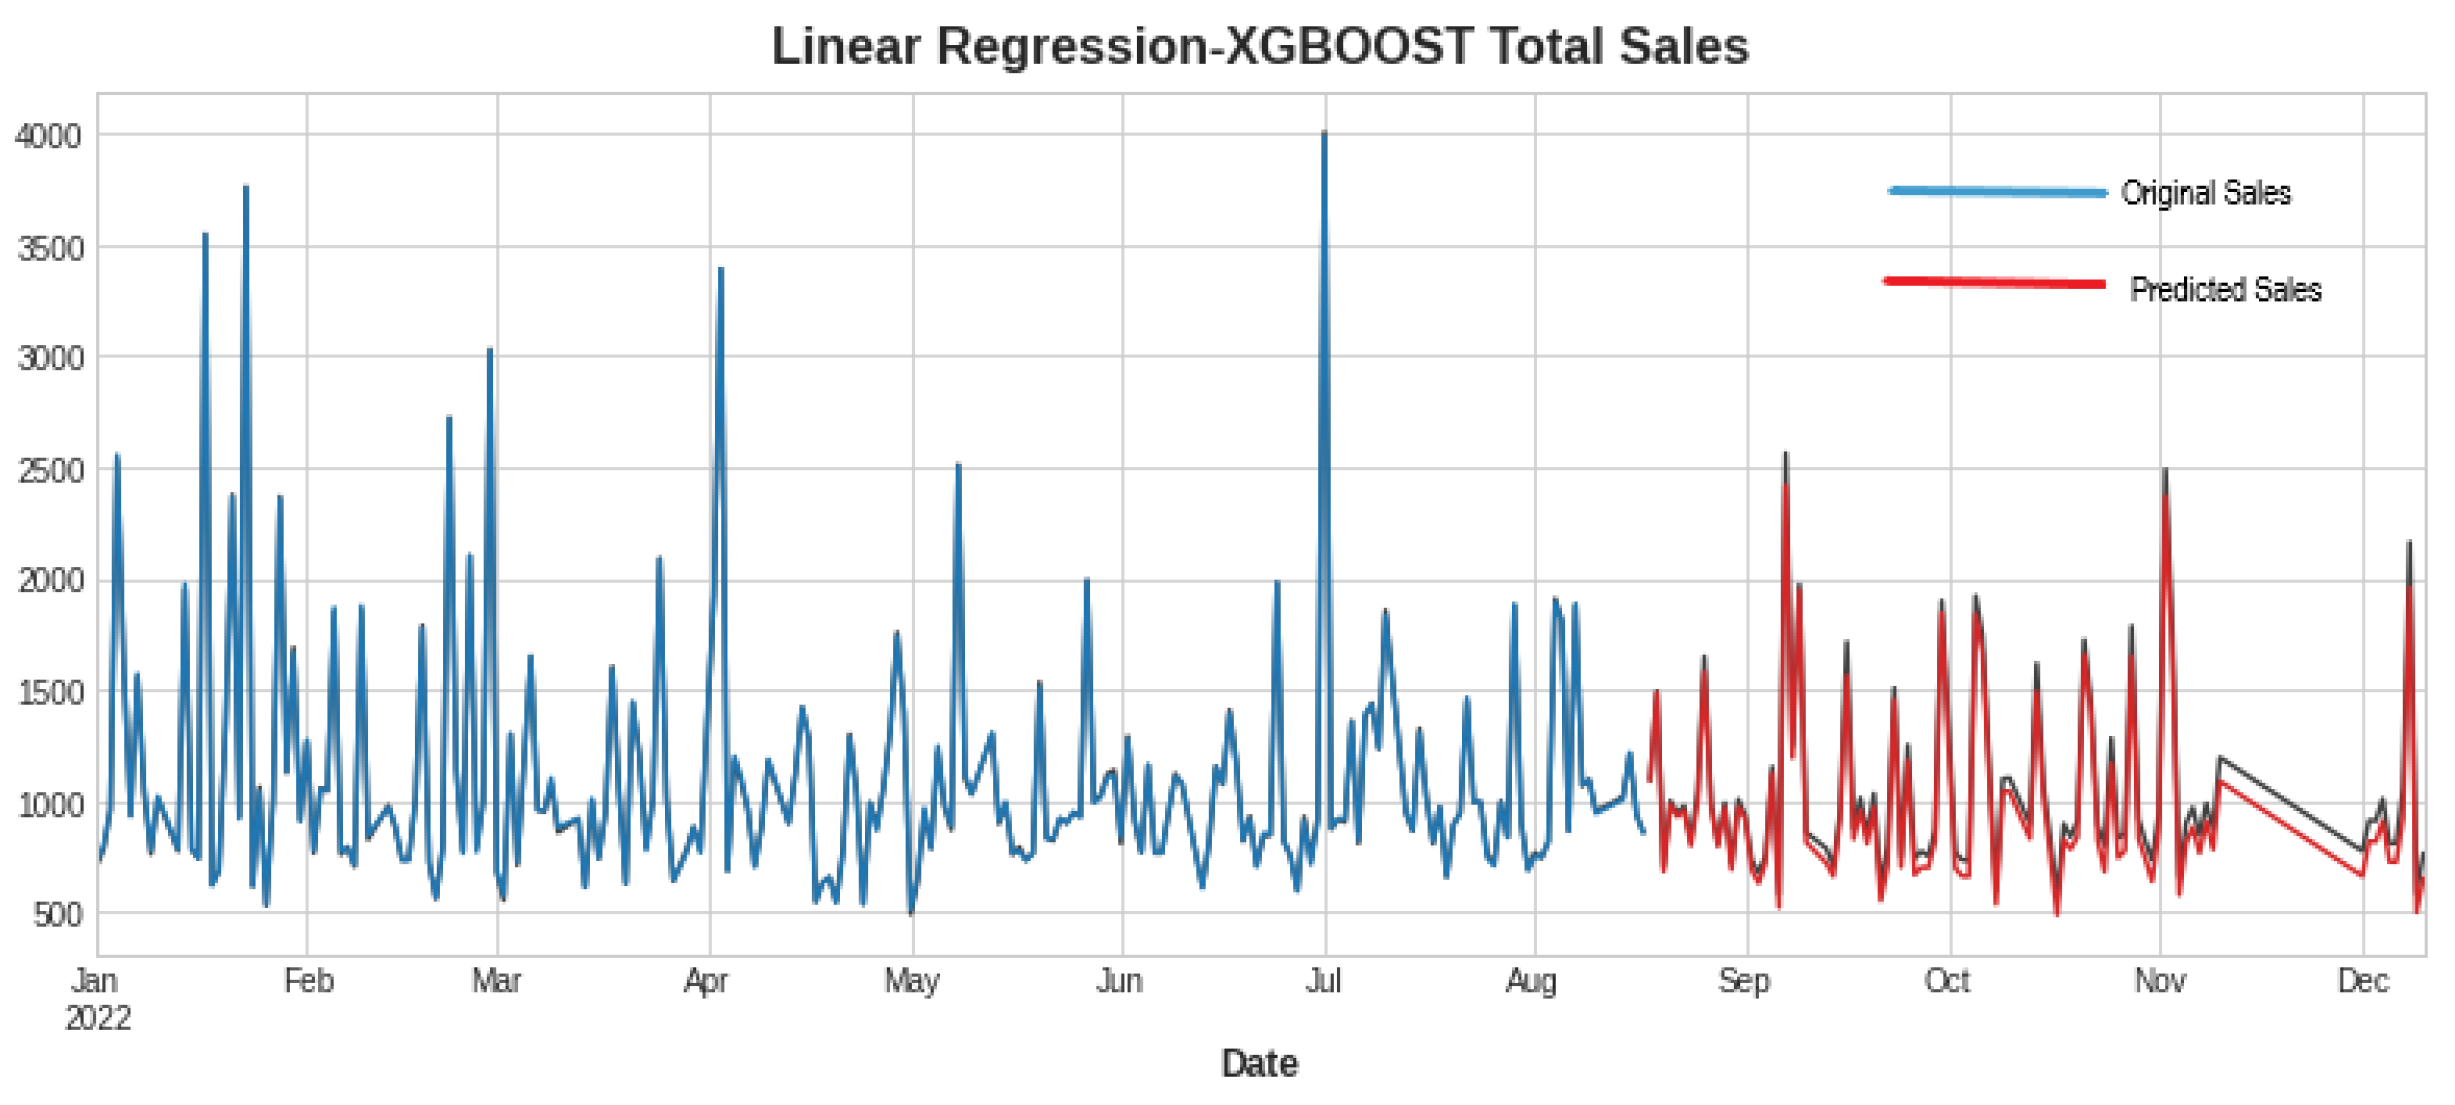
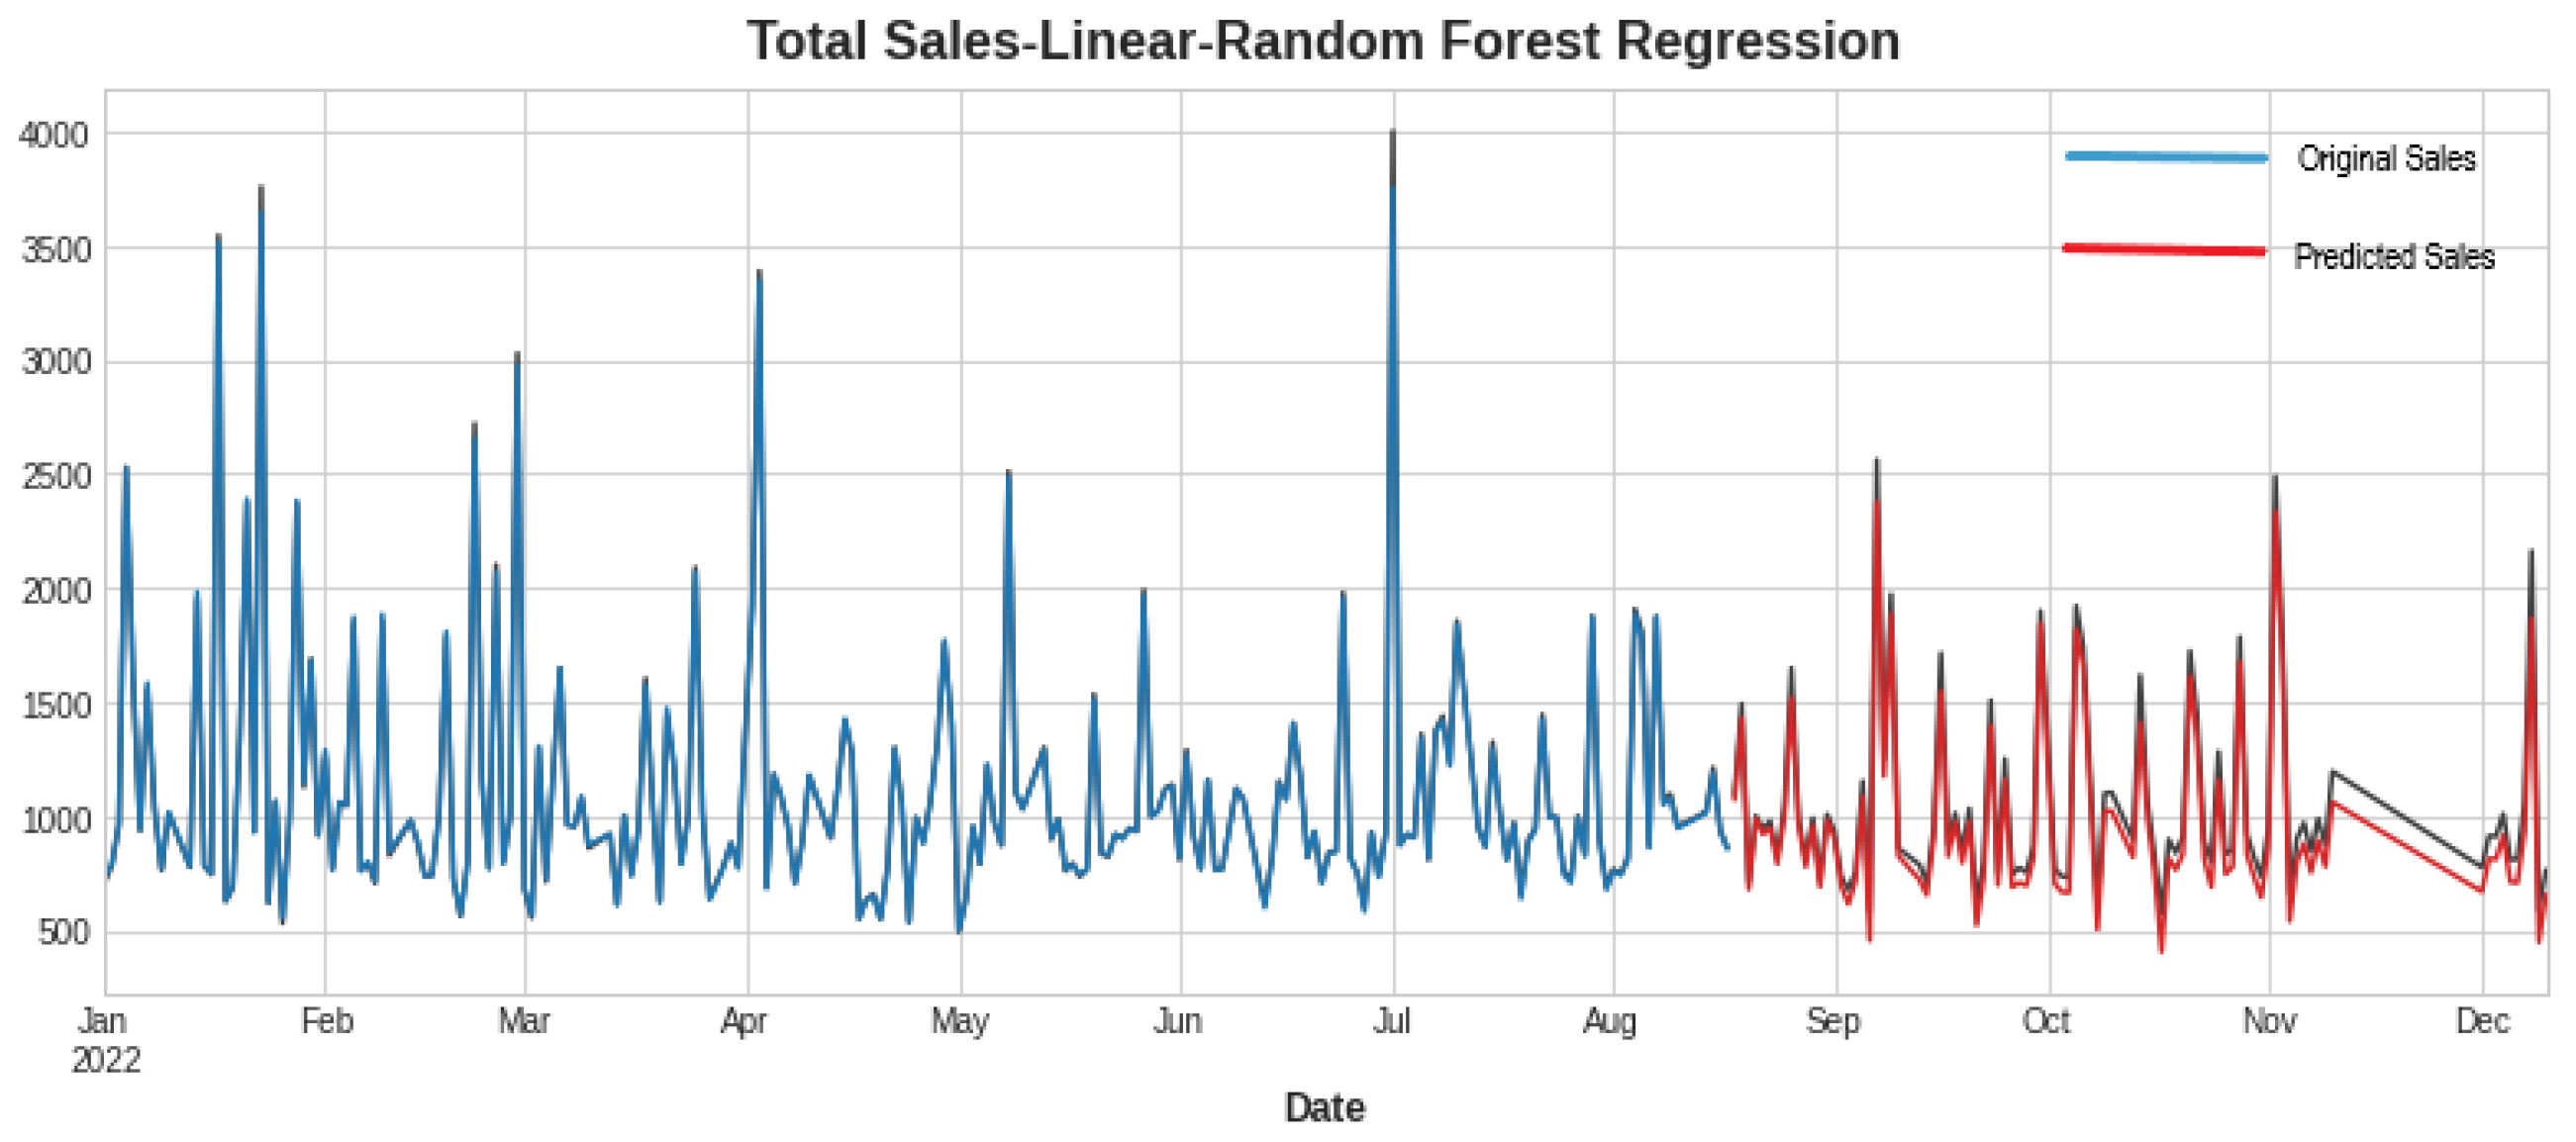
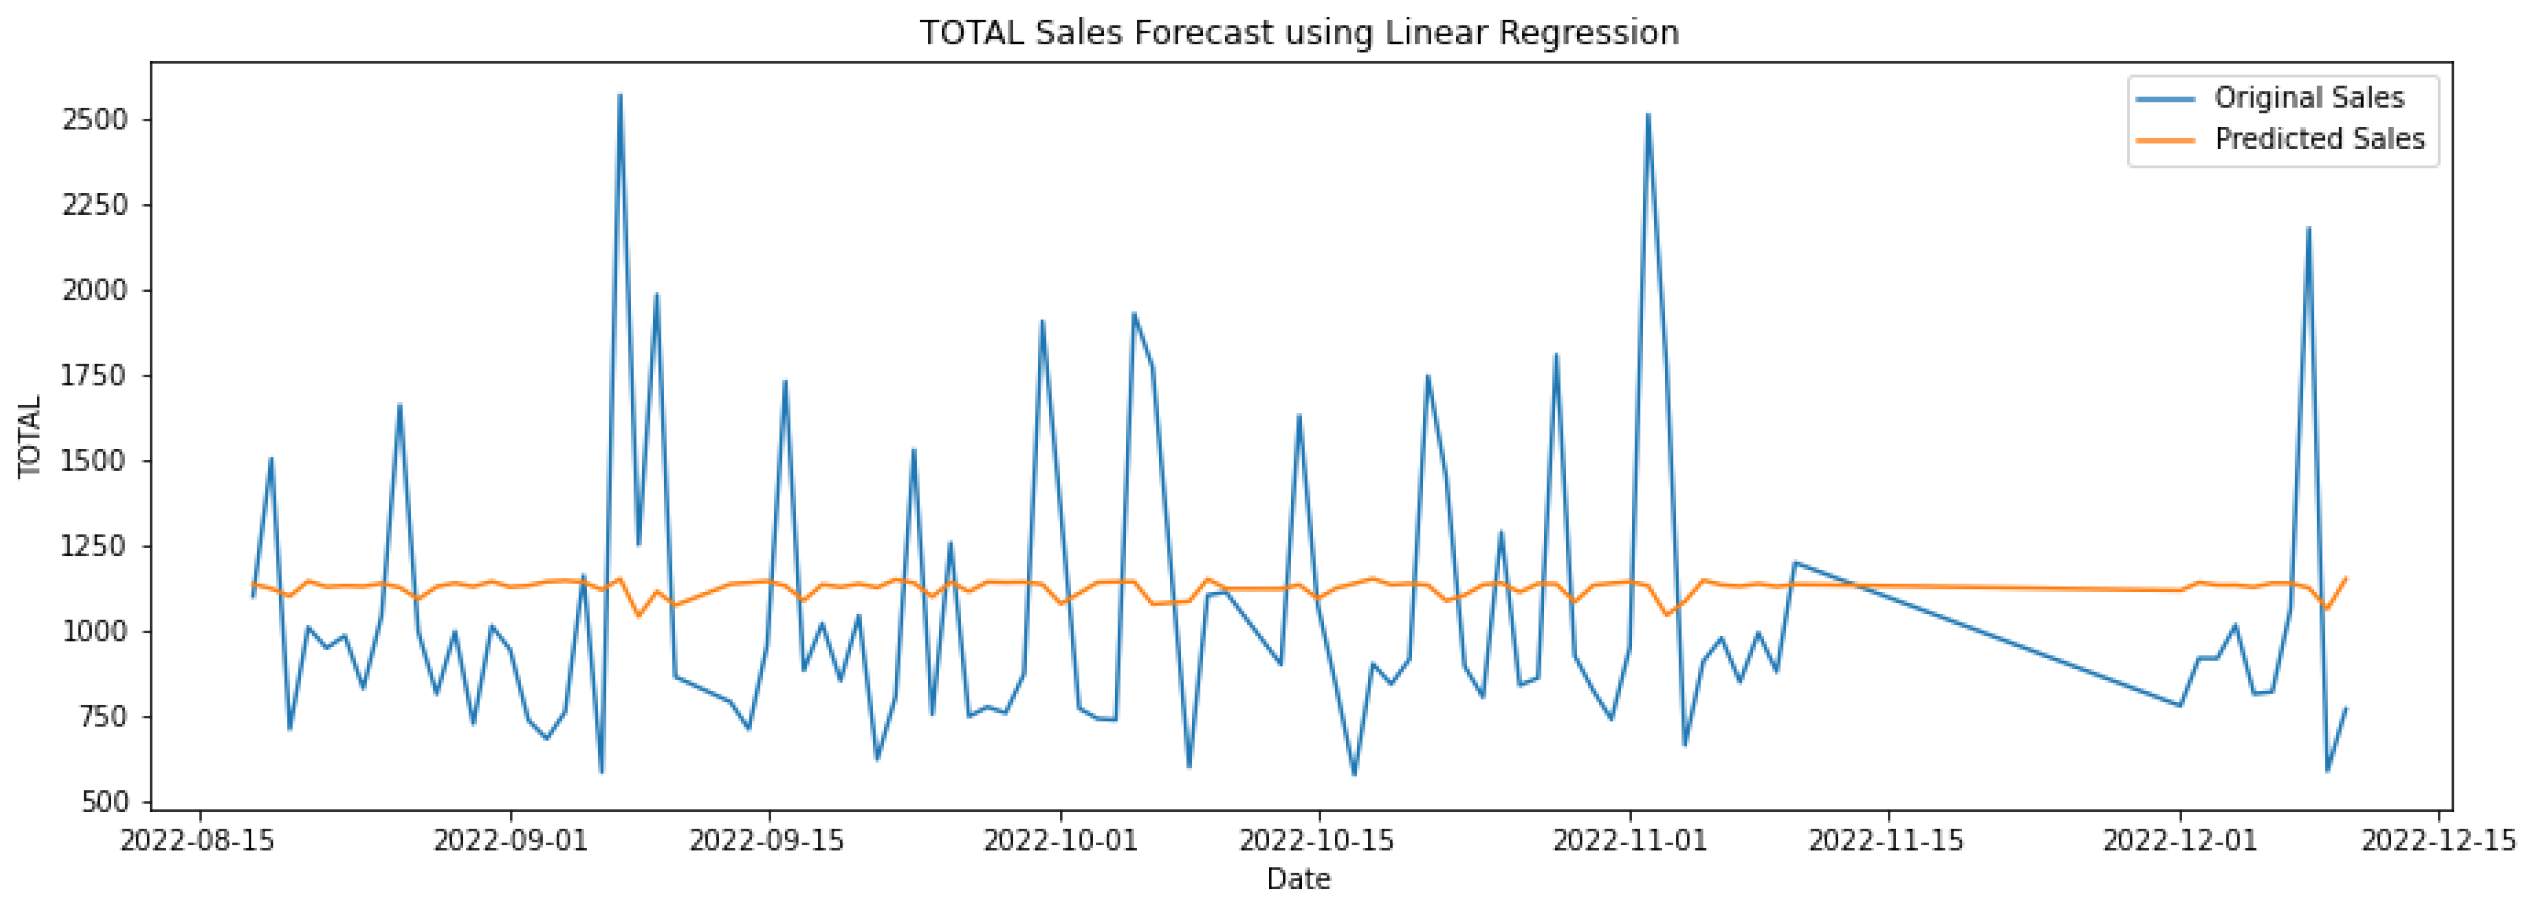
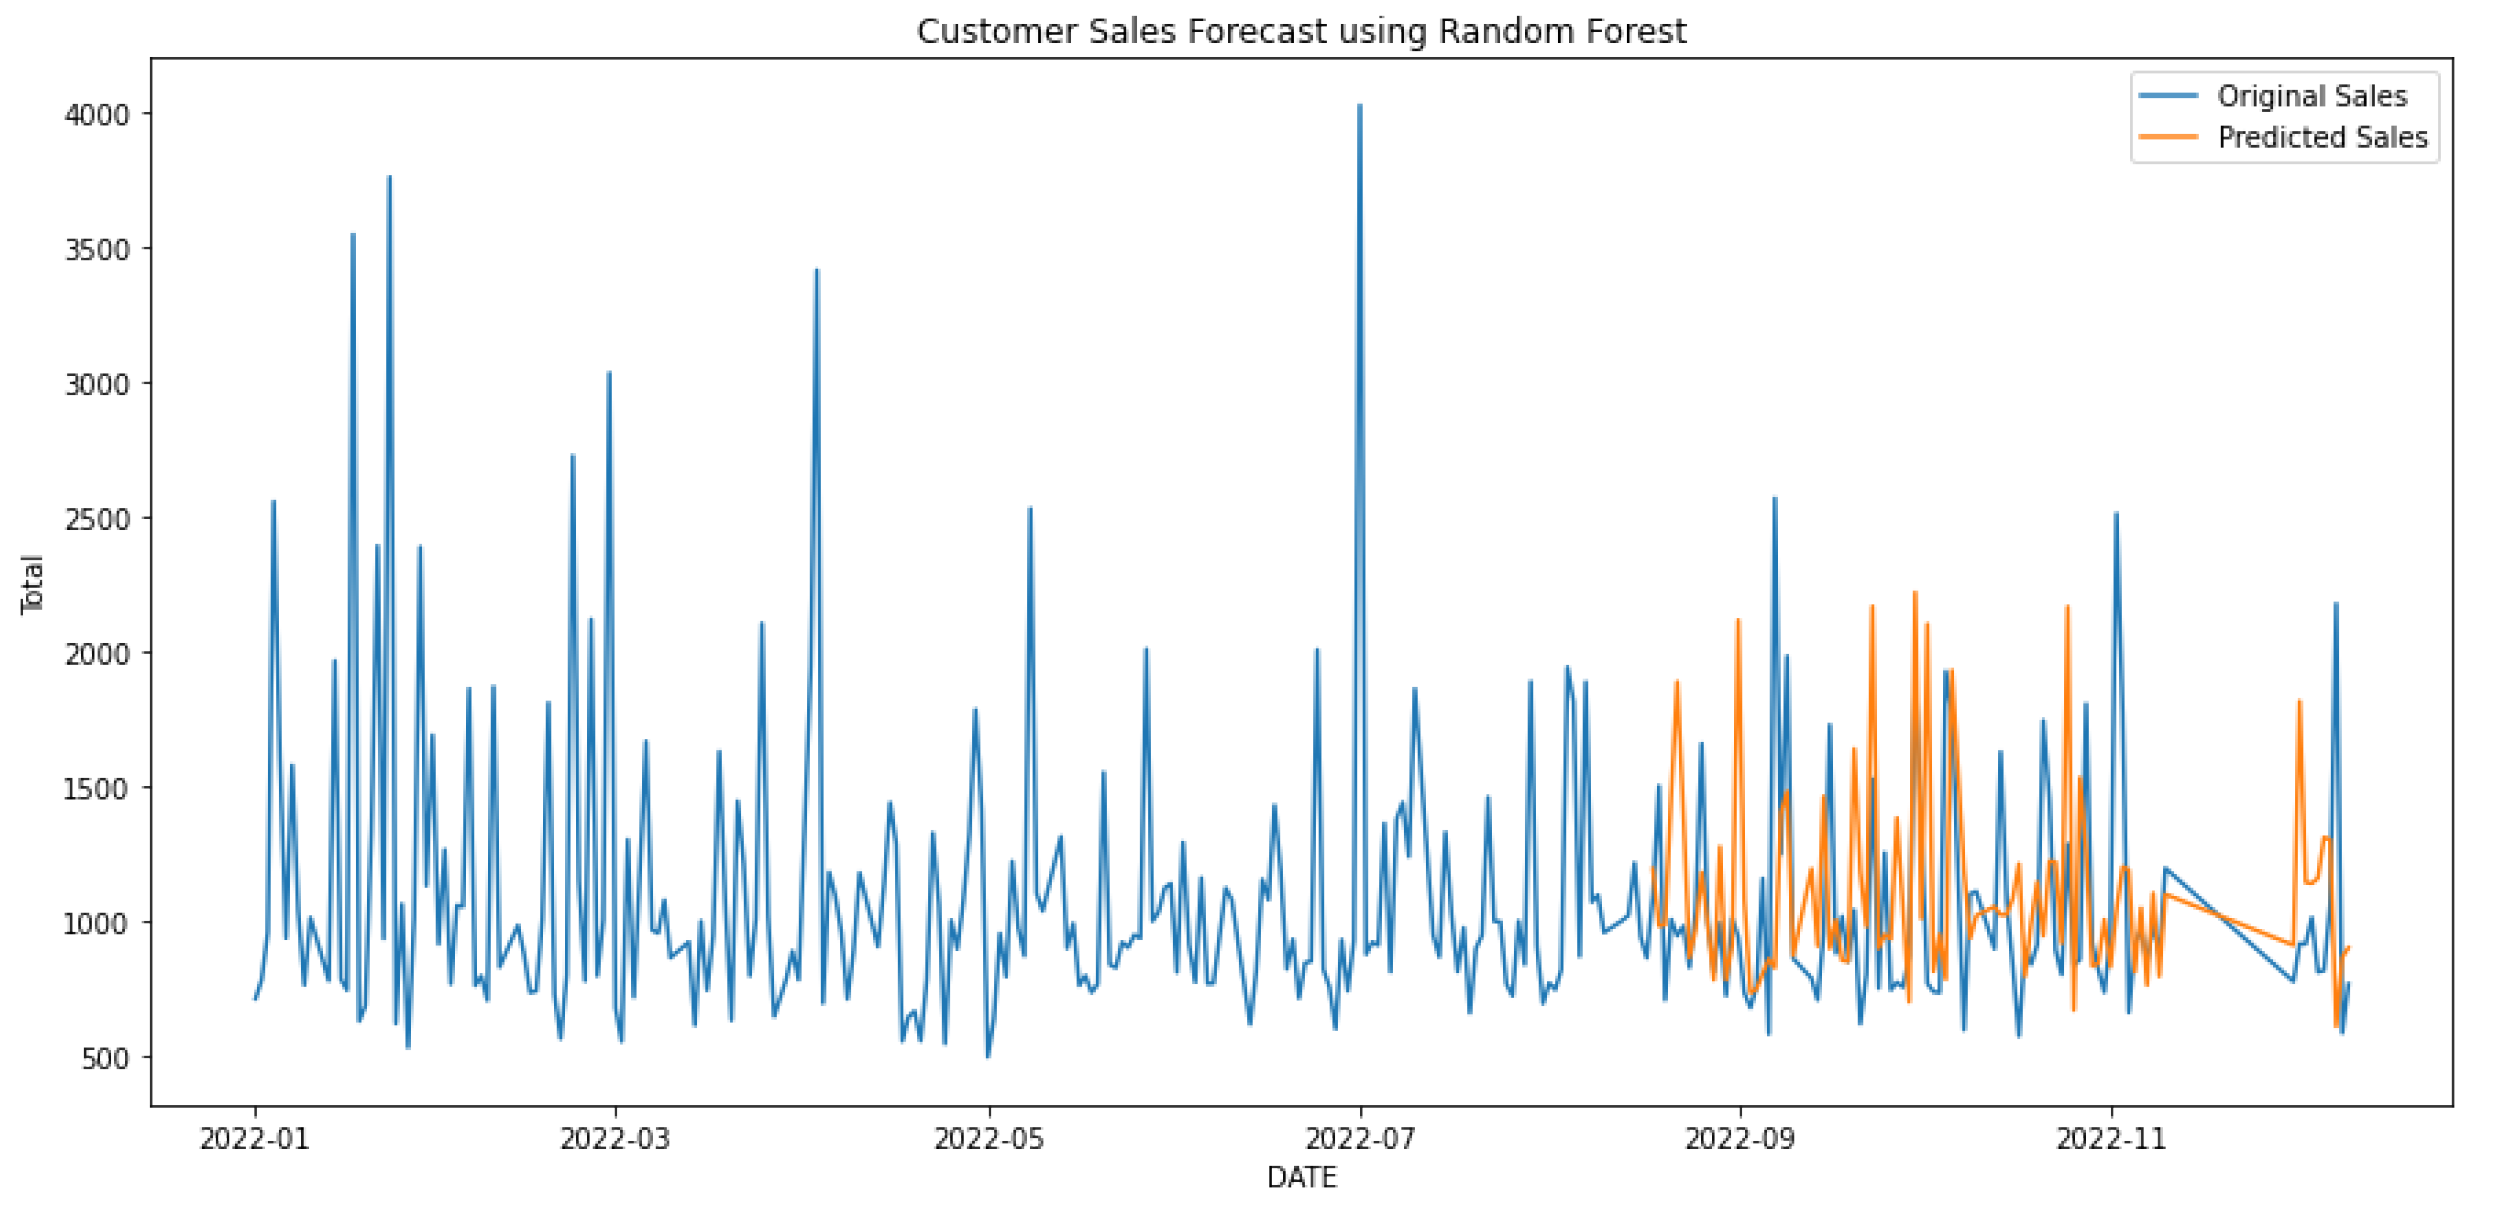
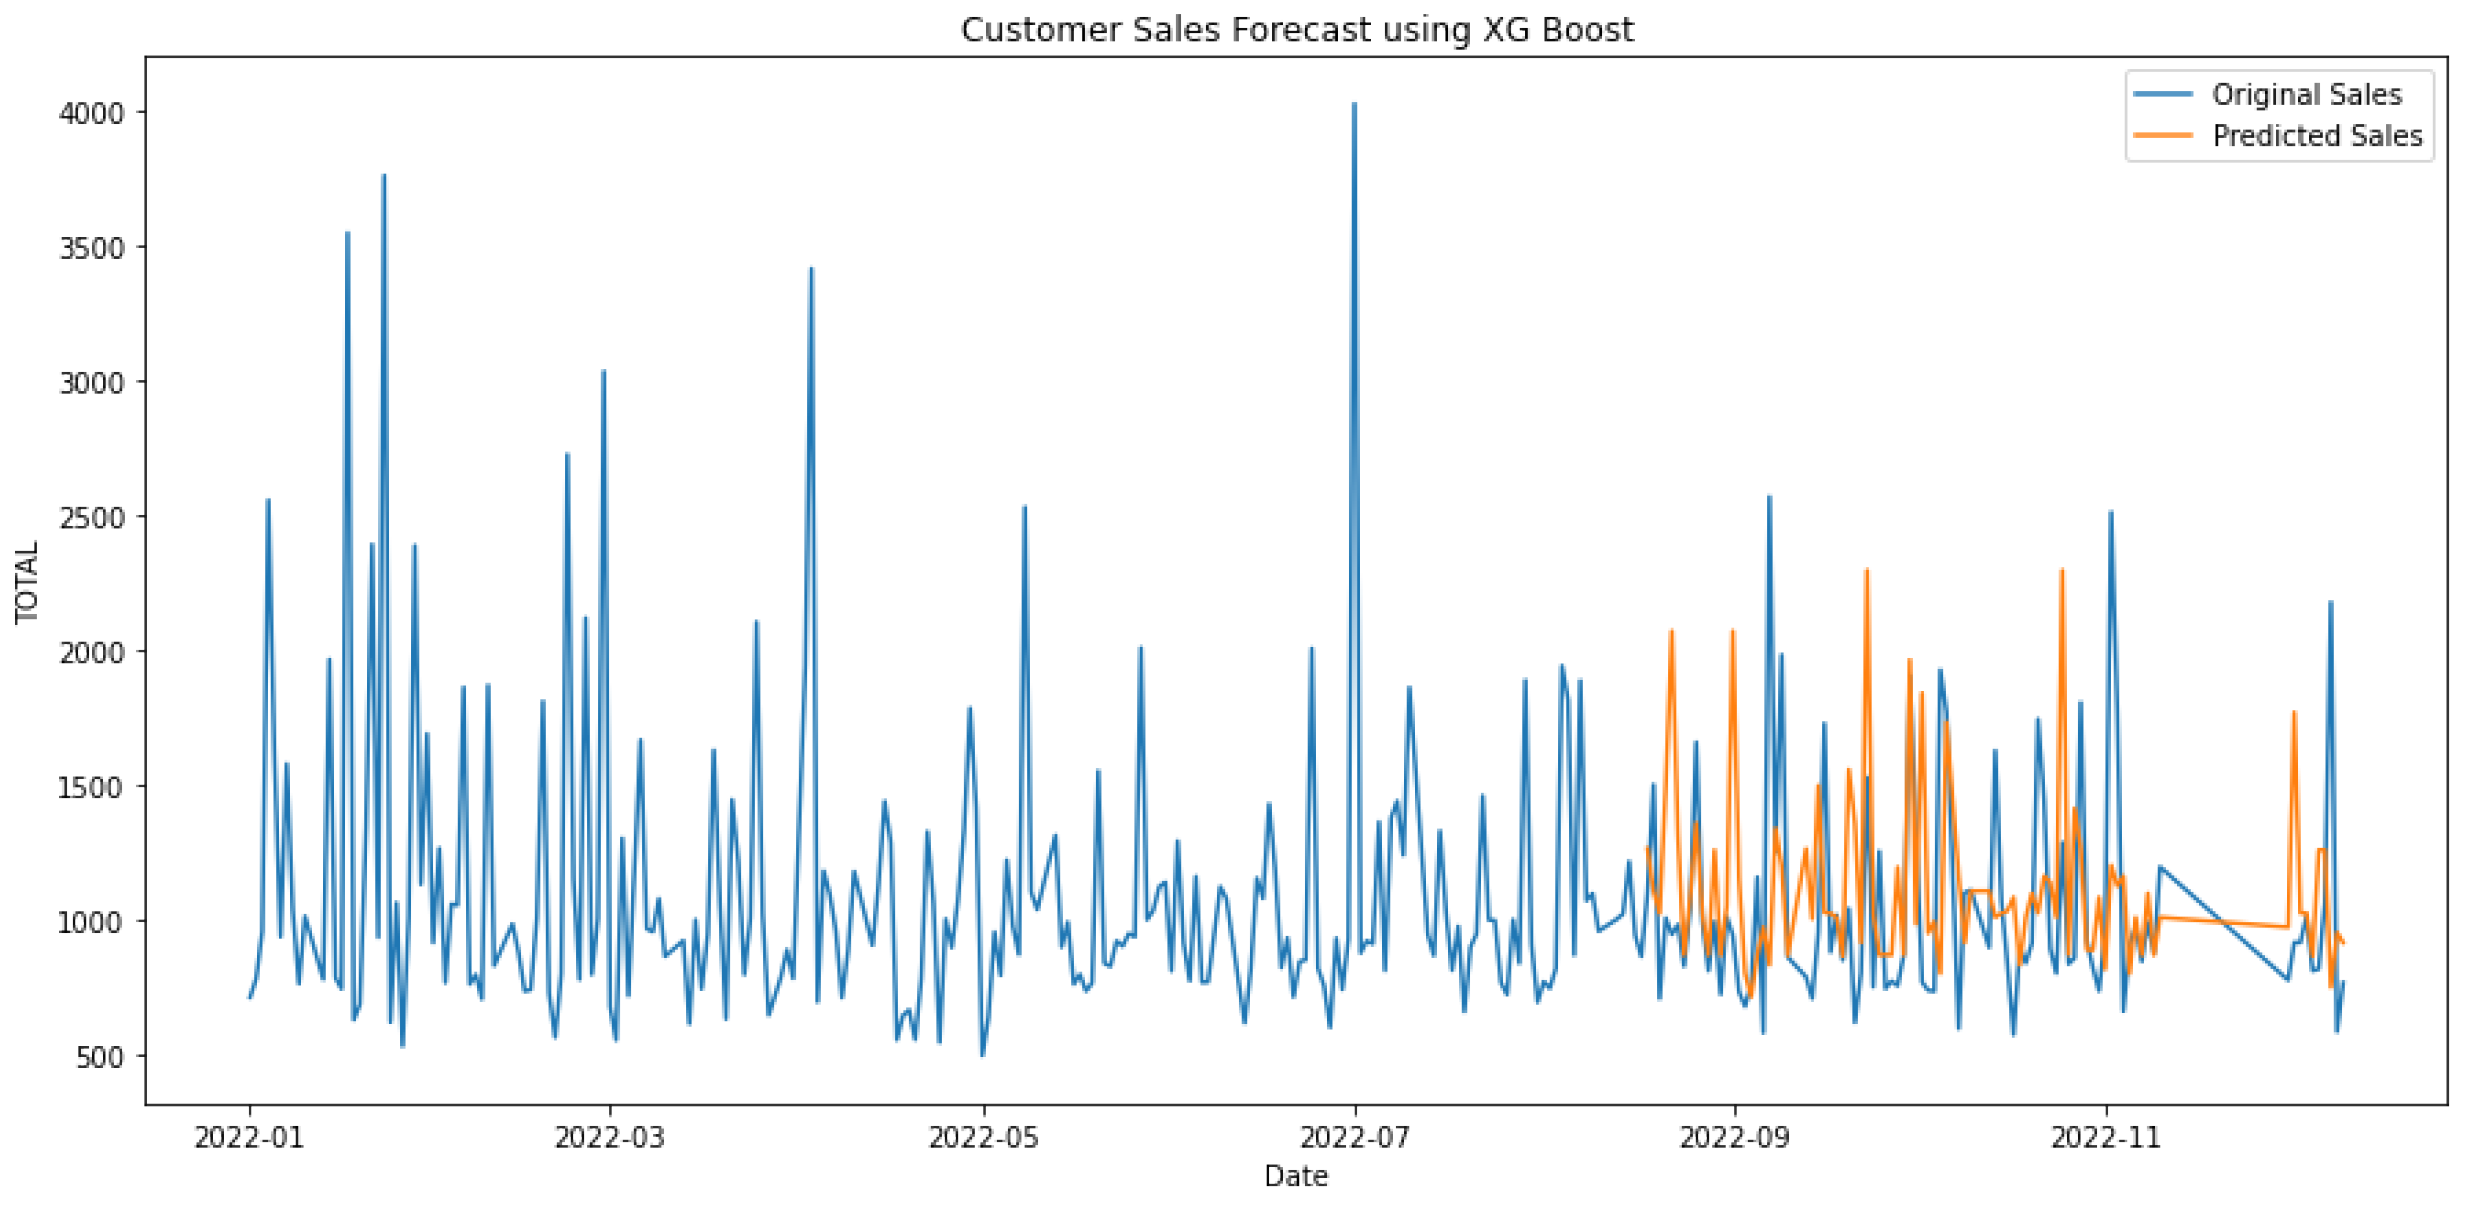
In Table 3, the first three rows show the results of algorithms individually, and the last two show the hybrid models. Hybrid linear regression–XGBoost performed better as shown in Figure 9, while the hybridization of linear–random forest regression produced a slightly lower accuracy, as shown in Figure 10. However, as seen in Figure 11, Figure 12 and Figure 13, the individual models performed very poorly. Thus, hybrid linear regression–XGBoost was selected as the basis for our model and the current predictions.
Table 3.
Performance of different machine learning models.
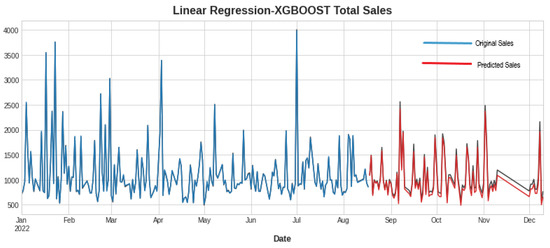
Figure 9.
Forecasting using linear regression–XGBoost.
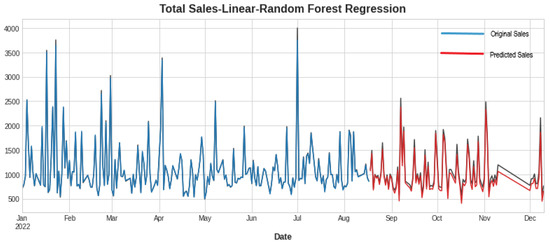
Figure 10.
Forecasting using linear regression–random forest.
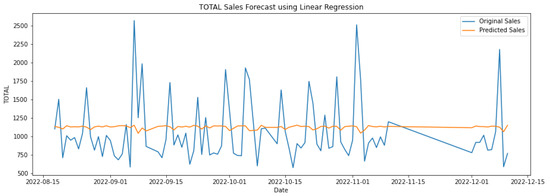
Figure 11.
Forecasting using linear regression.
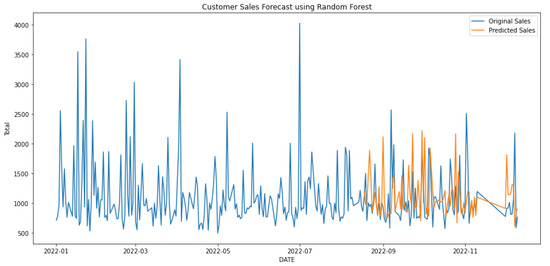
Figure 12.
Forecasting using random forest.
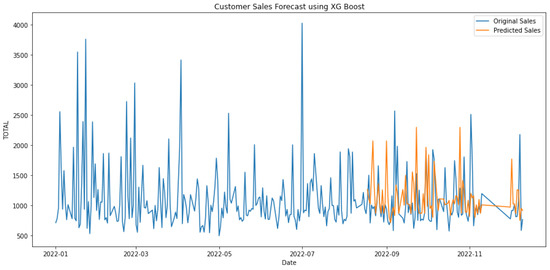
Figure 13.
Forecasting using XGBoost.
For a further comparison with R-Squared metrics, which is a statistical fit metric that quantifies the proportion of a dependent variable’s variance that can be accounted for by the independent variable(s) in a regression, the linear regression-XGBoost result was 0.963 and linear regression-random forest was 0.943.
where RSS is the sum of the square of the residuals and TSS is the total sum of the squares.
5. Conclusions
In the modern technological era, hyperautomation is having a revolutionary impact in the relevant fields. In our research, we show its positive impact in the supermarket using several methods, as discussed above. First of all, the system features a sophisticated AI-powered voice chatbot that effectively comprehends customer inquiries through advanced speech recognition and natural language processing (NLP) techniques. This was designed to provide accurate responses to customer queries using machine learning (ML), and it operates seamlessly even without an internet connection. In addition, the FP growth algorithm performed best among all the algorithms used in the product placement methodology. Using this algorithm, shopkeepers will be able to place products according to the customer’s choice and it will help them to grow their business. Moreover, they will not have to worry about how to place their products. Lastly, the hybrid linear regression–XGBoost outperformed every single algorithm in product sales forecasting. Thus, it was chosen to be the basis for our custom model. This ensures business owners can obtain a complete picture of future product sales. In the future, our research will focus on working on hyperautomation features more.
Author Contributions
Conceptualization, S.A. and J.K.; methodology, S.A., J.K. and M.M.R.; software, S.A., J.K., M.M.R. and R.M.; validation, S.A., J.K. and M.M.R.; formal analysis, S.A.; investigation, M.M.R. and R.M.; resources, S.A.; data curation, S.A. and J.K.; writing—original draft preparation, S.A. and J.K.; writing—review and editing, S.A., J.K., M.M.R. and R.M.; visualization, S.A.; supervision, M.G.R.A. and M.T.R.; project administration, M.T.R.; funding acquisition, S.A., J.K., M.M.R. and R.M. All authors have read and agreed to the published version of the manuscript.
Funding
This research received no external funding.
Institutional Review Board Statement
Not applicable.
Informed Consent Statement
Not applicable.
Data Availability Statement
Not applicable.
Acknowledgments
The authors are grateful to the faculties of BRAC University for administrative and technical support.
Conflicts of Interest
The authors declare no conflict of interest.
References
- Kowsher, M.; Tithi, F.S.; Ashraful Alam, M.; Huda, M.N.; Md Moheuddin, M.; Rosul, M.G. Doly: Bengali Chatbot for Bengali Education. In Proceedings of the 1st International Conference on Advances in Science, Engineering and Robotics Technology (ICASERT), Dhaka, Bangladesh, 3–5 May 2019; pp. 1–6. [Google Scholar] [CrossRef]
- Tiwari, A.; Talekar, R.; Patil, S.M. College information chat bot system. Int. J. Eng. Res. Gen. Sci. 2017, 5, 131–137. [Google Scholar]
- Chen, M.; Burke, R.R.; Hui, S.K.; Leykin, A. Understanding Lateral and Vertical Biases in Consumer Attention: An In-Store Ambulatory Eye-Tracking Study. J. Mark. Res. 2021, 58, 002224372199837. [Google Scholar] [CrossRef]
- Ito, Y.; Kato, S. Dynamic Product Placement Method in Order Picking Using Correlation between Products. In Proceedings of the 2016 IEEE 5th Global Conference on Consumer Electronics, Kyoto, Japan, 11–14 October 2016; pp. 1–3. [Google Scholar] [CrossRef]
- Xiang, C.; Xiong, S. The GSP algorithm in dynamic cost prediction of enterprise. In Proceedings of the 2011 Seventh International Conference on Natural Computation, Shanghai, China, 26–28 July 2011; Volume 4, pp. 2309–2312. [Google Scholar]
- Gopalakrishnan, T.; Choudhary, R.; Prasad, S. Prediction of Sales Value in Online Shopping Using Linear Regression. In Proceedings of the 4th International Conference on Computing Communication and Automation (ICCCA), Greater Noida, India, 14–15 December 2018; pp. 1–6. [Google Scholar] [CrossRef]
- Ramachandra, H.V.; Balaraju, G.; Rajashekar, A.; Patil, H. Machine Learning Application for Black Friday Sales Prediction Framework. In Proceedings of the International Conference on Emerging Smart Computing and Informatics (ESCI), Pune, India, 5–7 March 2021; pp. 57–61. [Google Scholar]
- Liu, Y.; Luo, H.; Zhao, B.; Zhao, X.; Han, Z. Short-Term Power Load Forecasting Based on Clustering and XGBoost Method. In Proceedings of the IEEE 9th International Conference on Software Engineering and Service Science (ICSESS), Beijing, China, 23–25 November 2018; pp. 536–539. [Google Scholar]

Disclaimer/Publisher’s Note: The statements, opinions and data contained in all publications are solely those of the individual author(s) and contributor(s) and not of MDPI and/or the editor(s). MDPI and/or the editor(s) disclaim responsibility for any injury to people or property resulting from any ideas, methods, instructions or products referred to in the content. |
© 2023 by the authors. Licensee MDPI, Basel, Switzerland. This article is an open access article distributed under the terms and conditions of the Creative Commons Attribution (CC BY) license (https://creativecommons.org/licenses/by/4.0/).