
Analysis of GNSS Time Series Recorded on South Shetland Island and Antarctic Peninsula during the Geodynamic Activity in 2020 of the Orca Underwater Volcano (Brandfield Sea Rift, Antarctica) †

 , , ,
, , ,  , , , , and
Abstract
1. Introduction
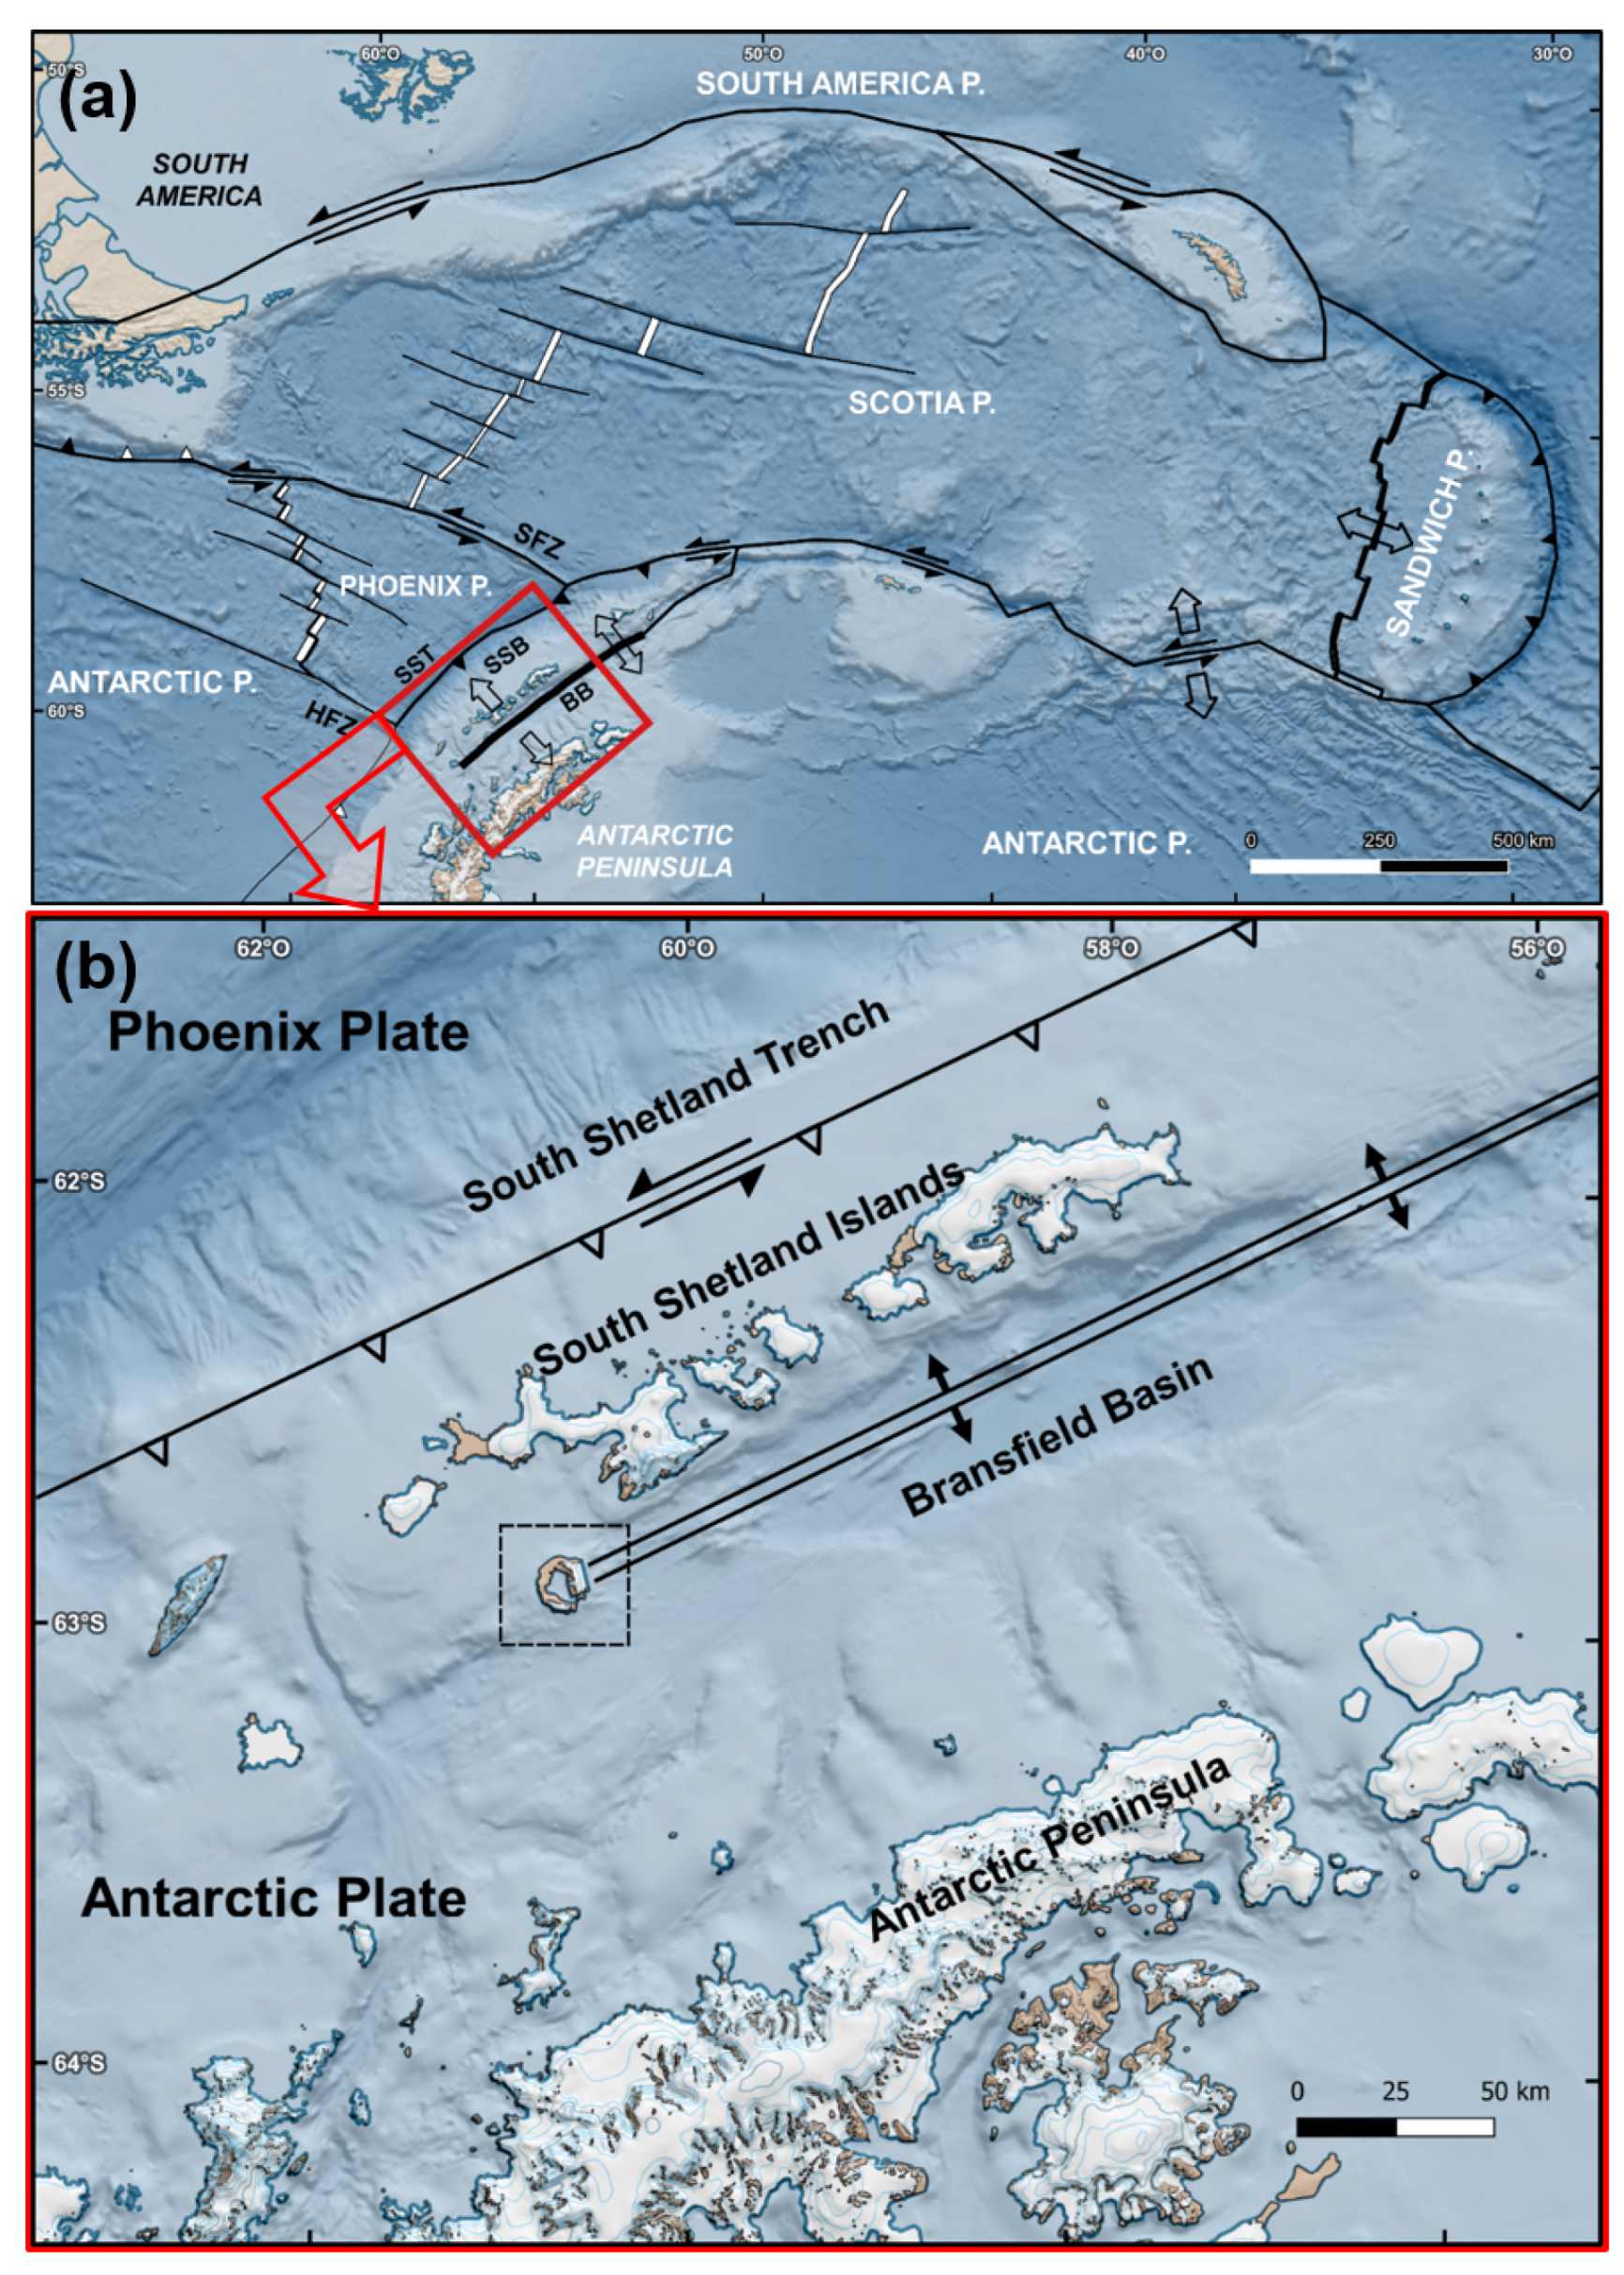
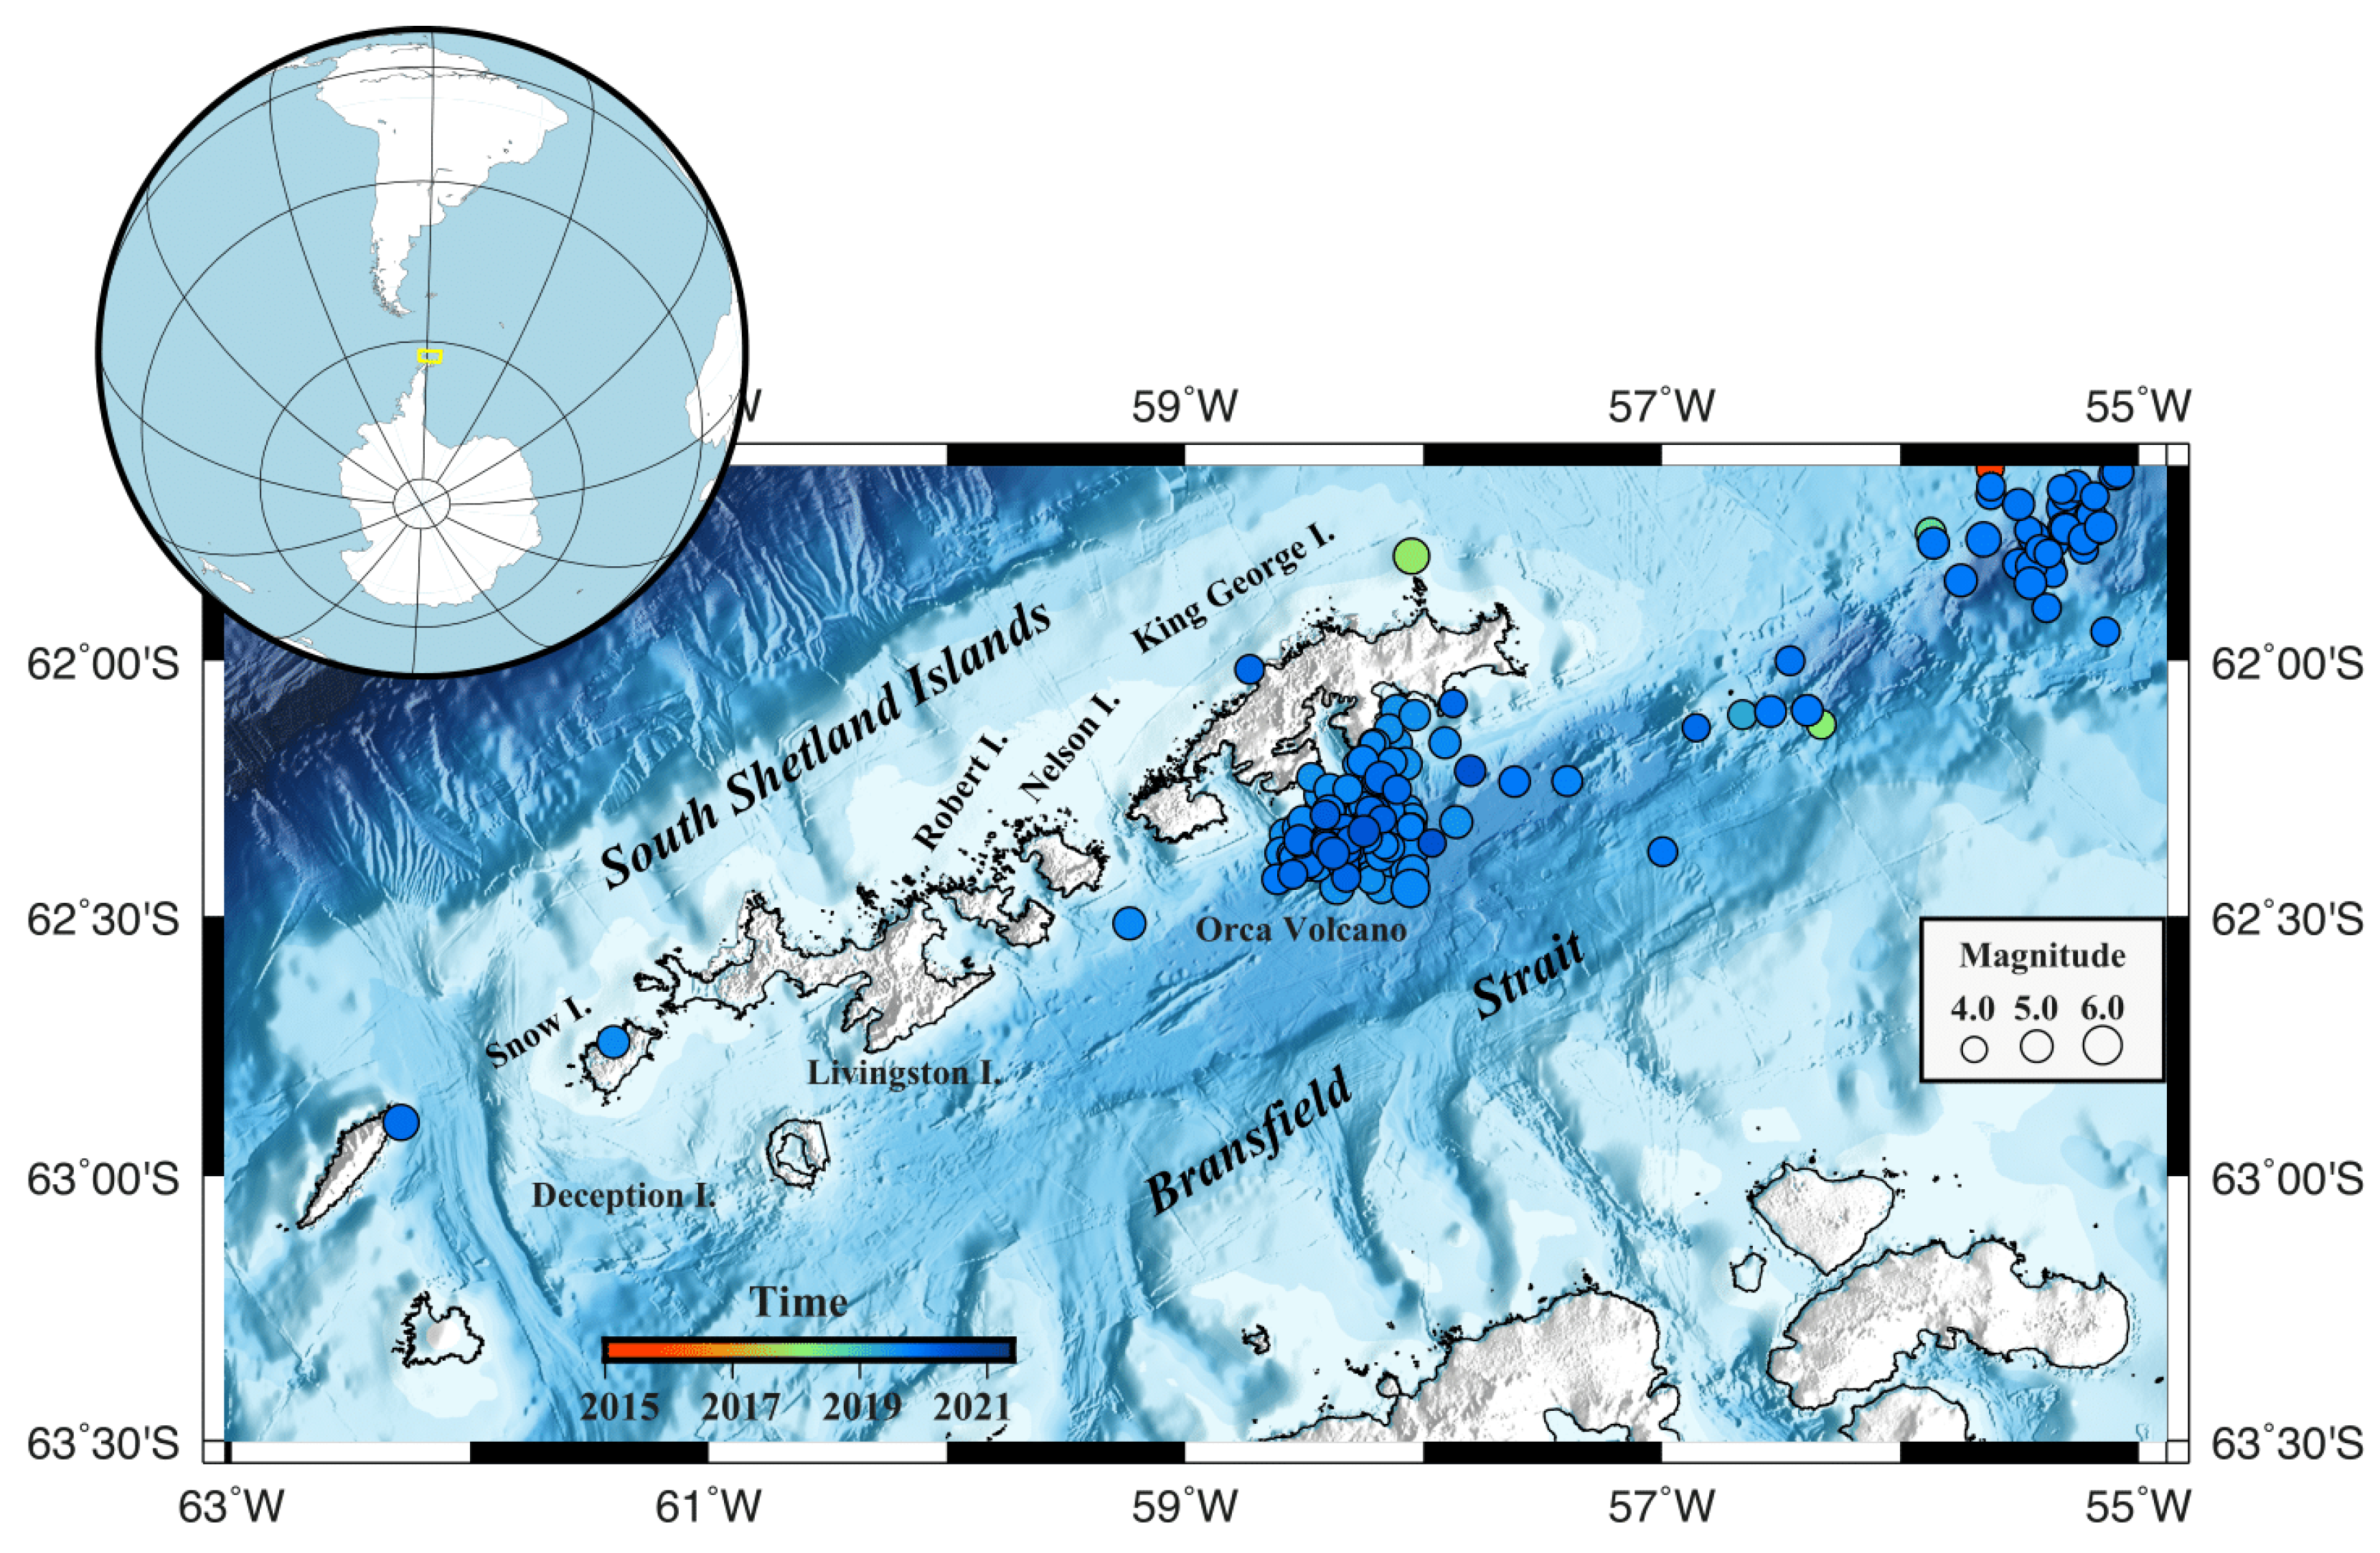
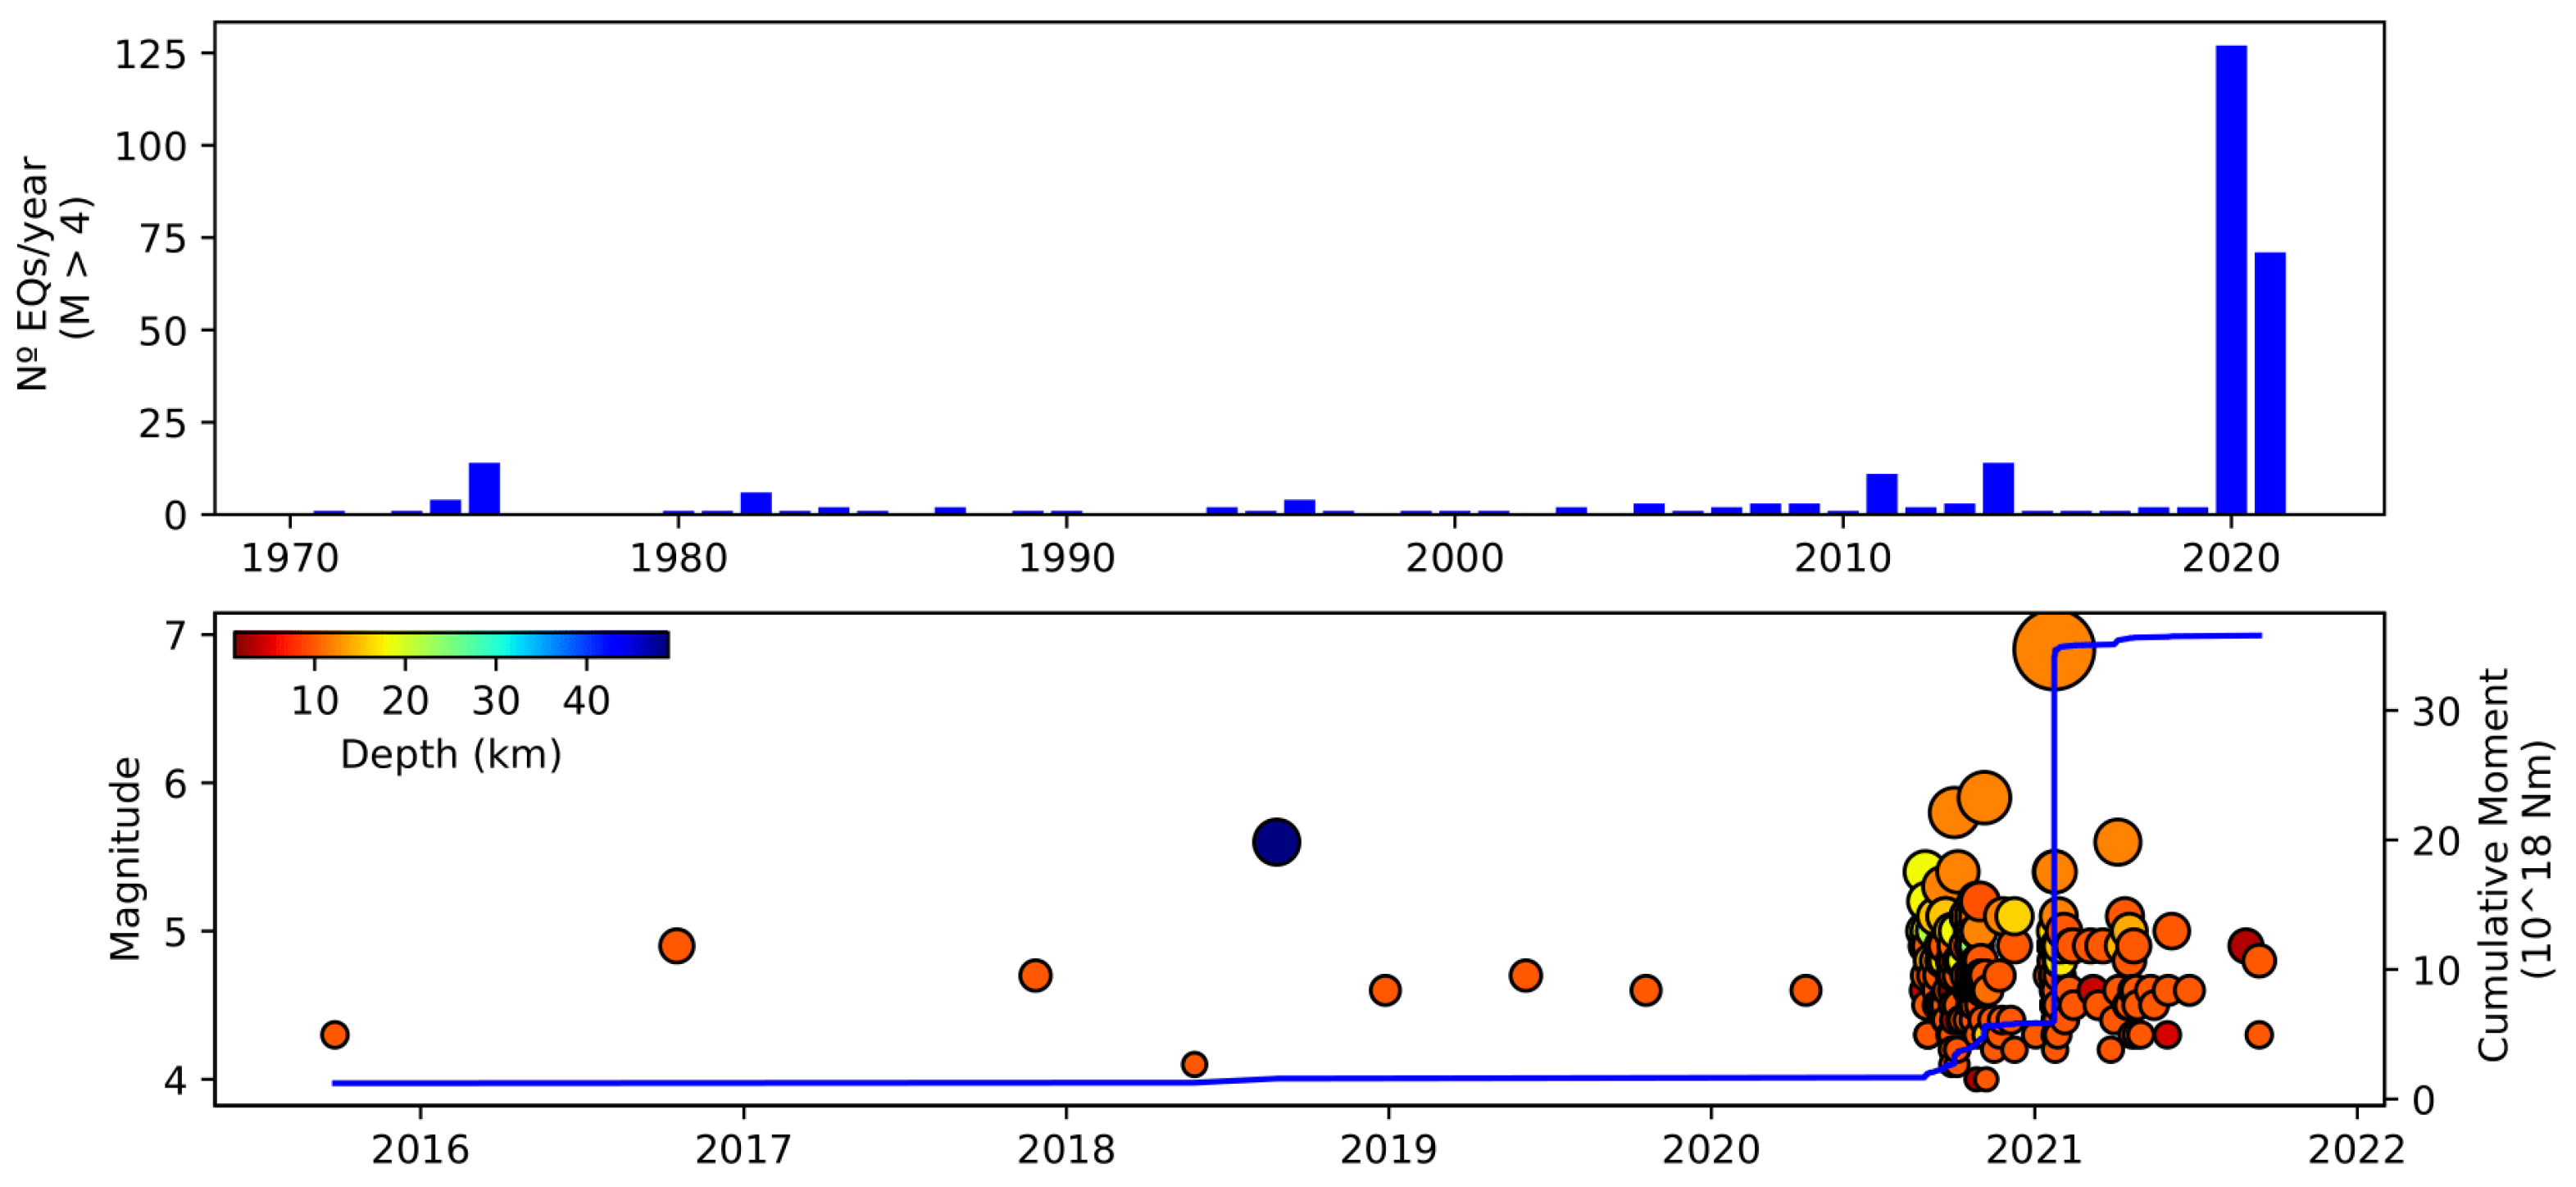
2. Geodynamic Frame
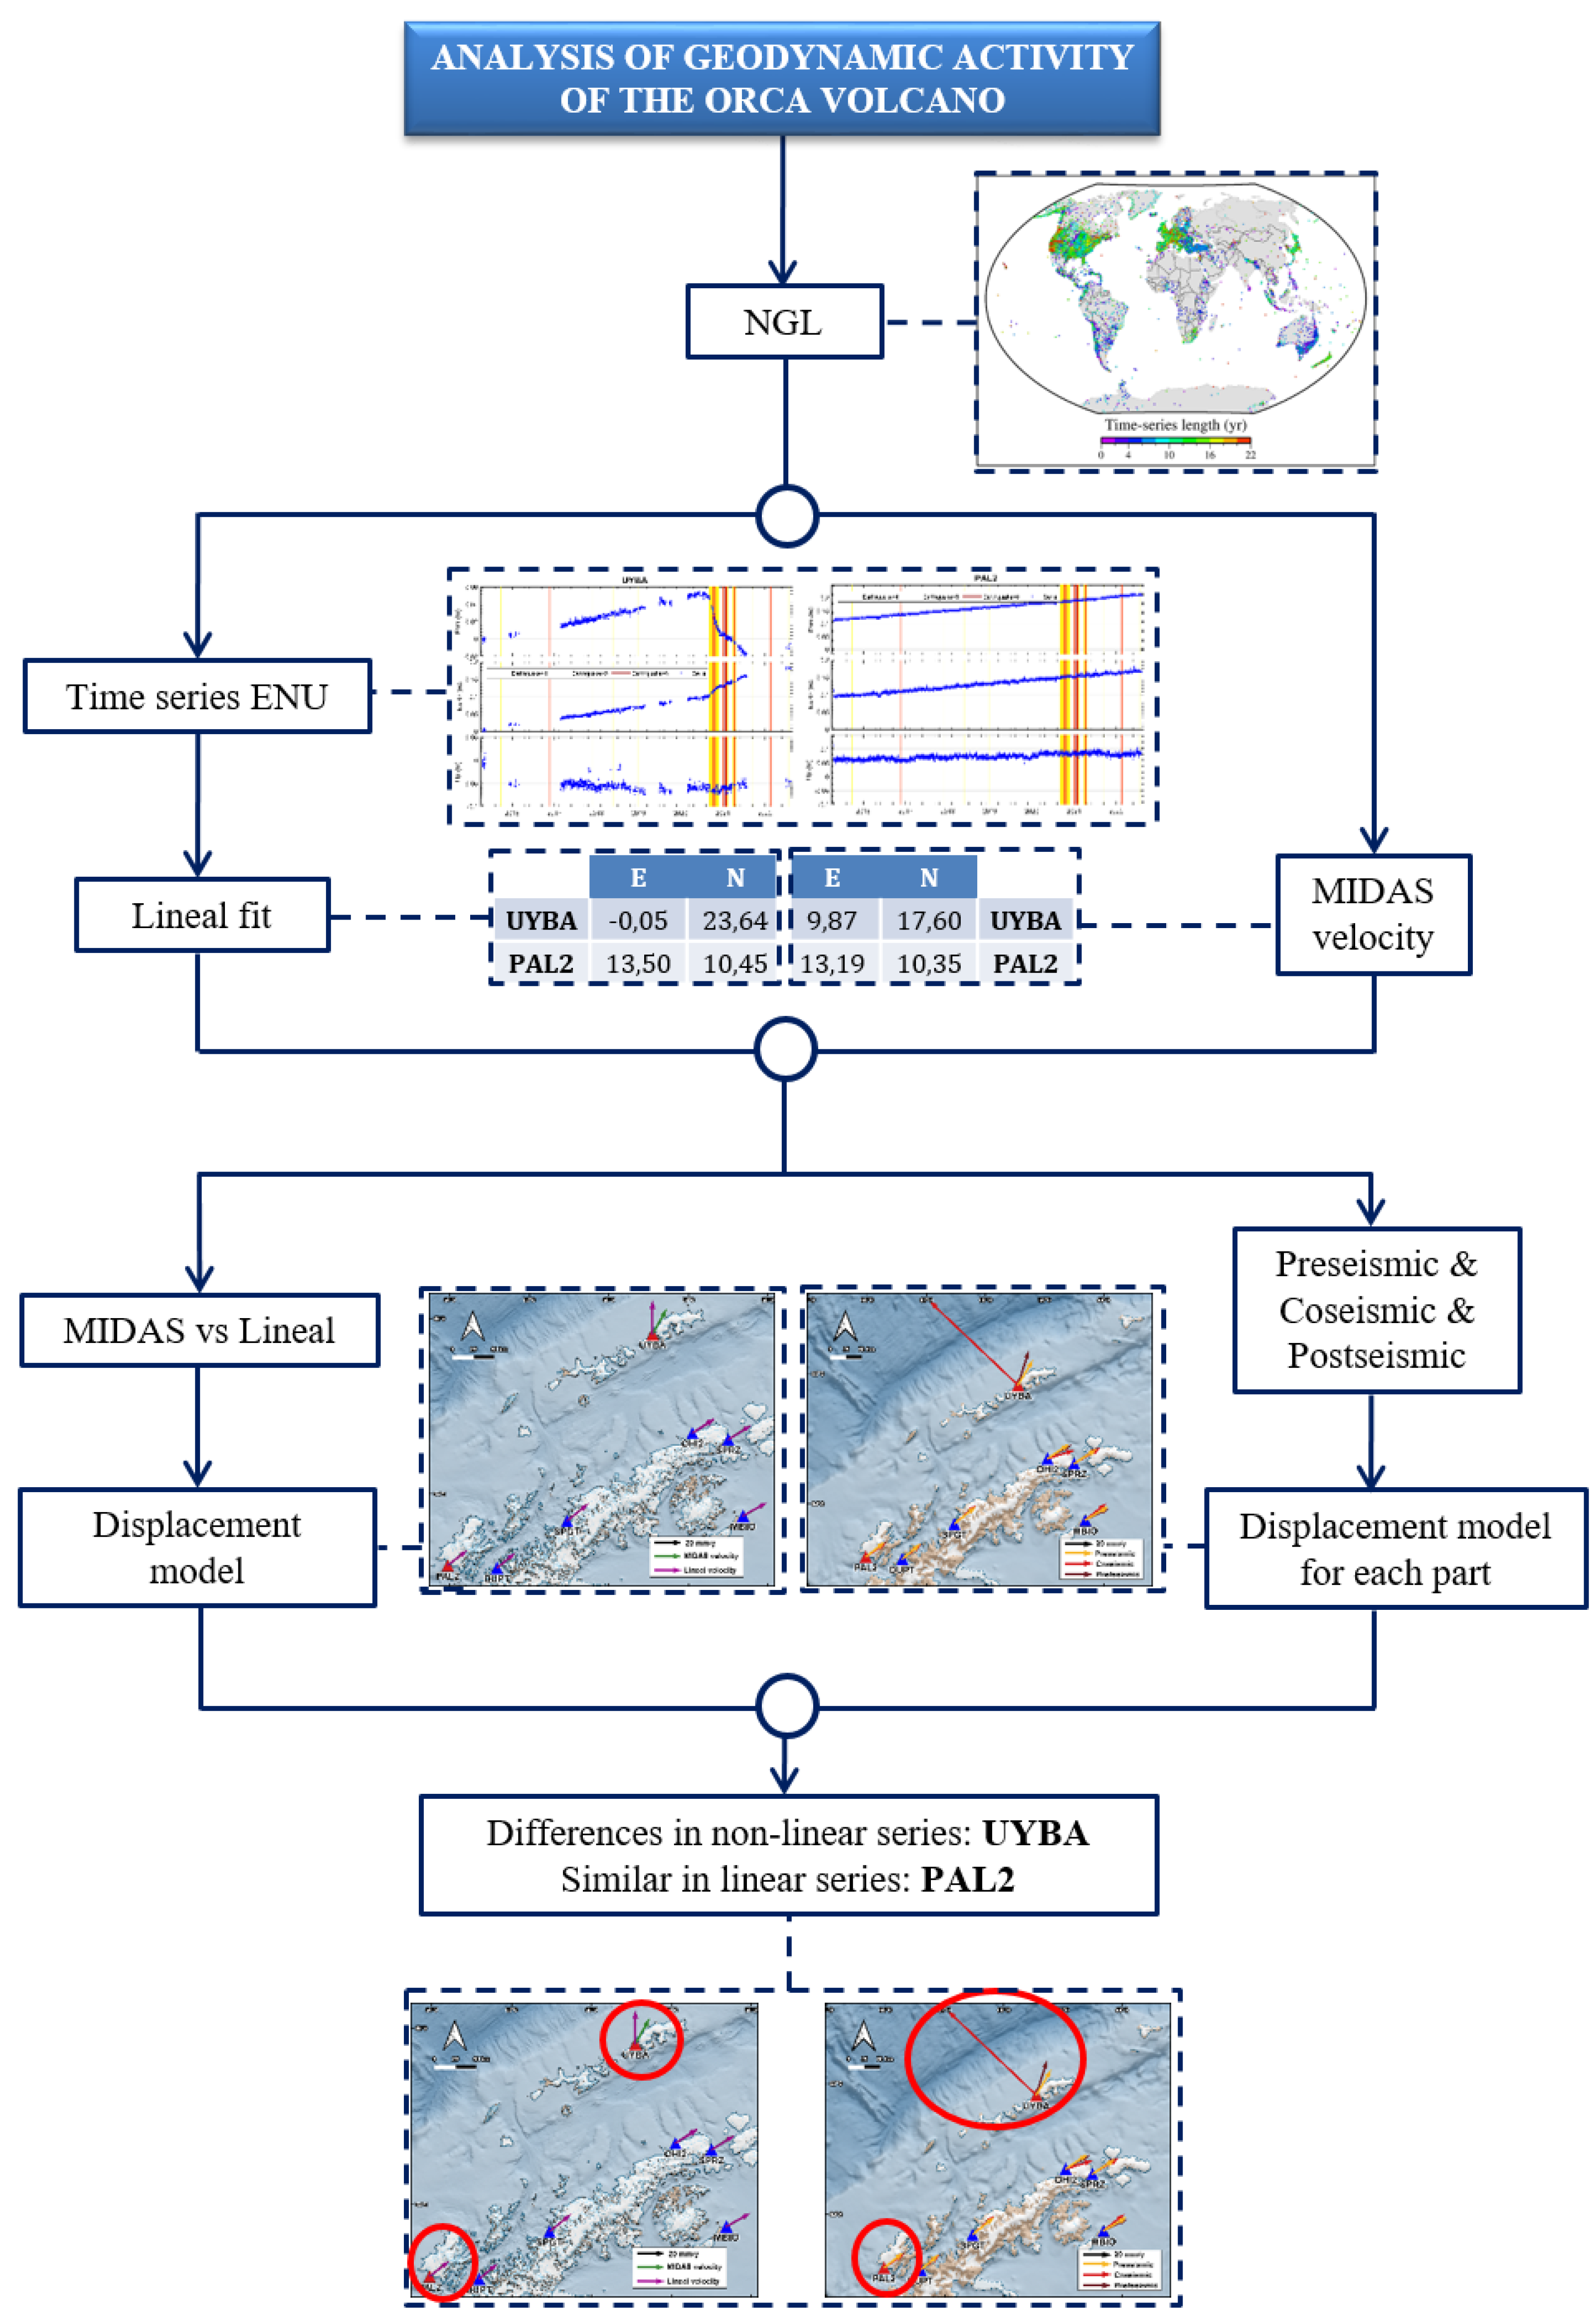
3. Data and Methods
3.1. Geodetic Stations and Data Processing
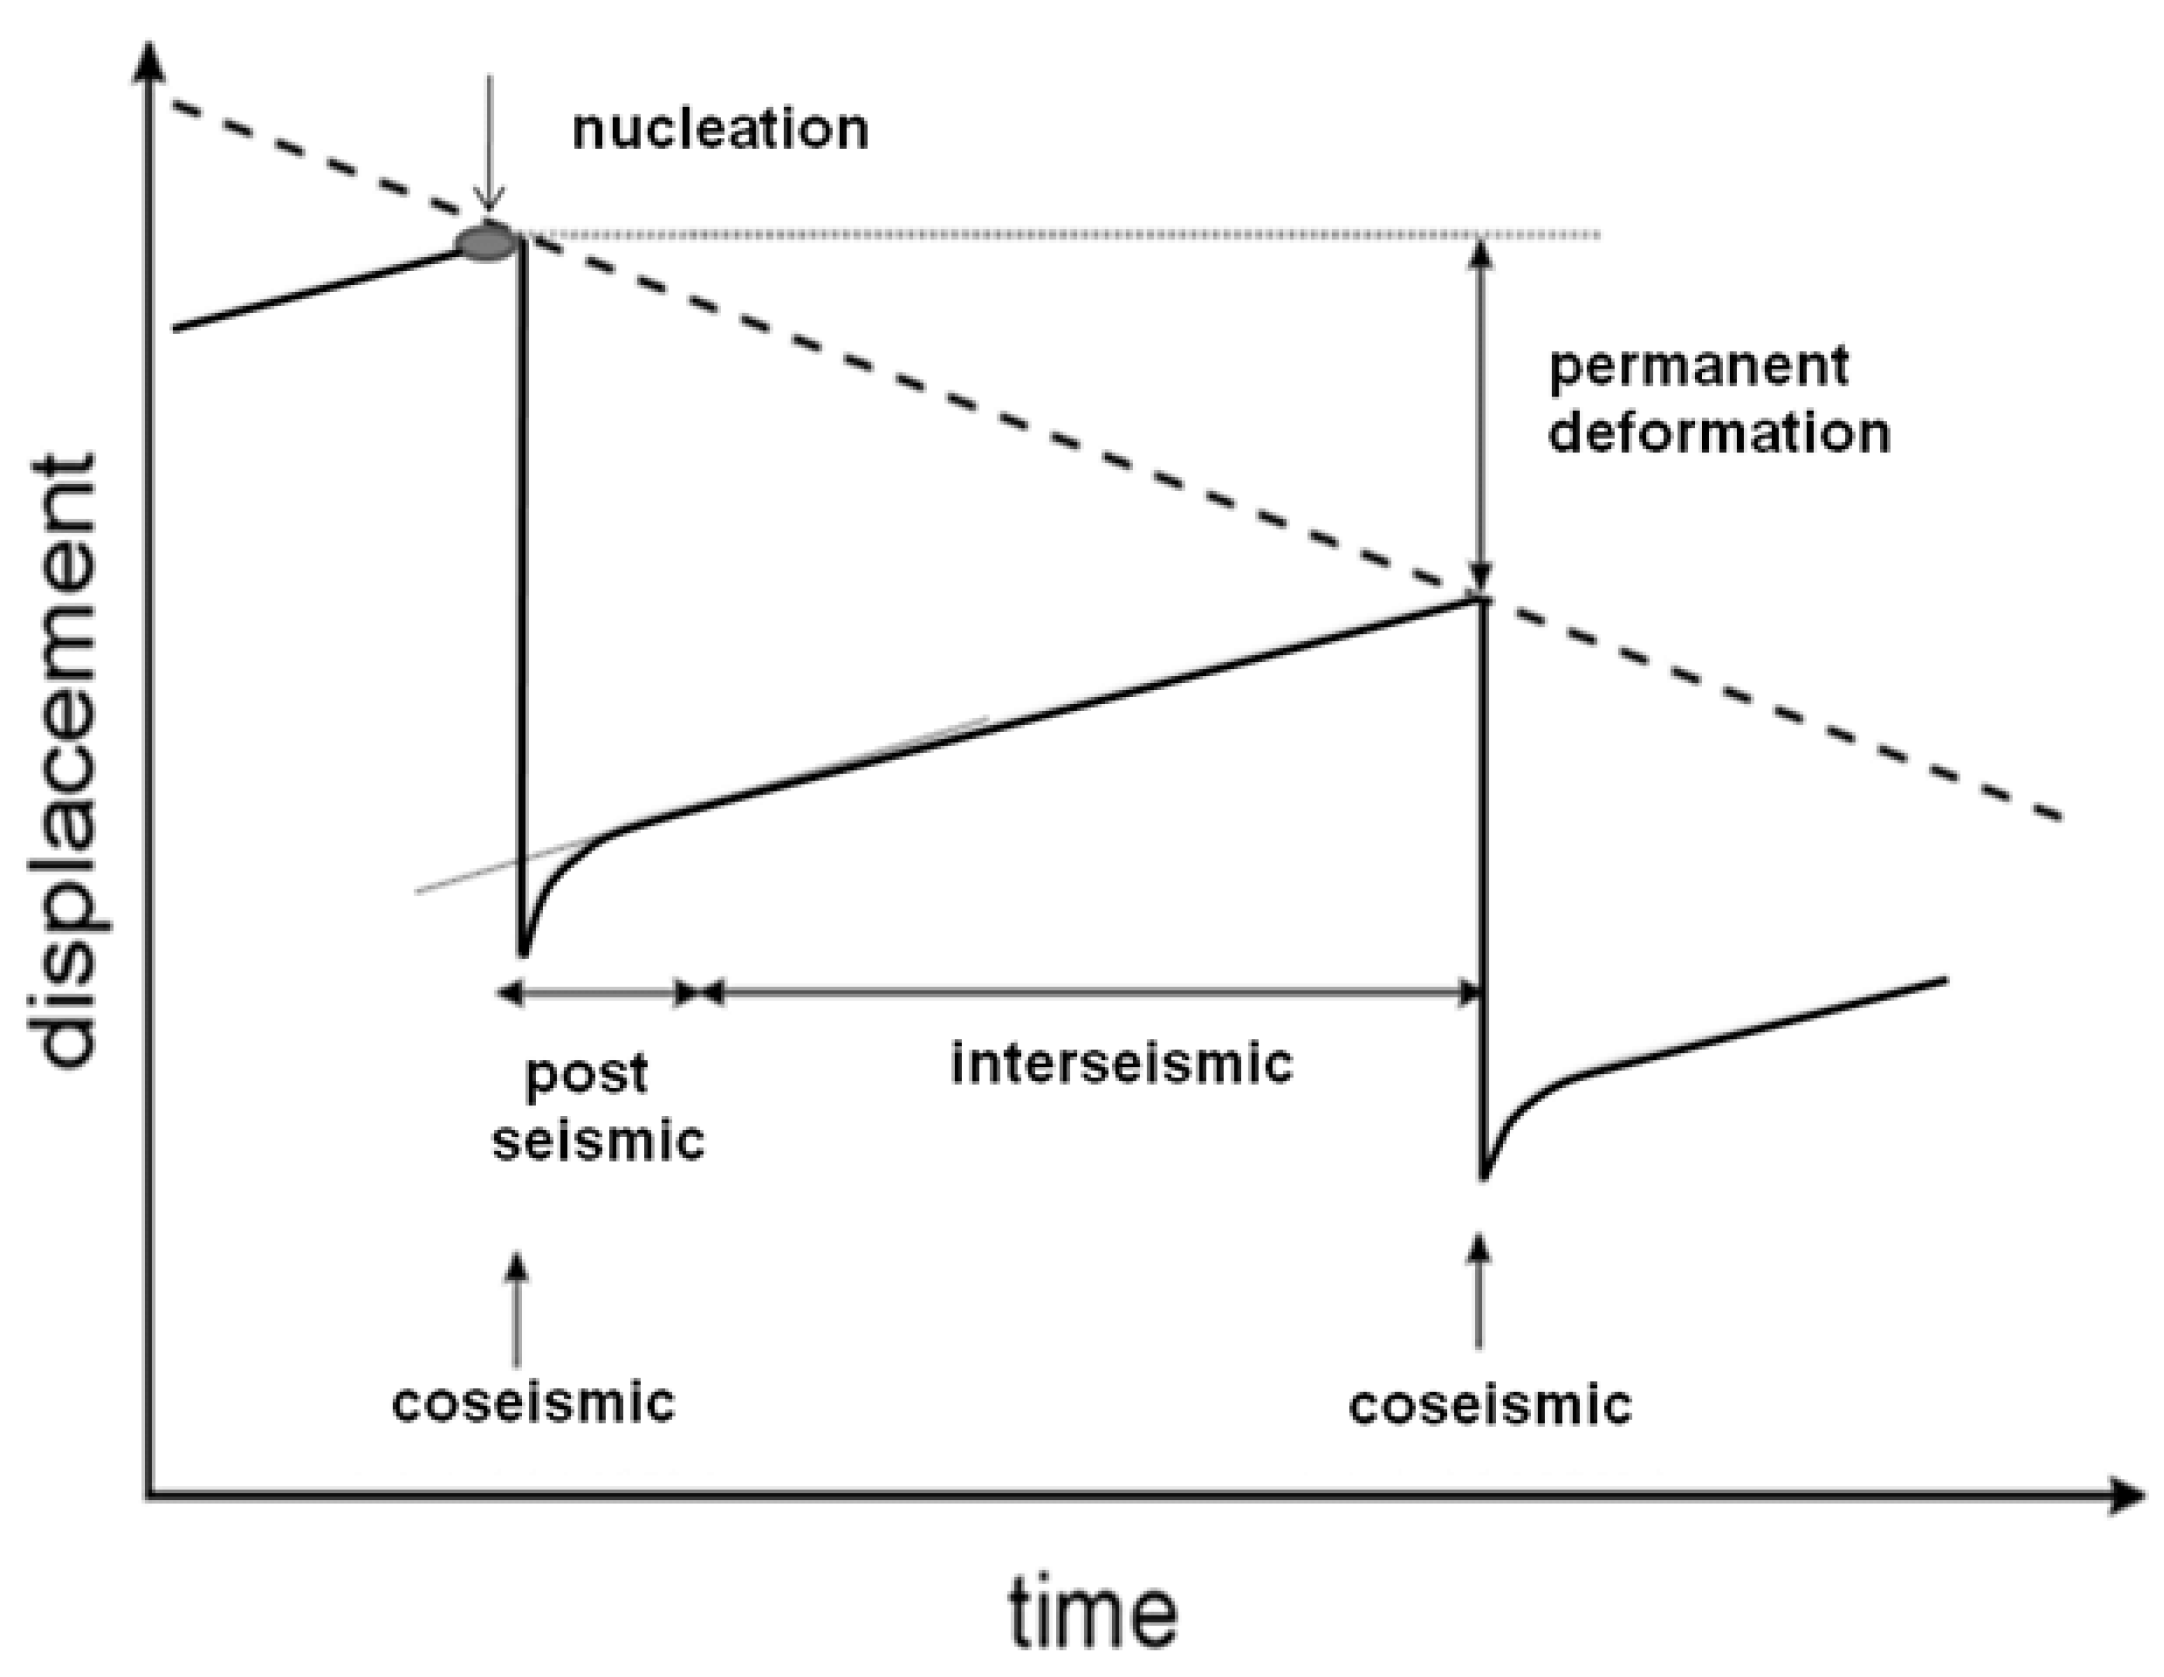
3.2. Methodology
4. Results
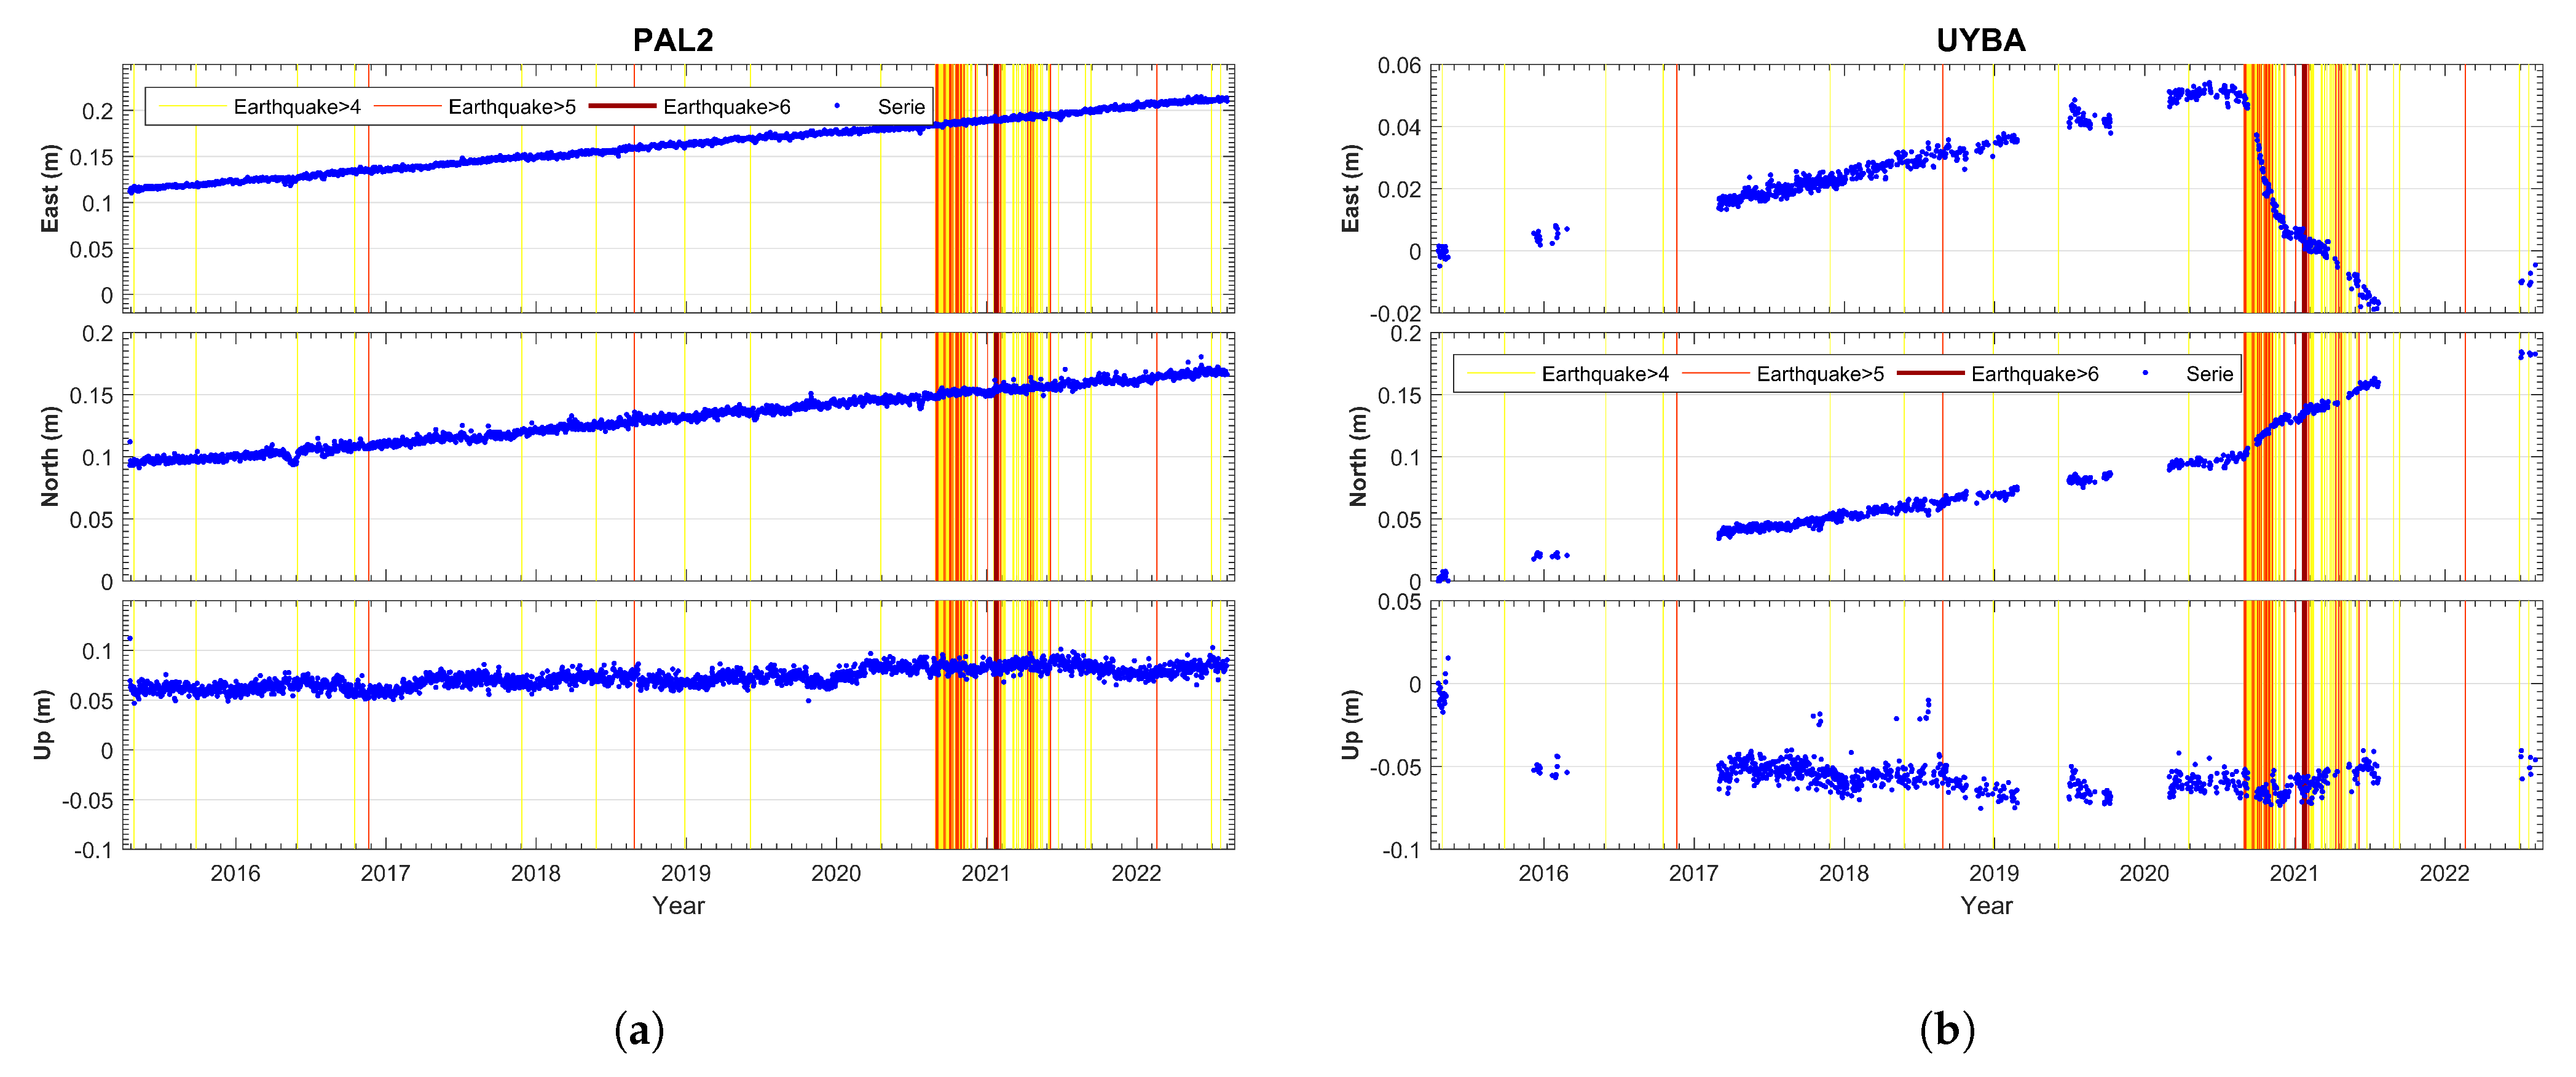
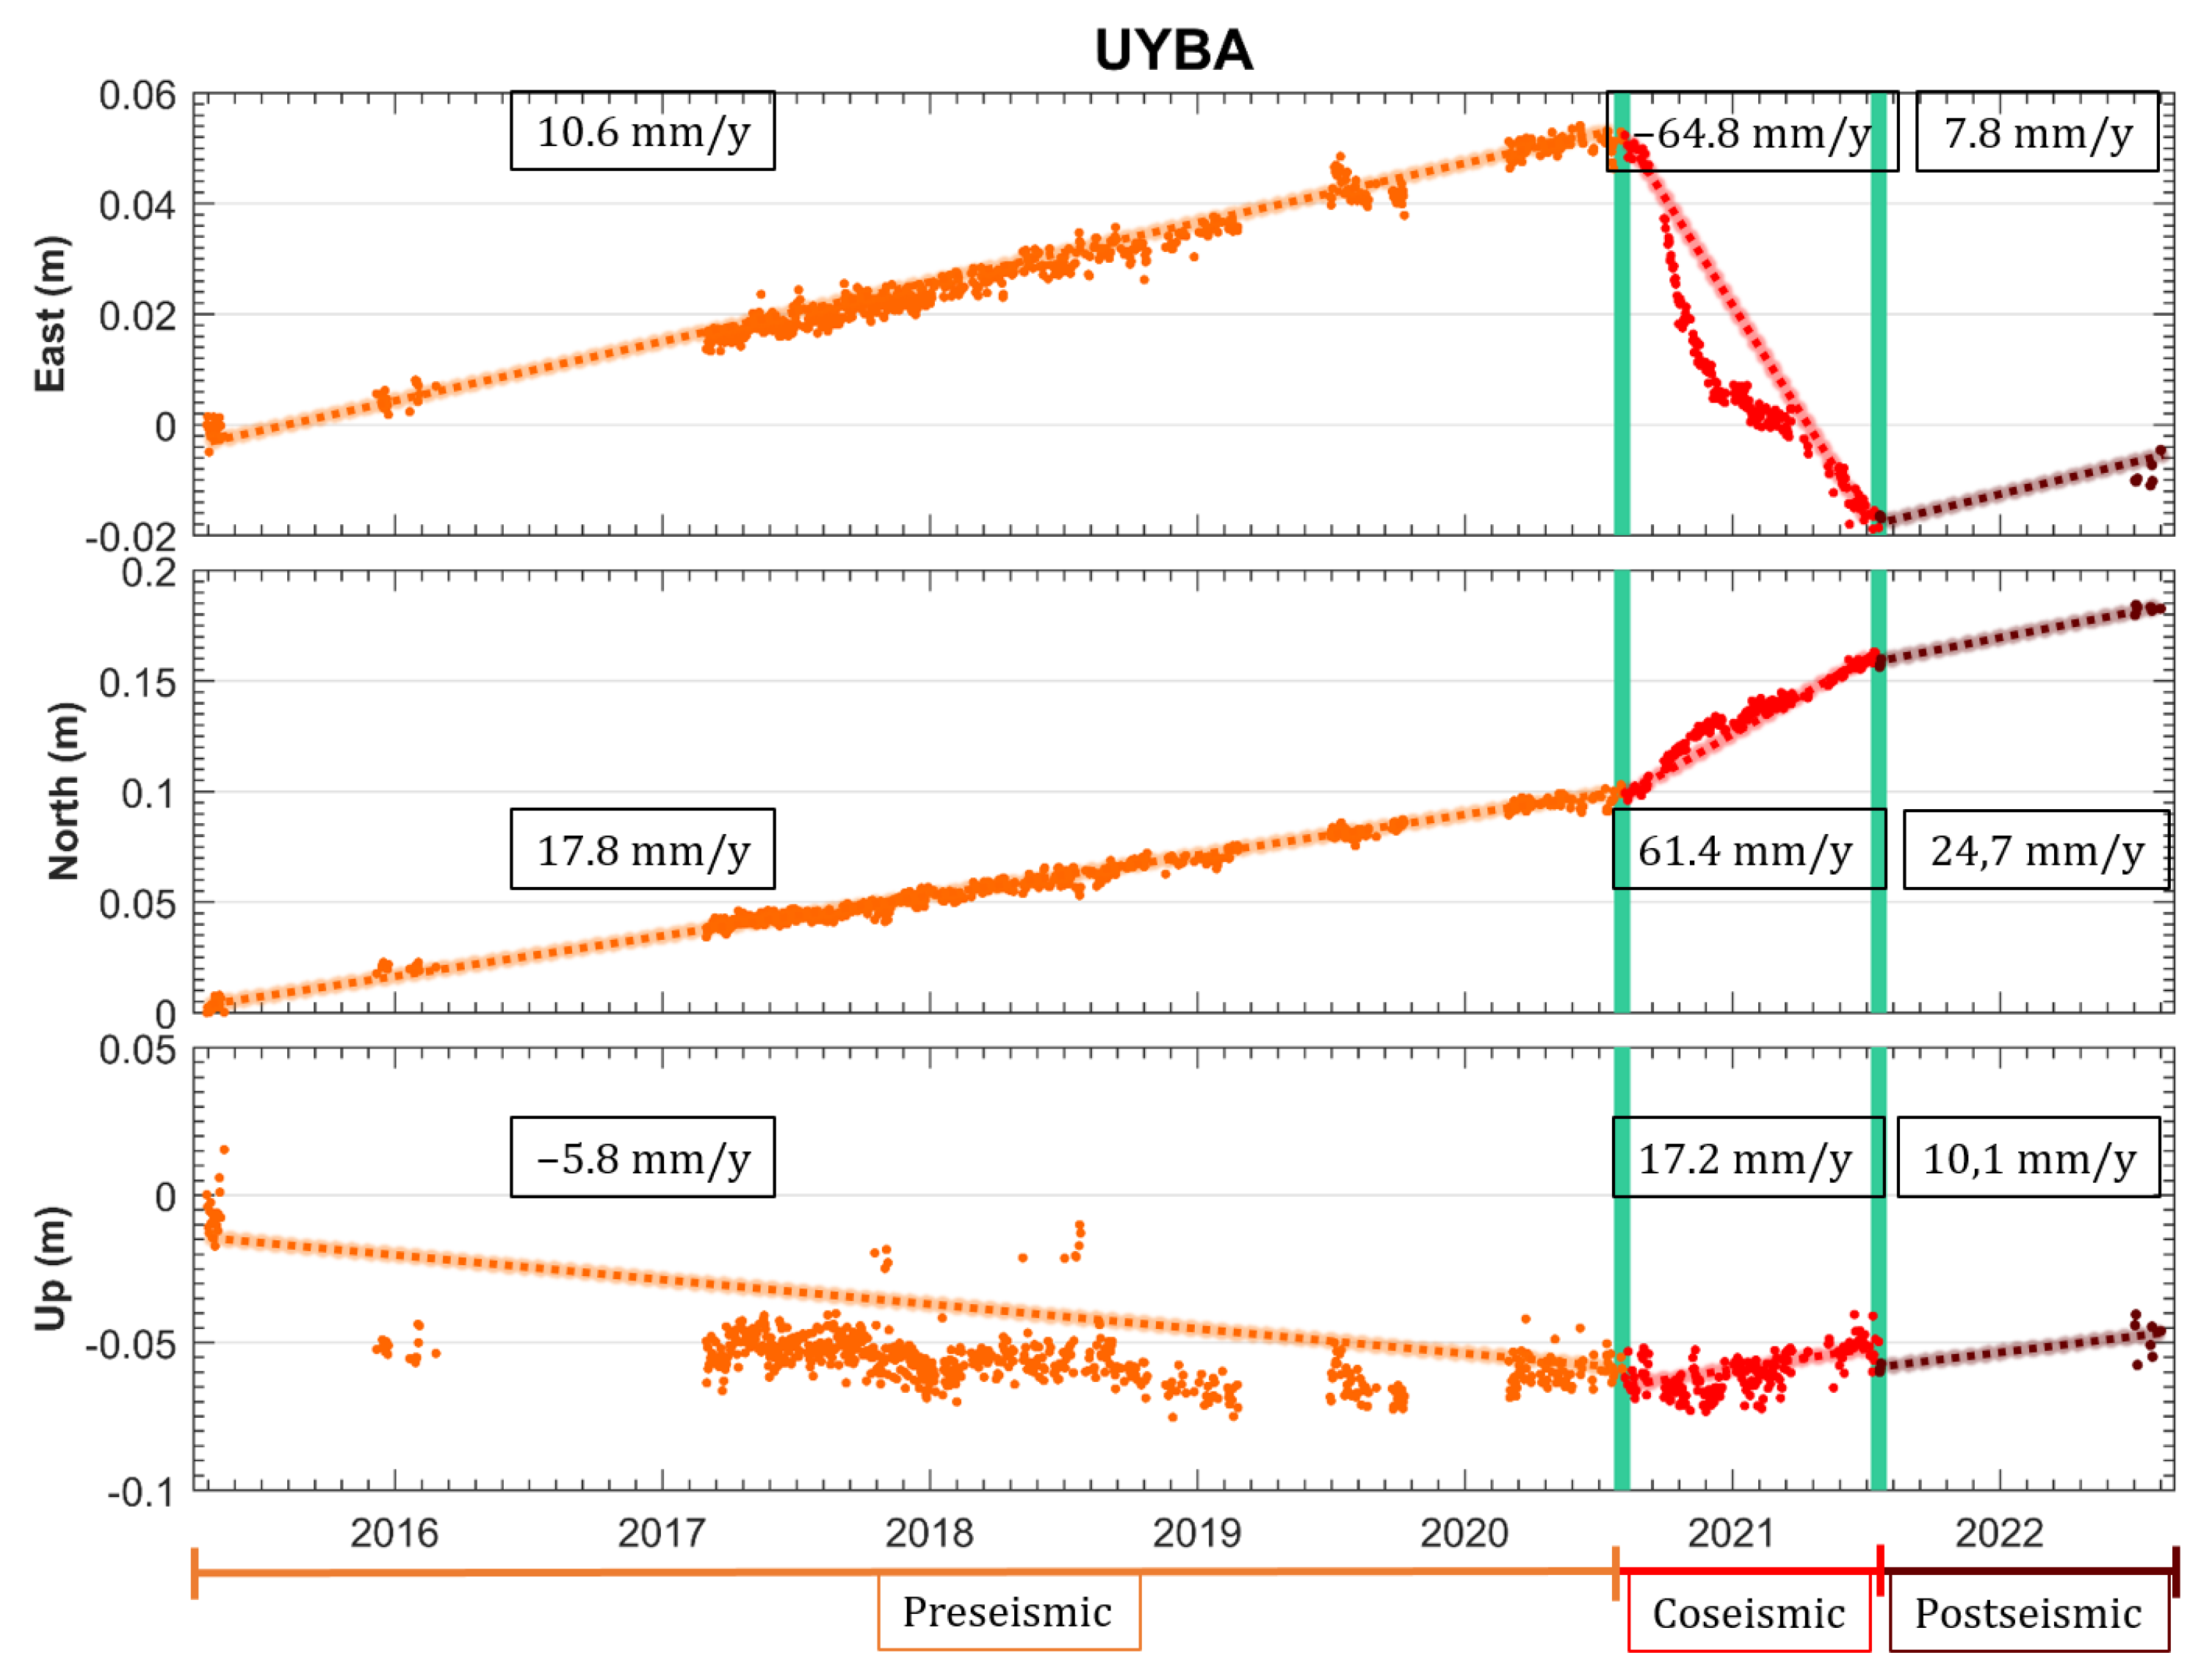
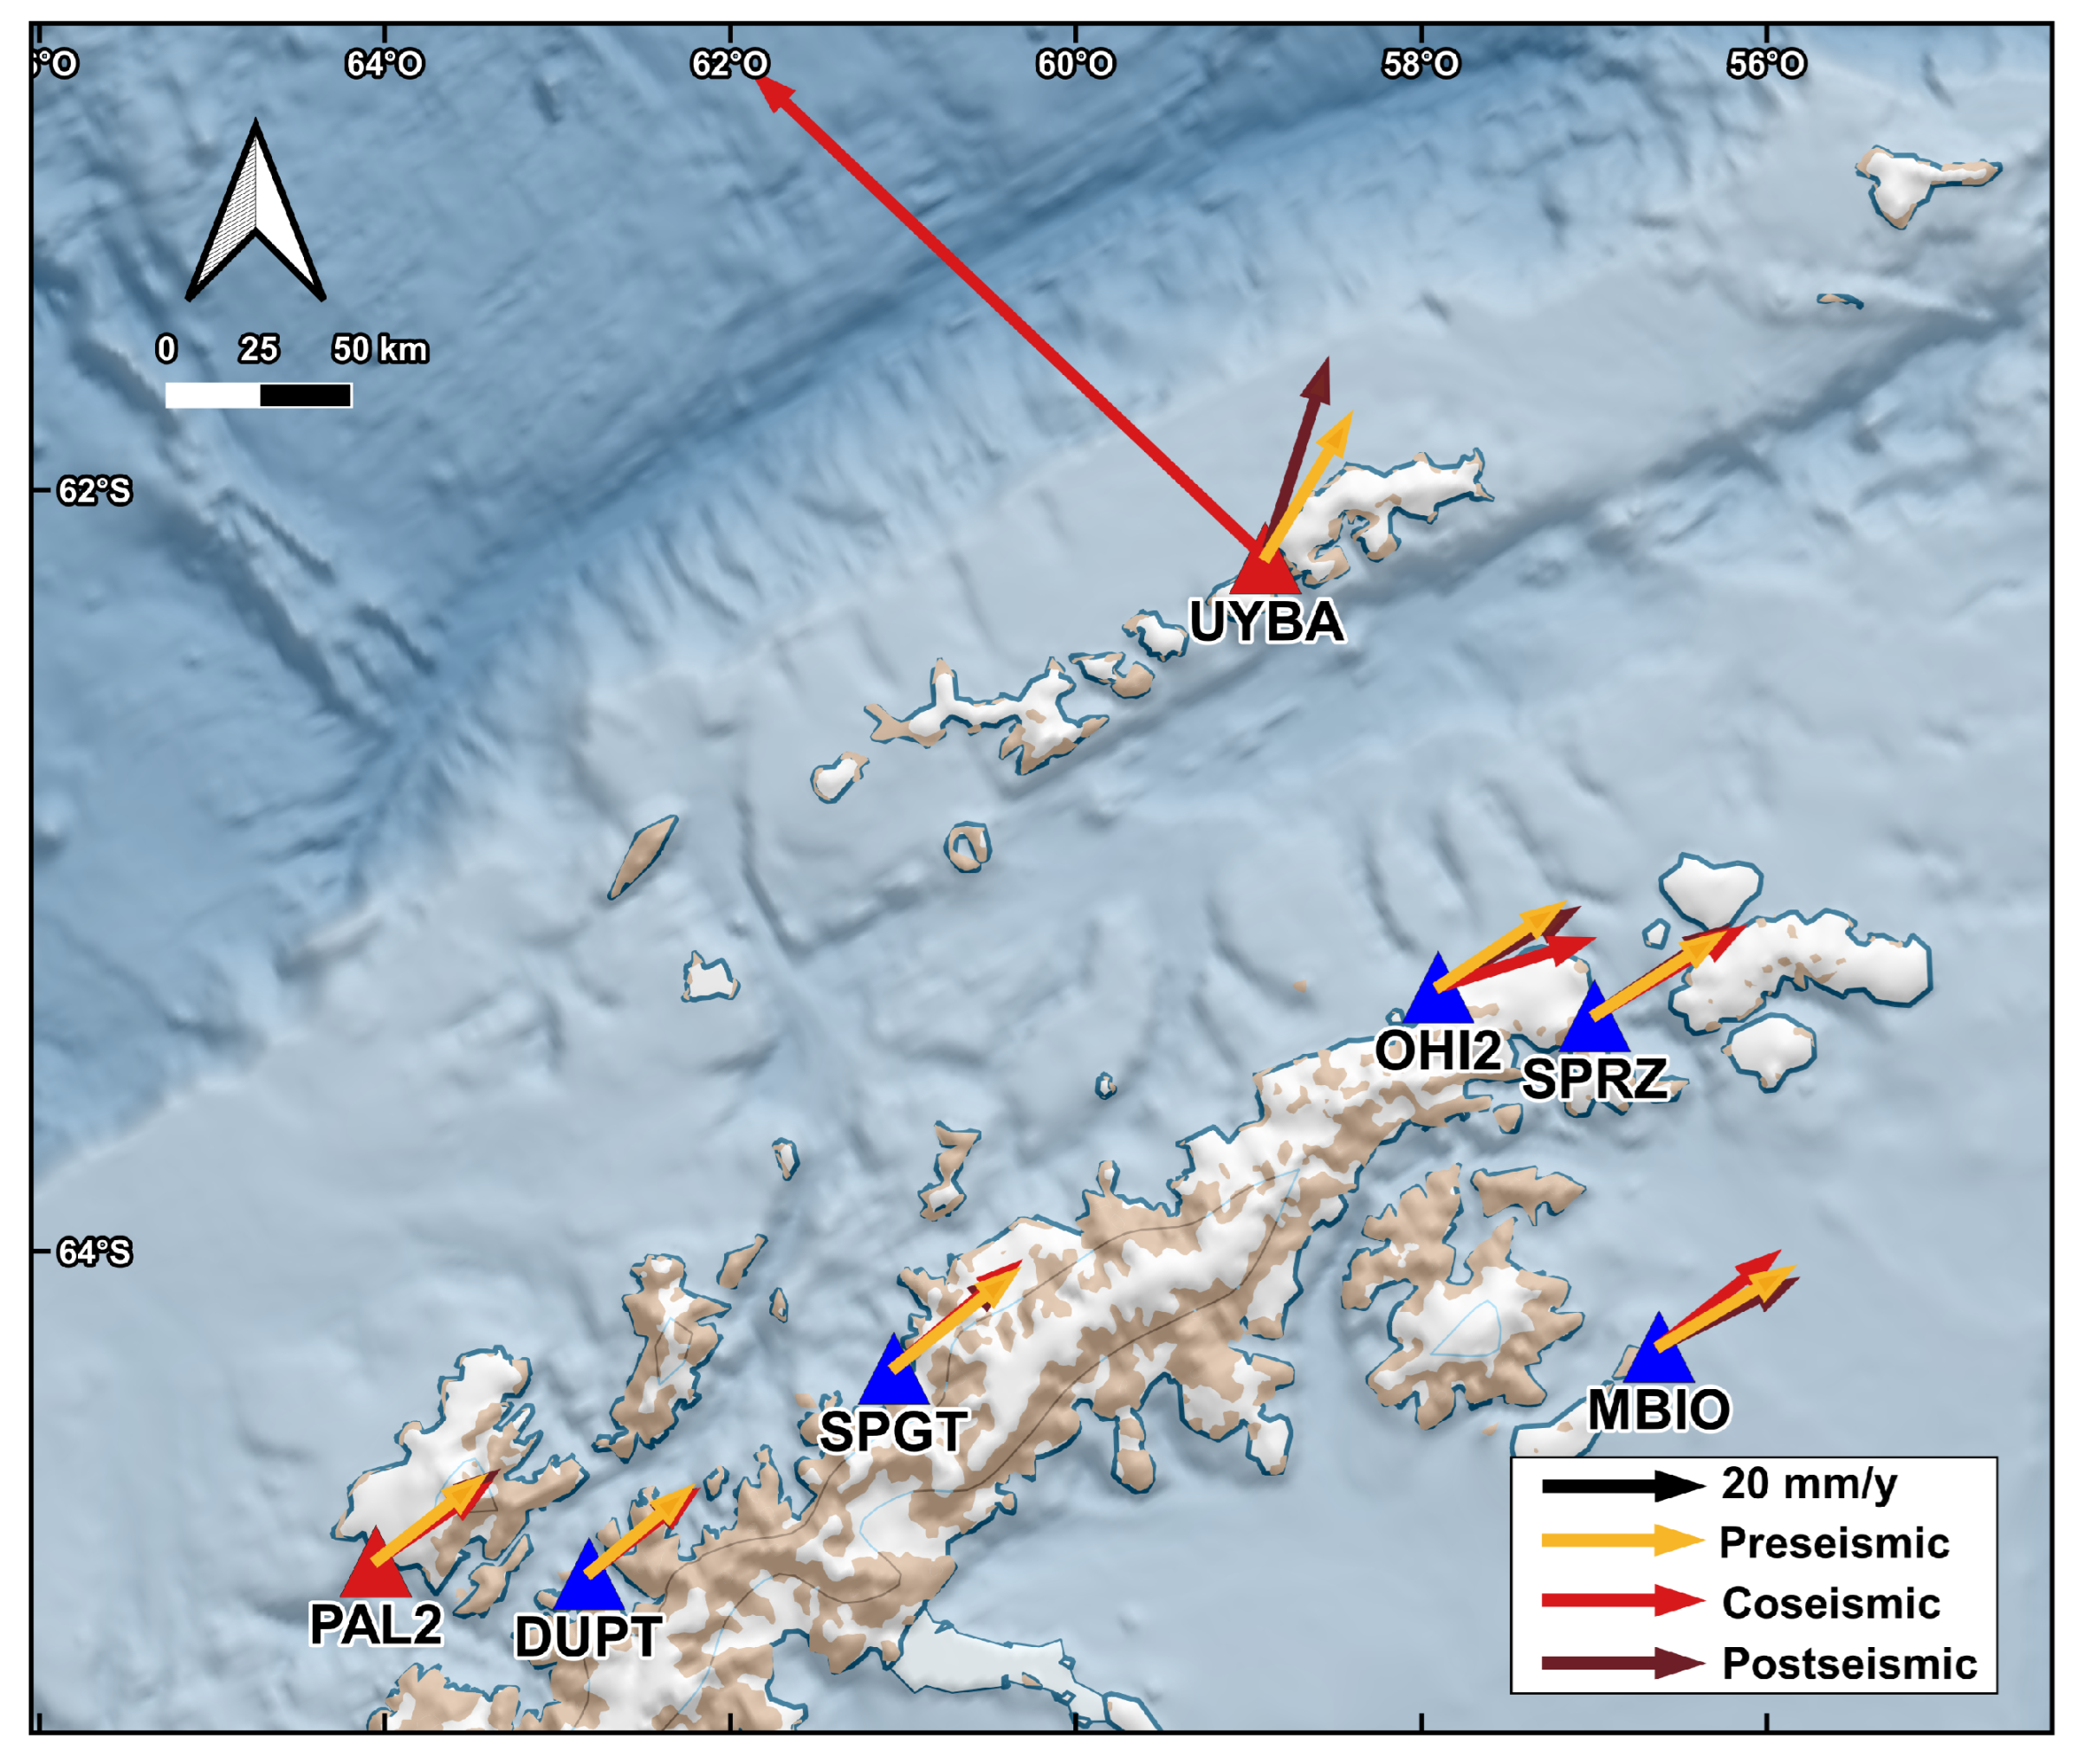
4.1. Time Series of the UYBA and PAL2 Stations
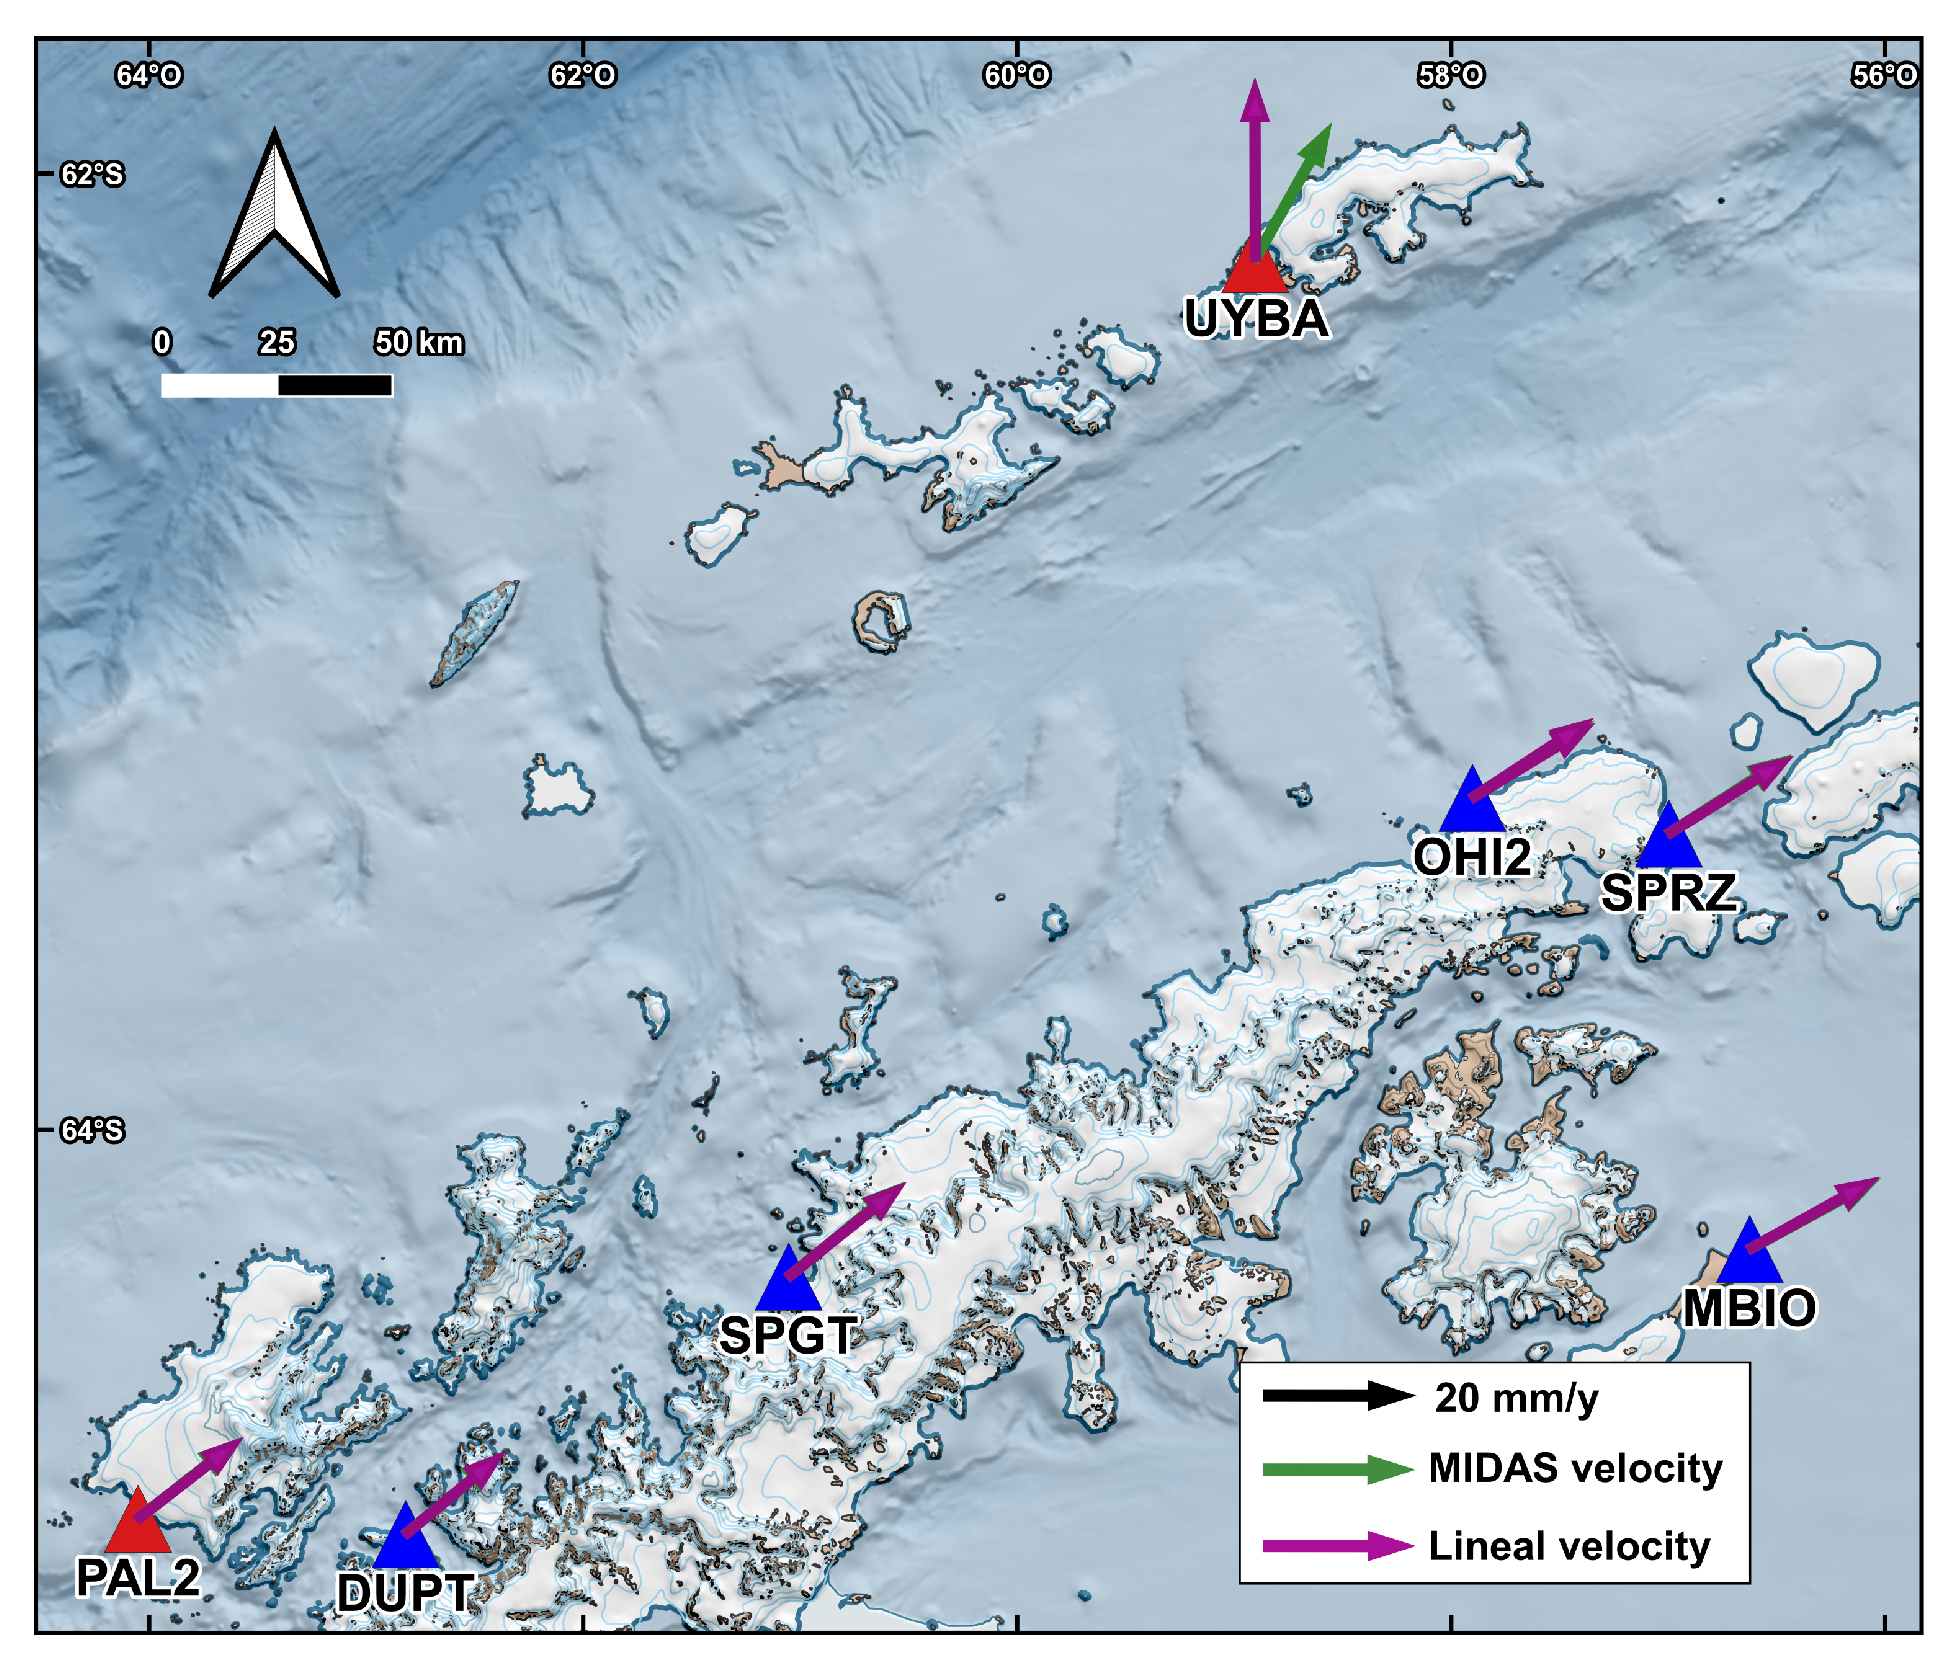
4.2. Evaluation of MIDAS Velocities versus Linear Velocities
4.3. Preseismic, Coseismic, and Postseismic Displacement Models
5. Conclusions
Author Contributions
Funding
Institutional Review Board Statement
Informed Consent Statement
Data Availability Statement
Acknowledgments
Conflicts of Interest
References
- Rosado, B.; Fernández-Ros, A.; Berrocoso, M.; Prates, G.; Gárate, J.; De Gil, A.; Geyer, A. Volcano-tectonic dynamics of Deception Island (Antarctica): 27 years of GPS observations (1991–2018). J. Volcanol. Geotherm. Res. 2019, 381, 57–82. [Google Scholar] [CrossRef]
- Robertson-Maurice, S.D.; Wiens, D.A.; Shore, P.J.; Vera, E.; Dorman, L.M. Seismicity and tectonics of the South Shetland Islands and Bransfield Strait from a regional broadband seismograph deployment. J. Geophys. Res. 2003, 108, 2461. [Google Scholar] [CrossRef]
- Ibáñez, J.M.; Carmona, E.; Almendros, J.; Saccorotti, G.; Del Pezzo, E.; Abril, M.; Ortiz, R. The 1998–1999 seismic series at Deception Island volcano, Antarctica. J. Volcanol. Geotherm. Res. 2003, 128, 65–88. [Google Scholar] [CrossRef]
- Cesca, S.; Sugan, M.; Rudzinski, L.; Vajedian, S.; Niemz, P.; Plank, S.; Petersen, G.; Deng, Z.; Rivalta, E.; Vuan, A.; et al. Massive earthquake swarm driven by magmatic intrusion at the Bransfield Strait, Antarctica. Commun. Earth Environ. 2022, 3, 89. [Google Scholar] [CrossRef]
- Olivet, J.L.; Bettucci, L.S.; Castro-Artola, O.A.; Castro, H.; Rodríguez, M.; Latorres, E. A seismic swarm at the Bransfield Rift, Antarctica. J. S. Am. Earth Sci. 2021, 111, 103412. [Google Scholar] [CrossRef]
- Yuan, P.; Blewitt, G.; Kreemer, C.; Hammond, W.C.; Argus, D.; Yin, X.; Van Malderen, R.; Mayer, M.; Jiang, W.; Awange, J.; et al. An enhanced integrated water vapour dataset from more than 10000 global ground-based GPS stations in 2020. Earth Syst. Sci. Data 2023, 15, 723–743. [Google Scholar] [CrossRef]
- Blewitt, G.; Hammond, W.C.; Kreemer, C. Harnessing the GPS data explosion for interdisciplinary science. Eos 2018, 99, 485. [Google Scholar] [CrossRef]
- Bertiger, W.; Bar-Sever, Y.; Dorsey, A.; Haines, B.; Harvey, N.; Hemberger, D.; Heflin, M.; Lu, W.; Miller, M.; Moore, A.W.; et al. GipsyX/RTGx, a new tool set for space geodetic operations and research. Adv. Space Res. 2020, 66, 469–489. [Google Scholar] [CrossRef]
- Zumberge, J.; Heflin, M.; Jefferson, D.; Watkins, M.; Webb, F. Precise point positioning for the efficient and robust analysis of GPS data from large networks. J. Geophys. Res. Solid Earth 1997, 102, 5005–5017. [Google Scholar] [CrossRef]
- Barba, P.; Rosado, B.; Ramírez-Zelaya, J.; Berrocoso, M. Comparative Analysis of Sta-tistical and Analytical Techniques for the Study of GNSS Geodetic Time Series. Eng. Proc. 2021, 5, 21. [Google Scholar] [CrossRef]
- Rosado, B.; Ramírez-Zelaya, J.; Barba, P.; De Gil, A.; Berrocoso, M. Comparative Analysis of Non-Linear GNSS Geodetic Time Series Filtering Techniques: El Hierro Volcanic Process (2010–2014). Eng. Proc. 2021, 5, 23. [Google Scholar] [CrossRef]
- Blewitt, G.; Kreemer, C.; Hammond, W.C.; Gazeaux, J. MIDAS robust trend estimator for accurate GPS station velocities without step detection. J. Geophys. Res. Solid Earth. 2016, 121, 2054–2068. [Google Scholar] [CrossRef] [PubMed]
- Reddy, C.D.; Arora, S.K.; Sunil, P.S.; Prajapati, S.K. Earthquake Related Deformation Cycle: Perspectives from 2004 Sumatra and 2010 Chile Mega-Earthquakes. Disaster Adv. 2011, 4, 13–21. [Google Scholar]


| UYBA | PAL2 | |||
|---|---|---|---|---|
| Velocitt | East | North | East | North |
| MIDAS | 9.87 | 17.60 | 13.19 | 10.35 |
| Linear | −0.05 | 23.64 | 13.50 | 10.45 |
| UYBA | PAL2 | |||
|---|---|---|---|---|
| Velocity | East | North | East | North |
| Preseismic | 10.62 | 17.82 | 13.37 | 10.48 |
| Coseismic | −64.78 | 61.38 | 13.92 | 9.55 |
| Postseismic | 7.79 | 24.70 | 14.94 | 11.09 |
Disclaimer/Publisher’s Note: The statements, opinions and data contained in all publications are solely those of the individual author(s) and contributor(s) and not of MDPI and/or the editor(s). MDPI and/or the editor(s) disclaim responsibility for any injury to people or property resulting from any ideas, methods, instructions or products referred to in the content. |
© 2023 by the authors. Licensee MDPI, Basel, Switzerland. This article is an open access article distributed under the terms and conditions of the Creative Commons Attribution (CC BY) license (https://creativecommons.org/licenses/by/4.0/).
Share and Cite
Rosado, B.; Pérez-Peña, A.; Barba, P.; Ramírez-Zelaya, J.; Carmona, E.; Martín, R.; Jiménez, V.; Gárate, J.; de Gil, A.; Berrocoso, M. Analysis of GNSS Time Series Recorded on South Shetland Island and Antarctic Peninsula during the Geodynamic Activity in 2020 of the Orca Underwater Volcano (Brandfield Sea Rift, Antarctica). Eng. Proc. 2023, 39, 25. https://doi.org/10.3390/engproc2023039025
Rosado B, Pérez-Peña A, Barba P, Ramírez-Zelaya J, Carmona E, Martín R, Jiménez V, Gárate J, de Gil A, Berrocoso M. Analysis of GNSS Time Series Recorded on South Shetland Island and Antarctic Peninsula during the Geodynamic Activity in 2020 of the Orca Underwater Volcano (Brandfield Sea Rift, Antarctica). Engineering Proceedings. 2023; 39(1):25. https://doi.org/10.3390/engproc2023039025
Chicago/Turabian StyleRosado, Belén, Alejandro Pérez-Peña, Paola Barba, Javier Ramírez-Zelaya, Enrique Carmona, Rosa Martín, Vanessa Jiménez, Jorge Gárate, Amós de Gil, and Manuel Berrocoso. 2023. "Analysis of GNSS Time Series Recorded on South Shetland Island and Antarctic Peninsula during the Geodynamic Activity in 2020 of the Orca Underwater Volcano (Brandfield Sea Rift, Antarctica)" Engineering Proceedings 39, no. 1: 25. https://doi.org/10.3390/engproc2023039025
APA StyleRosado, B., Pérez-Peña, A., Barba, P., Ramírez-Zelaya, J., Carmona, E., Martín, R., Jiménez, V., Gárate, J., de Gil, A., & Berrocoso, M. (2023). Analysis of GNSS Time Series Recorded on South Shetland Island and Antarctic Peninsula during the Geodynamic Activity in 2020 of the Orca Underwater Volcano (Brandfield Sea Rift, Antarctica). Engineering Proceedings, 39(1), 25. https://doi.org/10.3390/engproc2023039025