1. Introduction
Islands close to the Indian Ocean require imports of primary energy resources such as natural gas, coal, and fossil energy to meet everyday requirements. Therefore, in response to the severe climate change and global energy crisis, the government of Mauritius has outlined its intention to oversee and promote solar photovoltaic (PV) technologies through the local electricity public utility company. However, the accurate prediction and integration of PV energy must be preceded by better planning and distribution strategies to ensure the stability of electrical grid energy.
Systems transform solar energy into electric power. Accurate photovoltaic power generation is linked to the accurate forecasting of solar irradiance. Thus, most research studies are based on solar irradiance forecasting, and several forecasting methods have been cited in the literature [
1,
2,
3,
4], ranging from physical [
5,
6] to machine learning methods [
7,
8] via classical statistical techniques. The latter have been classified as linear stationary models, which is mainly where Auto-Regressive Moving Average (ARMA) models and Vector Auto Regressive (VAR) are concerned, or linear non-stationary models, e.g., Auto-Regressive Integrated Moving Average (ARIMA) [
9] techniques, which are stochastic process combining Auto-Regressive (AR) and Moving Average (MA) components. The downside of these statistical models is that forecast accuracy decreases with increasing independent variables such as for the PV power output, which is a function that depends on various weather parameters. Moreover, the forecast of PV power generation has also been classified [
10,
11,
12] in time horizon depending on the needs of the PV production and electrical transport management. The proposed time horizon is defined as follows:
Very short-term forecast horizon: a few seconds to one hour; used for electricity dispatch in real-time and energy smoothing.
Short-term forecast: for one or several hours up to the day ahead; guarantees system commitment and scheduling.
Medium-term forecast: multiple days to months ahead; ensures power system planning.
Long-term forecast: months to one or several years; finds and assesses potentially resourceful sites.
For this research paper, we used a robust statistical cointegration approach, the Johansen vector error correction model (VECM), to determine long-term equilibrium relationships. It is important to note that the Johansen approach for cointegration has been a popular tool in applied economics but it has never been applied to PV systems for forecasting. A unique feature of the resulting model is that it can be applied for the medium-term horizon time PV power output prediction in an island zone. The measured dataset is compared to the model one for different seasonal horizon times. The obtained results prove the model’s efficacy and show promise for application in further studies aiming to investigate short-term horizon times.
The rest of this paper is organized as follows:
Section 2 contains a short historical overview of the experimental conditions and methods used in our study.
Section 3 presents a brief introduction of the Johansen test.
Section 4 presents the obtained results. Finally,
Section 5 provides our conclusions and presents ideas for future studies.
2. Research History
2.1. European Zone
Firstly, we studied a linear relation analysis of time series data collected from a PV system from the GREEN lab in Metz, France [
13]. The PV system is a grid-connected system equipped with solar irradiance and temperature sensors. Therefore, the power output is the dependent variable, while the solar irradiance and PV module temperature are the explanatory variables. We performed time series, correlograms at level, Augmented Dickey–Fuller (ADF) [
14,
15] stationarity tests, and residuals analysis such as the Goldfeld–Quandt (GQ) and Durbin–Watson tests. When outliers were suspected, we applied the Engle–Granger (EG) method [
16,
17] to determine the most appropriate model. The determined power output EG cointegration relationship was then applied to other experimental years for the Green lab in the European zone and compared to the measured power output data.
2.2. Island Zone
The EG model was applied to a PV system in the Reunion Island in the Indian Ocean, and results were not very conclusive. Other weather parameters (such as wind, humidity, dust) must be considered in such zones as they have an impact on the PV power output. Spurious regression appeared. Consequently, we investigated whether the Johansen VECM was a model that could be fitted to the zone, as more than two explanatory variables should be considered. Indeed, the Johansen VECM cointegration test can be considered as a multivariate generalization of the ADF test, enabling the estimation of all cointegrating vectors when more than two variables are considered. The PV system in Reunion island is equipped with solar irradiance, module temperature, and wind and humidity sensors, and data is recorded at a sample time of 15 min. The Johansen VECM cointegration test has already been applied to Reunion Island, as reported elsewhere [
18]. Johansen cointegration Trace and Eigen value tests, as well as lag criteria had been carried out to determine the number of cointegration equations with the corresponding error correction coefficients. The Wald test was applied to exclude short-term relationships, and white noise tests, such as the Lagrange multiplier and Jarque–Bera test, were applied to ensure normal residual distribution. The final cointegration relationship was then validated to determine long-term horizon times [
18].
The obtained resulting Johansen cointegration relationship was applied to a PV plant in the island of Mauritius in the southwest Indian Ocean close to Reunion island. These islands have similar weather conditions, and the year is divided in two main seasons: summer and winter. The summer and the intermediate seasons run from November to April, while the winter and the intermediate seasons run from May to October. In this paper, the used dataset for the island of Mauritius and the Johansen model spans over a one-year period (in this case, from July 2019 to July 2020 and from October 2021 to December 2022). The PV technology was silicon polycrystalline with a rated power of 320 Wp (north-facing orientation), and the PV total power was 20 kWp. The recorded data was filtered so that data between 4:30 P.M. and 7:30 A.M. for the following day and missing data were removed.
3. Johansen Procedure
If time series are nonstationary, it is not possible to use ordinary least square (OLS) to estimate their long-run linear relationships because this would lead to spurious regression. The technique of cointegration was introduced according to which models contained nonstationary stochastic variables and can be constructed in a way that ensures that the results are statistically meaningful. Therefore, the cointegration test and a vector error correction model were established to distinguish between short-term and long-term equilibrium. The Johansen procedure involves cointegrated variables that are directly constructed based on maximum likelihood estimation instead of depending on OLS estimation. The Johansen procedure [
19,
20] is simply a multivariate generalization of the ADF test and proposes two different likelihood ratio tests: (a) Trace test, (b) maximum Eigen values test. The Trace test is the null hypothesis tests of r cointegrating vectors against the alternative hypothesis of n cointegrating vectors, whereas the maximum eigen-value test is the null hypothesis tests of r cointegrating vectors against the alternative hypothesis of (r + 1) cointegrating vectors. A more complete description of the Johansen procedure is given in [
18]. Therefore, the procedure required when conduction a Johansen test can be summarized as follows:
- -
Perform series stationarity tests to determine the existence of cointegration relationships.
- -
If the previous step has been followed correctly, then the series are of the same order of integration, and cointegration is likely; therefore, the VECM model can be estimated. The lag length should be determined using Akaike and Schwarz’s criteria.
- -
The Johansen Trace and Eigen value tests should then be performed to determine the number of cointegration relationships.
- -
Then, identify the long-term relationships or cointegration relationships between variables.
- -
Subsequently, via the maximum likelihood method, the VECM model can be estimated, and validation tests can be performed for residuals and white noise.
4. Results
4.1. Long-Horizon Term: Yearly
The methodology described in the previous section was applied to develop a long-term prediction model for a grid-connected PV plant in Reunion island. Hence, the results reported in this section are based on the Johansen model that was initially trained on a dataset from 2013. The dataset consisted of a 15 by 15 min series of simultaneous solar irradiance, wind speed, humidity, and PV system parameters (mainly power output and module temperature) covering a whole year. The model had been trained [
18] and compared to a dataset from 2014 for validation regarding yearly horizon time.
The considered model was also applied to the island of Mauritius, where the experimental data employed in this current analysis were obtained from a PV plant located on the rooftop of the University of Mauritius. The experimental conditions were listed in
Section 2.2.
Figure 1 illustrates a scatter plot of the measured power output, determined via the Johansen model, on a yearly basis from July 2019 to July 2020 for each solar day hour between 09:00 A.M. to 04:00 P.M. The very high linear regression value (96%), reveals that the on-site measurement of PV power generation and the Johansen model are fundamental in accurately predicting the PV power output at different horizon times. This is elaborated in the following sections. Moreover, the model can be applied on a yearly basis for long-term horizon predicting, meaning that it can be used for unit commitment, load balancing and scheduling, and for planning infrastructure.
4.2. Long-Horizon Term: Monthly
In the literature, periods of a month to a year are considered as long horizon term. These predicted horizons are suitable for long-term power generation and feed into power grids while playing a role in determining seasonal trends. Therefore, taking into consideration the weather conditions described in
Section 2.2, we compared the on-site power output measurements to the Johansen model for different months in different seasons. We have chosen one particular month for each summer and winter season and two others for the intermediate season for the years 2019 and 2020. In
Figure 2, the left-hand side plots represent the measured power output and the corresponding Johansen model for the month of January 2020 in the summer season, July 2019 for the winter season, and the months of April 2020 and October 2019 for the intermediate season. The high R
2 values of the linear regressions and the fact that most of these values are greater than 92% mean that there is good agreement between the measured power and the Johansen model. The right-hand side of
Figure 2 are scatter plots representing the predicting power output. Indeed, we are comparing the results for the same period on the left-hand side but for years N + 1 or N + 2, as if we were predicting the same corresponding months.
The R2 values are greater than 90%, indicating that the Johansen model is positively and strongly correlated with on-site measurements. For the island of Mauritius and in agreement with the local energy supplier, this monthly long horizon term can be essential for maintaining the solar schedule.
4.3. Medium-Horizon Term: Weekly
Although the prior results seem adequate, weather fluctuations spanning one or few days may reduce predicting accuracy. Therefore, we decided to extend the study to shorter periods, that is, weekly medium-horizon term. For this study, we selected random weeks for each season and the intermediate seasons. The results are given in
Figure 3. The left-hand side are the scattered plots of random weeks for the weeks in 2020 or 2019. For the summer season, the random week selected was 19 to 25 January 2020. For the intermediate seasons, the selected weeks were 12 to 18 April 2020 and 10 to 17 September 2019. Finally, for the winter season, the selected week was 10 to 17 August for 2019. The vertical axis is the on-site measurements, and the horizontal axis is the Johansen model. The R
2 values of the linear regressions are greater than 95%, showing that the model is well adapted for predictions. Therefore, we applied the model to the same periods but for the year of 2022, as if we were led to make predictions for these similar weeks. The scattered plots on the right-hand side of
Figure 3 show the predicting results. The vertical axis is the Johansen model, and the horizontal axis is the measured power output.
Figure 3 shows that the R
2 values are more than 90%, again indicating a good correlation and proving suitable for this horizon term.
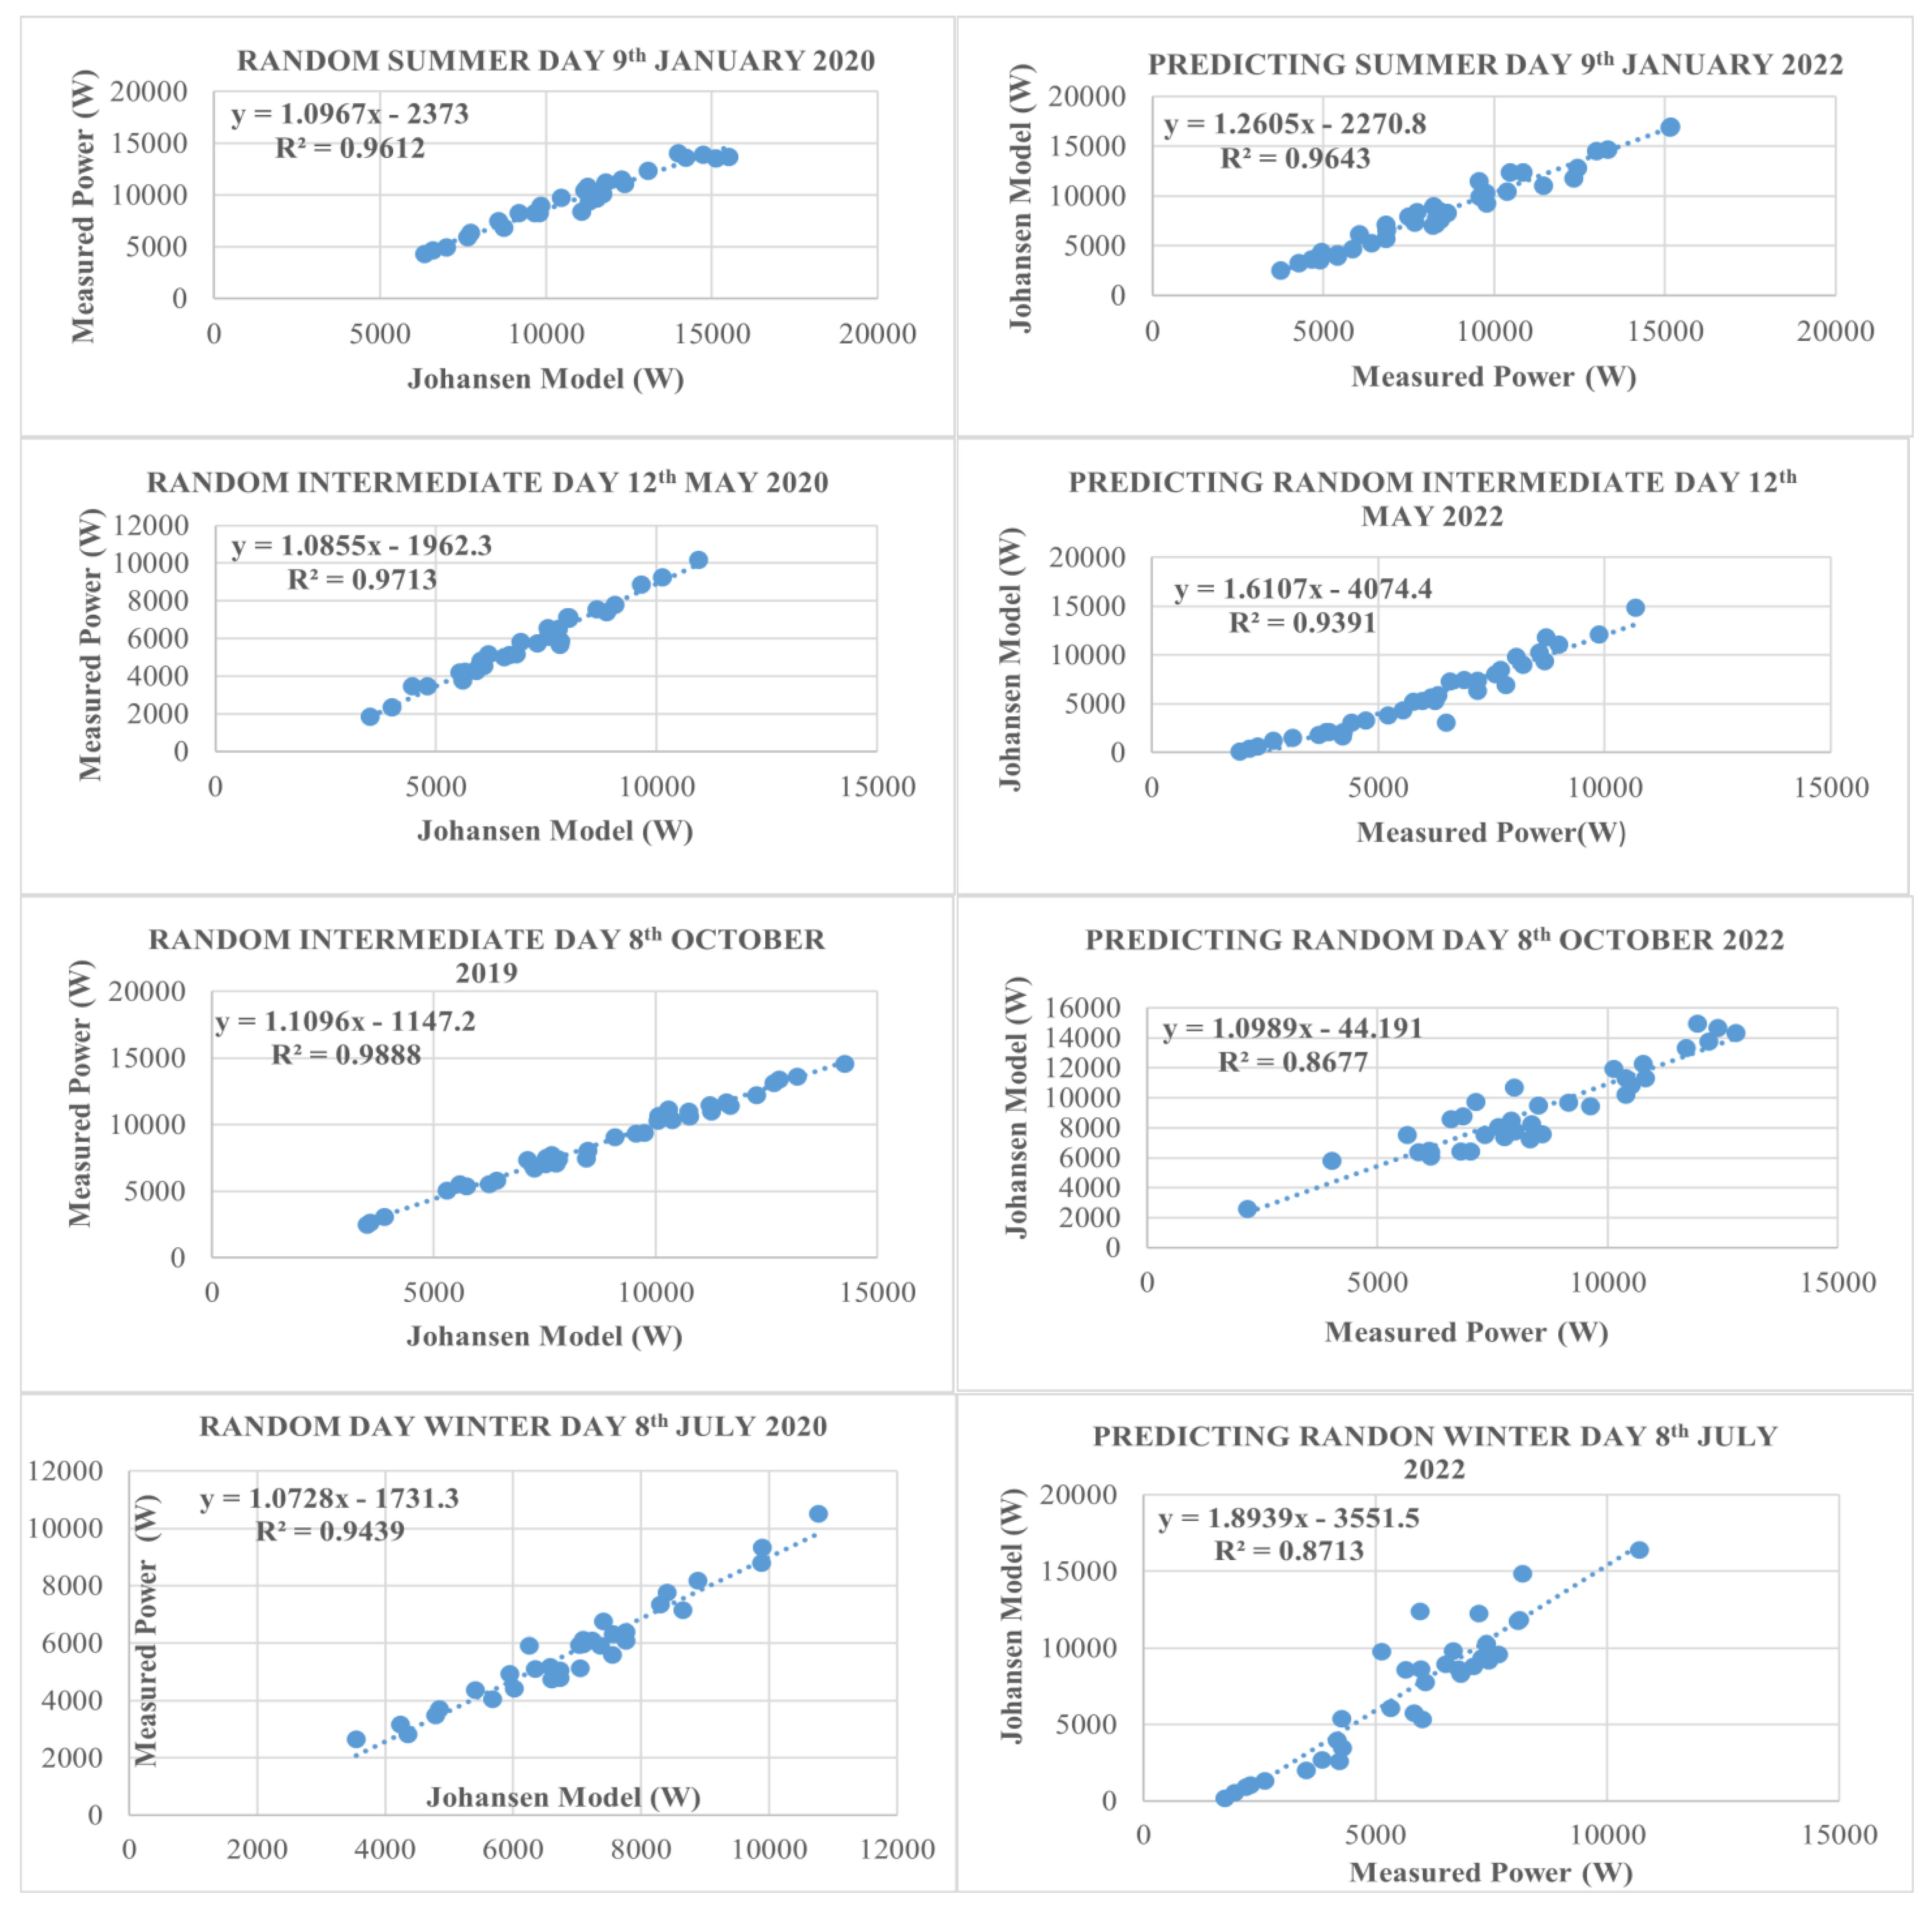
4.4. Medium-Horizon Term: Daily
This sub-section is concerned with a daily medium-horizon term, although in the literature, the daily period is sometimes considered as short-horizon term. We performed this last experiment by using a dataset consisting of daily 15 by 15 min data from on-site measurements between 08:00 A.M. to 04:00 P.M. as indicated in
Figure 4.
5. Conclusions
Predicting PV information is crucial for fulfilling energy efficiency requirements, electricity grid stability, and solar energy management. We focused on the use of a robust statistical technique in the form of the Johansen VECM to predict PV generation in the island zone of Mauritius. We proved the efficiency of the Johansen model for PV power generation by comparing our experimental results to on-site measurements. Results are not only in agreement with the aforementioned measurements but are also compliant with respect to the time horizon conditions of grid stability and where PV energy management as imposed by the local government. Indeed, we showed that the Johansen technique is a powerful tool for monthly and daily PV medium horizon time prediction. Further tests are in progress for the forecasting of very short-term horizon times, i.e., hourly to every 15 min. However, this method still needs to be improved by considering the climate vagaries. Therefore, our future work will focus on incorporating artificial intelligence to optimize the model.
Author Contributions
Conceptualization, H.R.; methodology, H.R.; validation, H.R. and C.T.; formal analysis, N.R.; investigation, H.R. and A.K.; resources, H.R. and A.K.; data curation, H.R. and A.K.; writing—original draft preparation, H.R.; writing—review and editing, C.T. and N.R.; visualization, A.K.; supervision, A.K.; project administration, H.R. and A.K; funding acquisition, A.K. All authors have read and agreed to the published version of the manuscript.
Funding
The authors thank the University of Mauritius for supporting this research.
Institutional Review Board Statement
Not applicable.
Informed Consent Statement
Not applicable.
Data Availability Statement
The data for this this paper can be found at the University of Mauritius.
Acknowledgments
This work was supported by the University of Mauritius.
Conflicts of Interest
Abdel Khoodaruth is the project manager of the following project at the University of Mauritius: Development of a framework for predicting photovoltaic plant power output considering temperature effects under real conditions to enhance grid stability in Mauritius.
References
- Qing, X.; Niu, Y. Hourly day-ahead solar irradiance prediction using weather forecasts by LSTM. Energy 2018, 148, 461–468. [Google Scholar] [CrossRef]
- Cao, J.C.; Cao, S.H. Study of forecasting solar irradiance using neural networks with preprocessing sample data by wavelet analysis. Energy 2006, 31, 3435–3445. [Google Scholar] [CrossRef]
- Sharma, V.; Yang, S.; Walsh, W.; Reindl, T. Short term solar irradiance forecasting using a mixed wavelet neural network. Renew. Energy 2016, 90, 481–492. [Google Scholar] [CrossRef]
- Lima, F.; Martins, J.; Periera, R.; Lorenz, B.; Heinemann, D. Forecast for surface solar irradiance at the Brazilian Northeastern region using NWP model and Artificial Neural Networks. Renew. Energy 2016, 87, 807–818. [Google Scholar] [CrossRef]
- Lonij, V.P.A.; Brooks, A.E.; Cronin, A.D.; Leuthol, M.; Koch, K. Intra-hour forecasts of solar power production using measurements from a network of irrandiance sensors. Sol. Energy 2013, 97, 58–66. [Google Scholar] [CrossRef]
- Pedro, H.T.C.; Coimbra, C.F.M. Assessement of forecasting techniques for solar power production with no exogenous inputs. Sol. Energy 2012, 86, 2017–2028. [Google Scholar] [CrossRef]
- Voyant, C.; Notton, G.; Kalogirou, S.; Nivet, M.-L.; Paoli, C.; Motte, F.; Fouilloy, A. Machine learning methods for solar radiation forecasting: A review. Renew. Energy 2017, 105, 569–582. [Google Scholar] [CrossRef]
- Sharma, N.; Sharma, P.; Irwin, D.; Shenoy, P. Predicting solar generation from weather forecasts using machine learning. In Proceedings of the IEEE International Conference on Smart Grid Communications, Brussels, Belgium, 17–20 October 2011; pp. 528–533. [Google Scholar]
- Colak, I.; Yesilbudak, M.; Genc, N.; Bayindir, R. Multi-period prediction of solar radiation using ARMA and ARIMA models. In Proceedings of the IEEE 14th International Conference on Machine Learning and Applications, Miami, FL, USA, 9–11 December 2015; pp. 1045–1049. [Google Scholar]
- Boroojeni, K.G.; Amini, M.H.; Bahrami, S.; Iyengar, S.S.; Sarwat, A.I.; Karabasoglu, O. A novel multi-time scale modeling for electric power demand forecasting: From short-term to medium-term horizon. Electr. Power Syst. Res. 2017, 142, 58–73. [Google Scholar] [CrossRef]
- Lundquist, K.; Chow, F.; Lundquist, J. An Immersed Boundary Method for the Weather Research and Forecasting Model. Am. Meteorol. J. 2010, 138, 796–817. [Google Scholar] [CrossRef]
- Chaturvedi, D.K. Solar Power Forecasting: A Review. Int. J. Comput. Appl. 2016, 145, 28–50. [Google Scholar]
- Ramenah, H.; Casin, P.; Ba, M.; Benne, M.; Tanougast, C. Accurate determination of parameters relationship for photovoltaic power output by Augmented Dickey Fuller test and Engle & Granger method. AIMS Energy 2018, 6, 19–48. [Google Scholar]
- Dickey, D.; Fuller, W. Distribution of the estimates for the autoregressive time series with a unit root. J. Am. Stat. Assoc. 1979, 74, 427–431. [Google Scholar]
- Gujarati, D.N. Basic of Econometrics, 4th ed.; McGraw-Hill Econometrics: New York, NY, USA, 2004. [Google Scholar]
- Engle, R.F.; Granger, C.W.J. Co-integration and error correction: Representation, estimation and testing. Econometrica 1987, 55, 251–276. [Google Scholar] [CrossRef]
- Ender, W. Applied Economic Time Series; Wiley Series in Probabilty and Statistics; Wiley: New York, NY, USA, 1995. [Google Scholar]
- Fanchette, Y.; Ramenah, H.; Tanougast, C.; Benne, M. Applying Johansen VECM cointegration approach to propose a forecast model of photovoltaic power output plant in Reunion Island. AIMS Energy 2020, 8, 179–213. [Google Scholar] [CrossRef]
- Johansen, S. Statistical Analysis of Cointegration Vectors. J. Econ. Dyn. Control. 1987, 12, 231–254. [Google Scholar] [CrossRef]
- Johansen, S.; Juselius, K. Maximum likelihood estimation and inferences on cointegration with applications to the demand for money. Oxf. Bull. Econ. Stat. 1990, 52, 169–210. [Google Scholar] [CrossRef]
| Disclaimer/Publisher’s Note: The statements, opinions and data contained in all publications are solely those of the individual author(s) and contributor(s) and not of MDPI and/or the editor(s). MDPI and/or the editor(s) disclaim responsibility for any injury to people or property resulting from any ideas, methods, instructions or products referred to in the content. |
© 2023 by the authors. Licensee MDPI, Basel, Switzerland. This article is an open access article distributed under the terms and conditions of the Creative Commons Attribution (CC BY) license (https://creativecommons.org/licenses/by/4.0/).


