Proceeding Paper

Design of the Speech Emotion Recognition Model †

School of Information, Mechanical and Electrical Engineering, Normal University, Ningde 352100, China
*
Author to whom correspondence should be addressed.
Presented at the 3rd IEEE International Conference on Electronic Communications, Internet of Things and Big Data Conference 2023, Taichung, Taiwan, 14–16 April 2023.
Eng. Proc. 2023, 38(1), 86; https://doi.org/10.3390/engproc2023038086
Published: 21 July 2023

Abstract

:
Existing emotional feature methods only represent the limited information on the emotional state and lack the mining and utilization of the correlation between emotional features. Therefore, a new design scheme is proposed based on the psychological acoustic model of the speech spectrum to investigate the characteristics of the spectrum distribution of emotion. The proposed model for speech emotion recognition improves the accuracy of the recognition and provides the basis for the development and application of further developed models for speech emotion recognition.

1. Introduction

Speech is the most important way for people to communicate. Voice signals contain rich semantic information and carry emotional status effectively. The recognition of the emotional status in speech with the machine learning method is used in virtual reality, driving safety, medicine, customer service quality, and many other applications. Recently, the rapid development of artificial intelligence (AI) and virtual reality (VR) has promoted the publication of various studies on speech emotion recognition [1]. In human–computer interactions and VR immersion, speech emotion recognition plays an important role in the transportation industries, including the automobile, aircraft, and shipbuilding industries. By analyzing the emotional changes that occur during the user purchase process, sales methods and strategies can be adjusted accordingly to increase the quality of the sales. In retail businesses, a better experience can be provided through the analysis of the users’ emotional status. Therefore, researching emotion recognition in speech is a universal demand for the development of both e-commerce and retail businesses. However, the technology of the recognition of emotion in speech is not yet mature, which thereby motivates this study to develop and propose a new technology to recognize emotion in speech.

2. Previous Research

In the design of a speech emotion recognition system, the analysis and extraction of emotion features are challenging due to the rich variability of human emotion. In real life, people perceive and recognize the semantic information and emotional states in a speech. Therefore, choosing the appropriate features of speech decides the performance of emotion recognition. As different classifiers have different applicable scenarios, the selection of emotional features depends on which classifiers are used. Thus, researchers have studied the characteristics of emotion together with the classifiers in emotion recognition. According to the study conducted by Koolagudi [2], speech emotion features can be classified into excitation source features, prosodic features, vocal channel features (spectral features), and joint features.

2.1. Excitation Source Features

The excitation source feature arises from the excitation part of speech. According to the speech generation model, the excitation source signal of speech is obtained with the sound channel information. In this information, the linear prediction coefficient (LPC) can be calculated using the linear prediction analysis of speech, and then the excitation source signal is obtained with the LP filtering, which is usually expressed as the LP residual energy. In 1976, the Wakita first used the LP residual energy in speaker recognition, which indicated that the LP residual energy characterizes the paralinguistic information of speech [3]. In 2006, the features of the LP residual energy were used in the identification of speakers [4]. Since then, LP residuals have been applied to speech-emotion recognition. In 2015, Yegnanarayana and Gangashetty added echo features to recognize the differences in the LP residual energy in speech emotion and found that echo features were conducive to the characterization of emotion in segmented speech and were beneficial to improve the recognition rate [5]. In 2017, Gangamohan et al. achieved identification rates of 76 and 69% on the IITH-H and EMO-DB databases, respectively, by calculating the Kullback–Leibler (KL) distance of the excitation source signals [6]. In 2019, Pravena and Govind determined the intensity of the excitation source and the base frequency of the speech signal and calculated its statistical properties using the Gaussian Mixture Model (GMM), which further improved the efficiency of the identification of these excitation source features [7].

2.2. Prosodic Features

In speech, rhythmic information is included in the duration, intensity, and tone of the sound. Base sound, energy, duration, and others in the rhythmic information reflect the emotional state. By extracting the rhythmic information and conducting statistical analyses on it, the characteristics of emotion can thereby be determined. In 2015, Han constructed a multiple Elman network model based on prosody features to identify different emotions based on sensitive rhythmic segments. Recognizing the multi-classifier of emotion, the emotion recognition of the human ear was simulated with a recognition rate of 67.9% [8]. In 2018, Zhang et al. applied a non-linear dynamic model to analyze the emotional speech signals using the chaotic characteristics in the speech sound process and extracted the non-linear features of the emotional speech signal and the commonly used acoustic features (rhythmic features and the Mayer inversion coefficient (MFCC)), following which they characterized the chaotic properties of the emotional speech signals [9].

2.3. Spectral Features

Vocal channel features are also termed as spectral features or segmented features. In speech emotion recognition, speech is divided into segments in 20–30 ms, and the resonant peak and sub-band spectrum energy are analyzed in the frequency domain. The frequency transform usually adopts the discrete Fourier transform. To further enhance the recognition ability, the characteristic parameters are transformed into the inverted spectrum domain to characterize the emotional state. The MFCC, perceptual linear prediction coefficient (PLPC), and linear prediction inversion coefficient (LPCC) in the spectral domain are all used in speech recognition as spectral features for speech recognition. In 2017, Lotfian et al. investigated the emotion recognition of synthetic speech through MFCC analysis, and proposed a novel research scenario, namely, the emotion recognition of robot sounds [10]. In 2019, Jing et al. improved the recognition performance by 6% in the Chinese corpus of the Chinese document-level extractive summarization dataset (CDESD) [11].

2.4. Joint Features

The study of speech and emotion recognition includes feature extraction and emotion classification. Emotion classification models include the hidden Markov model (HMM), GMM, artificial neural network (ANN), and support vector machine (SVM), each of which possesses their advantages and disadvantages that are related to feature selection. Currently, feature extraction is the most concerned area of research. The excitation feature comes from the speech signal source, which is related to the speech excitation source by suppressing the sound channel excitation. According to the principle of digital speech generation, excitation sources are related to the semantic content of speech. These features are used in the recognition and classification of speech. Speech affective states are determined by the tones and semantic contents. Therefore, the excitation source features are not used in extracting the speech subsidiary information, such as tone and intonation and in emotion recognition. Prosodic features are derived from pronunciation characteristics, such as the duration, intensity, and tone of speech. According to the principle of linguistics, the prosodic features present the pronunciation characteristics of speech, and allow better recognition performances compared to the excitation source features. However, the classification of excitation source features, prosodic features, spectral features, and joint features may overestimate the characteristics of language pronunciations. Different languages have differences in pronunciation due to cultural differences. Thus, prosodic features are deemed to not be robust enough to recognize emotion using libraries or linguistic scenarios.

3. Design of the Speech Emotion Recognition Model

Emotion recognition is conducted through the analysis of characteristics in classified emotions. Common emotional features are used to determine a recognition rate and obtain the influencing factors on the features. Then, the spectrum of the emotional features is investigated to discriminate the features and find the distribution law of frequency under different emotions.

3.1. Multi-Scale Spectral Feature Extraction Model

According to the phonological psychoacoustic model, the human ear has different perceptions of speech in different frequencies, as emotional status can be presented in different frequencies. The signal enhancement method improves the representation of different emotional statuses at different frequencies. The spectrum transformation method is used to discriminate the different emotional statuses in the frequency domain. In the psychological acoustic model, the characteristics of the different features according to the emotional status were designed with a multi-scale spectral feature extraction algorithm.

3.2. Speech Emotion Recognition System

In speech emotion recognition, emotional features are closely related to emotion classifiers. Thus, model training and testing with multiple features are performed to improve the emotion recognition rate. Joint features are used for the multi-scale feature recognition in cross-language, and for the improvement of the feature extraction method and classifier design. In this study, we conducted theoretical research and experimental verification. Based on the investigation and analysis of the latest research in the related fields, the emotion features with the speech psychoacoustic model and mathematical statistical method were defined to discover the distribution pattern of the emotion features in the frequency domain. The spectrum features were extracted with speech digital processing to obtain the vectors of the features and design a machine learning method to establish a speech emotion recognition model. In this experiment, the model was verified for its performance through data collection, statistical analysis, and feedback.

3.3. Feature Analysis

Common features, spectrum features, and the emotion feature distribution law were all investigated in this study. For the analysis of the common features, openSMILE was used to extract the features. Here, openSMILE is Munich’s Open Source Media Large Feature Space Extraction (openSMILE) Toolkit. These features were then inputted to determine the classifier. The classifier was obtained with the SVM multi-classifier in the Interspeech2009 emotion recognition system to rank the contribution rate of the individual emotional features and obtain the common features affecting the emotional status according to the ranking. In the spectrum feature analysis, it has been assumed that the speech emotion signal contains information in languages (intonation, tone, and so on), and these features were acquired from the speech emotion status. Since the phonetic spectrogram represents the signal properties, the spectrum information of emotion was obtained in the frequency domain in the phonetic spectrogram. These features were marked on their spectra for a base period, MFCC envelope, and frame energy. Statistical analyses for the different frequency components was performed for feature extraction. The threshold was represented by the subband frequency range of T:
T = t i f i 0 , f i 1 , i = 1 , 2 , , m
where ti represents the ith subband, and fi0 and fi1 indicate the start and end frequency of the ith subband, respectively.

3.4. Feature Extraction

For the enhancement of these emotional features, the speech signal was generated using the linear filtering of the excitation source features with sound channel filtering. If the lattice-type excitation source attenuated by 12 dB in the signal amplitude, the labial radiation subsequently increases by 6 dB. Therefore, when the speech is spoken, a 6dB decay occurs in the entire amplitude, leading to an increased frequency by about 1000 Hz, and thereby cause the channel information to decay in the high-frequency region. Therefore, to prevent the loss of emotional information, high-frequency channel information can be enhanced by pre-weighted filtering. Pre-aggravating filtering aggravates the spectrum information in high-frequency regions.
For speech signals, pre-aggravation is performed using a first-order difference equation (Equation (2)):
y ( n ) = s ( n ) α s ( n 1 )
where α is a constraint parameter with a value of 0 to 1. The specific value of α needs to be obtained through experiments for the pre-aggravating y(n).
As the emotional status in speech is mainly reflected in the frequency difference, it is therefore necessary to convert the signal in the time domain into the frequency domain. In this research, the common discrete Fourier transform was adopted to obtain the speech signal in the frequency domain. As the speech signal exhibits long-time and non-stationary characteristics, it is not conducive to feature analysis. However, as the voice has short-time stationary characteristics, frame segmentation is required. We used a frame length of 20 ms and a frame displacement of 10 ms, respectively. In order to obtain the frame level signal in each frame, the Hamming window function is used, as shown Equation (3):
w ( n ) = 0.54 0.45 cos ( 2 π n / ( L 1 ) ) , 0 n L 0 , o t h e r
where L indicates the window length.
The window to the pre-increased signal is expressed as
y w ( n ) = y ( n ) w ( n )
The Discrete Fourier transform was then used to obtain the signal in the frequency domain, as shown in Equation (5).
Y F ( k ) = n = 0 N 1 y w ( n ) e j 2 π N k n
The frequency signal Y was obtained using the Fourier transform in the whole frequency bandwidth. According to the previous analysis, a different emotional status was presented in the different frequency bands. To highlight and characterize these emotional features, molecular bands were used, while the distribution law in the sub-bands was derived from the threshold T of the feature analysis. According to the distribution law, YF(i) was obtained with TFDivided. The subband frequency signal Y was obtained by performing the Fourier transformation F(i) to transform the signal into the temporal subband signal yt(i). For a detailed representation of the signal frequency, the sine wave S in the subband was used with the sinusoidal modeling of the time-domain signal s(i, j) to extract the amplitude of each sine wave and obtain the final amplitude feature A(i, j). The detailed algorithm calculation process is shown in Figure 1.
The frequency signal Y was determined based on the statistical threshold of each subband obtained from the feature analysis T = t i f i 0 , f i 1 , i = 1 , 2 , , m , and was divided into the frequency subband signal YF(i). For the frequency subband signal YF(i), the Fourier transform was again used to obtain the temporal subband signal yt(i, n). The inverse Fourier transform was performed with Equation (6).
y t ( i , n ) = k = 0 N 1 Y F ( i , k ) e j 2 π N k n
Sinusoidal modeling of the subband signal in the time domain was used to obtain the sine signal Ss(i, j), whose model is expressed in Equation (7):
s s ( i , n ) = j = 1 L A j cos ( 2 π f j n f s + θ j )
Where L represents the number of sinusoidal components, and fs represents the signal sampling rate, respectively.
The amplitude of each sine wave component was extracted to create a feature matrix A(i, j), with the j-th magnitude feature of the i-th subband in a dimension of m × L, where m represents the number of subbands, and L represents the number of sine wave components of each subband, respectively.

3.5. Emotional Recognition

In the classifier design, the emotion recognition corpus is generally small, and the SVM can thereby be used to obtain a better recognition with a small amount of data. Thus, the multiclass classifier design of the SVM was adopted in this study, and the kernel function was chosen as the radial basis function. The SVM model was trained by inputting features and was subsequently assessed for emotion classification. For training and testing, the training set, validation set, and test set were all selected at a ratio of 6:2:2. The final test results from the fuzzy matrix method were evaluated for the system performance based on the recognition rate.

4. Conclusions

In the context of AI, a new method for speech emotion recognition was proposed using spectrum feature analysis and a multi-scale spectrum feature extraction. The proposed method was validated to be practical and provided an optimized solution for the research and development of speech emotion recognition. In the proposed method, the overall information on the emotional status and characteristics was used to improve the accuracy of emotion recognition. In emotion recognition, the characteristics of emotional statuses were analyzed with different frequency components to define the distribution law of the emotional features on the frequency spectrum. The differences in the frequency components were also found for different emotions. Thus, multi-scale features could be distinguished between different emotions more effectively in the future.

Author Contributions

Conceptualization and methodology of this manuscript were proposed by H.K. Software and experiment were conducted by F.L. M.S. worked out the writing—original draft preparation and writing—review. All authors have read and agreed to the published version of the manuscript.

Funding

This research was supported by the Hainan Provincial Natural Science Foundation of China (No. 2021J011169, 2022J011224, 2020J01435) and the Ningde Normal University for the service local action special plan (No. 2020ZX505).

Institutional Review Board Statement

Not applicable.

Informed Consent Statement

Not applicable.

Data Availability Statement

No new data were created.

Conflicts of Interest

The authors declare no conflict of interest.

References

  1. Swain, M.; Routray, A.; Kabisatpathy, P. Databases, features and classifiers for speech emotion recognition: A review. Int. J. Speech Technol. 2018, 21, 93–120. [Google Scholar] [CrossRef]
  2. Koolagudi, S.G.; Rao, K.S. Emotion recognition from speech: A review. Int. J. Speech Technol. 2012, 15, 99–117. [Google Scholar] [CrossRef]
  3. Wakita, H. Residual energy of linear prediction to vowel and speaker recognition. IEEE Trans. Audio Speech Signal Process. 1976, 24, 270–271. [Google Scholar] [CrossRef]
  4. Prasanna, S.R.M.; Gupta, C.S.; Yegnanarayana, B. Extraction of speaker-specific excitation information from linear prediction residual of speech. Speech Commun. 2006, 48, 1243–1261. [Google Scholar] [CrossRef]
  5. Yegnanarayana, B.; Gangashetty, S.V. Epoch-based analysis of speech signals. Sadhana 2015, 36, 651–697. [Google Scholar] [CrossRef] [Green Version]
  6. Perez-Espinosa, H.; Gutierrez-Serafin, B.; Martinez-Miranda, J.; Espinosa-Curiel, I.E. Automatic children’s personality assessment from emotional speech. Expert Syst. Appl. 2022, 187, 115885. [Google Scholar] [CrossRef]
  7. Pravena, D.; Govind, D. Significance of incorporating excitation source parameters for improved emotion recognition from speech and electroglottographic signals. Int. J. Speech Technol. 2019, 4, 787–797. [Google Scholar] [CrossRef]
  8. Wenjing, H.; Haifeng, L. Research on Speech and Emotion Recognition Method Based on Prosodic Paragraph. J. Tsinghua Univ. (Nat. Sci. Ed.) 2015, s1, 1363–1368. [Google Scholar]
  9. Ying, S.; Hui, Y.; Xueying, Z. Based on Chaos Characteristics. J. Tianjin Univ. (Nat. Sci. Eng. Technol. Ed.) 2018, 48, 681–685. [Google Scholar]
  10. Lotfian, R.; Busso, C. Emotion recognition using synthetic speech as neutral reference. In Proceedings of the IEEE International Conference on Acoustics, Speech and Signal Processing, New Orleans, LA, USA, 5–9 March 2017. [Google Scholar]
  11. Jing, S.; Mao, X.; Chen, L. Prominence features: Effective emotional features for speech emotion recognition. Digit. Signal Process. 2019, 72, 216–231. [Google Scholar] [CrossRef]
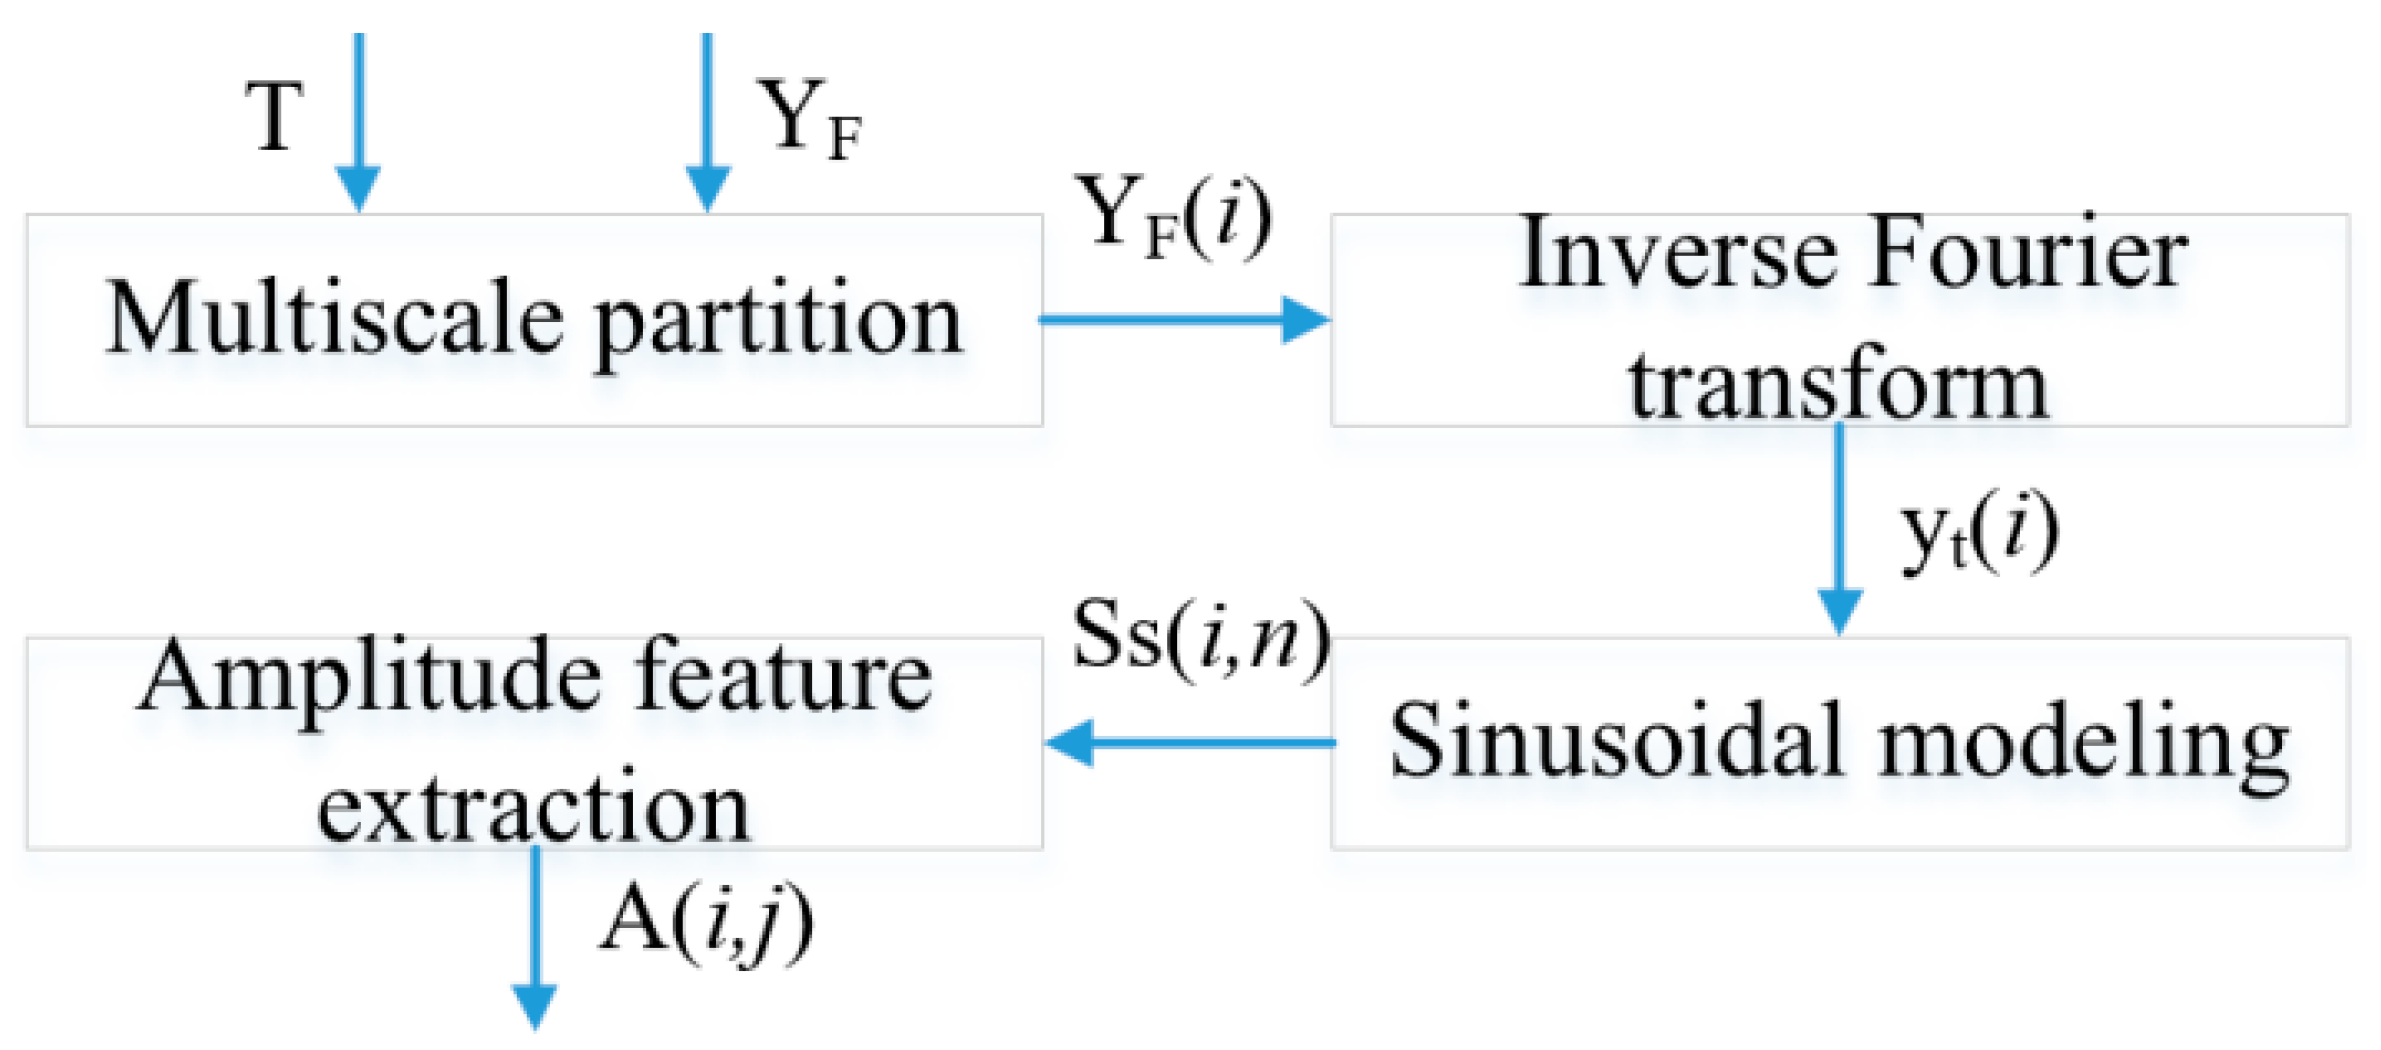
Figure 1. Route of the extract of the amplitude of each sine wave.
Engproc 38 00086 g001
Disclaimer/Publisher’s Note: The statements, opinions and data contained in all publications are solely those of the individual author(s) and contributor(s) and not of MDPI and/or the editor(s). MDPI and/or the editor(s) disclaim responsibility for any injury to people or property resulting from any ideas, methods, instructions or products referred to in the content.