1. Introduction
Mass transfer through hollow fiber membranes is a membrane-based separation process for gas mixtures and the removal of environmental pollutants, such as carbon dioxide. The difference between the partial pressures of the components is counted as one of the driving forces of mass transfer across the membrane. The hollow fiber membrane process is geometrically described as a solid, thick-walled, concentric anisotropic roll. A porous substrate and non-porous selective layers are the main distinct layers in this type of membrane [
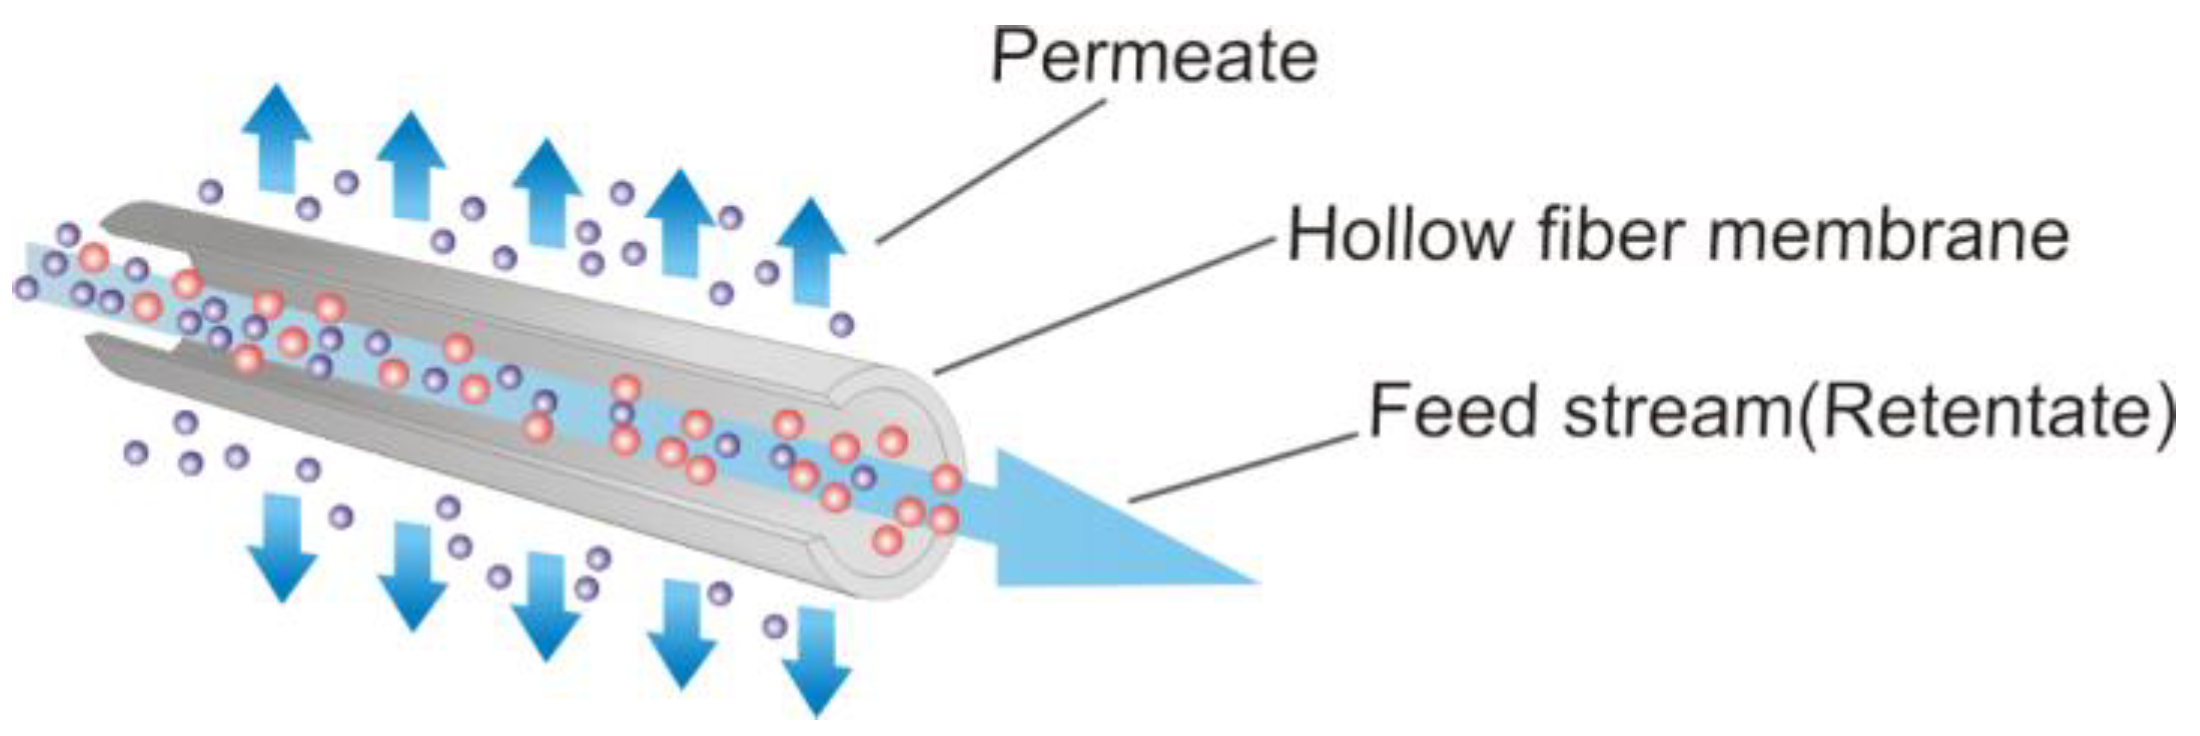
1]. The separation process is performed in the following steps: The initial feed of gas mixtures is contacted by the selective membrane surface. This mixture is in direct contact with the membrane surface, and the passing component is separated on the other side of the membrane. The vapor-phase substances passing through the membrane are called permeates, and the concentrated mixture coming from the feed stream is called retentate. Both retentate and permeate can be chosen as target products. The principle of separation of mixtures using hollow fiber membranes is presented in
Figure 1.
The change in pressure can be indicated as the driving force for the membrane separation process. The substance in the initial raw mixture, the volume of which exceeds the pores of the membrane surface, is captured on the inlet side of the membrane and turns into a concentrated solution. The hollow fiber filtration is executed at ambient temperature and moderate pressure, which ensures low energy consumption. In addition, this type of process does not require heating or additional chemicals to achieve the purposes of separation, concentration, partition, cleaning, and classification. Fractions, colloids, bacteria, and macromolecular organics containing water can be effectively purified using membrane techniques [
1].
Hollow fiber membrane process mechanisms involve various steps that must be closely monitored to ensure optimal performance. Initially, the fiber membrane is manufactured to have a porous structure with precise diameters and thicknesses, allowing for the separation of different substances [
1].
It is crucial to maintain proper flow rates and pressures to optimize the separations. Fouling or clogging of the membrane can occur due to the deposition of impurities or organic materials, leading to reduced permeate flow and decreased efficiency. In such cases, cleaning protocols must be implemented to remove the accumulated materials and restore the productivity of the membrane. During the filtration process, the feed solution is passed through the interior of the hollow fibers, while a vacuum is applied outside the fibers to draw the permeate through the walls of the membrane. The retained and/or permeated components across the membrane are dictated according to the shape and dimension of the pores in the membrane [
2].
2. Background
According to the theory of facilitated transport mechanism, the mixture is transferred from one boundary to the other in two various methods: pure diffusion in the unreacted state and diffusion in the form of complexes. Once on the underside of the membrane, the reverse reaction occurs, and the mixture is released. Consequently, following Fick’s law, the diffusion mechanism for each component and the resulting equation of total flux is the representation of the facilitated transport process [
3].
From the point of view of the facilitated transport, the facilitation factor also has to be considered, and it is a direct measure of the reaction effect on the transport. The facilitation factor can be calculated as the relation between the total flux of component i through the membrane in the x-direction and the flux expressed by the pure diffusion mechanism:
where A—the mixture; C—the carrier; AC—the carrier complex species;
—the diffusivity of the mixture;
—the concentration of component A;
—diffusion coefficient of AC; and
—concentration of AC.
The separation factor
is calculated using the concentrations of each component in two different phases. It is defined as the ratio of the equilibrium concentrations of the two components in the two phases:
where y and x identify the gas content in the permeate and feed sides, respectively.
In order to for the permeation of component i to predominantly occur, the separation factor must be higher than the unity. If α = 1, then both components have equal affinity for both phases, and there is no separation preference. These compositions are described using mole, mass, or volumetric fractions. The separation factor is an important parameter in designing separation processes such as distillation, liquid–liquid extraction, membrane processes, and chromatography.
Another factor influencing the separation process is the pressure ratio (
). This ratio helps to determine the efficiency of a membrane separation process by measuring the amount of pressure required to achieve the desired level of separation:
where
and
are the feed and permeate pressure, respectively (in bar).
In the facilitated transport mechanism, the permeance of component
i can often be expressed as the following [
3,
4]:
where the total permeate flow
(ml s
−1) is measured experimentally.
and
are the molar fraction of the component j and permeating components i on the permeate side, respectively.
,
and
are the partial pressures (cm Hg
−1) of component i in the feed, retentate, and permeate, respectively.
,
are the average partial pressures of feed and retentate. Permeance is denoted in GPU (GPU = 3.35 × 10
−10 mol m
−2 s
−1 Pa
−1).
3. Modeling and Simulation of Membrane Process
Modeling and simulation are used for many purposes, including engineering, science, transportation economics, and finance. They are used to investigate complex systems that are arduous or demanding to experiment in real processes. These techniques use data from real-process experiments or observations to create models that can simulate the behavior of complex systems with high precision [
5,
6].
After considering the non-ideal gas behavior, the identification of the transport of component
i through the membrane is defined by Reference [
7].
where
—the fugacity of component i in the feed stream;
—the fugacity of component i in the permeate side. The saturation vapor pressure (
) and the fugacity of components (
) are obtained from the Antoine equation and Soave–Redlich–Kwong model, respectively. Q is a variable quantity depending on membrane surface area, thickness, and permeability. The average fugacity of components depends on the tentative parameters, namely gas composition
, pressure P, and the effect of real gas behavior
on both the feed and permeate sides:
In this work, we applied the experimental results for the carbon capture process by hollow fiber membrane accounted in the research conducted by Saravanan et al. [
4]. These experimental data were combined into a model that describes the mass transfer across the membrane as a function of the fugacity of the components and conditions of experiments. According to Schuldt et al. (2018), the partial fluxes can be determined as a polynomial function of the fugacity of the species, which means that the permeance changes depending on this parameter [
8]. In summary, considering the different semi-empirical models described in the references, we corrected the CO
2 permeability data to a justification that calculated depending on the fugacity of CO
2:
With regard to residue mixture, the permeance of this component can be described as a function of the fugacities of CO
2 and N
2:
We are assuming that only CO
2 and N
2 permeate across the membrane surface, with the other components remaining on the retentate side of the substrate and not passing through. Using the ACM software, experimental permeation data from Saranan et al. [
4] were fitted to Equations (6)–(9) to provide the predicted parameters listed in
Table 1. Operating conditions are assumed to be at 1.7 bar supply pressure, 35 °C temperature, and fully wet conditions.
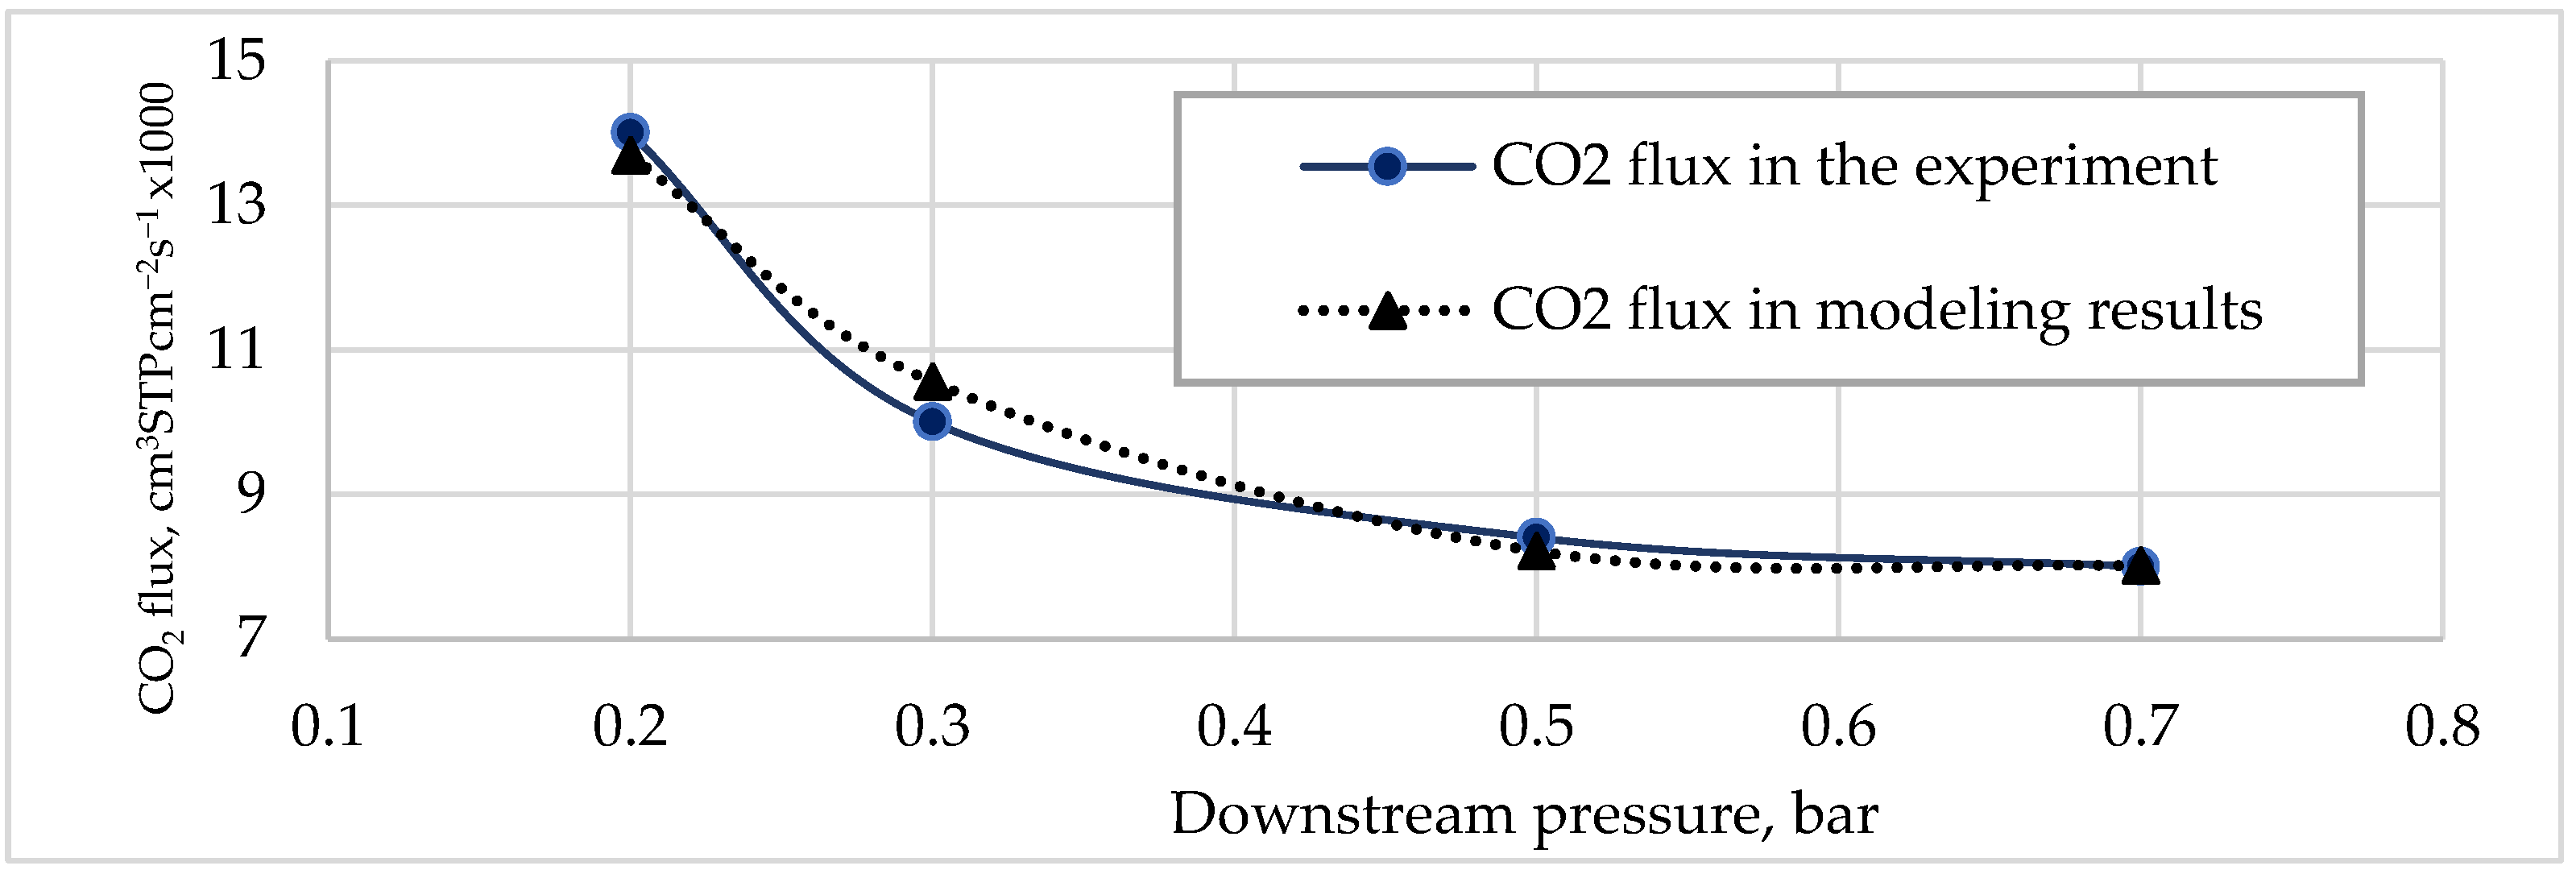
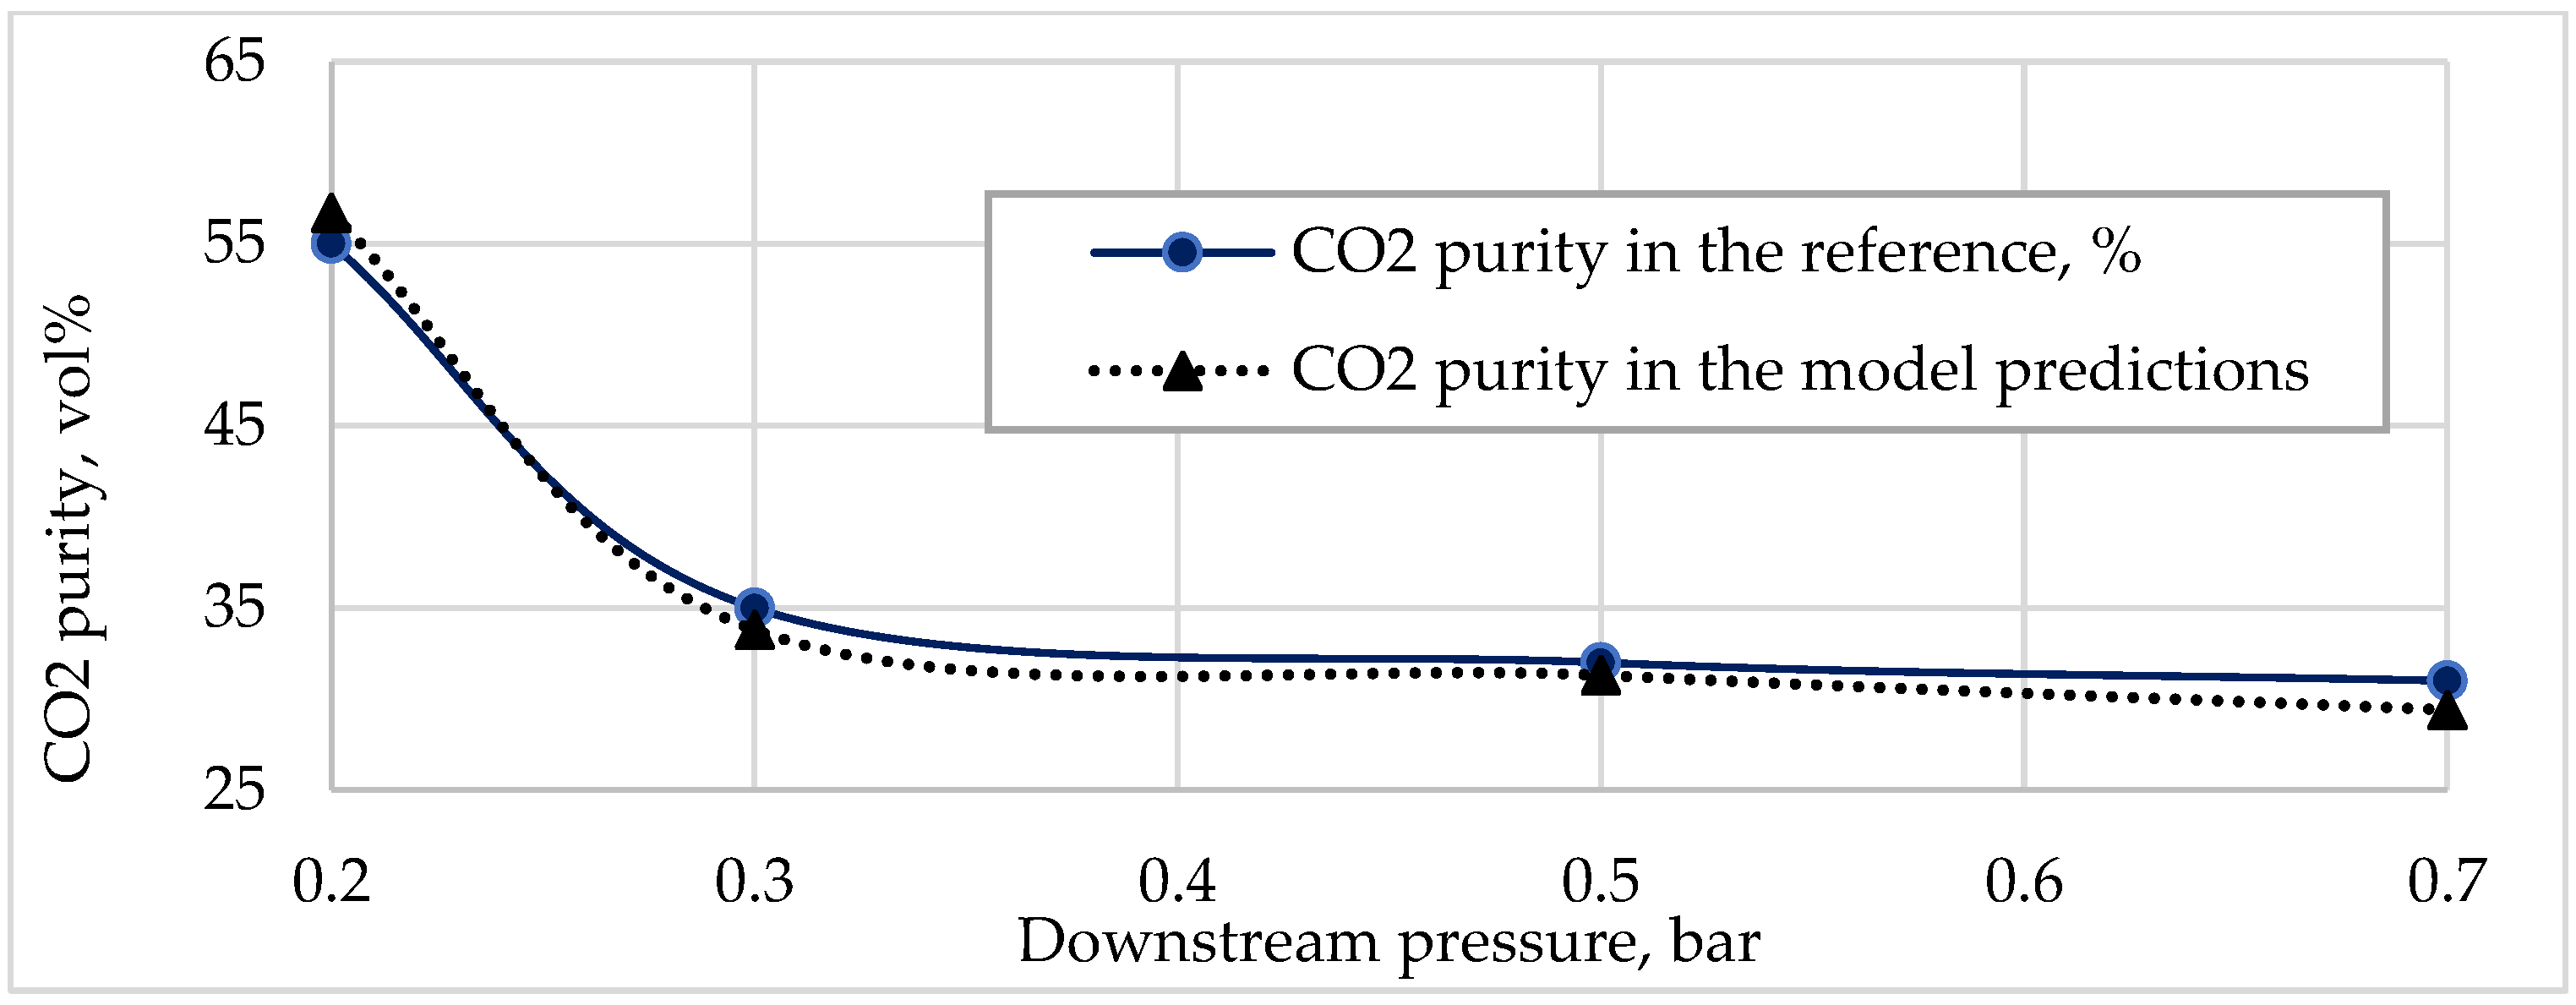
Figure 2 and
Figure 3 illustrate a comparison of experimental data [
4] and model data fitting (Equations (6)–(9)).
A mathematical model of a hollow-fiber membrane module was modified from the study of Chu et al. (2019) and included the aforementioned membrane performance model in order to approximate the behavior of a hollow-fiber module at an industrial scale [
9]. The following factors were considered while developing steady-state mass and energy balances: (i) plug flow for the inlet mixture, (ii) perfect mixing in the permeation, (iii) a minimal loss of temperature, (iv) minimal polarizing implications, and (v) a slight pressure drop throughout the module. A discretization approach was used to divide the membrane module into a number of cells for computation reasons.
These results were obtained for an inlet flow pressure of 1.7 bar and a temperature of 30 °C, but it was observed that the difference between these results increased depending on the pressure of inlet stream, and all other substances in permeate were assumed to be N2.
Ordinary differential equations are used to express how the composition and temperature of the retentate in each cell change dynamically. The temperature on the retentate and permeate sides in each cell is considered to be the same because, in general, heat resistances through the membrane are insignificant. The total molar balance is algebraic since it is assumed that the molar holdup in each cell (M
R) is constant:
where F
R,n—molar flowrate of the retentate from cell n (kmol h
−1); F
P,n—molar flowrate of permeate from cell n (kmol h
−1); h
R,n—molar enthalpy of retentate in cell n (GJ kmol
−1); H
P,n—molar enthalpy of permeate leaving cell n (GJ kmol
−1);
—molar fraction of component i in the retentate in cell n; and
—mole fraction of component i in the permeate leaving cell n. The permeate flowrate is calculated using the membrane area (A
mem) multiplied by the sum of the two component fluxes, and the permeate composition is determined by the partial flux to total flux ratio (Equation (14)):
The flux of component i in each cell is calculated using the following equation:
The retentate temperature is calculated from the determined enthalpy (h
R,n) and composition (Z
R,n) of the retentate using the physical characteristics of the medium [
10].
4. Conclusions
The membrane process in this work is simulated using the ACM program. In order to calculate the composition and temperature of the retentate and permeate streams, the material and energy balances are simultaneously solved. To do this, the thermodynamic properties that are a function of pressure and composition need to be computed in each cell using subroutines specific to ACM software. Thus, properties such as fugacity, vapor pressure, density, heat capacity, and liquid and vapor enthalpies are calculated as variables distributed along the membrane module. In addition, the membrane permeances are also calculated in each cell using the equations of the proposed model as a function of the fugacity of species and pressure. The differential and algebraic equations for each cell and each module are incorporated into the ACM program. In the case of analyzed modules in the study, the flux and purity of carbon dioxide on the permeate side are approximately 700 NL m−2h−1 and 55 percent, respectively. These values are suitable for use in simulation purposes, and the resulting flux corresponds to the experimental data. It was observed that the difference between these results increased depending on whether the inlet pressure increased.


