Abstract
Cerium oxide nanoparticles (CeNPs) are used in chemical mechanical polishing/planarization, corrosion protection, solar cells, fuel oxidation catalysis, automotive exhaust treatment, and sensing. However, their synthesis process increases the likelihood of exposure, potential health effects, and ecological implications. Consequently, it is important to synthesize CeNPs in an environmentally friendly and affordable way to create a better structure. This work discusses the numerous structural properties of CeNPs and is solely concerned with their economical hydrothermal production. To comprehend the shape, FE-SEM was used, which shows the granular-like structure. The elastic characteristics of the material, like Bulk Modulus, was 177 GPa, Sher Modulus was 78 GPa, Poisson’s ratio was 0.32, and some other properties were also determined by using the FTIR spectrum, which also revealed numerous functional groups. The CeO2 XRD pattern reveals a cubic structure of the space group Fm3m with a density of 6.74 gmcm−3, a volume of 158.08 × 10⁶ pm3, a crystallite size of 18.66 nm, a lattice strain of 0.0041, and many other estimated structural characteristics. Rietveld refinement was also performed for the refined parameters that suggest the high quality of structural parameters like R-factors, wR-factor (Rw), and Chi-squared (χ2) and for designing the crystal structure of cerium oxide nanoparticles. When examining the composition and nature of bonding materials, the structural features are of the utmost significance, as they offer a variety of information regarding the subject material’s general qualities. Excellent characteristics of nanomaterials include high chemical and physical stability, low density, and a big surface area. Nanomaterials are preferred options for the creation of brand-new, functioning membranes because of their superior qualities.
1. Introduction
The development of nanoparticle-based medication delivery systems and vaccines began in the latter half of the 1960s [1] when scientists focused on smaller delivery technologies. Since that time, the use of nanomaterials has led to significant advancements in the detection and treatment of several illnesses [2,3]. The periodic table’s category of lanthanide metals includes cerium [4]. Cerium’s oxide form has a fluorite structure. The fluorite structure with oxygen deficits is retained in the nanoscale form of cerium oxide nanoparticles.
For various applications, including electrical, electronic, catalytic, adsorption, optical, electrochemical, batteries, functional materials, energy storage, magnetic data storage, and sensing properties, cerium oxide with different valence states and various crystalline structures have been investigated [5,6,7,8,9]. Therefore, it is necessary to decrease the particle size and increase the active surface area of nanomaterials in order to improve various attributes to fulfill the growing demands for diverse applications. Reduction in particle size improves non-conductivity, the material’s electrical, sensing, and catalytic characteristics [10,11,12]. From room temperature up to its melting point (2700 °C), ceria (CeO2), a cubic fluorite-type structured ceramic material, exhibits no known crystallographic change [13]. Because agglomerated nanoparticles result in uneven mixing and poor sintering, the majority of applications call for the use of non-agglomerated nanoparticles. Due to their distinctive physical and chemical characteristics, cerium oxide nanoparticles (CeO2 NPs) have been used extensively in recent applications for catalysis, energy storage, optical sensors, and biomedicine [14,15].
Furthermore, compared to bulk CeO2 raw materials, the controlled production of CeO2-based nanomaterials is more focused on redox reactivity and oxygen transport properties [16]. Moreover, CeO2’s most notable activity is derived from oxygen’s surface electrons, which have the potential to convert ceric ions () into cerous ions (). As a result, the redox characteristics (/) and oxygen exchange are greatly enhanced because of their nanoscale dimension and activity. As for additional preparation for their synthesis approach, Co-precipitation [17], sol-gel [18], solvothermal [19], sonochemical [20], electrochemical approach [21], sputtering [22], arc-discharge [23], and solvothermal [20] have all been used to produce nanoparticles with the desired properties. Based on this, we describe the synthesis and properties of cerium nanoparticles made using the hydrothermal method, which is a simple method for forming nanocrystals from aqueous solutions at low temperatures and high vapor pressures in an autoclave lined with Teflon. XRD, Rietveld refinement, FE-SEM, AFM, FTIR, and Ultra-Voilet visible spectroscopy were also performed for a thorough understanding of the structure and morphology of cerium oxide.
2. Materials and Methods
We created nanoparticles using hydrothermal synthesis, which involves dissolving enough cerium (III) nitrate hexahydrate (Ce (NO3)3·6H2O) in distilled water for six hours to create a homogenous solution. At the same time, 1.0 M of NaOH was completely dissolved in distilled water in a separate beaker. To create a fully homogeneous solution, NaOH was then gradually added dropwise to the initial solution at room temperature until the pH reached 10–11. The entire mixture was then put into a 100 mL Teflon-lined autoclave and heated to 170 °C for 6 h. A small amount of pale-yellow precipitate was produced after the autoclave was moved outside and allowed to cool at room temperature; this precipitate was then maintained in a hot oven for drying. Then, annealing at 550 °C and allowing the powder to cool at ambient temperature were both carried out. As a result, powdered CeO2 was created, and the chemical Equations (1) and (2) below reflect this. Additionally, a systematic diagram was given to explain the synthesis process shown in Figure 1.
Ce (NO3)3(aq)) + 3NaOH → Ce (OH)3(s) + 3NaNO3 (aq)
4 Ce (OH)3(s) + O2 → 4CeO2(s) + 6H2O(l)
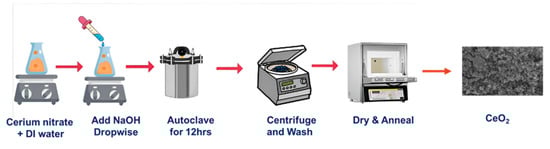
Figure 1.
Synthesis diagram of cerium oxide.
3. Results and Discussion
3.1. FE-SEM Analysis
For a better understanding of the structure and morphology, field emission scanning electron microscopy (FE-SEM) was used (the purity and form of the nanoparticles are undeniably crucial factors to consider while studying the interactions between nanomaterials). The results are then reported in Figure 2a. From this figure we can see that almost all the nanoparticles exhibited a similar shape. Figure 2b shows the micrograph captured by the FE-SEM at a resolution of 100 nm, which reveals the surface morphology. The particle distribution graph was used to determine the average particle size, which was determined to be 206.68 nm and seems to be a great surface area for many types of different applications.
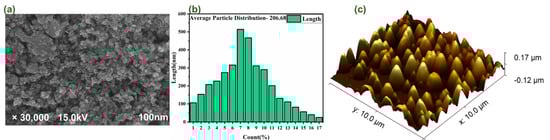
Figure 2.
(a) shows the FE-SEM micrograph in the nanometer range; (b) shows the particle size distribution graph in nm; (c) shows the AFM micrograph in 3D view.
3.2. AFM Analysis
Atomic force microscopy analysis is the best choice for quantitatively detecting the nanometric dimensional surface roughness and for viewing the surface nano-texture of the deposited film. As seen in the AFM pictures in Figure 2c, the surface of the as-grown CeO2 films has a granular texture similar to that observed in the SEM studies. Yet, because of tip convolution, the crystallites appear larger in the AFM images. The SEM images demonstrate that the edges of the minute spaces between the grains appear less sharp for the same reason. The “valley” region is relatively smooth in comparison to the “hill” region, which is composed of many crystal-like formations with certain orientations. As per obtained calculated value RMS (root mean square) roughness was 52 nm, its mean roughness was 42.34, and its average was 128.34 nm.
3.3. XRD Analysis
The crystalline phase of the produced samples was examined using powder X-ray diffraction, a non-destructive analytical technique for distinguishing the various crystalline phases of binary metal oxide nanoparticles. It is captured using a powder diffractometer and Cu-K radiations with a 2-theta range of 20–80° shown in Figure 3a. The phases of cerium oxide were discovered among all the recorded peaks from the XRD pattern that matches with JCPDS no. 01-078-0694, and it is obvious that all the diffraction peaks precisely correlate with the cubic phase of binary metal oxide. Additionally, it displays the superb crystallinity of the created nanoparticles and their single phase of cubic fluorite crystal structure in the (Fm3m) space group. Different 2θ peaks were observed at 28.587, 33.128, 47.553, 56.427, 59.179, 69.524, 76.827, and 79.207, which were attributed to the (111), (200), (220), (311), (222), (400), (331), and (420) miller indices corresponding to the cubic structure of CeO2. X-ray diffraction was used to determine the crystal and phase structure of the cerium oxide.
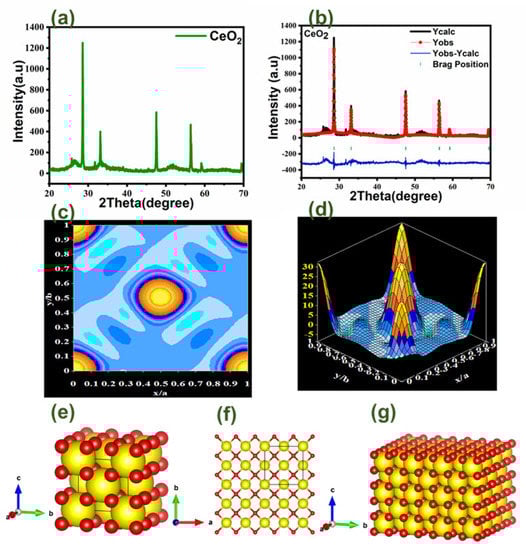
Figure 3.
(a) shows the XRD graph of CeO2; (b) shows the Rietveld refinement graph; (c) shows the electron density mapping in 2D counter form; (d) shows electron density mapping in 3D form; (e) shows the crystal structure of CeO2 in the single unit cell; (f) shows the crystal structure of CeO2 single layer; (g) shows the crystal structure in a multilayer structure.
3.4. Reitveld Refinement
The Full Prof Suite program and Vista software were used to refine CeO2 according to the Rietveld method. The refinement plot is depicted in Figure 3b, and the refined parameters indicate that CeO2 has high-quality structural parameters like Chi-square (χ2) and R-F Factor. Other parameters were also obtained, including volume density, space group, lattice/grain size, and many others, and these were calculated by refinement and various formulas, as listed in Table 1. The mapping of the electron density, shown in Figure 3c,d explains where cerium, oxygen, and electrons are located. In a straightforward manner, the findings of an X-ray structural determination are electron density maps. The maps reflect the degree to which the structural model fits the empirically obtained data. The crystal structure seen in Figure 3e–g was created using Vista software and was derived from XRD data. We can now show the cerium oxide crystal structure in Figure 3e. For a better understanding of the atomic layer structure locations, we will demonstrate a single layer of cerium oxide in Figure 3f. In order to better grasp the entire crystal structure, the multilayer cubical/slab structure of cerium oxide was finally depicted in Figure 3g. Figures depicting CeO2 unit cell structures at various angles indicate that CeO2 has a significant volume and density in addition to having 182 atoms, 304 bonds, and 38 polyhedral.

Table 1.
Calculated parameters from XRD data and Rietveld Refinement.
3.5. Optical Analysis
The infrared spectrum (FTIR) which showed in Figure 4a of the produced CeO2 nanoparticles was in the 500–4000 cm−1 wavenumber region, which allows for the identification of the chemical bonds and functional groups in the molecule. The O-H stretching vibration in OH groups is thought to be the cause of the significant bandwidth at 3736.52 cm−1. The C-H stretching-induced bending vibration is responsible for the absorption peak at 1320.10 cm1. The stretching vibration of Ce-O is what causes the strong band at 608.52 cm−1 [24,25]. The asymmetric stretching vibration of CO2, the bending vibration of CO-23, and the stretching vibration of C-O-O, respectively, have been identified as the sources of the bands at around 2319.01, 2919.83, 817, and 1013 cm−1. Further, we calculated some of the elastic properties of the material by using its wavelength by estimating the formulas of Poisson’s ratio, Bulk modulus, and Shear modulus, and the obtained values are listed in Table 2.
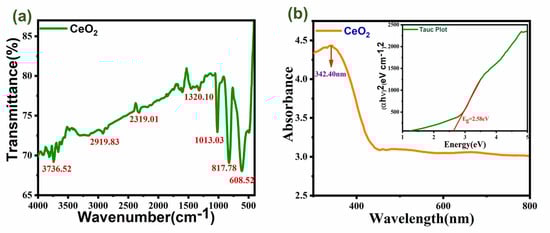
Figure 4.
(a) shows the FTIR graph; (b) shows the UV–visible graph of CeO2 with a band gap plot.
Table 2.
Calculated elastic properties of cerium oxide from the wavelength were obtained from FTIR.
Understanding the electrical nature of the material’s optical band gap may be aided by a spectrum analysis of UV–visible absorption. From corresponding electronic changes inside the sample, absorption in the near UV range results. Figure 4b displays the CeO2 nanoparticles’ UV–visible absorption spectra. The CeO2 nanoparticles as-made have a bandgap energy of 2.58 eV, which corresponds to the high absorption band at a low wavelength of approximately 342.40 nm. This demonstrates that the sizes and morphologies of CeO2 affect the absorption positions. Band gap energy and CeO2’s capacity for UV absorption is connected. The band gap of any system can be accurately predicted using the UV absorption edge). Using Tauc’s figure, the value of the optical energy band gap for CeO2 was examined. To obtain the optical band gap, Tauc’s relation from Equation (3) was employed (Eg) [26].
α = [αo(hν-Eg) n]/hν
Here, the photon energy (hν), the absorbance coefficient (α), the characteristic parameter (αo), the Planck’s constant (h), and the power factor (n) are all defined. Depending on the nature of the transition, n may take on different values. Here, the value of n is taken to be ½ and the band gap Eg for CeO2 is calculated to be 2.58 eV.
4. Conclusions
In this work, the rare earth metal cerium oxide was synthesized through one-step hydrothermal synthesis using cerium nitrate (III) hexahydrate as a starting precursor. In order to understand the structure of CeO2 nanoparticles, X-ray diffraction (XRD) characterization was carried out. This revealed a well-shaped cubic structure and many more parameters that were computed using the Xpert Highscore and Fullprof tools by performing Rietveld refinement. The average particle size of 206.68 nm was determined using FE-SEM to provide a thorough examination of the structural morphology. AFM was also used to measure the roughness of the surface. While UV–visible spectroscopy measured the wavelength of 342.40 nm and discovered the band gap of 2.58 eV, FTIR proved the presence of the functional groups and also some of the elastic properties of the nanomaterial for a better understanding of its strength and ability. While UV–visible spectroscopy measured the wavelength of 342.40 nm and discovered the band gap of 2.58 eV, FTIR proved the presence of the functional groups. This report is exclusively concerned with the structural and morphological characteristics of cerium oxide nanoparticles. It shows that cerium oxide has an average particle distribution and a high specific surface area, both of which are crucial for the adsorption process as well as for heterogeneous catalysis, the detection of molecules in a gas environment, biological applications, and many other processes. CeO2 nanoparticles made with this low-cost method are appropriate for use in a variety of applications, including industrial, vehicle, and sensor ones.
Author Contributions
Visualization, writing, graphics, and characterization, S.S.; graphical abstract and writing, P.K.P.; formal analysis and visualization, N.K.P. All authors have read and agreed to the published version of the manuscript.
Funding
This research received no external funding.
Institutional Review Board Statement
Not applicable.
Informed Consent Statement
Not applicable.
Data Availability Statement
Data will be available on demand.
Acknowledgments
The authors would like to thank Mohammad Abu Sazz (BHU) for helping us with the research synthesis. We would also like to thank the Physics Department and Chemistry Department of the University of Lucknow for XRD, UV–visible spectroscopy, and FTIR characterization. Thanks to, BSIP Lucknow, for the FE-SEM characterization. And lastly, thank you Aviral Srivastava and Astha Srivastava for helping us in the result analysis section.
Conflicts of Interest
The authors declare no conflict of interest.
References
- Kreuter, J. Nanoparticles—A historical perspective. Int. J. Pharm. 2007, 331, 1–10. [Google Scholar] [CrossRef] [PubMed]
- Attia, M.S.; Al-Radadi, N.S. Nano optical sensor binuclear Pt-2-pyrazine carboxylic acid -bipyridine for enhancement of the efficiency of a 3-nitrotyrosine biomarker for early diagnosis of liver cirrhosis with minimal hepatic encephalopathy. Biosens. Bioelectron. 2016, 86, 406–412. [Google Scholar] [CrossRef]
- Panja, S.; Chaudhuri, I.; Khanra, K.; Bhattacharyya, N. Biological application of green silver nanoparticle synthesized from leaf extract of Rauvolfia serpentina Benth. Asian Pac. J. Trop. Dis. 2016, 6, 549–556. [Google Scholar] [CrossRef]
- Weeks, M.E. The discovery of the elements. XVI. The rare earth elements. J. Chem. Educ. 1932, 9, 1751. [Google Scholar] [CrossRef]
- Faisal, M.; Khan, S.B.; Rahman, M.M.; Jamal, A.; Akhtar, K.; Abdullah, M.M. Role of ZnO-CeO2 Nanostructures as a Photo-catalyst and Chemi-sensor. J. Mater. Sci. Technol. 2011, 27, 594. [Google Scholar] [CrossRef]
- Faisal, M.; Khan, S.; Rahman, M.; Jamal, A. Green material: Ecological importance of imperative and sensitive chemi-sensor based on Ag/Ag2O3/ZnO composite nanorods. Chem. Engineer. J. 2011, 173, 178. [Google Scholar] [CrossRef]
- Khan, S.; Faisal, M.; Rahman, M.; Jamal, A. Smart chemical sensor and active photo-catalyst for environmental pollutants. Sci. Tot. Environ. 2011, 409, 2987. [Google Scholar] [CrossRef]
- Farahmandjou, M.; Zarinkamar, M.; Firoozabadi, T. Synthesis of Cerium Oxide (CeO2) nanoparticles using simple CO-precipitation method. Rev. Mex. De Fis. 2016, 62, 496–499. [Google Scholar]
- Chang, X.; Li, W.; Yang, J.; Xu, L.; Zheng, J.; Li, X. Direct plasma deposition of amorphous Si/C nanocomposites as high performance anode for lithium ion batteries. J. Mater. Chem. Phys. 2015, 3, 3522–3528. [Google Scholar] [CrossRef]
- Meshkani, F.; Rezaei, M. Effect of process parameters on the synthesis of nanocrystalline magnesium oxide with high surface area and plate-like shape by surfactant assisted precipitation method. Powder Technol. 2010, 199, 144–148. [Google Scholar] [CrossRef]
- Tunusoglu, O.; Espi, R.; Akbey, U.; Demir, M. Surfactant-assisted formation of organophilic CeO2 nanoparticles. Colloids Surf. A Physicochem. Engin. Aspects 2012, 395, 10. [Google Scholar] [CrossRef]
- Sreethawong, T.; Ngamsinlapasathian, S.; Yoshikawa, S. Crystalline mesoporous Nb2O5 nanoparticles synthesized via a surfactant-modified sol–gel process. Mater. Lett. 2012, 78, 135. [Google Scholar]
- Holgado, J.; Alvarez, R.; Munuera, G. Study of CeO2 XPS spectra by factor analysis: Reduction of CeO2. Appl. Surf. Sci. 2000, 161, 301. [Google Scholar] [CrossRef]
- Bumajdad, A.; Eastoe, J.; Mathew, A. Cerium oxide nanoparticles prepared in self-assembled systems. Adv. Colloid Interface Sci. 2009, 147, 56–66. [Google Scholar] [CrossRef]
- Slostowski, C.; Marrea, S.; Bassat, J.M.; Aymonier, C. Synthesis of cerium oxide-based nanostructures in near- and supercritical fluids. J. Supercrit. Fluids. 2013, 84, 89–97. [Google Scholar] [CrossRef]
- Sun, C.W.; Li, H.; Zhang, H.R.; Wang, Z.X.; Chen, L.Q. Controlled synthesis of CeO2 nanorods by a solvothermal method. Nanotechnology 2005, 16, 1454–1463. [Google Scholar] [CrossRef]
- Ameta, K.L.; Papnai, N.; Ameta, R. Photocatalytic Degradation of Malachite Green Using Nano-sized cerium-iron Oxide. Orbital Electron. J. Chem. 2014, 6, 4–19. [Google Scholar]
- Magdalene, C.; Kaviyarasu, K.; Vijaya, J.J.; Jayakumar, C.; Maaza, M.; Jeyaraj, B. Photocatalytic degradation effect of malachite green and catalytic hydrogenation by UV–illuminated CeO2/CdO multilayered nanoplatelet arrays: Investigation of antifungal and antimicrobial activities. J. Photochem. Photobiol. B Bio. 2017, 169, 110–123. [Google Scholar] [CrossRef]
- Gu, S.; Chen, Y.; Yuan, X.; Wang, H.; Chen, X.; Liu, Y.; Jiang, Q.; Wu, Z.; Zeng, G. Facile synthesis of CeO2 nanoparticles sensitized CdS nanorods photocatalyst with improved visible-light photocatalytic degradation of Rhodamine B. RSC Adv. 2015, 5, 79556–79564. [Google Scholar] [CrossRef]
- Askarinejad, A.; Morsali, A. Syntheses and characterization of CdCO3 and CdO nanoparticles by using a sonochemical method. Mater. Lett. 2008, 62, 478–482. [Google Scholar] [CrossRef]
- Zhao, M.; Li, H.; Shen, X.P.; Ji, Z.Y.; Xu, K.Q. Facile electrochemical synthesis of CeO2@Ag@CdS nanotube arrays with enhanced photoelectrochemically water splitting performance. Dalton Trans. 2015, 44, 19935–19941. [Google Scholar] [CrossRef] [PubMed]
- Couture, P.; Williams, G.; Kennedy, J.; Leveneur, J.; Murmu, P.; Chong, S.; Rubanov, S. Multiferroic nanocrystalline BiFeO3 and BiCrO3 thin films prepared by ion beam sputtering. Int. J. Nanotech. 2017, 14, 56–65. [Google Scholar] [CrossRef]
- Couture, P.; Williams, G.; Kennedy, J.; Leveneur, J.; Murmu, P.; Chong, S.; Rubanov, S. Nanocrystalline multiferroic BiFeO3 thin films made by room temperature sputtering and thermal annealing, and formation of an iron oxide-induced exchange bias. J. Alloys Comp. 2017, 695, 3061–3068. [Google Scholar] [CrossRef]
- Kennedy, J.; Fang, F.; Futter, J.; Leveneur, J.; Murmu, P.; Panin, G.; Kang, T.; Manikandan, E. Synthesis and enhanced field emission of zinc oxide incorporated carbon nanotubes. Diam. Relat. Mater. 2017, 71, 79–84. [Google Scholar] [CrossRef]
- Culica, M.; Andreea, C.-S.; Melinte, V.; Coseri, S. Cellulose Acetate Incorporating Organically Functionalized CeO2 NPs: Efficient Materials for UV Filtering Applications. Materials 2020, 13, 2955. [Google Scholar] [CrossRef]
- McDevitt, N.; Baun, W. Infrared absorption study of metal oxides in the low frequency region (700–240 cm−l). Spectrochem. Acta 1964, 20, 799–808. [Google Scholar] [CrossRef]
Disclaimer/Publisher’s Note: The statements, opinions and data contained in all publications are solely those of the individual author(s) and contributor(s) and not of MDPI and/or the editor(s). MDPI and/or the editor(s) disclaim responsibility for any injury to people or property resulting from any ideas, methods, instructions or products referred to in the content. |
© 2023 by the authors. Licensee MDPI, Basel, Switzerland. This article is an open access article distributed under the terms and conditions of the Creative Commons Attribution (CC BY) license (https://creativecommons.org/licenses/by/4.0/).