1. Introduction
Microbubbles have been applied frequently due to their reliable physical properties. A larger gas–liquid interfacial area, being slow moving in the water, and having a high self-pressurizing effect are unique microbubble characteristics. The advantages of microbubbles are suitable to enhance dissolved oxygen in water. They can be used to purify water, aquaculture, and agriculture [
1]. The technology that can generate microbubbles is called a microbubble generator. Venturi is one type of microbubble generator. Venturi has no complicated structure, low energy consumption, and no internal rotating parts [
2]. Bubbles will form due to self-suction due to vacuum pressure in the throat and reduction in the cross-sectional area. The bubbles formed will then be deformed into small shapes.
The fluid flow rate affects the performance of the microbubble generator [
3,
4]. Several modifications, such as the addition of spiral fins [
5] and porous media [
6], combined with orifices [
7], have been made to increase the efficiency of the venturi. Several modifications to the divergent and convergent sides of the microbubble generator have been conducted by researchers, but modifications at the inlet are still not widely carried out. For this reason, this research will evaluate the performance of the microbubble generator on bubble diameter, pressure drop, hydraulic power, and bubble-generating efficiency.
2. Materials and Methods
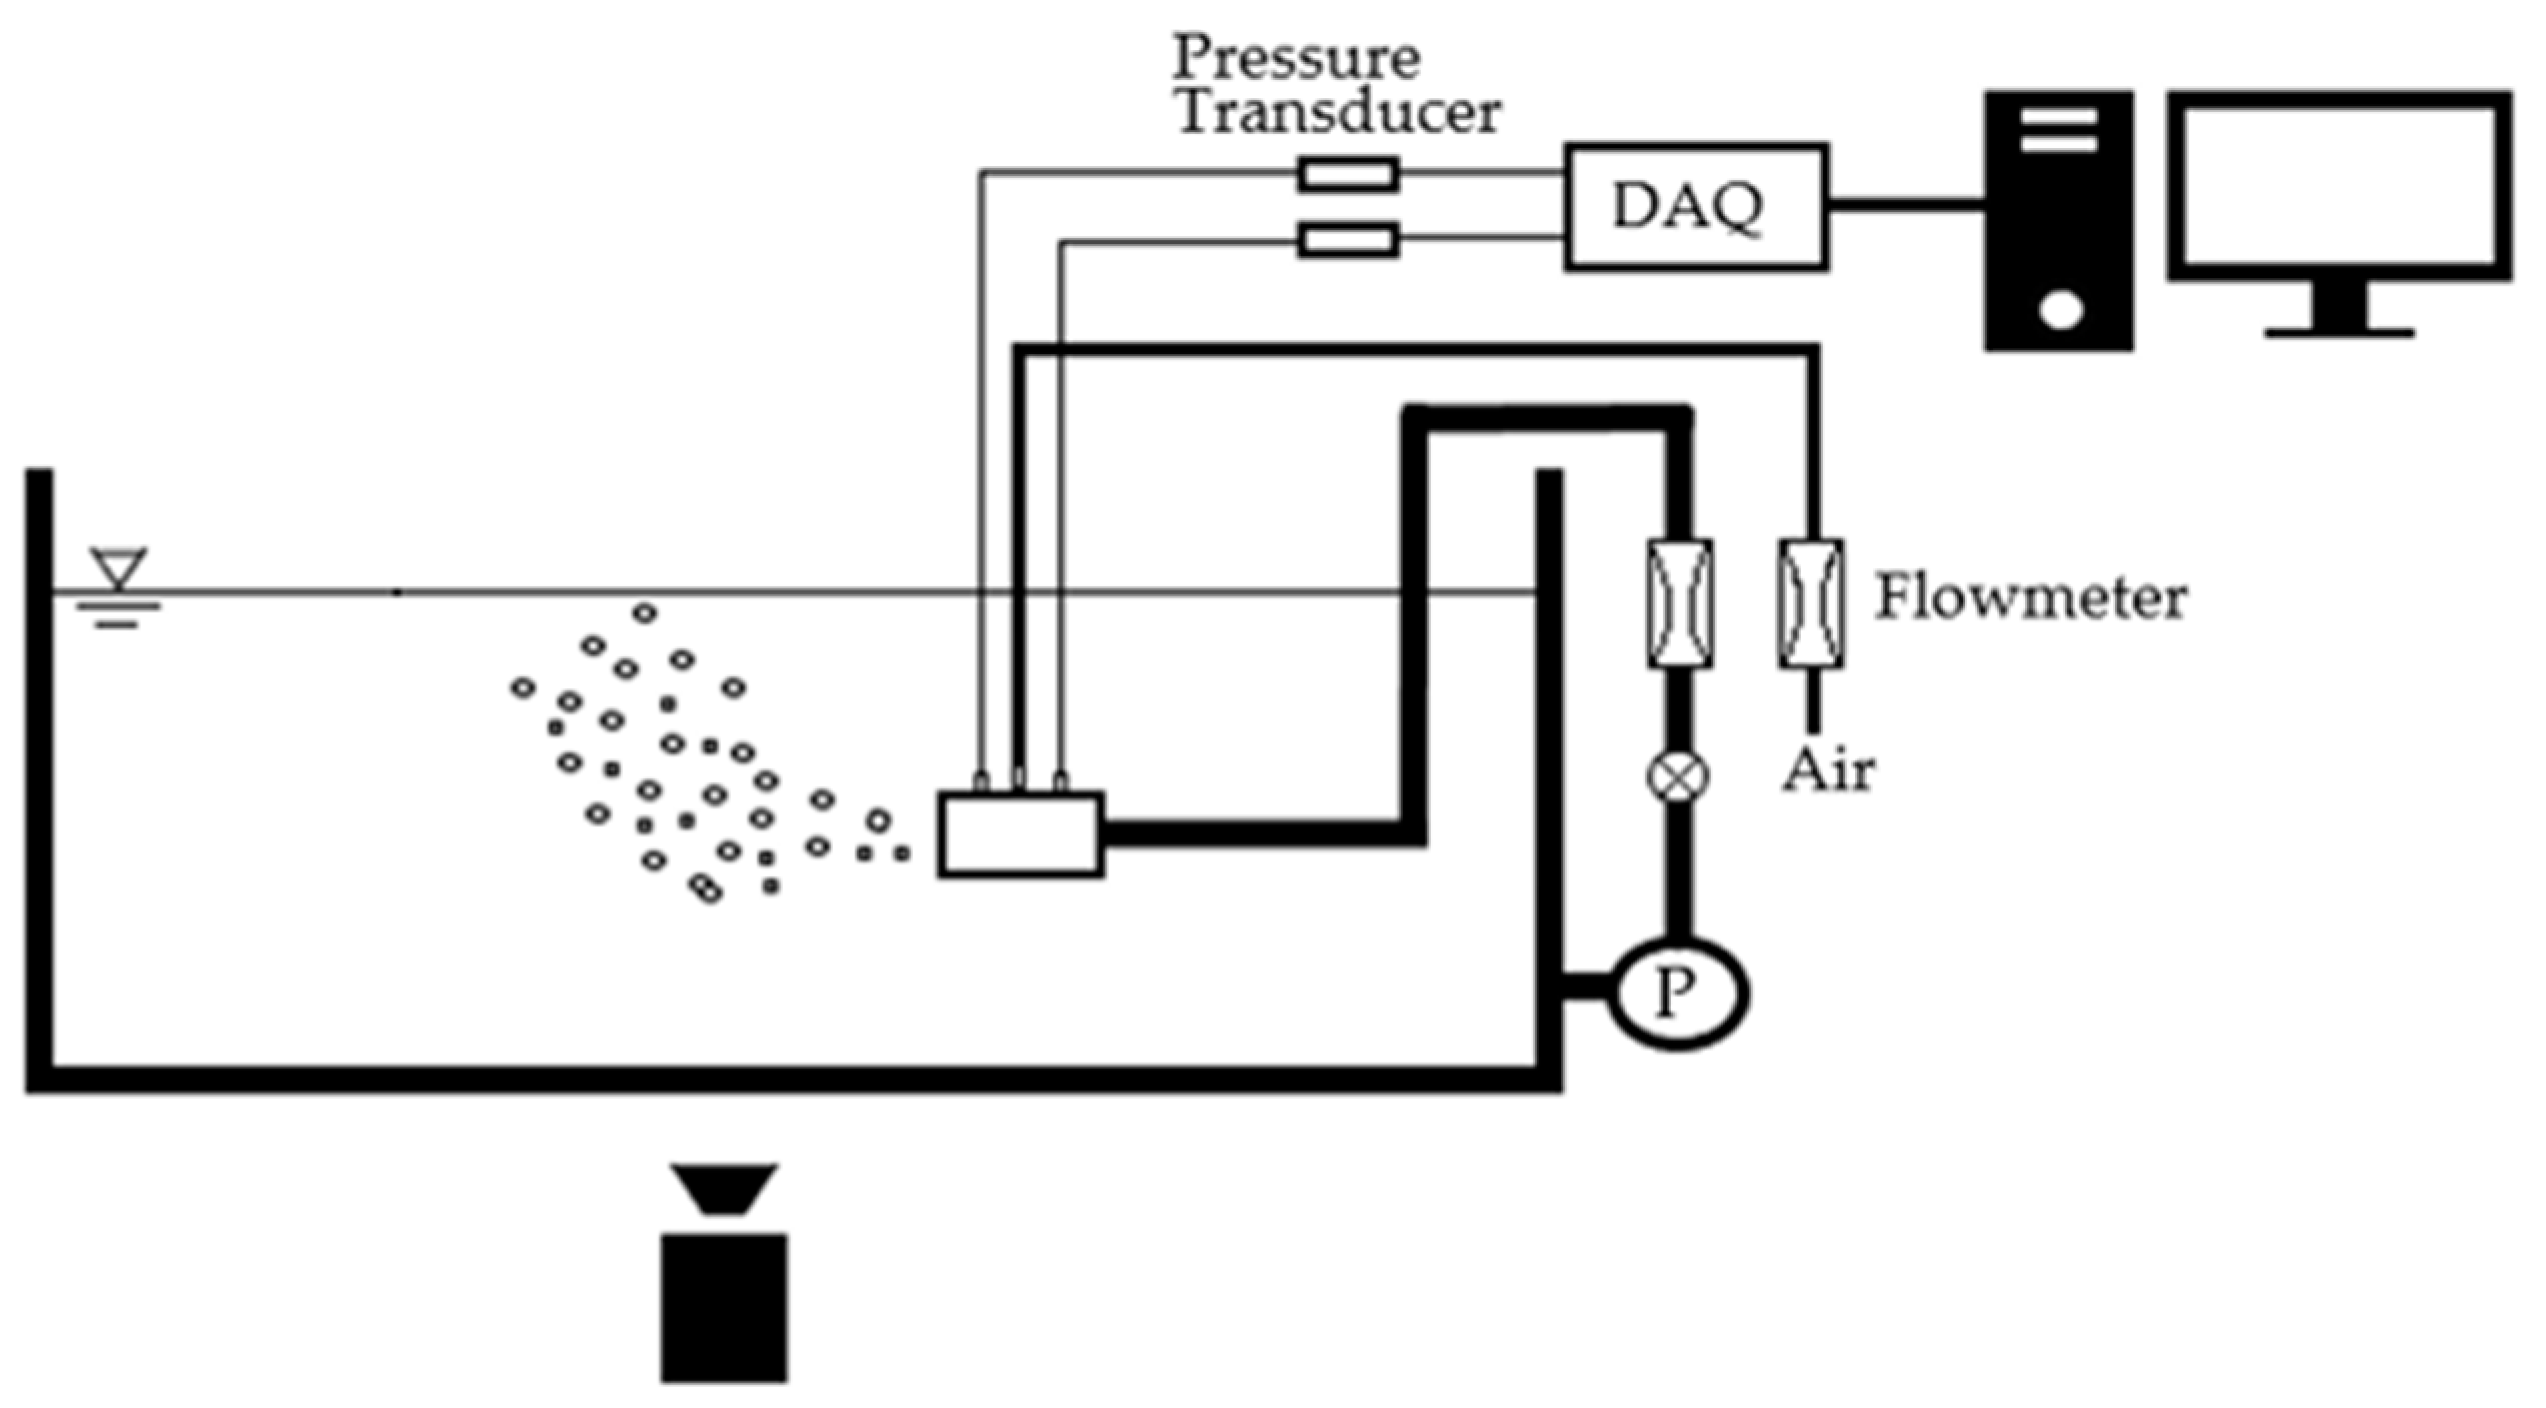
Figure 1 depicts the experimental apparatus used in this study. Four twisted fin baffles with a 60° angle twisted on the inlet section of the venturi were employed in this study, as shown in
Figure 2. They had a 29 mm inlet diameter and were placed 0.2 m from the bottom of an aquarium. A total of 15 tests were run by varying the water flow rate (Q
L) from 40 to 60 lpm and the gas flow rate (Q
G) from 0.1 to 0.5 lpm.
This study used a high-speed video camera (Phantom Miro M310) to visualize bubble behavior under several testing conditions. The camera was set at a resolution of 768 × 480 with a recording speed of 3000 fps. The experimental data were obtained using an image processing technique adapted by previous research [
7]. A differential pressure transducer Validyne P55D was installed at the venturi inlets and outlets section to evaluate pressure drop. To collect pressure data, Advantech data acquisition was used. Pressure drop, hydraulic power, and bubble-generating efficiency parameters can be calculated using this equation [
8]:
where subscripts 1 and 2 mean inlets and outlets.
ρL is the water density,
vL1 represents the water velocity before entering the reduction area, and
H is the depth of the microbubble generator from the water surface.
3. Results and Discussion
This chapter will discuss the analysis by parameter bubble size distribution, pressure drop, hydraulic power (Lw), and bubble-generating efficiency (ηB) from obtained experimental data. Bubble size distribution was analyzed with an image processing toolbox in MATLAB R2022b. Meanwhile, hydraulic power and bubble-generating efficiency were analyzed from differential pressure data. Variations in water and gas flow rates were conducted in this study.
3.1. Distribution of Bubble Size
The size of the bubble is an important indicator in a microbubble generator. This section thoroughly compared the effects of liquid–gas flow rates on bubble size distribution.
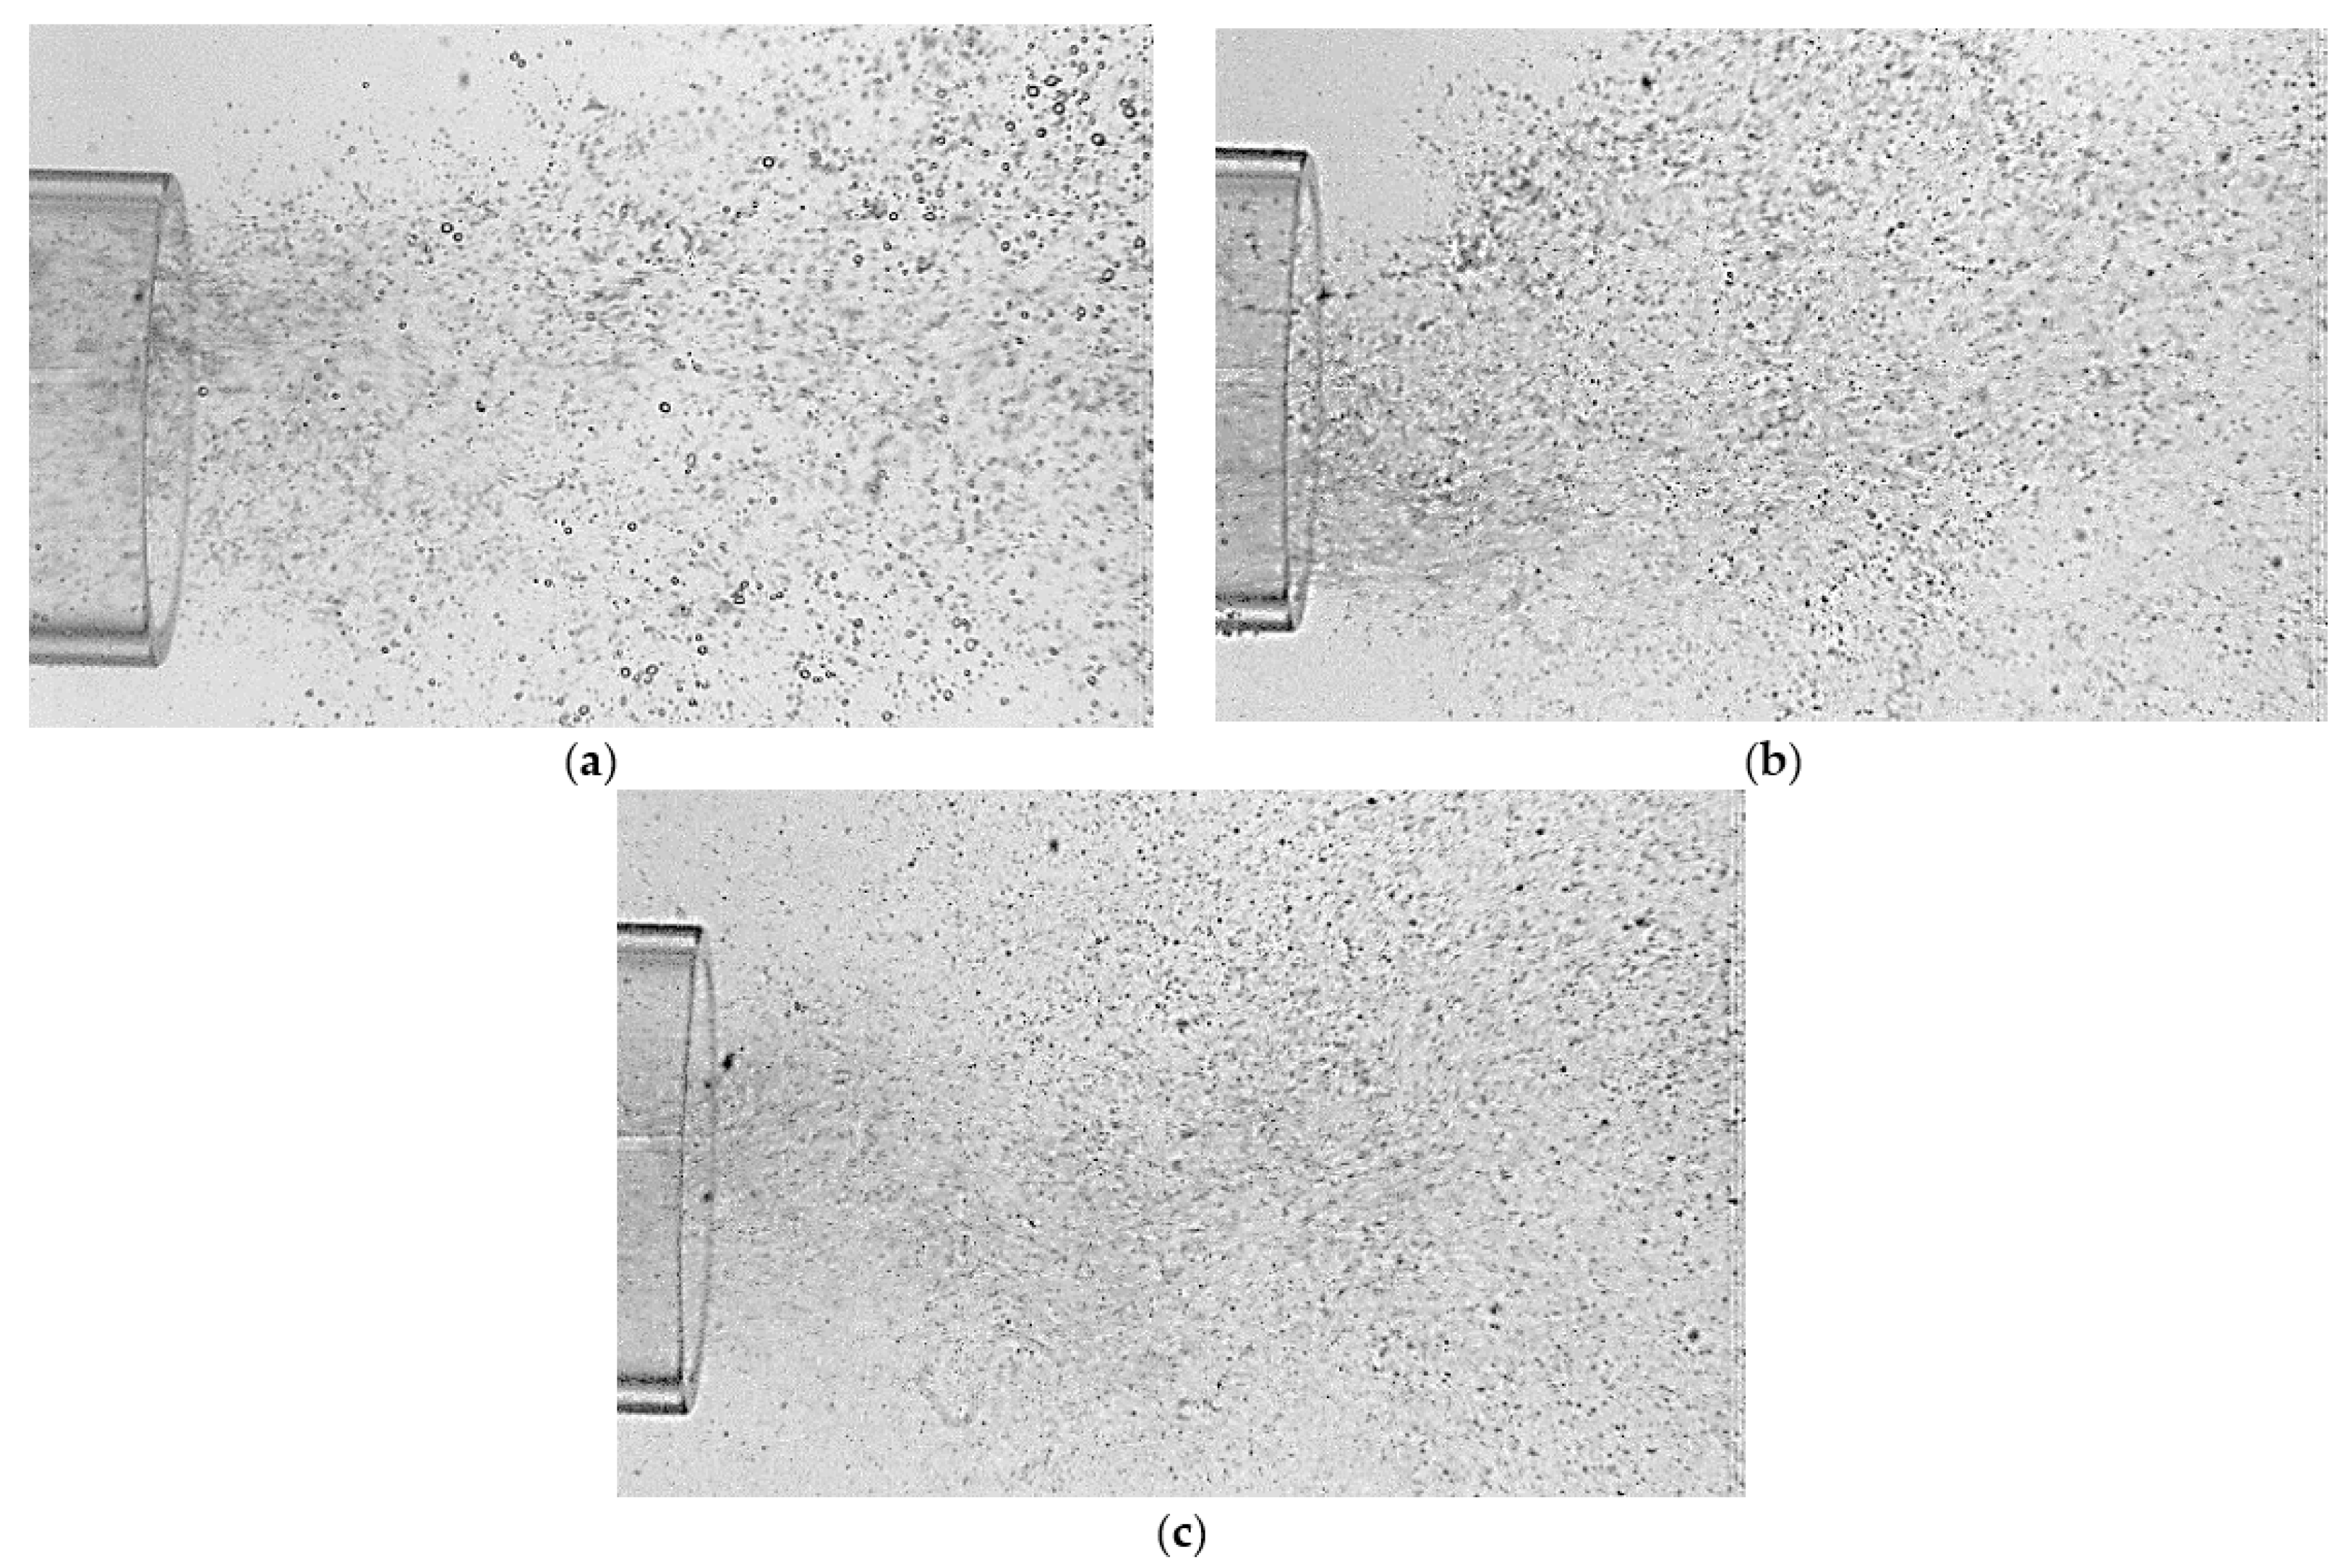
Figure 3 provides the distribution of bubble sizes in distinct flow scenarios. The visualization shows that the water flow rate of 60 lpm produced smaller and more uniform bubbles than the water flow rates of 40 and 50 lpm.
The distribution of the bubble size is expressed in the probability density function (PDF). From
Figure 4, it was found that the bubble was generated in a 100–300 µm diameter. A higher probability graphic reached 0.385 at Q
L 60 lpm. An increase in water flow rate increased the water velocity and inertia forces. When inertia surpassed Weber’s force, a larger shear stress was applied to the bubble and it was broken into pieces. In addition, enlarging the water flow rate will inhibit the initial bubble formation so that the average bubble diameter will decrease.
In the meantime, the enlargement of the gas flow rate should diminish the bubble stability while increasing the effect of bubble coalescence. Coalescence is defined as forming large bubbles from small ones [
9]. Coalescence decreases the probability curve distribution. This statement is in line with previous work [
4,
6].
3.2. Pressure Drop (ΔP)
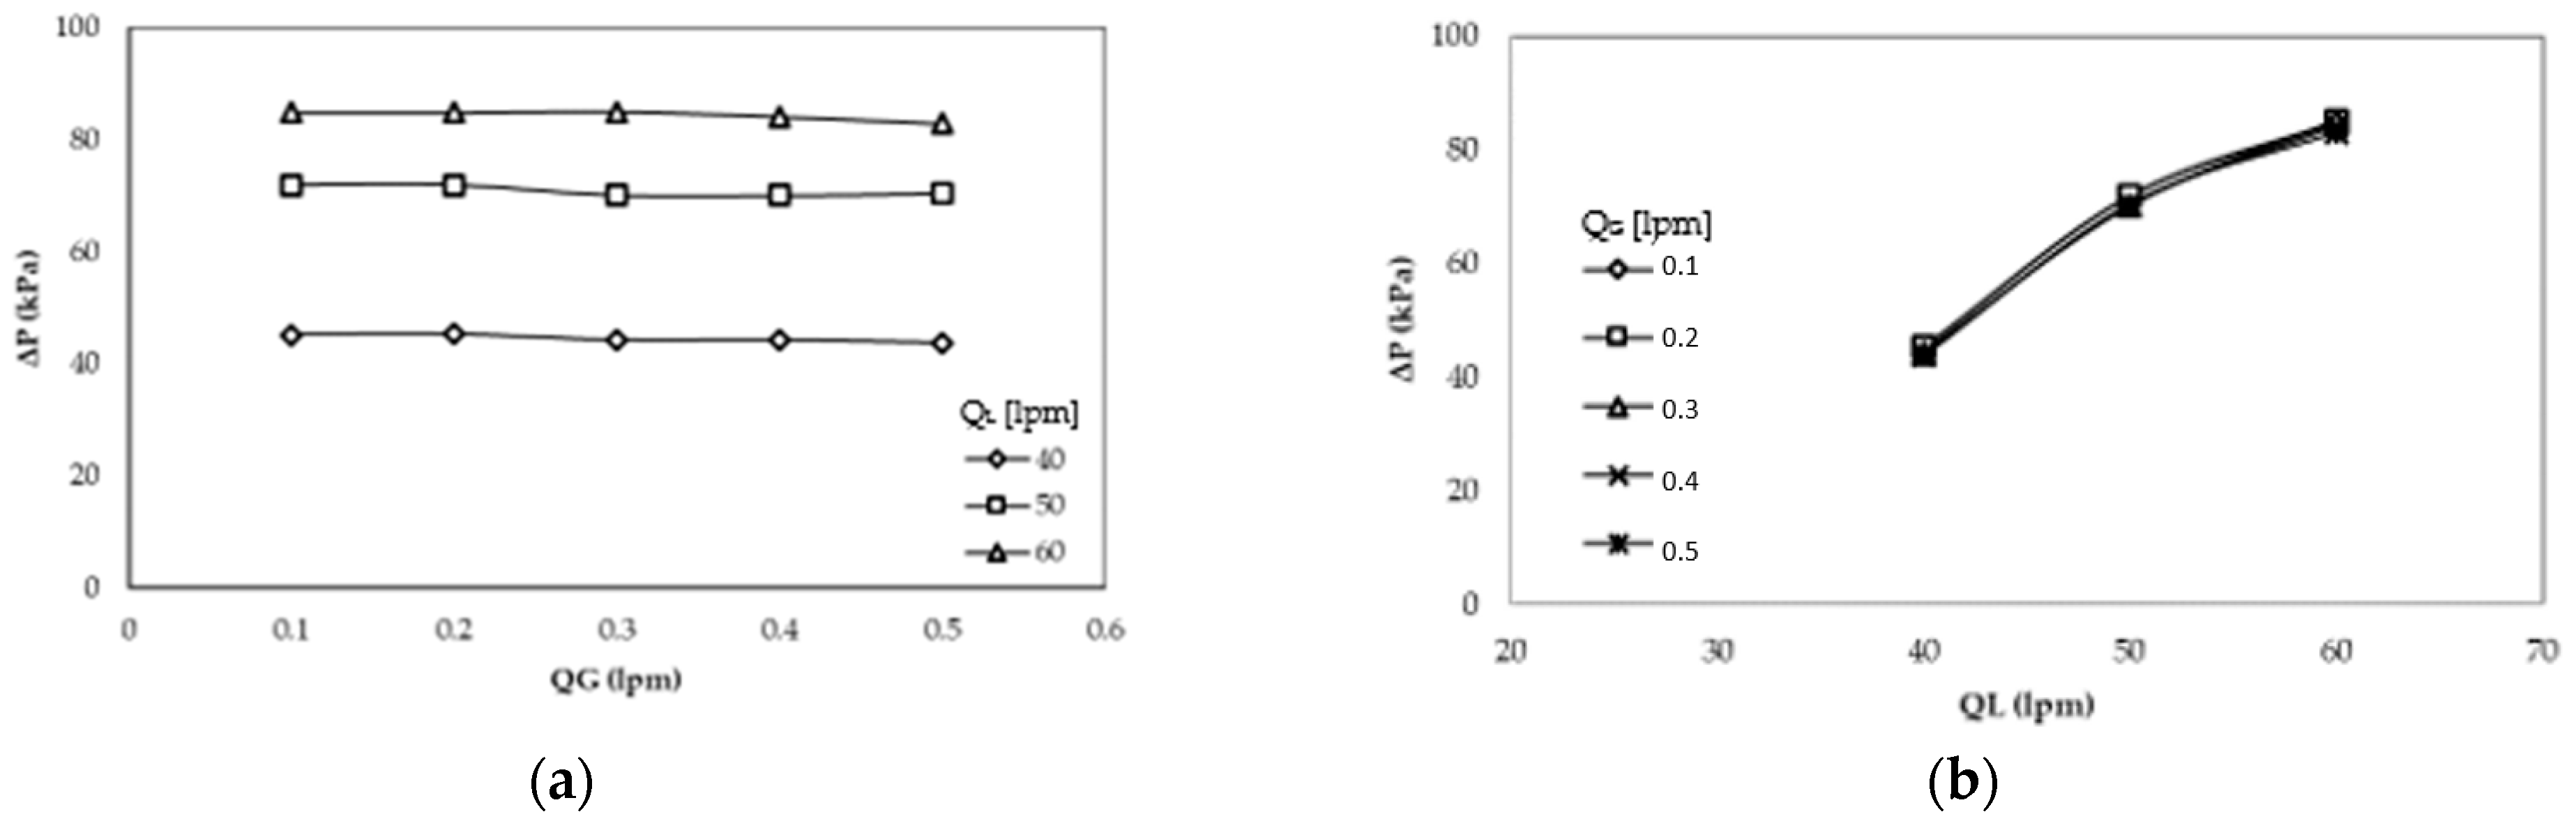
Data pressure from physical experiments can be calculated using Equation (1). A combination of Q
L and Q
G had a distinct response.
Figure 5 demonstrated that pressure drops were linearly increased with increasing water flow rates. The tiniest pressure drop occurred at a 40 lpm water flow rate. In contrast, the enhancement of the gas flow rate was not significantly affected by the pressure drop. It can be seen that the curves during the variation of gas flow rates created identical graphics. This phenomenon occurs because the gas flowing into the MBG just from the throat section towards the divergent and it does not pass through the twisted baffle. While the water flows along on the venturi geometry. So the air flow rate has a less significant effect on the pressure drop when it compared to the water flow rate.
3.3. Hydraulic Power (Lw)
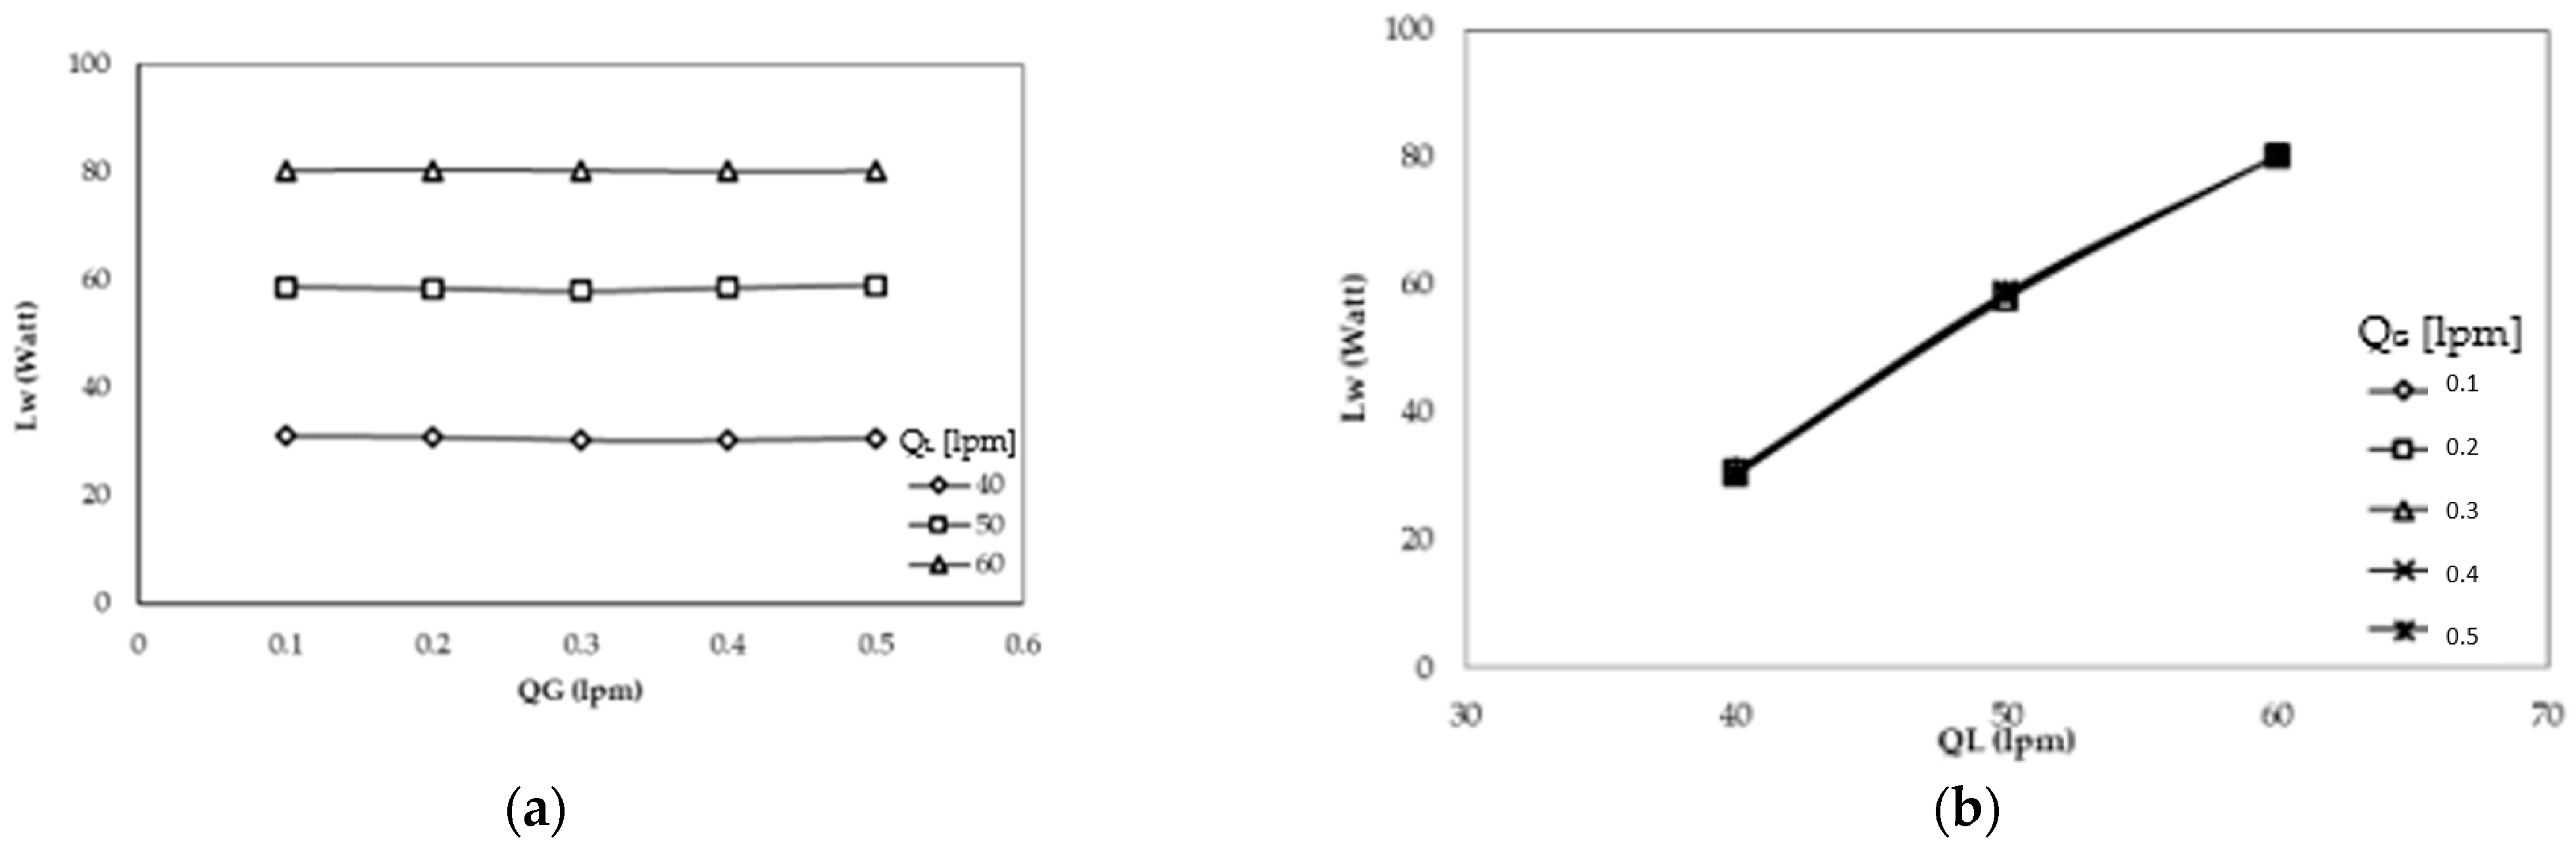
Figure 6 compares the calculated hydraulic power for Q
L and Q
G variations. Higher hydraulic power occurred at Q
L 60 lpm, by 79.04 W. L
w increased linearly with the pressure drop and water flow rates. An increased water flow rate (Q
L) increased the hydraulic power by 22–27 W, while an increase in gas flow rate (Q
G) only increased it by 1 W and produced almost the same graphic. Therefore, we can conclude that the water flow rates more significantly affected L
w than gas flow rates.
Hydraulic power represents the stored energy in the water flow in a microbubble generator. The lower the hydraulic power, the better the performance and the easier it is to select a water circulation pump [
8].
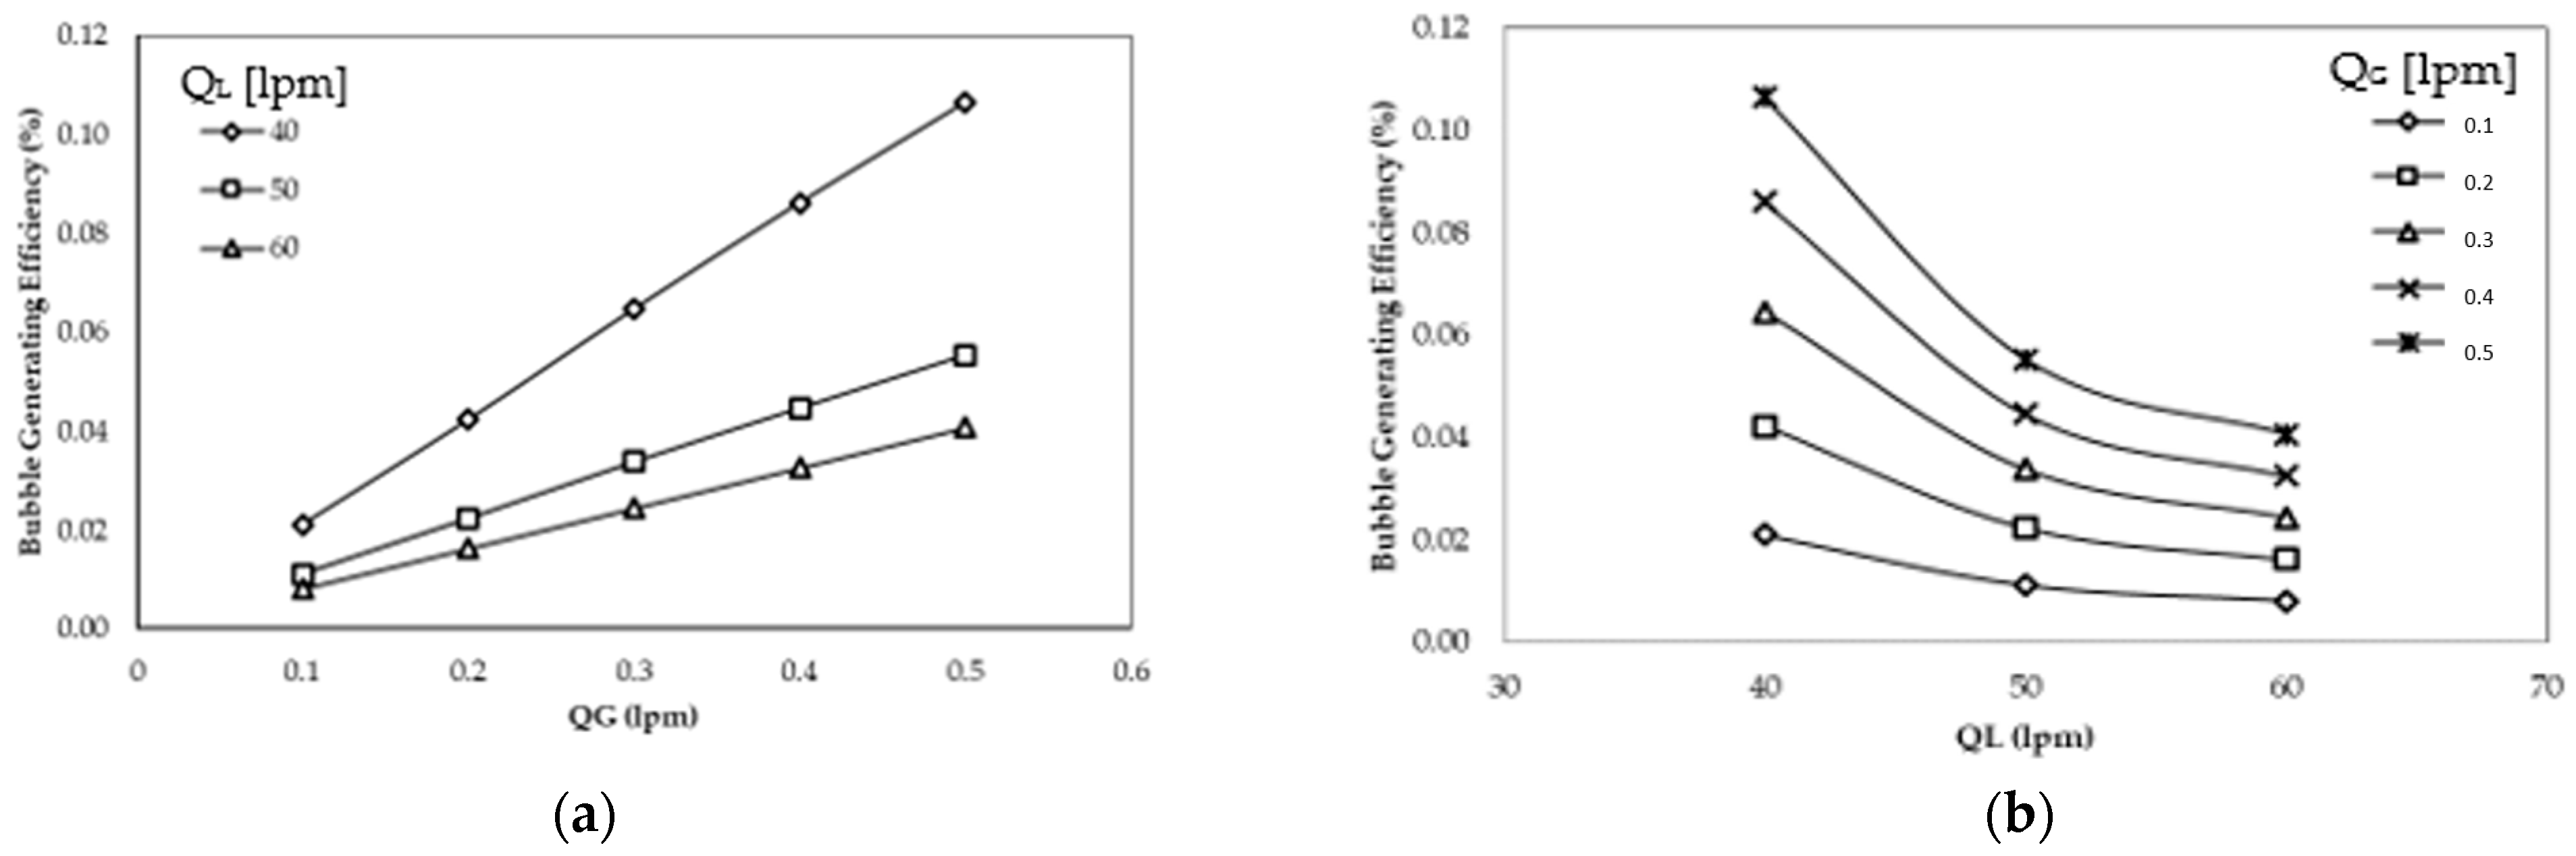
3.4. Bubble-Generating Efficiency (ηB)
Bubble-generating efficiency means the energy received by air from water flow rates.
Figure 7 displays the relationship between variations Q
G and Q
L via bubble-generating efficiency. It can be seen that the smallest bubble-generating efficiency occurred at Q
L 60 lpm on Q
G 0.1–0.5 lpm. On the other hand, η
B was proportional with the increment of gas flow rates. The highest η
B reached 0.1% at Q
G 0.5 lpm.
If compared, the bubble-generating efficiency in this study had a lower η
B than the spherical body and porous venturi microbubble generator [
6,
9]. The bubble-generating efficiency decreased with an increase in hydraulic power. The lower η
B indicated that the energy inside the water was used to break air into a tiny bubble in the microbubble generator rather than suck air into it [
8].
4. Conclusions
The addition of the twisted baffle on the venturi microbubble generator was analyzed by examining the bubble size distribution, pressure drop (ΔP), hydraulic power (Lw), and bubble-generating efficiency (ηB). As a result, we found that majority bubbles with a diameter of 100–300 µm were generated. The bubble size diameter increased as QG increased, while the inverse happened with QL. Hydraulic power increased linearly with the pressure drop and QL. The higher Lw decrease in ηB improved the performance of the microbubble generator. Further investigation is required to discover dissolved oxygen concentration, SAE, SOTR, and SOTE.
Author Contributions
Conceptualization, S.D.P.S. and D.; methodology, F.R. and S.D.P.S.; formal analysis, D. and I.; writing—original draft F.R.; writing—review and editing, S.K., D. and I.; supervision, D. and I. All authors have read and agreed to the published version of the manuscript.
Funding
This research received no external funding.
Institutional Review Board Statement
Not applicable.
Informed Consent Statement
Not applicable.
Data Availability Statement
The information reported in this study will be made available upon request.
Acknowledgments
We acknowledge the Department of Mechanical and Industry Engineering, Universitas Gadjah Mada, for the support throughout the work.
Conflicts of Interest
The authors declare no conflict of interest.
References
- Tsuge, H. Micro and Nanobubbles Fundamentals and Applications, 1st ed.; Taylor & Francis: Boca Raton, FL, USA, 2015. [Google Scholar]
- Huang, J.; Sun, L.; Liu, H.; Mo, Z.; Tang, J.; Xie, G.; Du, M. A review on bubble generation and transportation in Venturi-type bubble generators. Exp. Comput. Multiph. Flow 2020, 2, 123–134. [Google Scholar] [CrossRef]
- Deendarlianto; Wiratni; Tontowi, A.E.; Indarto; Iriawan, A.G.W. The implementation of a developed microbubble generator on the aerobic wastewater treatment. Int. J. Technol. 2015, 6, 924–930. [Google Scholar] [CrossRef]
- Gordiychuk, A.; Svanera, M.; Benini, S.; Poesio, P. Size distribution and Sauter mean diameter of micro bubbles for a Venturi type bubble generator. Exp. Therm. Fluid Sci. 2016, 70, 51–60. [Google Scholar] [CrossRef]
- Shin, D.H.; Gim, Y.; Sohn, D.K.; Ko, H.S. Development of venturi-tube with spiral-shaped fin for water treatment. J. Fluids Eng. Trans. ASME 2019, 141, 051303. [Google Scholar] [CrossRef]
- Majid, A.I.; Nugroho, F.M.; Juwana, W.E.; Budhijanto, W.; Deendarlianto; Indarto. On the performance of venturi-porous pipe microbubble generator with inlet angle of 20° and outlet angle of 12°. AIP Conf. Proc. 2018, 2001, 050009. [Google Scholar] [CrossRef]
- Juwana, W.E.; Widyatama, A.; Dinaryanto, O.; Budhijanto, W.; Indarto; Deendarlianto. Hydrodynamic characteristics of the microbubble dissolution in liquid using orifice type microbubble generator. Chem. Eng. Res. Des. 2019, 141, 436–448. [Google Scholar] [CrossRef]
- Sadatomi, M.; Kawahara, A.; Kano, K.; Ohtomo, A. Performance of a new micro-bubble generator with a spherical body in a flowing water tube. Exp. Therm. Fluid Sci. 2005, 29, 615–623. [Google Scholar] [CrossRef]
- Levitsky, I.; Tavor, D.; Gitis, V. Micro and nanobubbles in water and wastewater treatment: A state-of-the-art review. J. Water Process Eng. 2022, 47, 102688. [Google Scholar] [CrossRef]
| Disclaimer/Publisher’s Note: The statements, opinions and data contained in all publications are solely those of the individual author(s) and contributor(s) and not of MDPI and/or the editor(s). MDPI and/or the editor(s) disclaim responsibility for any injury to people or property resulting from any ideas, methods, instructions or products referred to in the content. |
© 2023 by the authors. Licensee MDPI, Basel, Switzerland. This article is an open access article distributed under the terms and conditions of the Creative Commons Attribution (CC BY) license (https://creativecommons.org/licenses/by/4.0/).

