1. Introduction
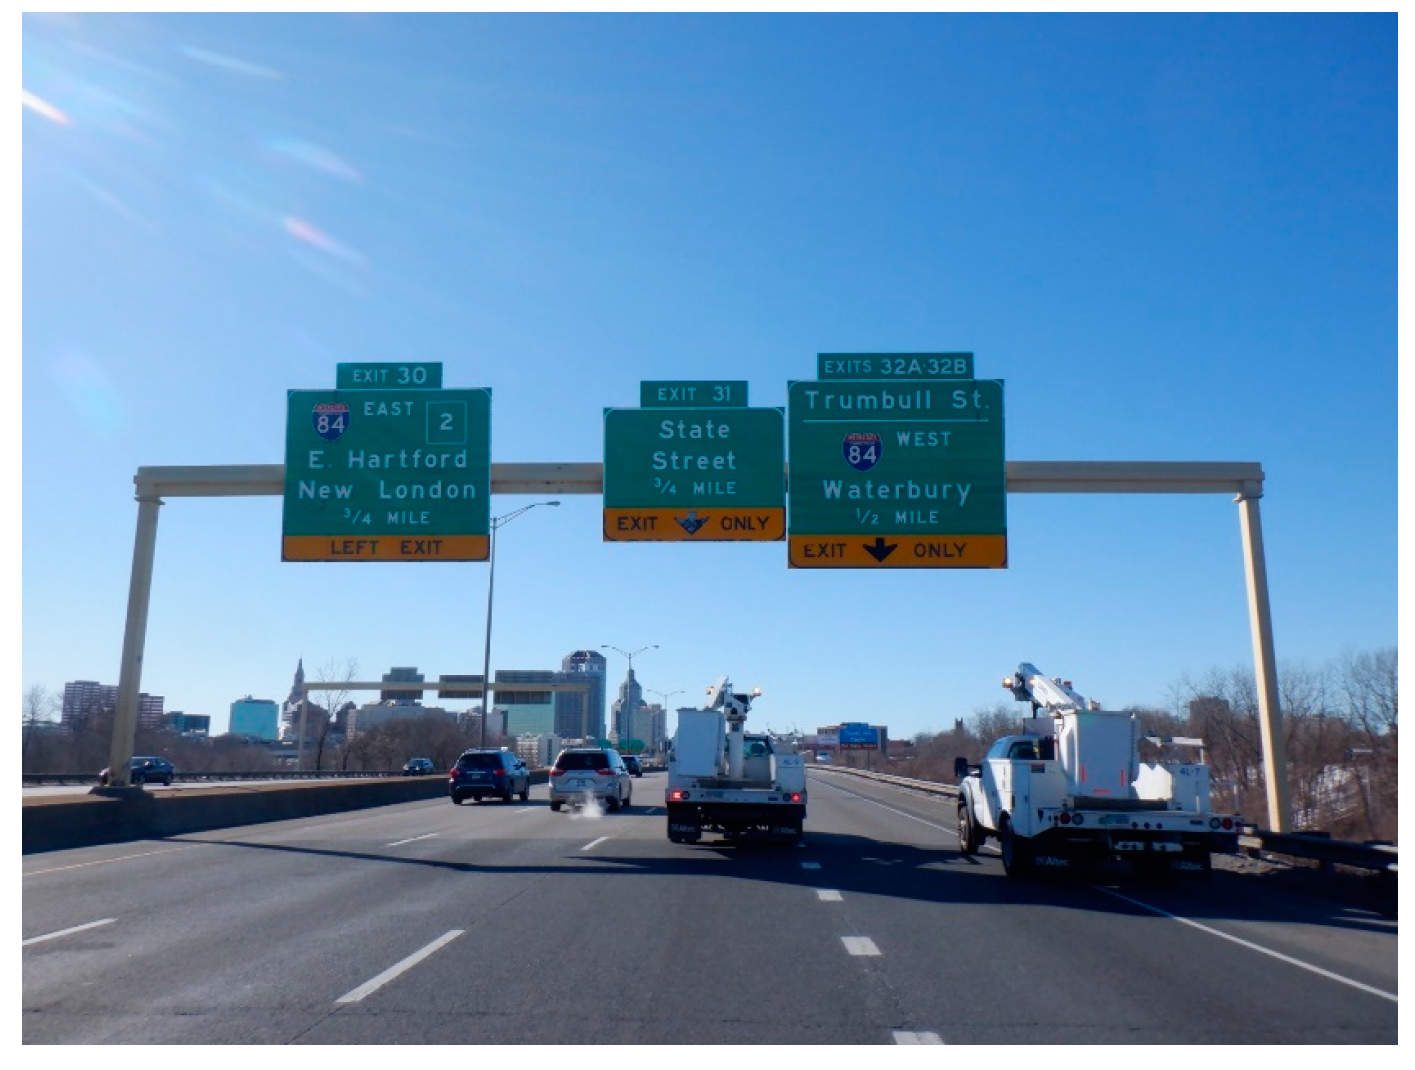
Sign support systems (
Figure 1) are essential structures in the Connecticut Department of Transportation (CT DOT) bridge management system, and they are often neglected until they are in critical condition and fail. Periodic inspections and maintenance activities are needed as a long-term, cost-effective preventive maintenance strategy. Sign support systems are included in the Bridge Management System (BMS). The data collected from the BMS were analyzed using predictive deterioration curves with educated estimates from the literature review. This research developed the asset maintenance strategy using the deterioration prediction model and risk management for sign support systems.
2. Weibull Function for Deterioration Prediction Model
Usually, when machines or structures are newly built, during the operation’s initial status, there is a high chance of failure or breakdown due to defective parts and installation. Once the initial status is settled, it goes into a stable service period until it reaches the end of its service life (
Figure 2a).
The Weibull distribution is perhaps the most widely used of all the failure time distributions, and it is noted for its flexibility as a failure prediction model. Reliability deals with reducing the frequency of failures over a time interval and is a measure of the probability of failure-free operation during a given interval, i.e., it is a measure of success for a failure-free operation. Reliability is quantified as MTBF (Mean Time Between Failures) for repairable products and MTTF (Mean Time to Failure) for the non-repairable product. In reliability theory, the Weibull function is widely used for its simplicity without losing too much accuracy.
Figure 2b shows the typical failure rate over time by the Weibull function, where x is usage time and
β and
γ are the graph shape parameters. The shape parameters,
γ and
β, are assumed in this case to be 3 and 30, respectively, where
β is the scale parameter that directly relates to the spread of the distribution curve. In reliability theory,
β is either MTBF or MTTF. The cumulative distribution curve plots the cumulative probability of occurrence over time for a specific action. In this case, it plots the probability of failure over time.
3. Infrastructure Asset Management Using Quantitative Risk Analysis
The objective of Infrastructure Asset Management is to produce the maintenance of priority and budget prediction of assets. In this paper, a quantitative risk analysis is performed. The risk assessment and asset deterioration and failure prediction model are created using the existing database provided by the DOT. The procedures of risk management plan development are (1) risk identification; (2) quantification of failure impact; (3) assessment and prediction of the probability of failure; and (4) risk quantification, calculated as Probability of Occurrence (P) × impact (I), or risk = P × I. The estimated risk score can be considered as management and repair priority. The probability of occurrence (P) can be obtained by the mean-time-to-failure (MTTF) and the age of the infrastructure using the Weibull function or Normal distribution (Gaussian) function.
4. Development of Deterioration Prediction Model
MTTF (Mean-time-to-Failure) is calculated as an average of different adjustment factors relevant to each sign. The adjustment factors are as follows: (1) average daily traffic, (2) lanes under the structure, (3) material type, and (4) structure type. These four factors are chosen as they most accurately represent the structures’ average wear and tear from reviewing existing sign support literature. The factors of the sign support system failures were previously studied by Kipps [
1], Barle [
2], and Shboul [
3].
All the factors below contain a variable that begins with an “s”. These variables represent the years a structure would take to fail when no other influence is considered. For example, an adjustment value of 36 for a support constructed of A-36 steel is because the structure is made of A-36 steel where it is defined by ASTM [
4]. The shape, location, and average daily traffic are not considered when assigning these scores, as they are all brought back together when averaging out.
This methodology of estimating MTTF would be to average these scores and then find the average number of years for a structural failure. Each structure is unique; therefore, coming up with an MTTF for each individual would take an incalculable amount of time and is beyond the scope of this paper. By assigning scores based on each factor’s relative durability, we can assign a normalized MTTF score to each structure based on an average. These scores are assigned based on prior research, and each factor is present in at least one of each in any given sign support.
Material types of yield strength (
sMAT) accurately represent how a sign support structure’s material type plays into the general deterioration of the support over time. According to the ASTM 2019 standards reference documents, assuming all else are constant, the different materials and their yield strengths are shown in
Table 1.
The formula to calculate the
MTTF for any given structure is as follows:
The
MTTF score can be inserted into a probability distribution function to model the probability of failure. The Weibull function (Equation (1)) used to model this is as follows:
where
γ is the shape factor of the Weibull function. A shape factor of 3 is used to calculate
p(
f) because this shape factor relates to the failure rate behavior (increasing over time). This is known as a “wear-out failure”, or a failure rate that increases over time. This is shown in
Figure 2b.
The reliability factor (
r(
f)) can be found simultaneously alongside the
p(
f). The
r(
f) is a measurement to identify the measure of failures over a time interval. It measures the probability of failure-free operation during a given interval.
r(
f) is calculated using the following equation:
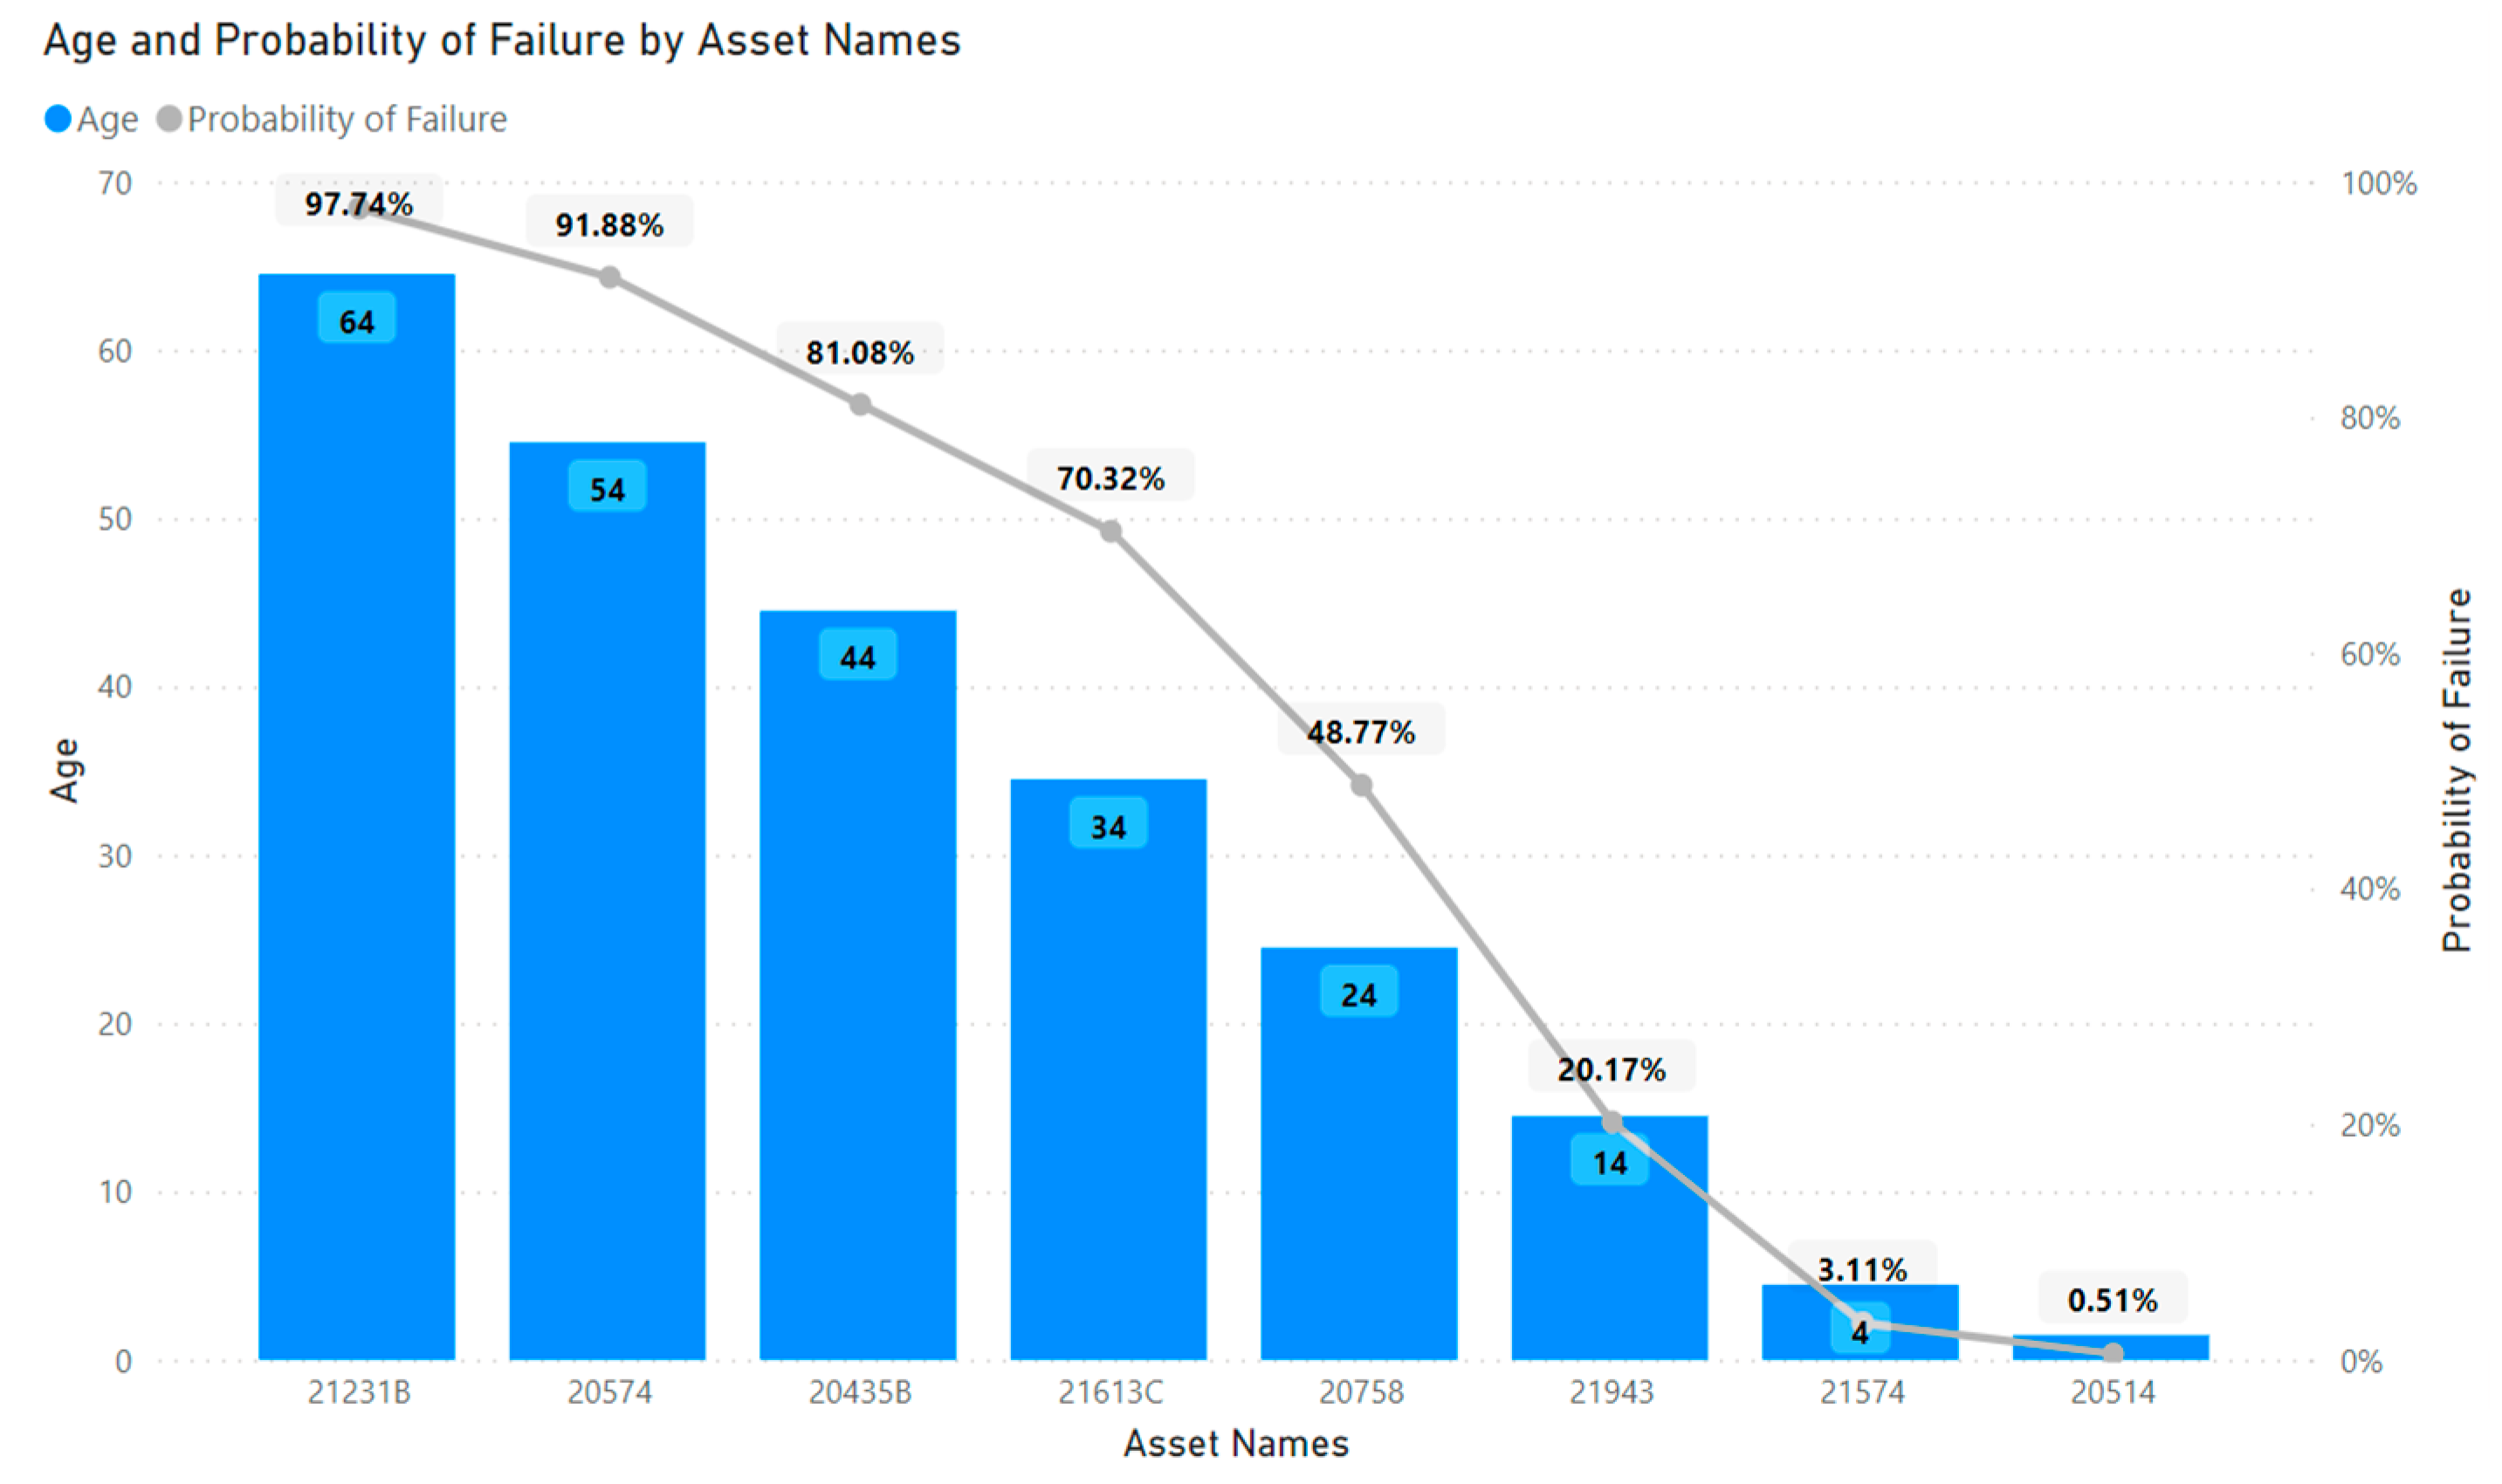
The result is shown in
Figure 3. The graph shows the assets, ages, and probability of failure. It shows only a few assets out of thousands in the database. Note that the numbers on the x-axis are the asset names. For example, the name of the first asset is “21231B”, the second one is “20574”, etc. As expected, and by the Weibull function’s definition, age and probability of failure have a strong direct relationship.
Because the Mean-time-to-failure (MTTF) is defined by four variables such as (1) average daily traffic, (2) lanes under the structure, (3) material type, and (4) structure type, each sign support system has different MTTFs; however, the age of the structure is the main factor in estimating the probability of failure.
5. Summary and Conclusions
This paper presents a simplified deterioration model for highway sign support systems. Although there is much research to predict the deterioration of civil structures, because civil structures have a long life span, none of prediction models are proven. The deterioration prediction model is an important part of asset management. However, researchers and facility managers are often stuck in the deterioration prediction model development and fail to move forward to complete the asset management system development. This paper shows a simplified method of deterioration prediction model development.
The probability of the failure model adopts factors such as (1) average daily traffic (sADT), (2) lanes under the structure (sLNE), (3) material type (sMAT), and (4) structure type (sTYP). Then, the mean time to failure (MTTF) is calculated by averaging the four factors and it is assumed the reliability and the probability of failure are calculated using a simple probability distribution function, the Weibull function, which is widely used in failure prediction models of machine parts.
In conclusion, it is cost-effective to prioritize sign support repairs based on the findings. While the overall failure rate of these signs is low, preventative repairs should be considered, starting with the oldest supports and working toward the newest.
Author Contributions
M.C.: Conceptualization, methodology, formal analysis, and writing and editing paper; L.V.: investigation, data curation, visualization, writing draft; J.C.: review and editing. All authors have read and agreed to the published version of the manuscript.
Funding
CTDOT, SPR-PL-1(60) Part 2, SPR-2323.
Institutional Review Board Statement
Not applicable.
Informed Consent Statement
Not applicable.
Data Availability Statement
Not applicable.
Conflicts of Interest
The authors declare no conflict of interest.
References
- Kipp, A.M.; Ehsani, M.R. Field Testing of Highway Sign Support Structures. J. Struct. Eng. 1987, 113, 4. [Google Scholar]
- Barle, J.; Grubisic, V.; Vlak, F. Failure analysis of the highway sign structure and the design improvement. Eng. Fail. Anal. 2011, 18, 1076–1084. [Google Scholar] [CrossRef]
- Shboul, K.W.A.; Rasheed, H.A.; Alshareef, H.A. Intelligent approach for accurately predicting fatigue damage in overhead highway sign structures. Structures 2021, 34, 3453–3463. [Google Scholar] [CrossRef]
- A794/A794M-18; Standard Specification for Commercial Steel (CS), Sheet, Carbon (0.16% Maximum to 0.25% Maximum), Cold-Rolled. ASTM: West Conshohocken, PA, USA, 2018.
| Disclaimer/Publisher’s Note: The statements, opinions and data contained in all publications are solely those of the individual author(s) and contributor(s) and not of MDPI and/or the editor(s). MDPI and/or the editor(s) disclaim responsibility for any injury to people or property resulting from any ideas, methods, instructions or products referred to in the content. |
© 2023 by the authors. Licensee MDPI, Basel, Switzerland. This article is an open access article distributed under the terms and conditions of the Creative Commons Attribution (CC BY) license (https://creativecommons.org/licenses/by/4.0/).


