Proceeding Paper

Quantifying and Reducing Uncertainty in Transportation System Resilience Assessment: A Dynamic Bayesian Network Approach †

by
Vishnupriya Jonnalagadda
and
Ji Yun Lee
*
Department of Civil & Environmental Engineering, Washington State University, Pullman, WA 99164, USA
*
Author to whom correspondence should be addressed.
Presented at the Second International Conference on Maintenance and Rehabilitation of Constructed Infrastructure Facilities, Honolulu, HI, USA, 16–19 August 2023.
Eng. Proc. 2023, 36(1), 29; https://doi.org/10.3390/engproc2023036029
Published: 11 July 2023

Abstract

:
Transportation systems are complex, and due to their interdependence with other essential facilities, any damage to them would pose a significant threat to the well-being of communities. Given the frequent occurrences and grave consequences of natural disasters observed in recent years, research on the resilience assessment of transportation systems has received a great deal of attention. This paper develops a dynamic Bayesian network (BN)-based resilience assessment model for a highway network subject to seismic events that can explicitly quantify uncertainties in all phases of the model and investigate the role of inspection and monitoring in uncertainty reduction. The results from this study can be used as comprehensive decision-support information so that decision makers can better assess the resilience of a highway network and associated uncertainties.

1. Introduction

Resilience of an engineered system is generally defined as its capacity to withstand, adapt to, and recover from disruptions [1,2]. In recent years, assessing critical infrastructure resilience has become crucial due to the growing number of natural disasters. Transportation systems, in particular, play a key role in providing access to affected regions during and after catastrophic events by rescuing people and transporting essential supplies. However, assessing transportation system performance is accompanied by significant uncertainties arising from aging and deteriorating infrastructure, the increasing complexity of networks, damage due to extreme events from natural hazards, budgetary constraints, and increasing operational demands. Failure to account for these factors and their associated uncertainties may impede a transportation agency’s ability to achieve its predefined goals and objectives, leading to significant consequences for society.
While uncertainty quantification and reduction in transportation resilience assessment are essential to ensuring efficient resilience-enhancing strategies, many studies that propose a new resilience metric or resilience-based decision framework do not investigate the role of the inspection/monitoring process. One reason for this is that most metrics or frameworks are designed to measure scenario-based static resilience assuming that, at the time of hazard event occurrence, the full probabilistic descriptions of structural capacity and external loadings are known. However, there are substantial uncertainties in (a) the number, severity, and timing of hazard events, (b) time-dependent structural capacity, and (c) external/service loadings especially when climate change affects the performance of an asset or when traffic demands change significantly because of population growth and urbanization. If a resilience-based decision framework extends to a specified period and is intended to capture the time-dependent changes in structural performance and resilience, inspection/monitoring is necessary to increase the reliability of the predictions of structural capacity and/or external loadings in the future and, ultimately, determine transportation system resilience. To this end, this paper proposes a dynamic Bayesian network (BN)-based resilience assessment model for a highway network subject to seismic events. The model characterizes and quantifies uncertainties and investigates the role of inspection and monitoring in uncertainty reduction.

2. Methodology

Figure 1 shows the overall flowchart of the proposed dynamic BN-based seismic resilience assessment of a highway network. The model begins by measuring the time-dependent structural reliability of individual bridges exposed to corrosion and links this measure to post-earthquake traffic-carrying capacity. Then, combined with traffic demand data, the performance of individual bridges is aggregated through network analysis to evaluate the performance of the highway network in terms of total travel time prior to and following an earthquake event. By incorporating time-dependent restorative activities into the network analysis, the network’s seismic resilience is assessed. In the meantime, the probability density functions (PDFs) of bridge functionalities and link traffic demands are updated based on inspection and monitoring data at every time step through the dynamic BN.
To examine the role of inspecting and monitoring major random variables, such as surface chloride concentration, earthquake events, road surface conditions, or traffic demand, in the seismic resilience assessment of highway networks, this study considers three cases: (a) Case A: the baseline case where network resilience is measured based on the prior distributions of random variables, which is consistent with most existing studies; (b) Case B: true transportation resilience which is never known in the real world; and (c) Case C: the case where transportation resilience is measured based on the updated distributions of random variables through the proposed model. More specifically, in Case C, it is assumed that major random variables that change over time are monitored and that their prior PDFs are updated over time through the dynamic BN. True time-dependent data of the major random variables (i.e., Case B) are never known in the real world due to epistemic uncertainties, and thus, in this study, synthetic true values are generated. Similarly, synthetic measurement data are also generated due to the absence of monitoring data for the major random variables. After generating the synthetic analytical values of the major random variables using their respective analytical models, the synthetic true values and measurement data are generated based on the following equations:
y t x = y a x , β + ε a
y m x = y t x + ε o b s
where x = the independent variables; y t x = the synthetic true values of the major random variables; β = the model parameters; y a x , β = the output of the analytical model of the variables; ε a = the modeling error; y m x = the synthetic measurement data of the variables; and ε o b s = the measurement error which is usually modeled as a Gaussian random variable. In general, the measurement error is smaller than the modeling error.
The synthetic measurement data of the major random variables are then used to update a prior PDF through the BN to reduce epistemic uncertainties. In Bayes’ theorem, initial knowledge of a parameter ( θ ) is encoded in a prior PDF, f ( θ ) . After incorporating the measurement data, a posterior PDF of the parameter, f ( θ | y m ) , is calculated by [3,4]:
f θ y m = f ( y m | θ ) f ( θ ) f ( y m )
where f ( y m | θ ) = the likelihood function that quantifies the likelihood of observing the data given θ ; and f ( y m ) = the marginal probability of the data.
In the proposed model, it is assumed that uncertainties exist at all stages of the resilience assessment procedure. The functionality of the highway network, Q t , is expressed as a function of total travel time and is measured by [5]:
Q t = 100 100 T T T t T T T 0 T T T 0
where T T T ( t ) = the total travel time at time t; and T T T 0 = the total travel time in the base model (measured without any disaster event). Once the time-dependent network functionality profile is constructed, the seismic resilience of a highway network is measured by the normalized area under the post-earthquake recovery trajectories and can be expressed as:
R = 1 t 1 t 0 t 0 t 1 Q t d t
where t 0 = the time of occurrence of an earthquake event; and t 1 = the time when a network is completely repaired. A higher value of R indicates a more seismically resilient network.

3. Benchmark Problem: A Highway Network in South Carolina

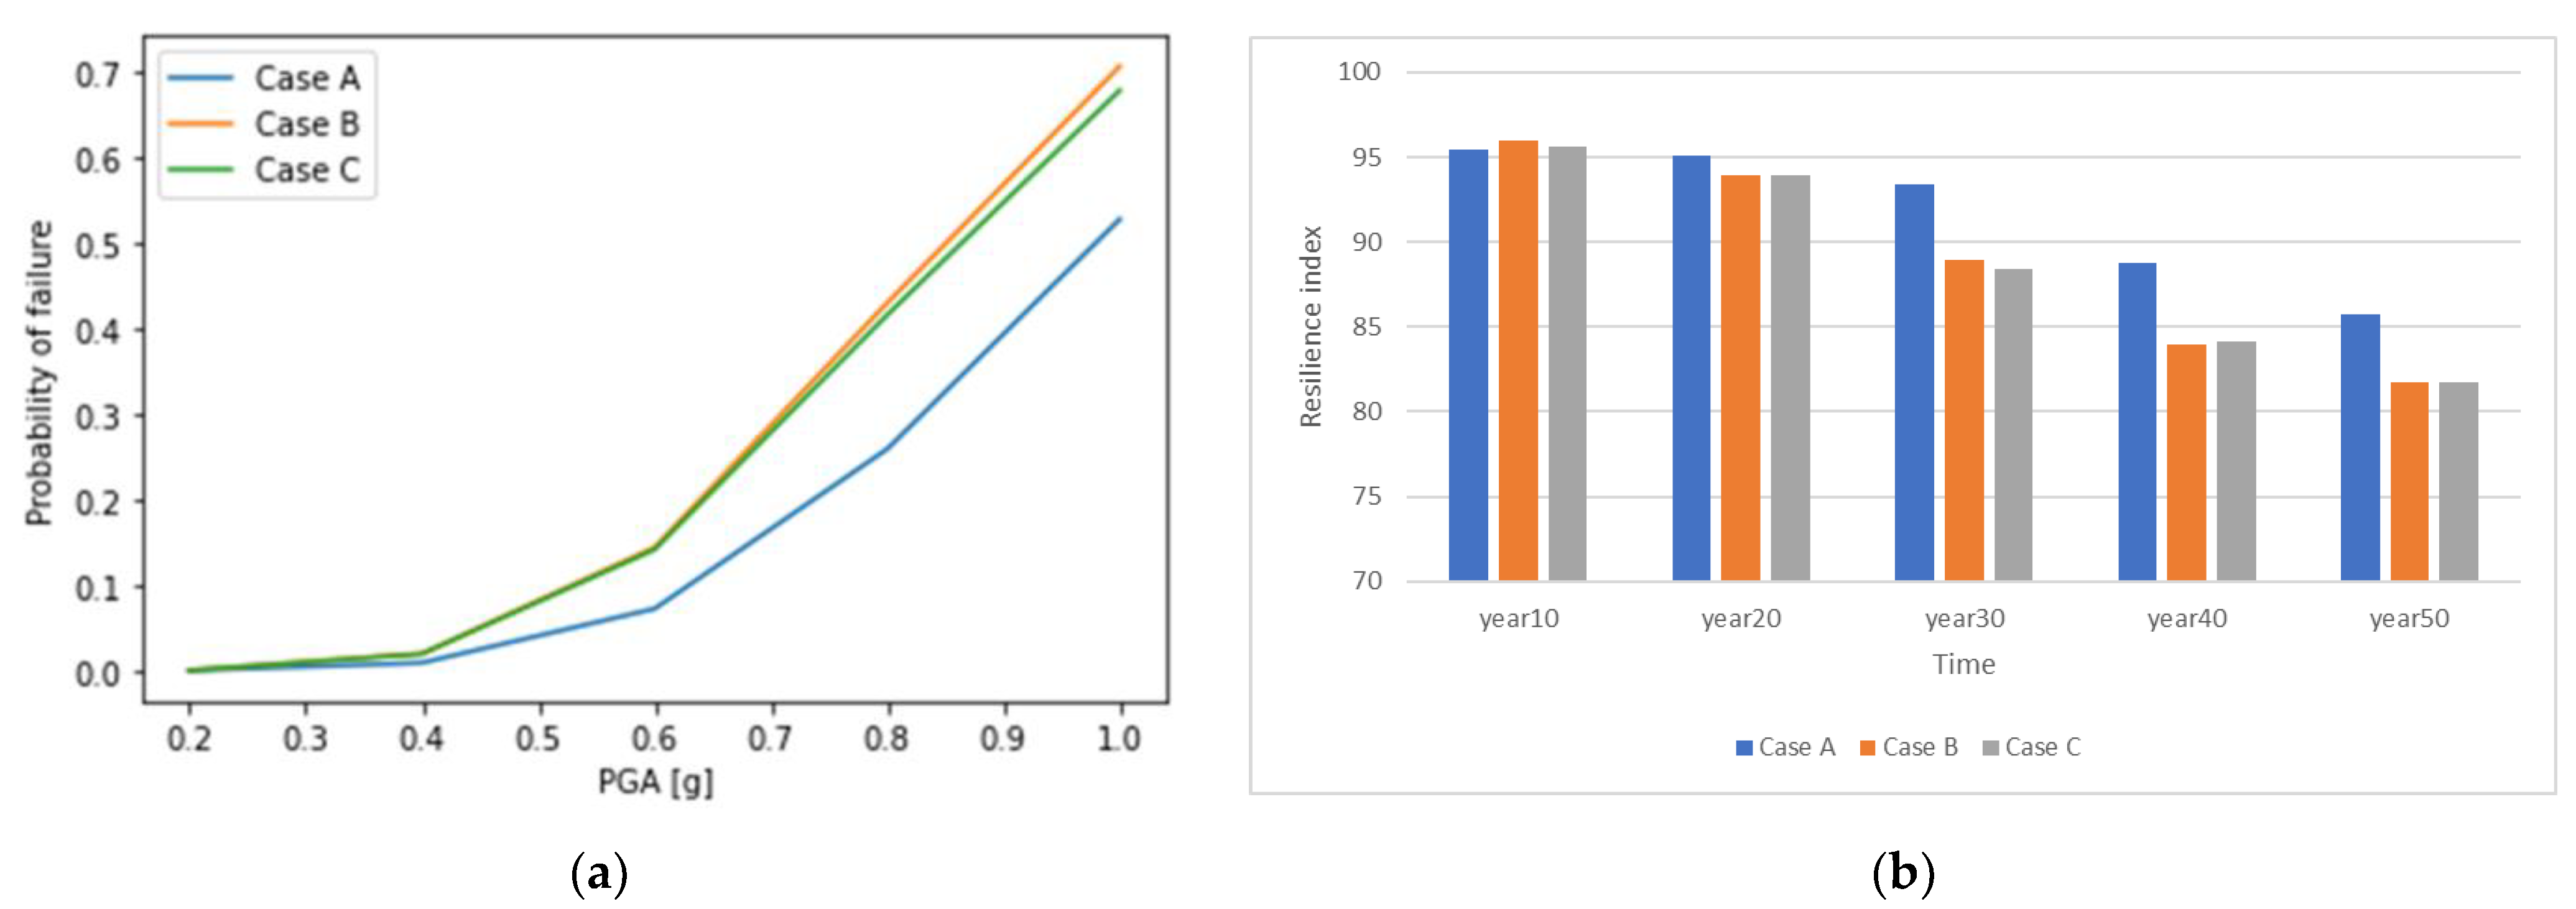
The proposed resilience assessment framework is illustrated with a highway network in South Carolina which was previously used as a case study in [6]. This network is selected as a benchmark problem in this paper because the surrogate seismic fragility curves of various types of bridges located in the network are available in [7]. The bridges in the network are also potentially exposed to marine chloride due to their proximity to the Atlantic Ocean, which makes these bridges more vulnerable to earthquakes over time. In this benchmark problem, two major random variables—chloride concentration and traffic demand—are monitored. After the synthetic analytical, true, and measurement values are generated (see Equations (1) and (2)), the measurement data on chloride concentration are used to update the fragility curves of individual bridges through the dynamic BN. Following a scenario earthquake event (i.e., the 1886 Charleston Earthquake), the failed bridges are realized using Monte Carlo simulation and incorporated in calculating link traffic capacities. On the other hand, analytical traffic demand for each link is forecasted over time using the ARIMA model and subsequently used to generate both synthetic true and measurement values. The total travel time of the network is estimated at every time step from the time of occurrence of the earthquake event to the time to full recovery through the CUBE voyager software program. Finally, the time-dependent performance and resilience of the network are calculated at every 10 years over a 50-year time period. Figure 2a shows the fragility curve of a specific bridge for the three different cases at Year 50: Case A (theoretical values), Case B (true values), and Case C (updated values through dynamic BN). As shown in Figure 2a, Case C is much closer to Case B as compared to Case A, which highlights the advantage of monitoring surface chloride concentration over time. From Figure 2b, a decrease in the resilience index of the network is observed over time mainly due to bridge deterioration and increased traffic demands. Another finding is that as time increases, the degree of overestimation of network seismic resilience by Case A increases. Conversely, Case C maintains a consistent and accurate estimate of network seismic resilience, even in the distant future. This also highlights the significance of monitoring and inspection in reducing uncertainties.

4. Conclusions

Transportation systems are complex and are some of the highest-valued and largest public assets. To better understand transportation system performance during normal and disrupted conditions and ultimately mitigate consequences from hazards, it is critical to characterize uncertainties and reduce them through the efficient implementation of monitoring and inspection tools. To this end, this paper develops a dynamic BN-based resilience assessment model for a large-scale transportation system that can explicitly quantify uncertainties in all phases of the assessment and investigate the role of inspection and monitoring in uncertainty reduction. The benchmark problem results show that monitoring and inspecting major random variables reduces uncertainties in resilience assessment. The proposed model can help officials determine the optimal monitoring technologies and identify critical parameters to be monitored, thereby improving the prediction accuracy of the system resilience.

Author Contributions

Conceptualization, J.Y.L.; methodology, J.Y.L. and V.J.; simulation: V.J.; writing—original draft preparation, V.J. and J.Y.L.; visualization: V.J.; supervision, J.Y.L.; funding acquisition: J.Y.L. All authors have read and agreed to the published version of the manuscript.

Funding

This work was sponsored by the National Center for Transportation Infrastructure Durability & Life Extension (TriDurLE). This support is gratefully acknowledged. Any opinions, findings, conclusions, or recommendations expressed in this material are those of the authors and do not necessarily reflect the views of TriDurLE.

Institutional Review Board Statement

Not applicable.

Informed Consent Statement

Not applicable.

Data Availability Statement

The data that support the findings of this study are available from the corresponding author upon reasonable request.

Conflicts of Interest

The authors declare no conflict of interest. The funders had no role in the design of the study; in the collection, analyses, or interpretation of data; in the writing of the manuscript; or in the decision to publish the results.

References

  1. Bruneau, M.; Chang, S.E.; Eguchi, R.T.; Lee, G.C.; O’Rourke, T.D.; Reinhorn, A.M.; Shinozuka, M.; Tierney, K.; Wallace, W.A.; Von Winterfeldt, D. A framework to quantitatively assess and enhance the seismic resilience of communities. Earthq. Spectra 2003, 19, 733–752. [Google Scholar] [CrossRef] [Green Version]
  2. Chang, S.E.; Shinozuka, M. Measuring improvements in the disaster resilience of communities. Earthq. Spectra 2004, 20, 739–755. [Google Scholar] [CrossRef]
  3. Zheng, X.W.; Li, H.N.; Lv, H.L.; Huo, L.S.; Zhang, Y.Y. Bayesian-based seismic resilience assessment for high-rise buildings with the uncertainty in various variables. J. Build. Eng. 2022, 51, 104321. [Google Scholar] [CrossRef]
  4. Abimbola, M.; Khan, F. Resilience modeling of engineering systems using dynamic object-oriented Bayesian network approach. Comput. Ind. Eng. 2019, 130, 108–118. [Google Scholar] [CrossRef]
  5. Kezhiyur, A.J. Analysis of Age-Dependent Resilience for a Highway Network with Aging Bridges. Master’s Thesis, Pennsylvania State University, State College, PA, USA, 2015. [Google Scholar]
  6. Rokneddin, K.; Ghosh, J.; Dueñas-Osorio, L.; Padgett, J.E. Seismic reliability assessment of aging highway bridge networks with field instrumentation data and correlated failures, II: Application. Earthq. Spectra 2014, 30, 819–843. [Google Scholar] [CrossRef] [Green Version]
  7. Ghosh, J. Parameterized Seismic Fragility Assessment and Life-Cycle Analysis of Aging Highway Bridges. Doctoral Dissertation, Rice University, Houston, TX, USA, 2013. [Google Scholar]
Figure 1. Proposed dynamic BN-based model procedure.
Engproc 36 00029 g001
Figure 2. Comparison of three cases: (a) fragility curve of a bridge at Year 50, and (b) time-dependent seismic resilience index.
Engproc 36 00029 g002
Disclaimer/Publisher’s Note: The statements, opinions and data contained in all publications are solely those of the individual author(s) and contributor(s) and not of MDPI and/or the editor(s). MDPI and/or the editor(s) disclaim responsibility for any injury to people or property resulting from any ideas, methods, instructions or products referred to in the content.