Abstract
Applying the surface-enhanced Raman scattering (SERS) method to detect bioactive molecules such as DNA, proteins, and drugs has significant potential for structure-sensitive nondestructive chemical analysis. The SERS discrimination of single-molecule oligomers in DNA, microRNA, and proteins has attracted wide attention due to the possibility of developing new sensing technology. The collected signal’s sensitivity has the level of detection of single oligomers, which can be compared with the simulation results corresponding to the sensor structure. We investigate the averaging method of the individual bond spectra for DNA nucleotides in the ring part of the pyrimidine (6-ring) and purine (6–5-ring) bases to form vibrational spectra obtained by molecular dynamics (MD) simulation. The system consists of the Au nanoparticles (from 1 to 4 NP assay) attached to a graphene sheet at the edge of the nanopore that localizes in the nanopore nucleotide interaction and spectral enhancement. The nucleotide translocation velocity set at 0.025 m/s compares with the experimental range. The vibrational spectra ring average has been tested for adenine and guanine with close correspondence (in the 500–1700 cm−1 range) to the experimental Raman and SERS spectra and extended to cytosine and thymine nucleotides. We also modified the number of the Au nanoparticles from one NP to four identical NPs to evaluate the influence of the interaction on the MD transient spectra. The variations of mode frequencies and amplitudes due to the number of Au NPs in bond spectra, as well as ring averages, mark the corresponding Au–nucleotide interactions and are considered for use as training sets for machine learning methods.
1. Introduction
Nanophotonic sensing methods based on the SERS detection of DNA, RNA, and protein sequences on solid-state and biological platforms [1,2] have reached single nucleotide or amino acid sensitivity [1,2,3,4,5,6,7,8,9,10,11,12,13]; however, a number of challenges still remain ahead of technological implementation. High sensitivity and selectivity in small volumes have been achieved by the manipulation of plasmonic enhancers used to create hot spots for the measured molecules by using different shapes, assays, and surfaces of gold or silver nanostructures [12,13]. Some methods based on trapping a gold nanoparticle in a localized space of nanohole [14] have been demonstrated. The use of solid-state plasmonic platforms has the advantage of fine-tuning such sensing systems’ physical and chemical properties. However, the time and space resolution of the solid-state platforms still remains the major challenge to oligomer sequencing together with translocation mechanism control. The single-molecule spatial and temporal localization of a nanosized optical hot spot is able to achieve a resolution high enough for single oligomer detection. The principle of the plasmonic nanopore can be applied to enhanced optical spectroscopy for multiplexed DNA and protein sequencing [15]. Each oligomer has its own Raman fingerprint, and discrimination among them has been proven by the use of SERS [16,17]. In addition to distinguishing oligomer molecules in sequencing [18,19], the SERS spectrum could provide additional information on molecular states, including oxidation and methylation [20,21].
For high spatial resolution, nano-objects inside a nanopore for single-molecule SERS measurements must be precisely localized. The duration of the interaction between the oligomer and enhancer should be large enough to ensure a high signal-to-noise ratio in single DNA/protein analysis to acquire a sufficient number of spectra for averages. The typical translocation of a DNA base or an amino acid residual through solid-state nanopores takes nano- to microseconds, while the typical acquisition time takes a millisecond per frame in SERS spectra [22]. The duration of the acquisition process ensures the spectral average of the rotation and conformation motion. The orientation dependence of spectra was confirmed [23] and showed that the orientation of single Rhodamine 6G and oxygenated/deoxygenated states of single hemoglobin could be observed by SERS.
Protein detection using SERS [24,25] demonstrated the typical behavior of a linked single molecule SERS including spectral fluctuations and blinking. From the above problems, the translocation of measured molecules in a designed nanopore can lead to a better signal in the nanopore for the high-speed acquisition of SERS spectra. The different orientations of single oligomers inside the nanopore provide information on the state and interaction of the biomolecule. Various orientations of molecules usually cause the fluctuation of SERS spectra, causing peak shifts, appearances, disappearances, or intensity changes [25]. Therefore, obtained SERS signals will benefit from decoding contributing states and interactions by machine learning algorithms.
Improvement in spatial resolution can be achieved when the sensor can be confined down to the atomic thickness of the 2D material. The atomic thickness also leads to the control of nanopore translocation time and possible changes in molecule orientation to identify oligomers. SERS plasmonic nanoparticles were integrated with a nanopore in a 2D material’s membrane, especially graphene [26,27,28,29,30,31,32] and hexagonal BN [33,34,35,36]. The detection of DNA/RNA oligomers, mononucleotides [37,38,39], and nucleobases [40] with SERS techniques has been demonstrated.
Simulation of the SERS sensors with a configuration close to the experimental one is required to attribute orientation and conformation-dependent spectra of DNA/protein oligomers at the time of relative motion inside the sensing system. The ab initio MD method reproduces high-fidelity orientation-dependent infrared and Raman spectra but remains computationally extensive [41]. The molecular dynamics (MD) method can simulate vibrational spectra over a correlation time span as already time-averaged; however, each bond spectra is estimated individually to ensure orientation and conformation-resolved sensing. In our system, the 2D graphene nanopore is combined with a pyramidal Au nanoparticle (NP) (single vs. four identical pyramids) attached at the edge of the nanopore to form the SERS sensor. Such a design allows guiding the single oligomer through the created “hot” spot [42,43,44]. Individual bond spectra should be averaged to include contributions of multiple bonds into oligomer spectrum. We study the vibrational spectra of the four DNA nucleotides together with the methylated forms of cytosine and adenine in the dynamic interaction with the Au NP attached to the graphene nanopore. For bonds in each nucleobase, averages for two types of nucleotides, purine and pyrimidine, were considered over bonds in the two-carbon nitrogen ring (adenine and guanine) and one-carbon nitrogen ring (thymine and cytosine) in the clockwise direction to include each ring bond. The frequencies and modes that can serve as markers of the corresponding nucleotides and their methylated forms are estimated and compared with existing experimental Raman and SERS spectra. The way to input a nucleotide’s vibrational spectra obtained by MD into a machine learning (ML) random forest algorithm as training sets for spectral recognition is discussed.
2. Model and Methods
The present study uses MD simulation of the system consisting of the following components: nucleotide, Au NP (1 to 4 Au20 pyramidal shaped NP), and single-layer graphene with a nanopore to translocate the nucleotide as seen in Figure 1. With the proven influence of the system components on the vibrational spectra of each part [43,44], the way to collect spectra of individual bonds into the spectra distinguishing each nucleotide and its methylated forms has been tested. The nucleotide vibrational frequencies were attributed to stretching, bending, or ring-breathing modes. The vibrational frequencies of the ring bond were found to incorporate at varying intensity levels (due to atomic velocity vector projections onto all bond axes containing the atom) the spectral modes adjacent to the atom bonds. In the nucleobase, in such a way, ring bond spectra include modes of amino and methyl groups as well as those bonded to the ring oxygen and hydrogen. Therefore, correct averages over ring bond spectra are expected to enhance dominant modes and suppress the off-phase numerical noise.
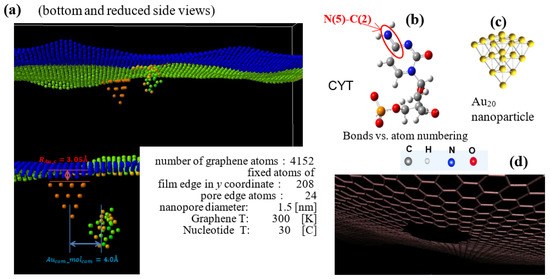
Figure 1.
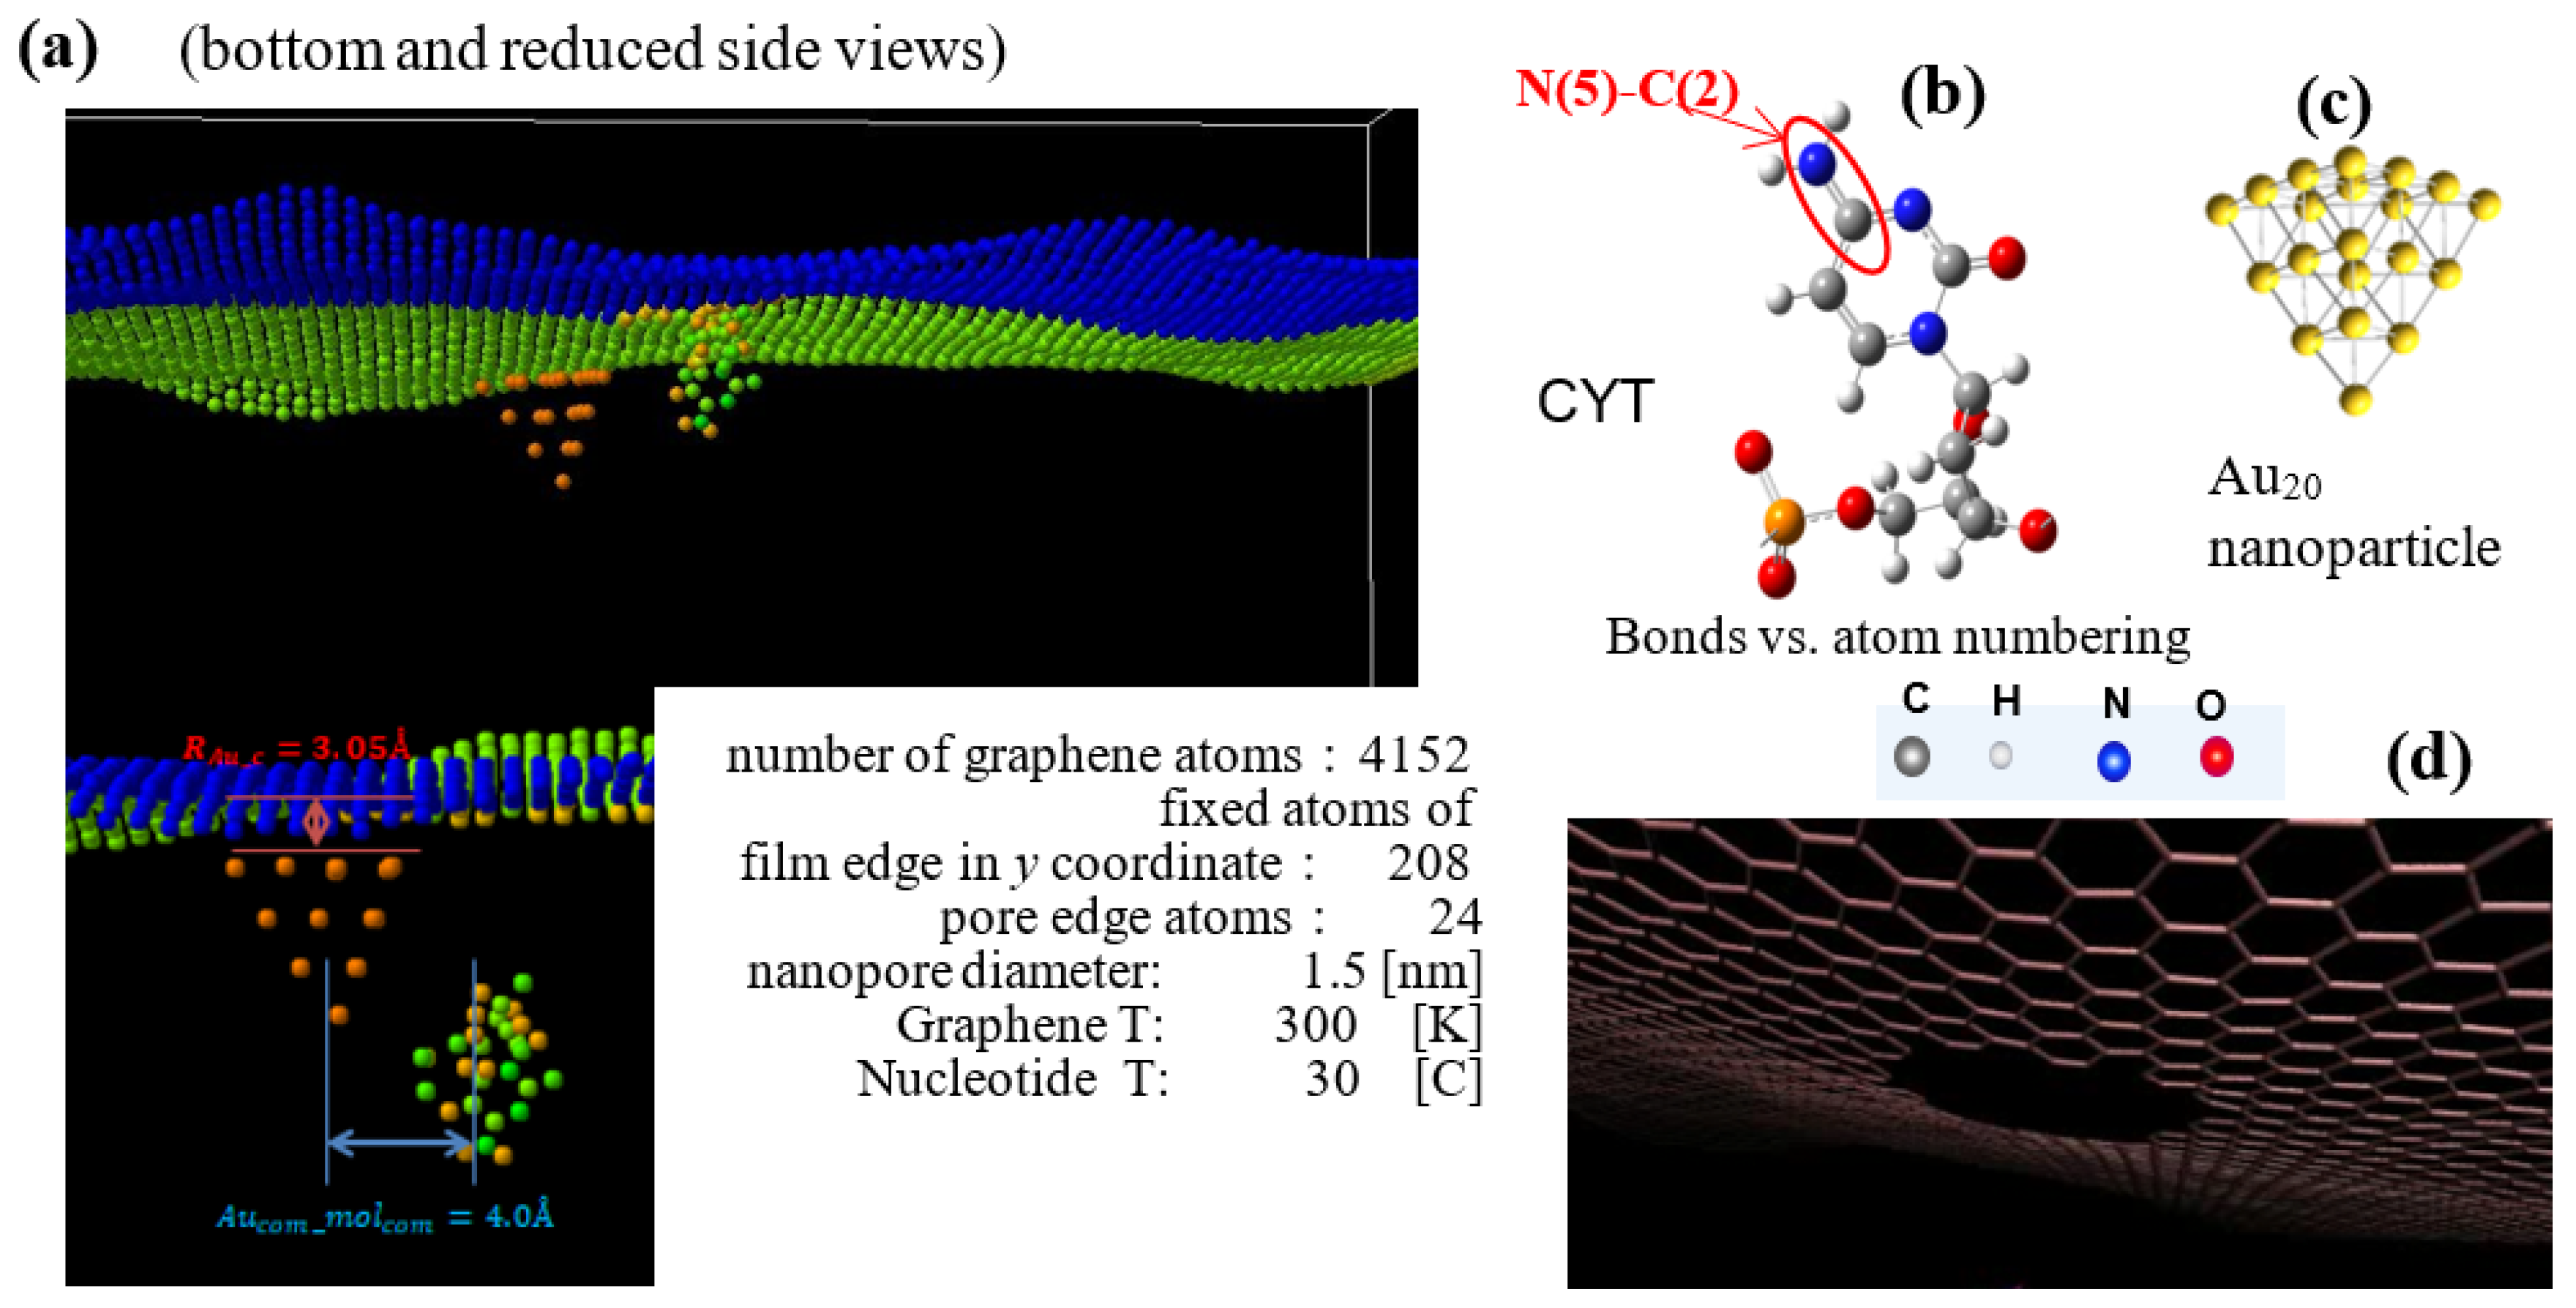
The structure of the SERS sensor in MD calculations (a) The initial translocation position of cytosine nucleotide at and inside of the graphene pore. The orientation of the nucleotide’s cyclic plane is at 30° to the z–x plane. Atoms are shown: C in gray, N in blue, O in red, and H in light gray. (b) Cytosine (right) is shown with an example of corresponding atom numbering for bonds. (c) Au20 nanoparticle optimized by DFT GGA calculations. (d) Nanopore of 1.5 nm diameter with C bonds at its edge in graphene sheet.
For each atom in the bonds of the oligomer, the vibrational density of states (DOS) is calculated during translocation time through the graphene nanopore with attached Au NPs to accumulate all atomic spectra of the oligomer bonds. The calculation method is described in detail in [43,44]. Because the interaction causes shift and/or intensity changes in selected vibration frequencies of the nucleotide spectra, the starting point and translocation speed were the same for each nucleotide and methylated form studied. The initial nucleotide conditions ensure a similar interaction duration with the sensing system for the measured molecule.
The structure of the SERS sensor in MD calculations with components is presented in Figure 1. To the graphene sheet with the 1.5 nm in diameter pore at its center; the pyramidal Au20 NP is attached at the edge of the pore. The initial location of the cytosine nucleotide at the 4 Å distance from the pore edge is selected to maximize the interaction energy with graphene and Au NP without “sticking” to the sensor part of the system. All Van der Waals interactions between the NP, graphene, and the molecule at translocation in the pore are included in the correlation interval by setting the initial oligomer z distance from the pore plane. The graphene sheet is oriented in the x–y-plane, the edges along the y-axis are fixed, and the edges along the x-axis are free. The nucleotide moves with a given added velocity of the center of mass (vc.o.m.) in the positive z-direction that overall reproduces the 0.1–0.01 m/s motion in a constant electric field in the experiments [45,46]. The system atoms, except fixed ones, are thermally relaxed; sampling is completed at 300 K for graphene and 30 °C for nucleotide, as marked in Figure 1. The attachment distance of Au NPs to the graphene surface is 3 Å [47]. The LJ interaction potential between Au NP and graphene has σ(C − Au) = 2.74 Å and ε(C − Au) = 0.022 eV and is truncated at 4.50 Ǻ [47]. In the production run, COM coordinates of the Au NPs have been kept attached to graphene. The graphene–nucleotide and Au NP–nucleotide potentials are considered VdW ones to avoid bond creation and nucleotide attachment in the pore. The extension of the sensor to 4 Au NP is shown in Figure 2.
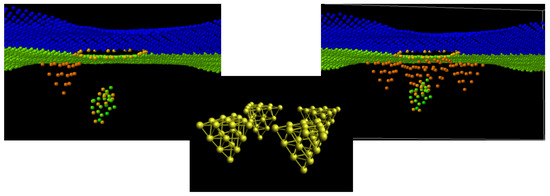
Figure 2.
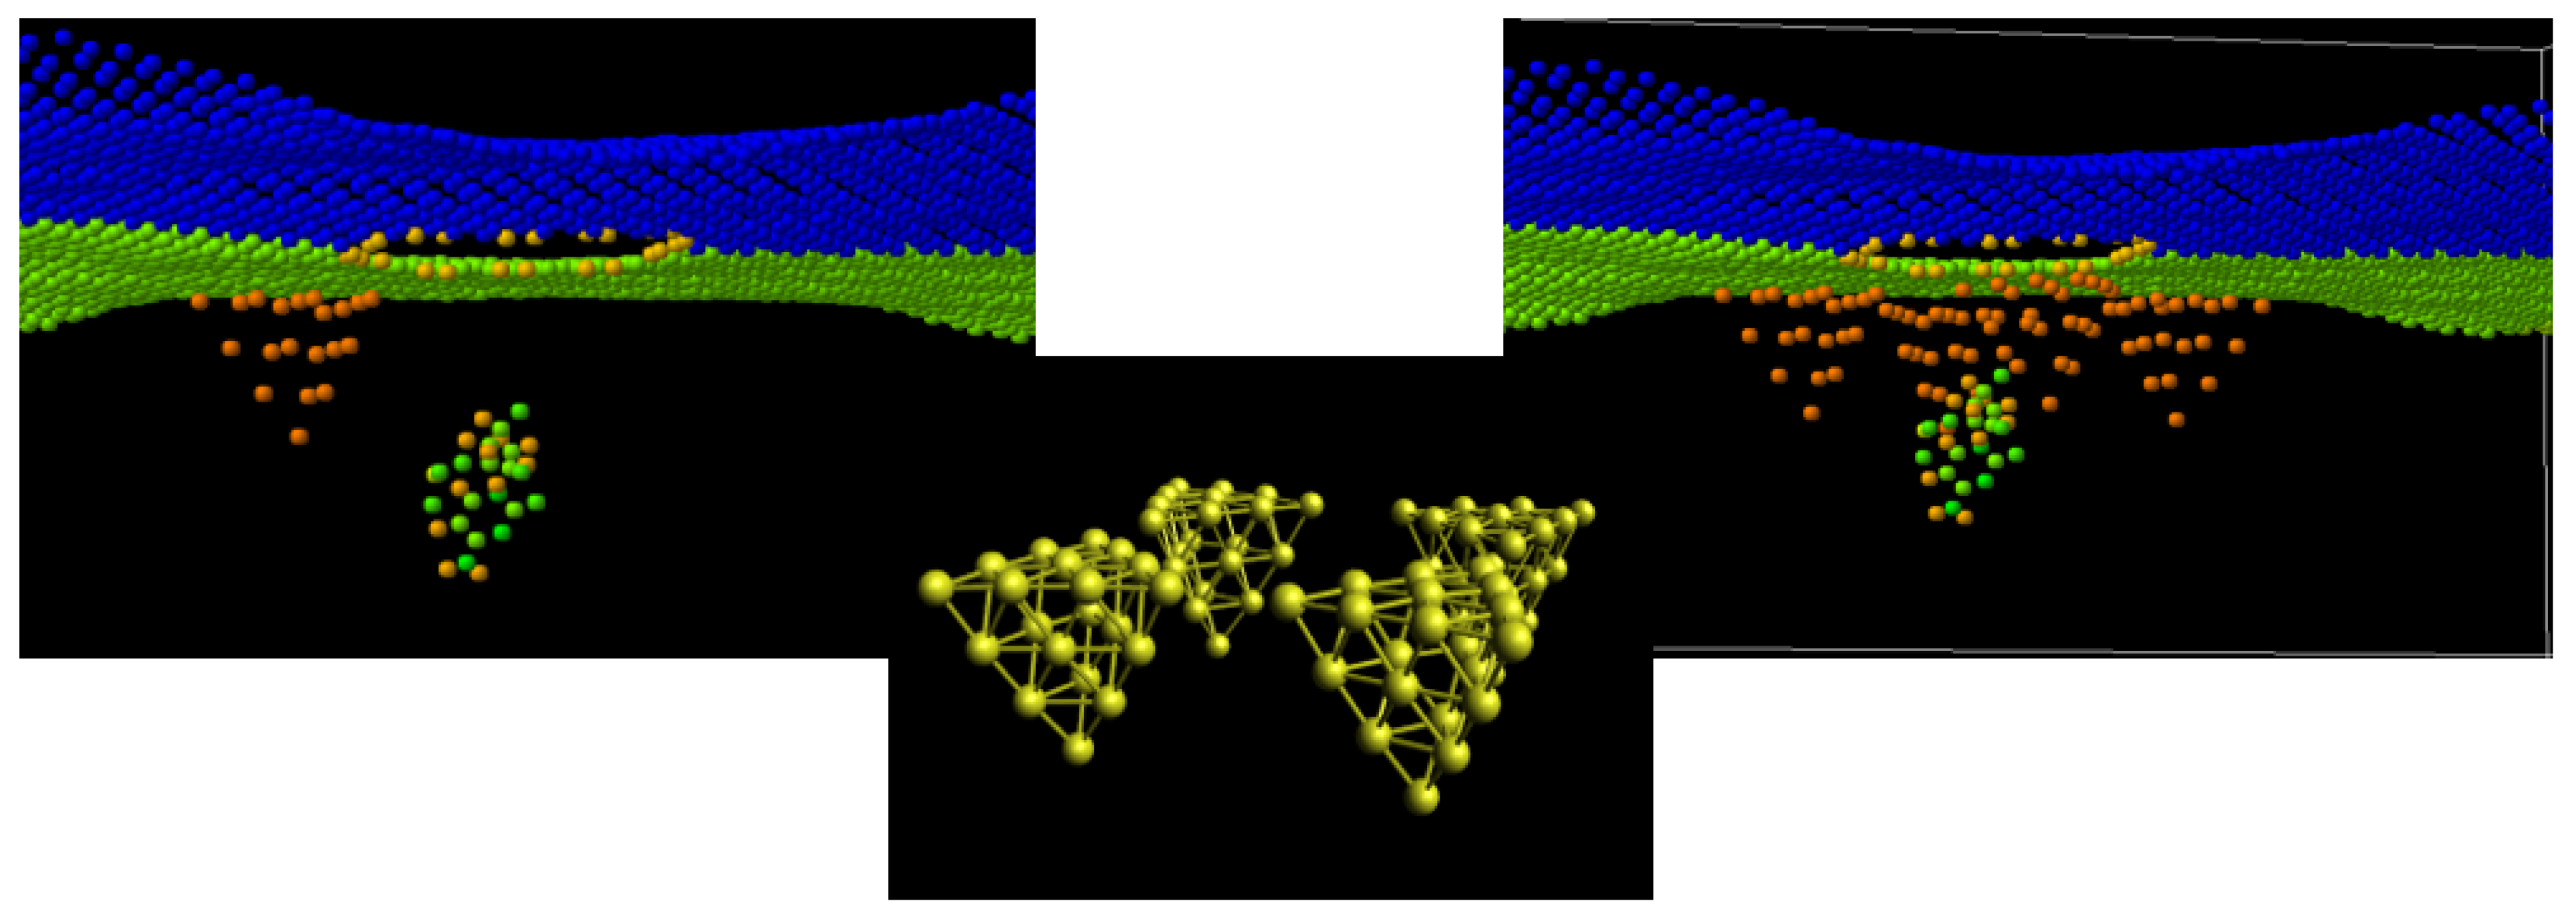
Simulation models with 1 and 4 Au NPs arranged at the edge of the graphene nanopore and cytosine oligomer at the start of translocation. At the central panel, 4 Au NPs are identical and obtained by the rotation of the initial. Interaction between 3 components is Van der Waals.
To resolve the interaction in the sensor, the time step was taken equal to 0.05 fsec with 32,768 steps (1.64 psec) for correlation evaluation at a few vibrational periods [48]. It provides the frequency resolution of vibrational modes at ∆f = 20 cm−1 and frequency interval length above 4000 cm−1 [42,43], which is comparable to the 15 cm−1 half-width of the Lorentzian function in the DFT calculation [49]. Collected single-bond spectra of nucleotides are orientation and conformation-dependent. The spectral resolution has been sufficient to the spectra’s register structural, conformational, and interaction dependence.
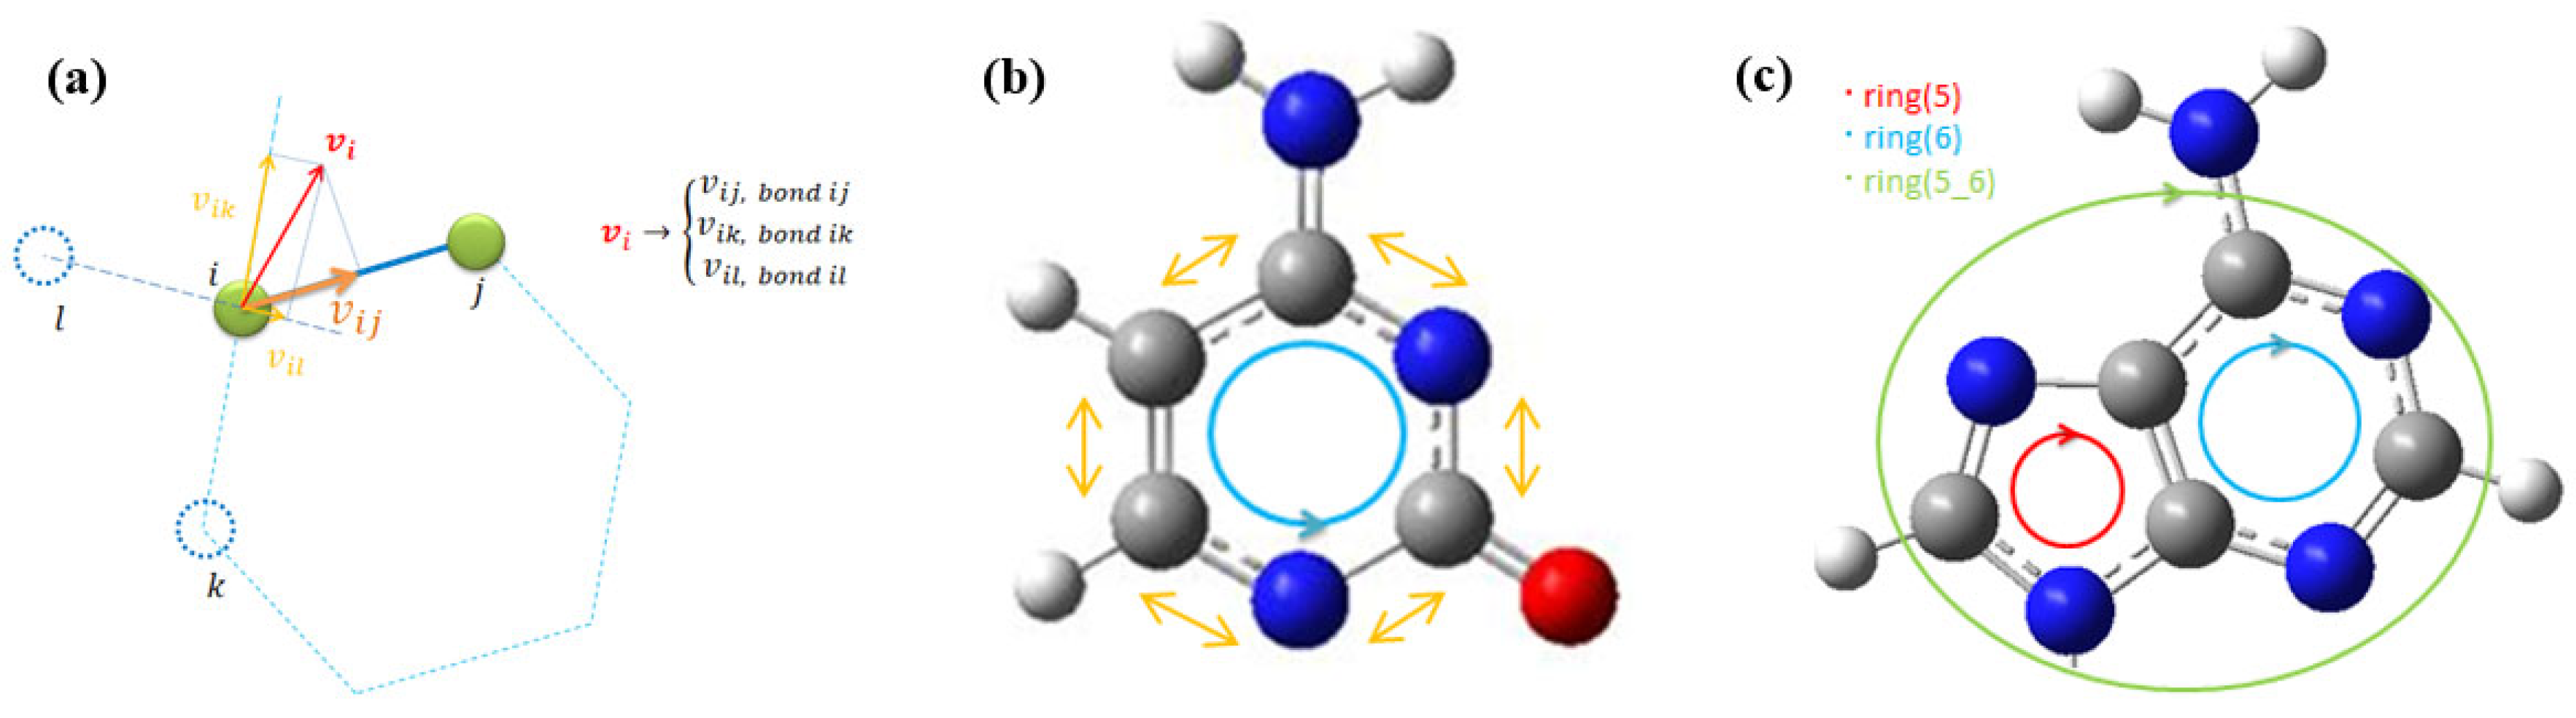
There are two types of numerical noise in the MD spectra. One is from FFT itself; the other is the result of the projection of the velocity vector of the atom onto all bonds by which the atom has been connected to adjacent atoms, as shown in Figure 3a. The velocity autocorrelation function calculation for each bond has introduced low-intensity contributions of the adjacent bond into the calculated spectra. Therefore, only the highest peaks in the spectrum are considered modes of the bond. The velocity vector contains the contribution of all interactions from adjacent bonds at each time step. The procedure of ring averages of the bond’s spectra is shown in Figure 3b,c. The discrete spectral contributions of the atoms in the pyrimidine and purine rings were summed with equal unit weights to obtain nucleotide spectra of cytosine, thymine, adenine, and guanine. For cytosine and adenine, vibrational spectra for the methylated forms of nucleotides were also calculated. The summation of contributions from each bond is performed in a single direction, either clockwise or counterclockwise, including each atom once and only into the single bond of the ring. The ring averages of the nucleotide spectra are introduced to compare them with the experimental Raman and SERS spectra. Averaging enhances modes distributed between adjacent bonds to an atom and cancels numerical noise in the spectra. That corresponds to measurement acquiring multiple spectra at time intervals summed up to enhance the modes. In MD, the correlation of time steps and time interval relates to the accumulation of experimental spectra but the spectral map of each molecule bond cannot be compared directly with the experiment. Therefore, the proposed ring averages can evaluate the cumulative vibrational spectra of oligomers comparable with experimental ones.

Figure 3.
(a) The scheme of the velocity vector projection of the atom on the adjacent bond axes in an autocorrelation function for each bond spectra, (b) the ring bond spectral averages in pyrimidine bases (averaged bonds are marked by yellow arrows, direction of bond summation is shown by blue circle with arrow), (c) the ring averages of purine bases with each atom spectra averaged only once in both pyrimidine (ring 6) and imidazole (ring 5) parts (direction of ring average is shown by blue and red circles, the bond connecting two rings is accounted for only once).
3. Results
In the current study, we estimated ring-averaged vibrational spectra for the four DNA nucleotides and the methylated forms of cytosine and adenine. Obtained spectra were compared to the results of the usual Raman measurement and the SERS experiments. The way to treat obtained MD vibrational spectra by machine learning random forest algorithm is also considered as related to the type of obtained data.
3.1. Ring Average Procedure for Pyridine Type of Nucleotides
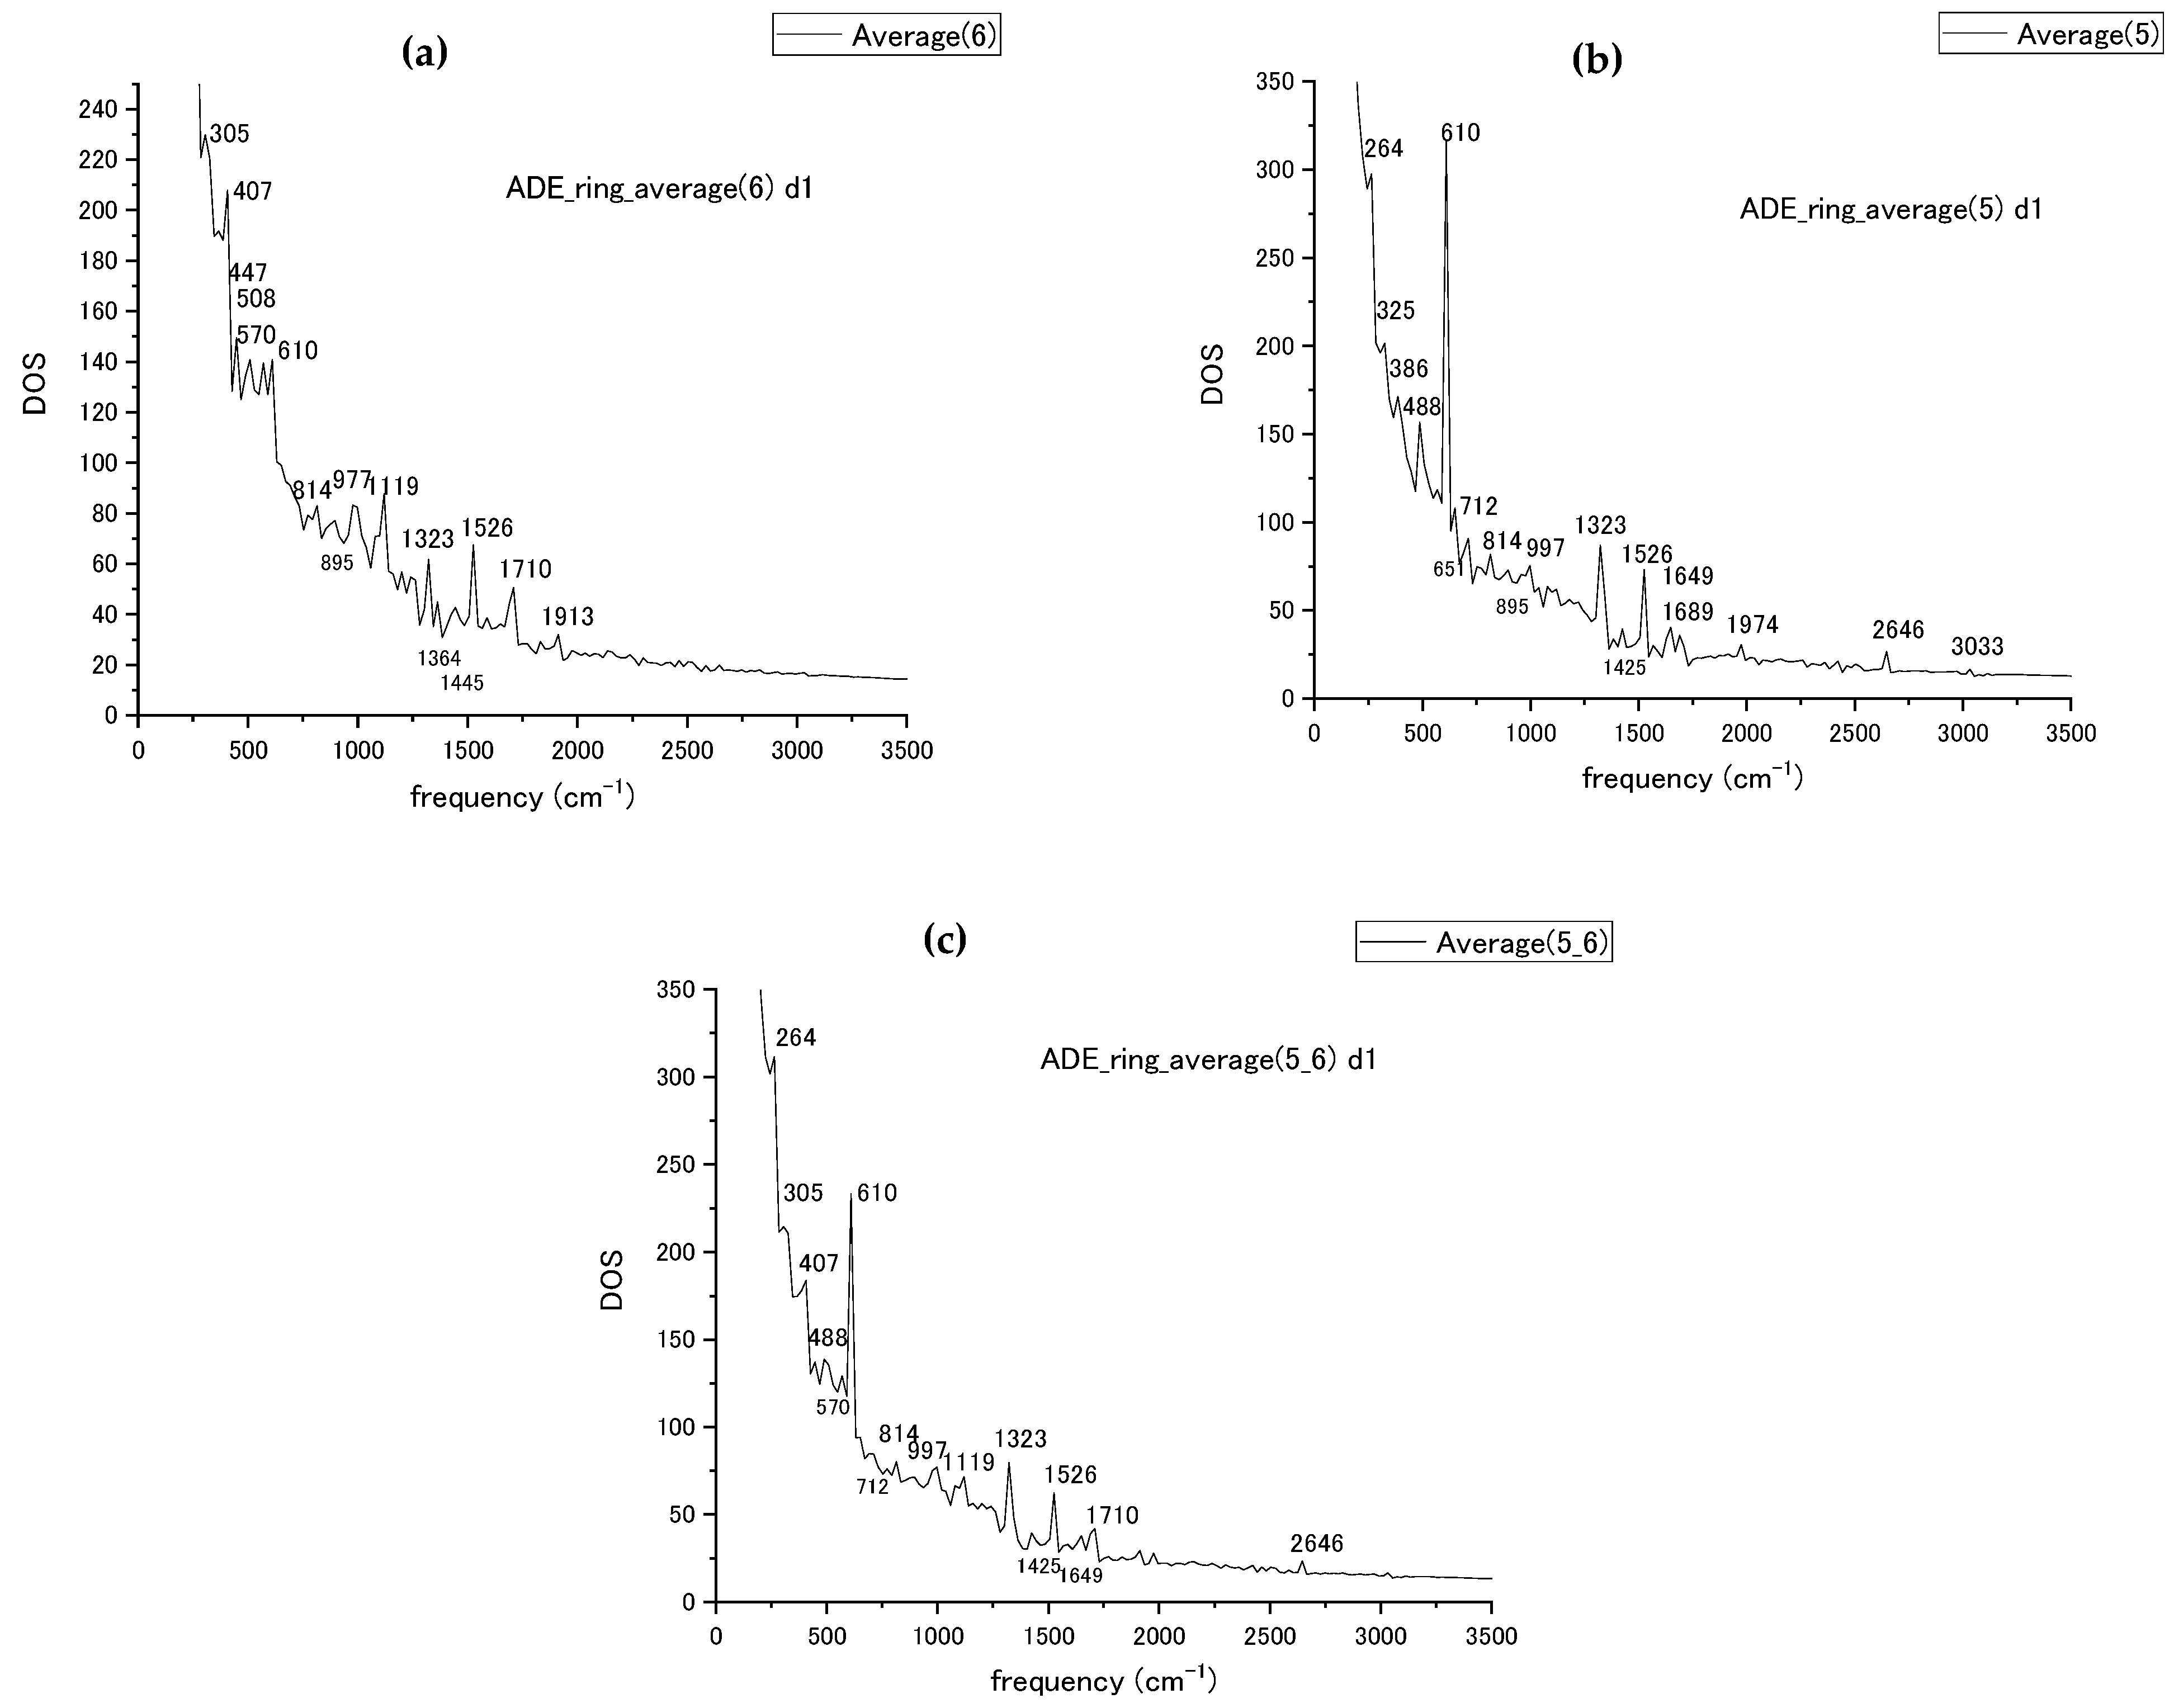
The ring average procedure has been tested for the adenine nucleotide first. The obtained by MD simulation averaged spectra are shown in Figure 4 for each of the pyrimidine and imidazole (rings 6 and 5) rings and for the combined rings. The averaged results were compared with the experimentally obtained Raman [50] spectra for DNA bases and SERS [51] spectra of single-stranded DNA fragments for the case of adenine; the high peak values of calculated spectra are compiled in Table 1 from Figure 4 together with data from the experiments [50,51]. The comparison of calculated frequencies with the experimentally measured ones with the suggested attribution of vibrational modes from [50,51] is compiled in Table 1 for the frequency range up to 2000 cm−1. Experimental measurements are taken for nucleobases only in ref. [50], while ref. [51] represents SERS data for single-strand fragments measured in a different environment. The mode attribution is taken from the experimental data. The numbering of atoms in Table 1 is taken from ref. [50] (Figure 4 and Table 1) with the corresponding number of atoms referenced there reproduced in Table 1. The MD-calculated modes with frequencies close in value to the measured ones are placed into the same table row. In the ring average, we could reproduce the stretching modes of the bond inside or attached to ring with a relatively high accuracy at 997 cm−1, 1119 cm−1, 1323 cm−1, and 1425 cm−1. The ring breathing and stretching modes at 712 cm−1 and 1526 cm−1 were also reproduced within 30 cm−1 compared to the experimental results. Among bending and ring deformation modes with frequencies below 700 cm−1, the 305 and 610 cm−1 bending modes are reproduced.
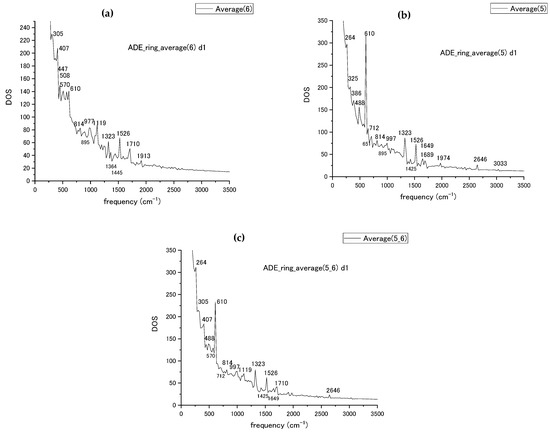
Figure 4.
(a) The vibrational spectra of adenine pyrimidine ring (ring 6), (b) imidazole ring (ring 5), (c) the combined spectra for both rings of adenine with peak frequency values marked by numbers.

Table 1.
Comparison of the experimentally available adenine Raman modes, ref. [50] and ref. [51], with our ring-averaged results shown in Figure 4. The stretching and bending modes are indicated by letters (s) and (b). Attribution atom numbering is from Figure 4 and Table 3 in ref. [50]. Reprinted with permission from Ref. [50]. Copyright 1986 John Wiley & Sons, Ltd.
The ring-averaging procedure leaves a large number of defined bending modes and reduces the number of well-defined stretching modes compared with the number of experimentally measured modes. These experimental frequencies not represented in the averages should be mostly attributed to the bond attached to the ring. Therefore, in addition to the ring averages, the bonds attached to the ring should be weighed and added to the whole spectra. The values of weight that could be utilized in averaging for the bonds attached to the ring are subject to study.
3.2. Methylated Forms of Cytosine and Adenine
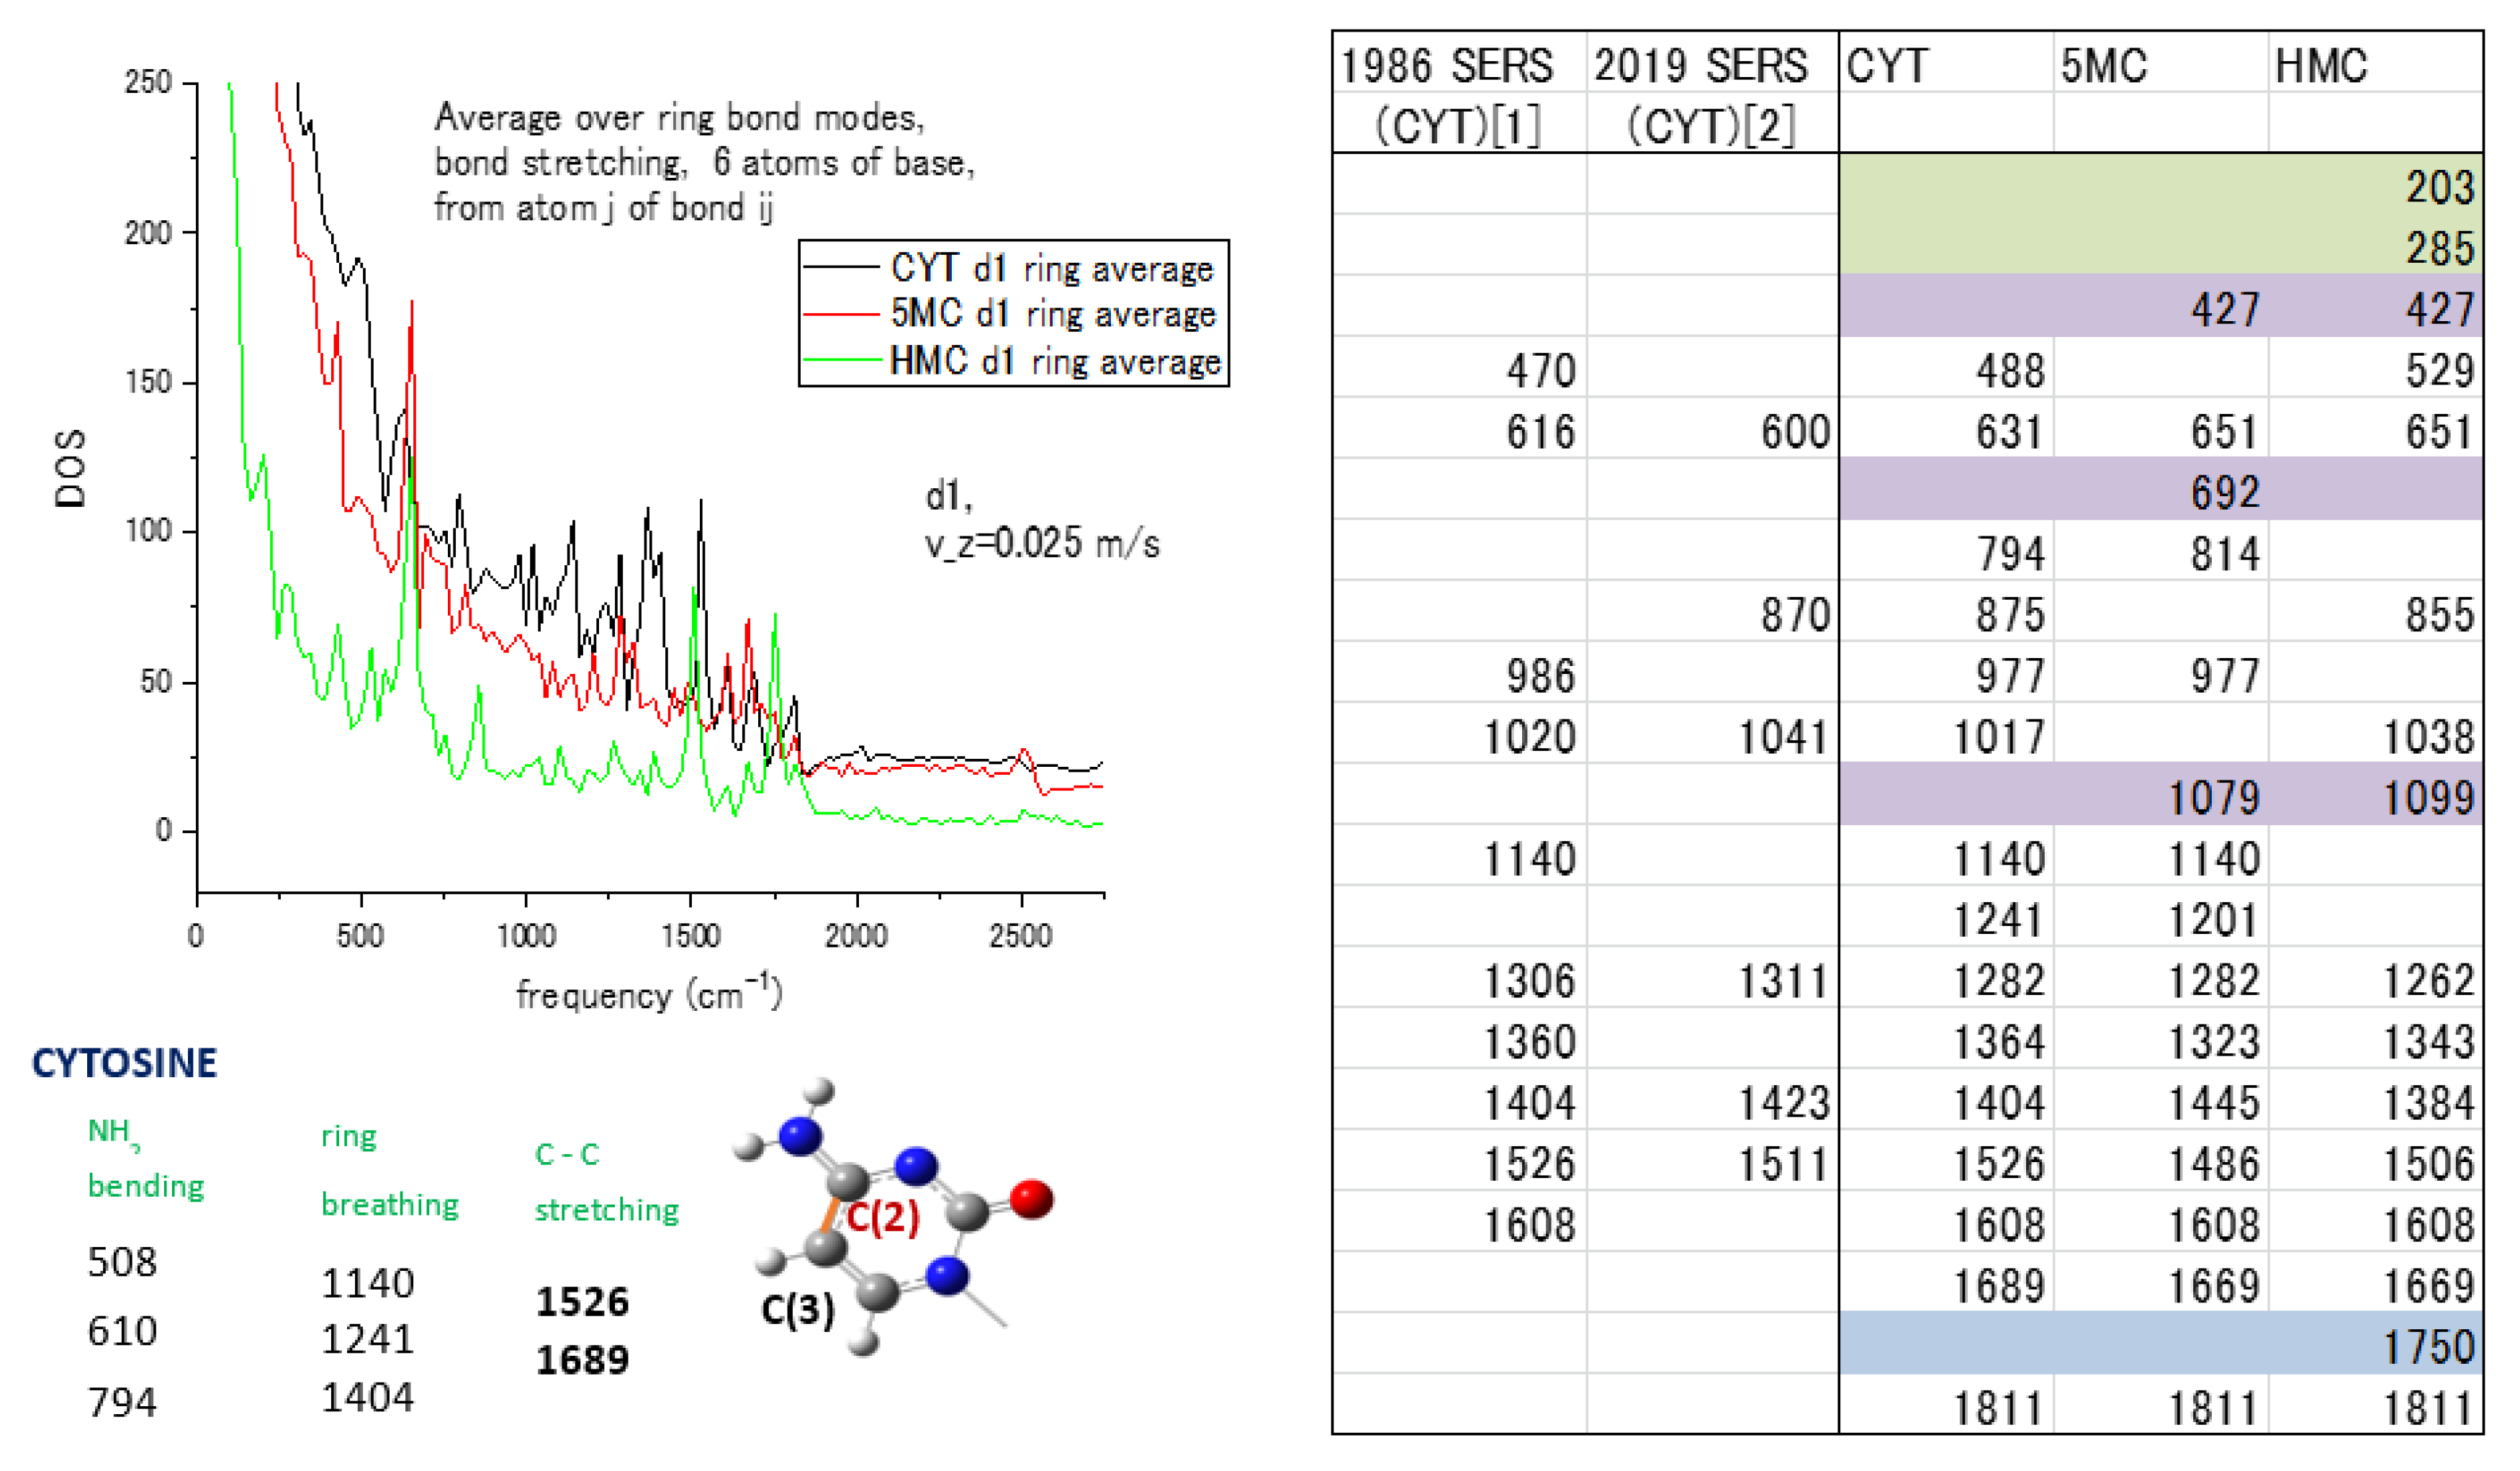
The vibrational spectra of the methylated forms of the cytosine and adenine nucleotides are subjected to the ring-averaging procedure to understand the influence of the adjacent bonds on the unit weight of the ring bond in the average. The weights of each atom in ring bonds are maintained for all three cytosine forms, cytosine itself (CYT), 5-methylcytosine (5MC), and 5-hydroxymethylcytosine (HMC), for the vibrational spectra to be ring-averaged. The result in Figure 5 includes the spectra for all three forms with our modes attribution [44] for cytosine in the left panel and a table of comparison of the MD calculated modes with the measured SERS frequencies [50,51] in the right panel. The comparison of MD with SERS modes of CYT [1] from ref. [50] and CYT [2] from ref. [51] for cytosine is given in the right panel of Figure 5. Modes marked in color are present only in methylated forms of cytosine and have no corresponding experimental values that let us distinguish methylated forms by differences in spectra. The 203 and 285 cm−1 modes relate to ring deformation and the presence of N atoms in the ring. The 5-methyl and hydroxymethyl groups are attached to the C(3) atom of the ring as marked on the left pane, and the attachment will lead to changes in the stretching and bending modes at 427, 692, and 1079 cm−1. The amino group NH2 causes changes in the 1750 cm−1 mode for HMC. It shows the possibility of spectral separation of the methylated forms by the presence or absence of indicating modes in cytosine vibrational spectra.
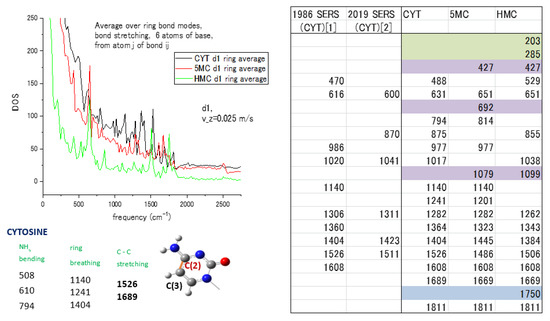
Figure 5.
Spectra and modes of cytosine (CYT) with methylated forms 5-Metylcytosine (5MC) and 5-Hydroxymethylcytosine (HMC): (Left pane) ring average of the spectra for 3 forms with mode attribution [44] of cytosine; (Right pane) comparison of MD and experimental SERS modes, with CYT[1] from ref. [50] and CYT[2] from ref. [51] for cytosine nucleotide, modes marked in color are present only in methylated forms of cytosine and have no corresponding experimental values. Reprinted with permission from Ref. [50]. Copyright 1986 John Wiley & Sons, Ltd.
3.3. Stability of the MD Vibrational Spectra vs. Interaction with 1 and 4 Au NP
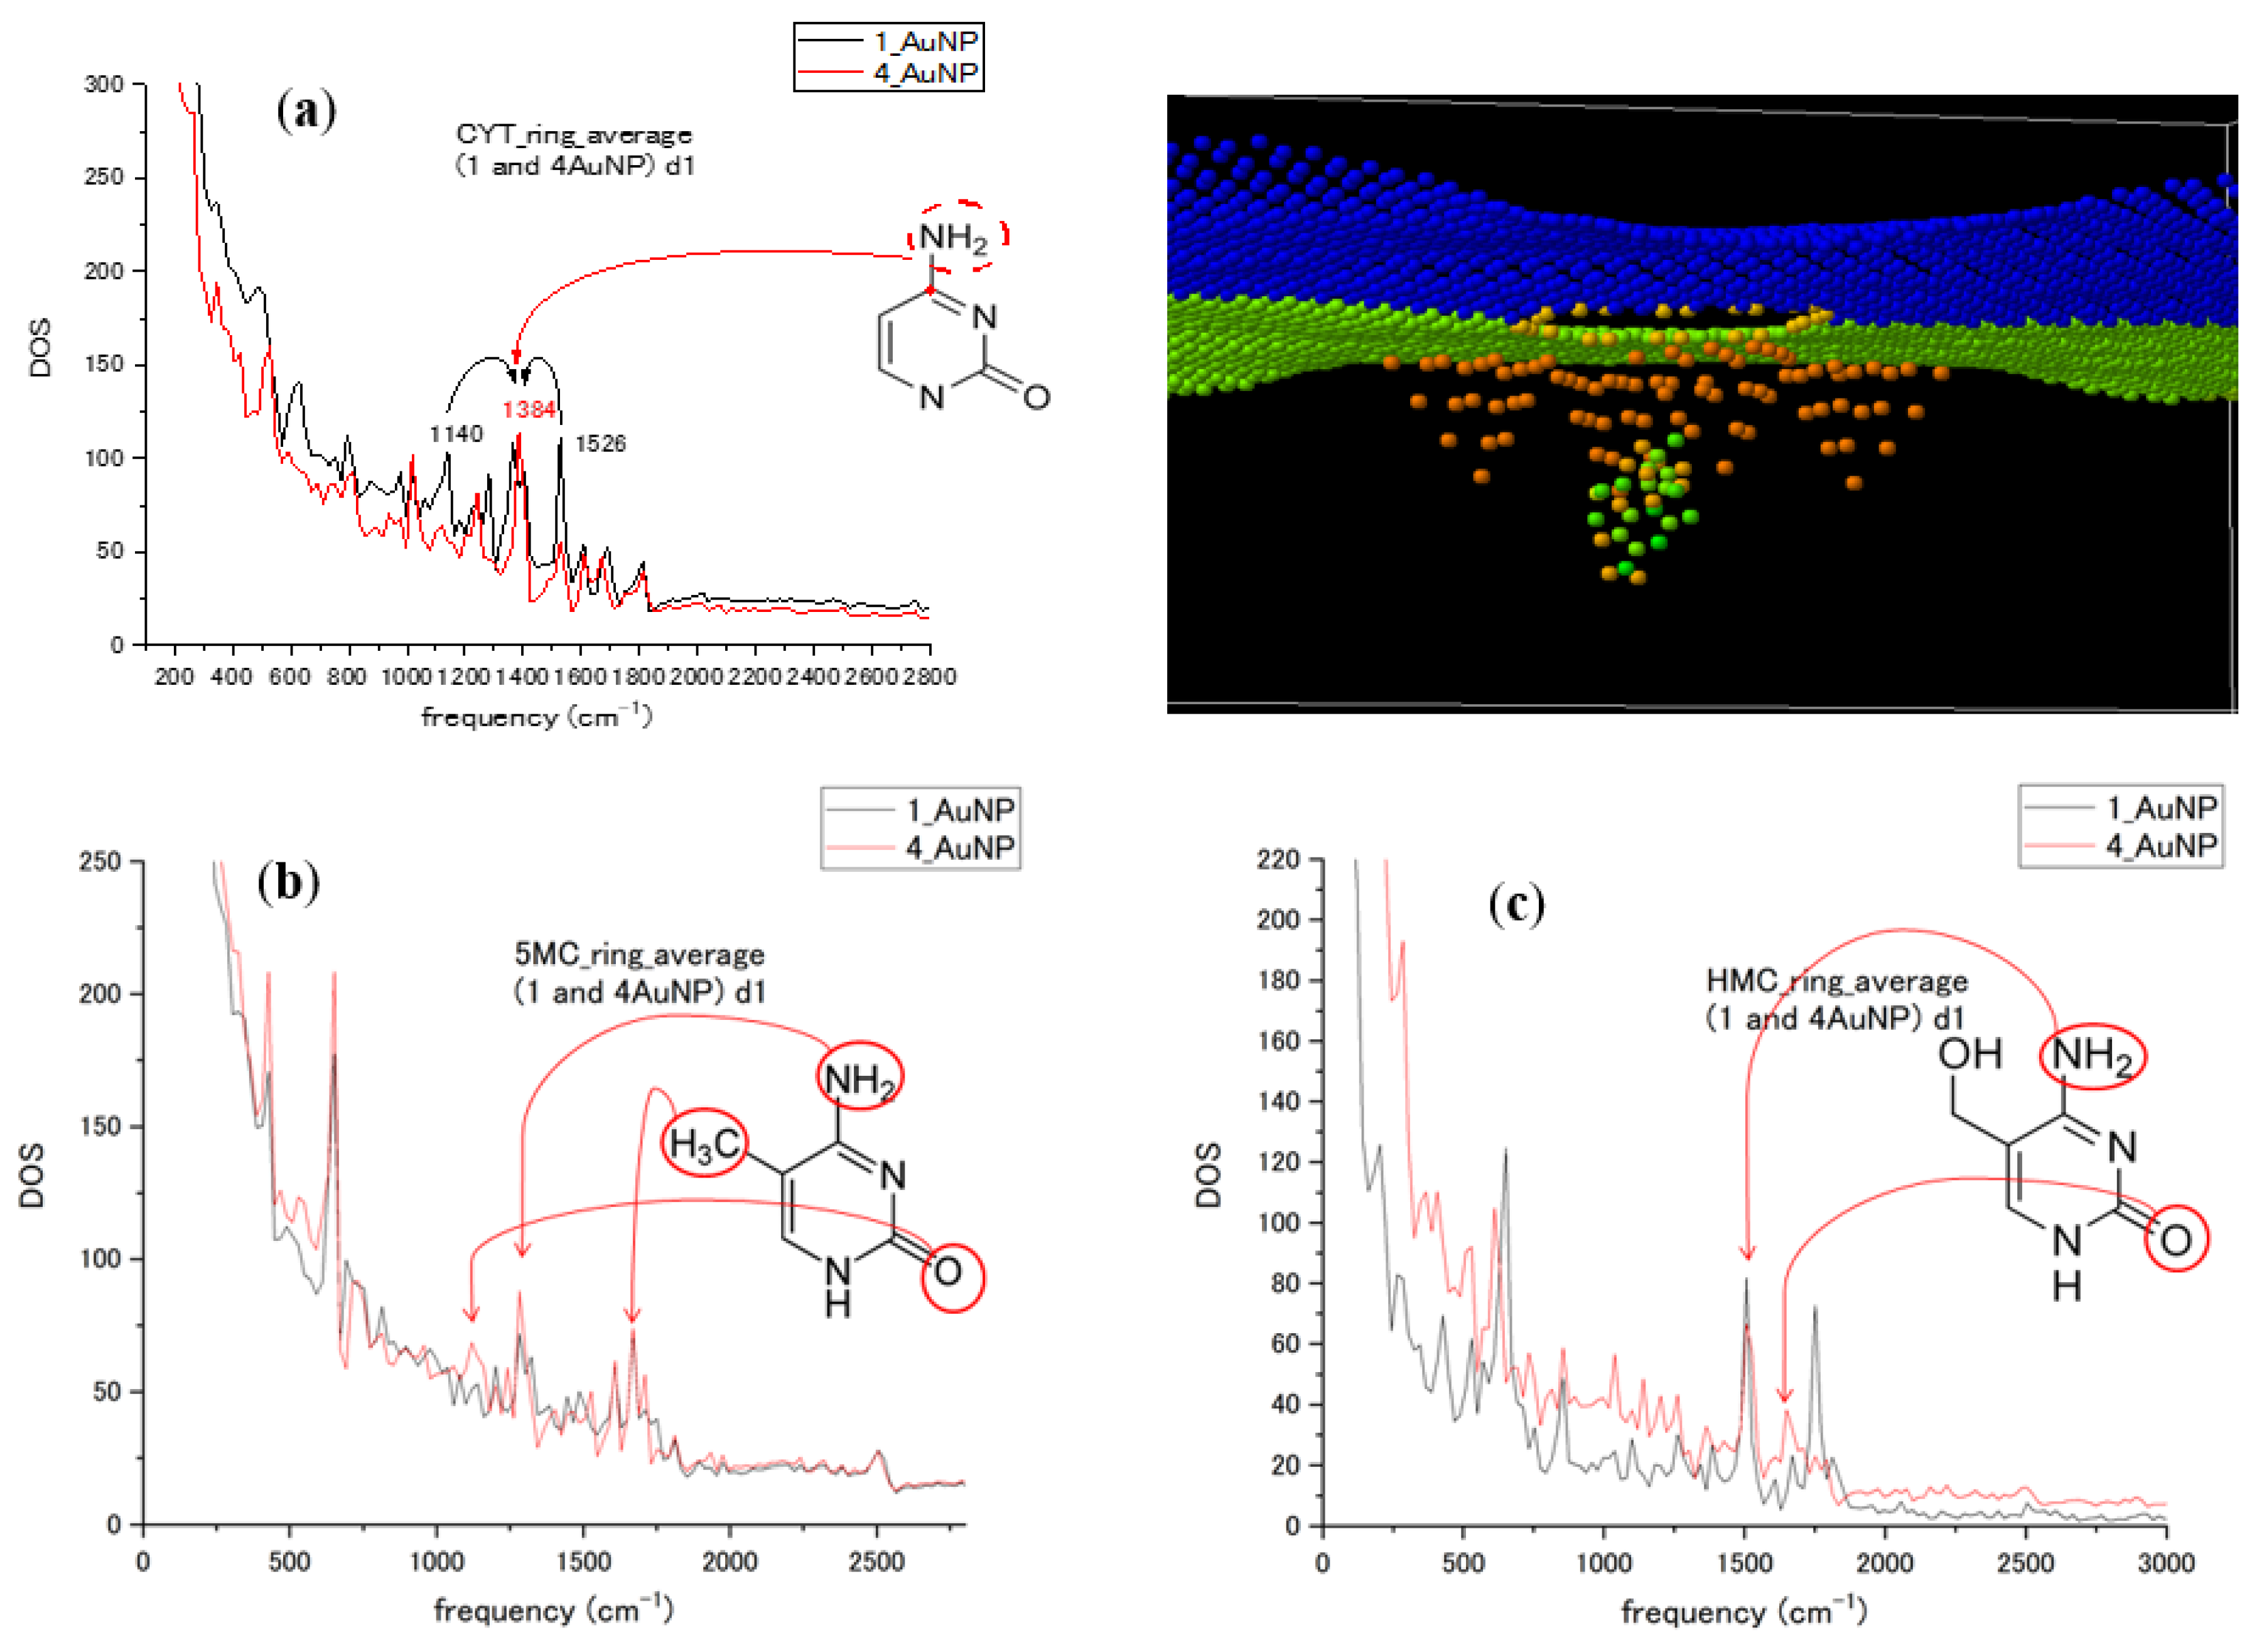
To introduce multiple NPs, we compared the influence of the number of Au NPs (one and four nanoparticles) on the spectra for cytosine and its methylated forms for nucleotides passing through the Au NP–graphene sensor. The different numbers of Au NPs influence the orientation and conformation of the nucleotides in the sensor during translocation and might influence the interaction duration and strength. The graphs in Figure 6 compare the ring-averaged spectra of CYT, 5MC, and HMC in the case of one and four attached Au NPs. There was a similarity in the frequency or intensity of the peaks, with changes in some modes being revealed. A simple increase in the number of metal particles did not strongly increase the intensity of the peaks. Many of the peaks with increased intensity were vibration modes related to the O atom, methyl group CH3, and amino group NH2 attached to the pyrimidine ring. Interactions with the different numbers of Au NPs of ring-bonded groups lead to the relaxation of vibrational energy to other modes in the MD model. The attribution groups are shown for some high peaks in spectra for CYT, 5MC, and HMC in Figure 6. We can see spectral changes in the form of the largest contributions into the ring averages due to ring-bonded atoms and the redistribution of mode intensities and possible slight mode shifts in 1100–1700 cm−1 interval that represents stretching modes in the ring and adjacent bonds. Therefore, instant values of modes will depend on the design of plasmon enhancer particles in such a type of SERS sensor. The starting orientation of all three forms of cytosine nucleotide was kept the same. However, the presence of methyl and hydroxyl groups influenced the conformational motion of methylated forms during translocation, enhancing different frequency modes.
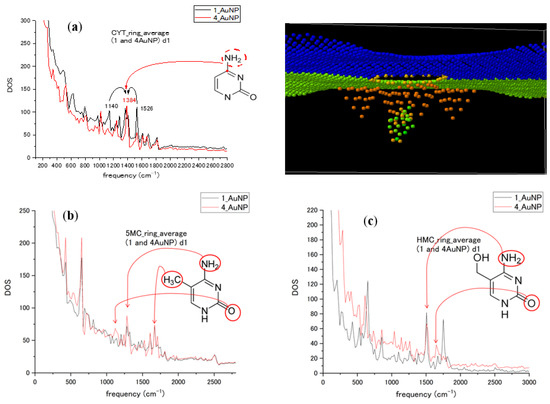
Figure 6.
(a) Cytosine nucleotide ring average spectra calculated for 1 and 4 Au NPs attached to graphene nanopore (as shown in the upper right pane); (b) the corresponding spectra of 5-methylcytosine; (c) the spectra of 5-hydroxymethylcytosine. Attribution of some spectral peaks is shown for each form of cytosine.
3.4. Utilization of Machine Learning Algorithms for MD Spectra Recognition
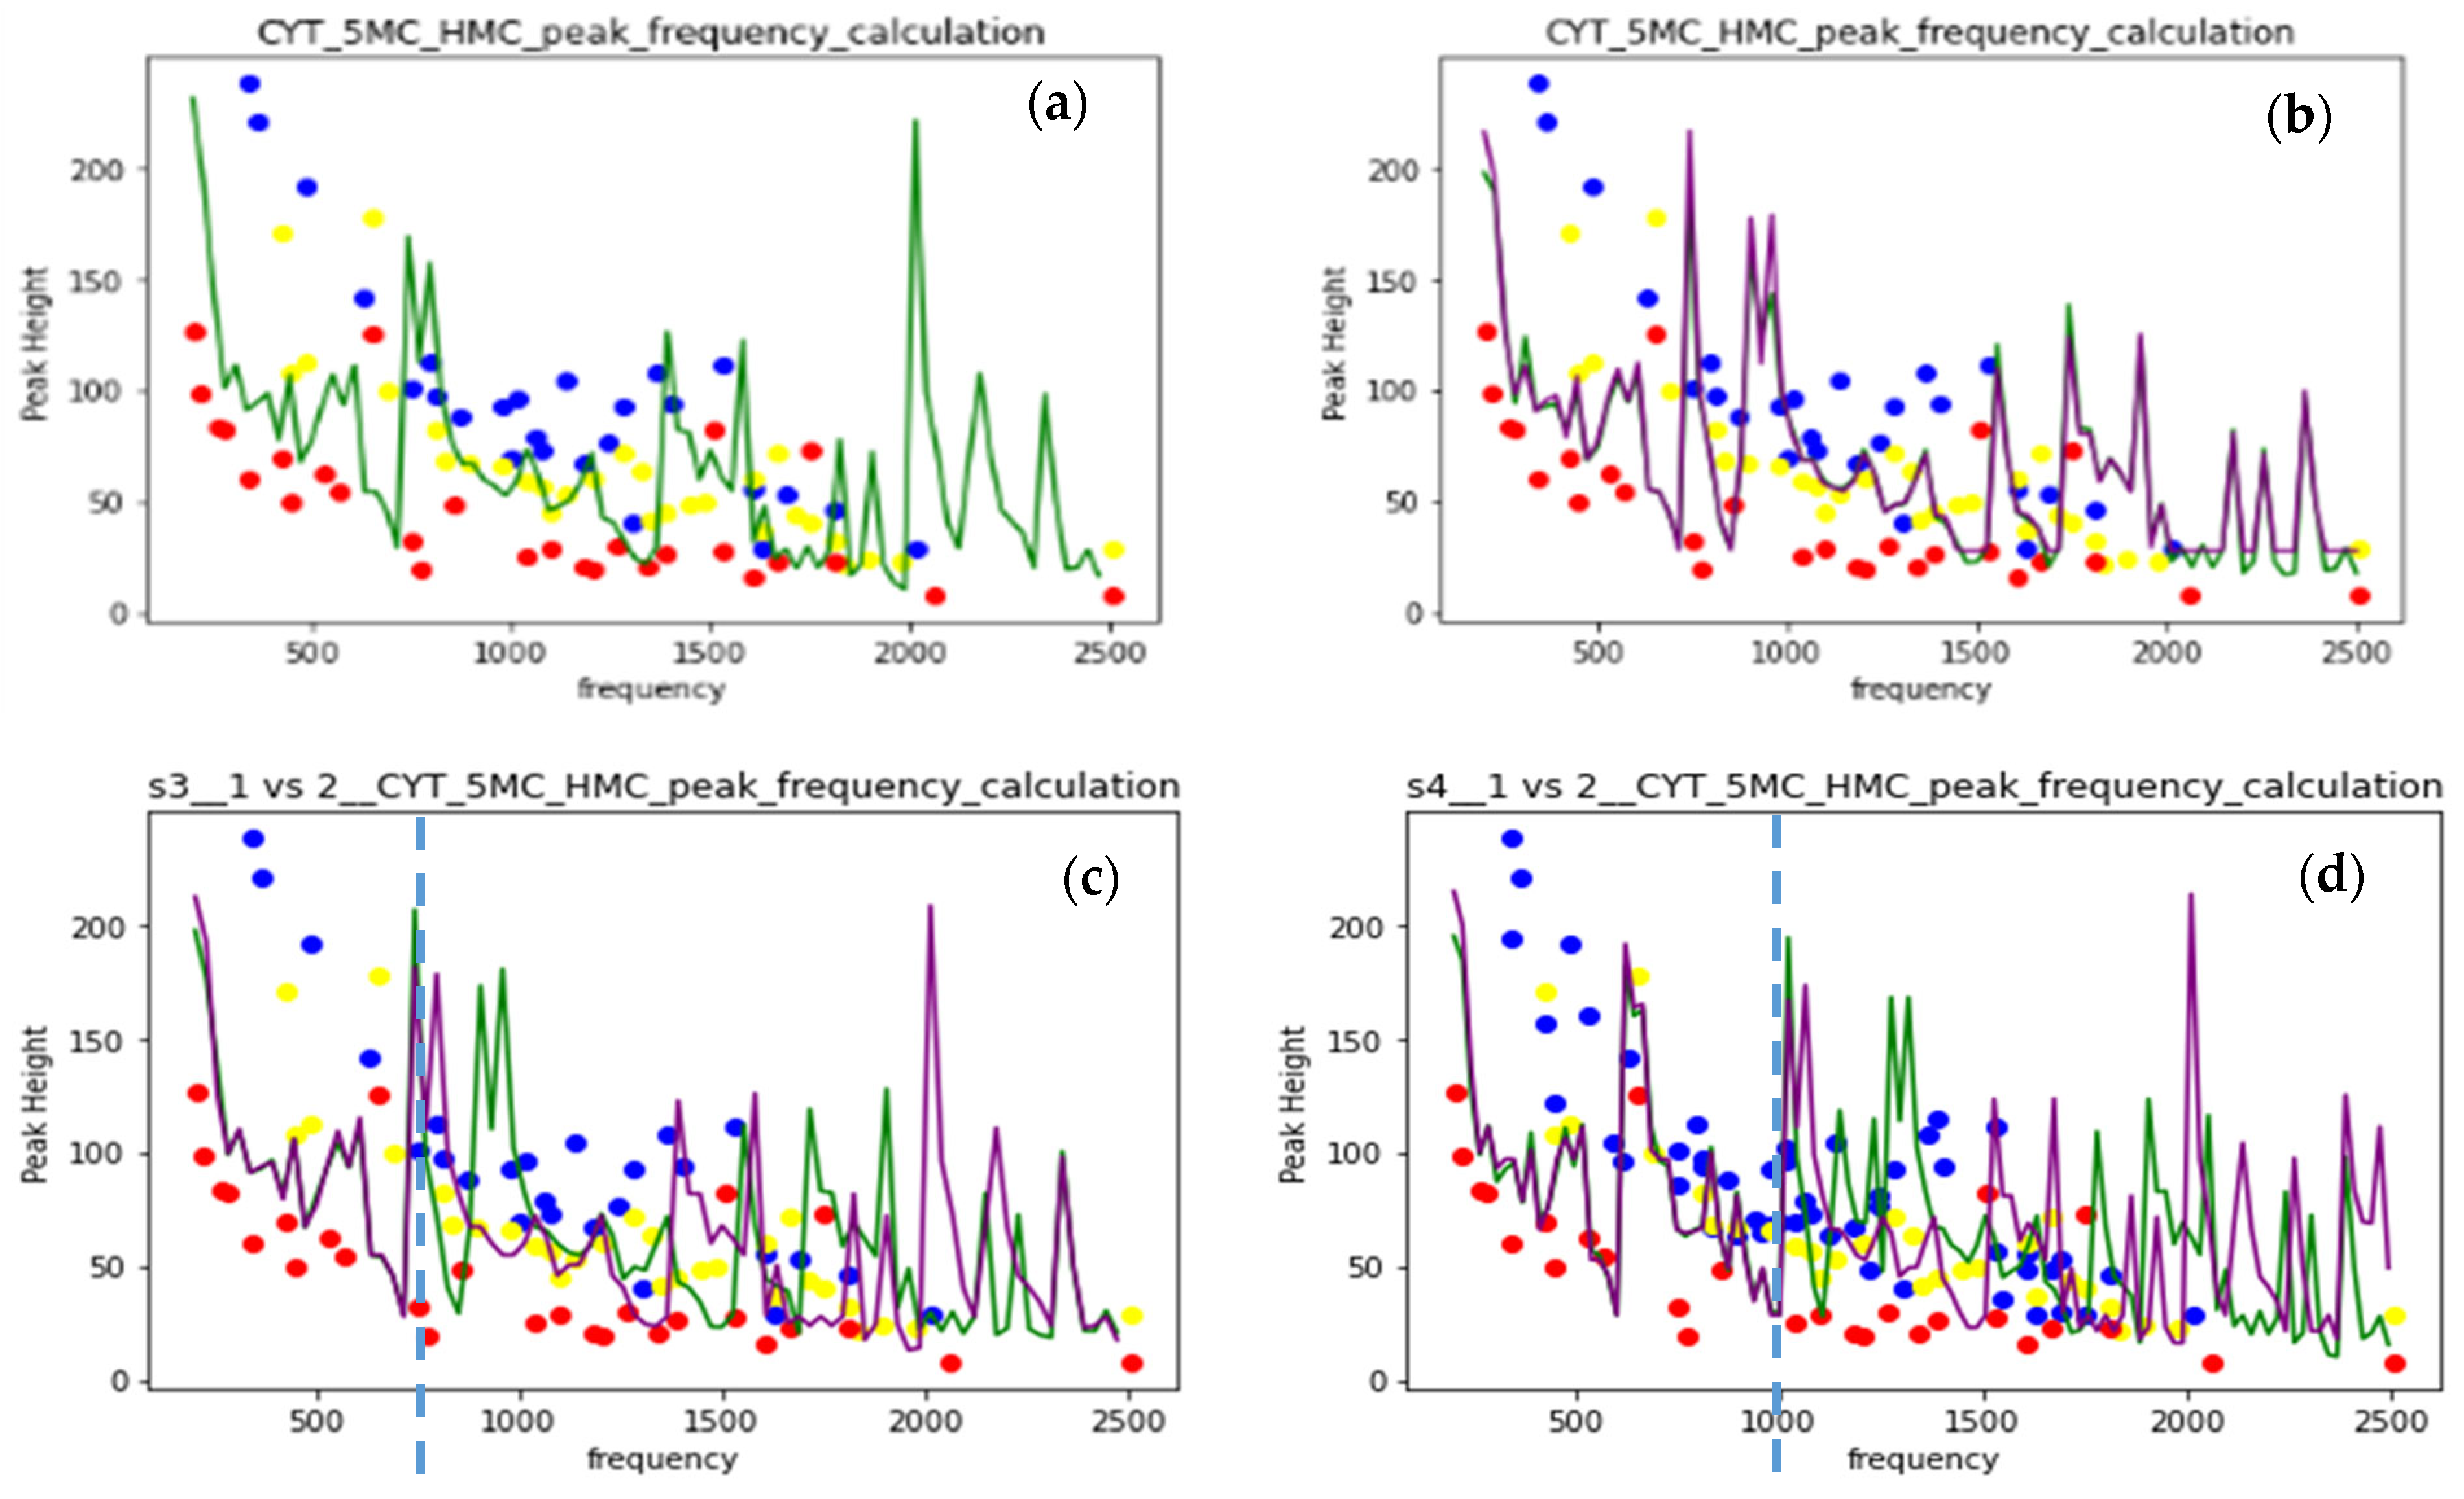
The present SERS sampling includes accumulating a number of single-molecule spectra taken instantly at a slightly changing orientation and conformation state, leading to the differences in measured spectra. Machine learning (ML)-assisted sampling of SERS substrates was implemented to improve data collection efficiency [52] in the experiment. The ML algorithm was also applied to the ab initio calculation of Raman spectra of an ethylene molecule [41]. The spectra in the MD calculation are the results of Fourier transform of the velocity autocorrelation. We obtain the spectra at the same correlation interval for different interaction conditions and different modifications of nucleotides to be used as ML algorithm training sets. The applicability of the random forest algorithm was tested with the input of frequencies and intensities (F and I) of spectral peaks. The ring-averaged spectral data of cytosine and its methylated forms were used as the training set with the 80–20% test–train split of data. The test part was allocated either randomly (green line in (a, c, d)) or manually (violet line in (c and d)). The algorithm was taken from Python libraries. Figure 7 shows the MD calculated spectral data as blue, yellow, and red dots for CYT, 5MC, and HMC nucleotides in one Au NP case. The random forest prediction at the two-parametric 86 points dataset is shown as a green line in the (a) figure and gives a large error, especially above 2000 cm−1. To increase the dataset, the differences between nearest frequencies and intensities (ΔF and ΔI) were added into a four-parametric dataset. The prediction error above 2000 cm−1 decreased, and the weights of the modes in the (F, I, ΔF, ΔI) data improved. Correspondence between the random and manual train–test split is tested in Figure 7c on the 4-parametric dataset with converged prediction between splits below 700 cm−1 and a sufficiently large difference above.
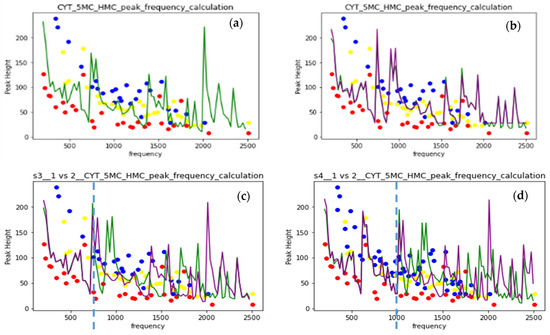
Figure 7.
(a) Random forest prediction for 2-parametric (F and I) dataset, random 0.2 split; (b) prediction for 4-parametric (F, I, ΔF, ΔI) dataset, random 0.2 split (c) prediction for 4-parametric (F, I, ΔF, ΔI) dataset, random and manual 0.2 split; (d) prediction for 4-parametric (F, I, ΔF, ΔI) dataset, random and manual 0.2 split, data from 1 Au NP and 4 Au NP spectra.
To double the size of the dataset, we combined the datasets of vibrational spectra of one Au NP and four Au NP sensors for CYT, 5MC, and HMC nucleotides. The convergence interval of the prediction increased up to 1000 cm−1. The error above 2000 cm−1 was also reduced, especially in a random split. Convergence between types of the split here indicates the spectral dataset size sufficiency for prediction in the present four-parametric representation. The spectra at different interaction conditions in the dataset will improve the prediction power of the random forest algorithm as applied to the MD-calculated vibrational spectra.
4. Discussion
By averaging the spectra between ring bonds in nucleotides, we received oligomer vibrational spectra that reproduce the majority of modes obtained by Raman spectroscopy and SERS experiments with high accuracy. In cytosine, the methyl and hydroxyl groups are characterized by the following features: deformation vibrations of the entire ring bonds at 203 cm−1, vibrations at the attachment of the deoxyribose to N atom at 285 cm−1, stretching motion of the C- C atoms from 400 to 1000 cm−1, and oscillatory motion of the amino group attached to the ring C atom at 1750 cm−1. The change in the calculated sensor environment by the increase in the number of Au NPs resulted in a relaxation of the vibrational energy of oligomers due to the change in interaction. However, there was no significant mode change (variations in intensity and small frequency shifts) for standard and methylated forms of cytosine.
The possibility of applying machine learning algorithms to the prediction of MD calculated vibrational spectra has been investigated from the point of the training dataset size and its parameter number. The use of spectra for the different interactions of the oligomer with the sensor environment as training data provides the required dataset size to converge prediction. Such algorithm training on the calculated data can be used to predict measured oligomer spectra in different single-molecule SERS sensors [3,53] with different types of plasmon-enhancing structures.
Author Contributions
Conceptualization, methodology, software development, validation, supervision T.Z.; data curation and preparation, K.M.; writing—original draft preparation, review and editing, T.Z. All authors have read and agreed to the published version of the manuscript.
Funding
This research received no external funding.
Institutional Review Board Statement
Not applicable.
Informed Consent Statement
Not applicable.
Data Availability Statement
Data can be obtained by request from author T.Z.
Acknowledgments
T.Z. gratefully acknowledges the previous technical assistance in the calculations and preparation of the results in which current calculations were based on the research of Mohd Aidil Amin Bin Mohd Nasir and H. Yoshimizu. All calculations were performed at Applied Mechano-Informatics Laboratory in Toyama University.
Conflicts of Interest
The authors declare no conflict of interest.
References
- Ardui, S.; Ameur, A.; Vermeesch, J.R.; Hestand, M.S. Single molecule real-time (SMRT) sequencing comes of age: Applications and utilities for medical diagnostics. Nucleic Acids Res. 2018, 46, 2159–2168. [Google Scholar] [CrossRef] [PubMed]
- Ameur, A.; Kloosterman, W.P.; Hestand, M.S. Single-Molecule Sequencing: Towards Clinical Applications. Trends Biotechnol. 2019, 37, 72–85. [Google Scholar] [CrossRef] [PubMed]
- Han, X.X.; Rodriguez, R.S.; Haynes, C.L.; Ozaki, Y.; Zhao, B. Surface-enhanced Raman spectroscopy. Nat. Rev. Methods Primers 2022, 1, 87. [Google Scholar] [CrossRef]
- Stöckle, R.M.; Suh, Y.D.; Deckert, V.; Zenobi, R. Nanoscale chemical analysis by tip-enhanced Raman spectroscopy. Chem. Phys. Lett. 2000, 318, 131–136. [Google Scholar] [CrossRef]
- Hayazawa, N.; Inouye, Y.; Sekkat, Z.; Kawata, S. Metallized tip amplification of near-field Raman scattering. Opt. Commun. 2000, 183, 333–336. [Google Scholar] [CrossRef]
- Knoll, B.; Keilmann, F. Near-field probing of vibrational absorption for chemical microscopy. Nature 1999, 399, 134–137. [Google Scholar] [CrossRef]
- Taubner, T.; Keilmann, F.; Hillenbrand, R. Nanomechanical Resonance Tuning and Phase Effects in Optical Near-Field Interaction. Nano Lett. 2004, 4, 1669–1672. [Google Scholar] [CrossRef]
- Zhu, Z.; Zhan, L.; Hou, C.; Wang, Z. Nanostructured metal-enhanced raman spectroscopy for DNA base detection. IEEE Photonics J. 2012, 4, 1333–1339. [Google Scholar]
- Anker, J.N.; Hall, W.P.; Lyandres, O.; Shah, N.C.; Zhao, J.; Van Duyne, R.P. Biosensing with plasmonic nanosensors. Nat. Mater. 2008, 7, 442–453. [Google Scholar] [CrossRef]
- Saha, K.; Agasti, S.S.; Li, C.K.X.N.; Rotello, V.M. Gold nanoparticles in chemical and biological sensing. Chem. Rev. 2012, 112, 2739–2779. [Google Scholar] [CrossRef]
- Guerrini, L.; Krpetic, Z.; van Lierop, D.; Alvarez-Puebla, R.A.; Graham, D. Direct surface-enhanced Raman scattering analysis of DNA duplexes. Angew. Chem. Int. Ed. 2015, 54, 1144–1148. [Google Scholar] [CrossRef] [PubMed]
- Kneipp, K.; Wang, Y.; Kneipp, H.; Perelman, L.T.; Itzkan, I.; Dasari, R.R.; Field, M.S. Single Molecule Detection Using Surface-Enhanced Raman Scattering (SERS). Phys. Rev. Lett. 1997, 78, 1667–1670. [Google Scholar] [CrossRef]
- Greve, C.; Elsaesser, T. Ultrafast Two-Dimensional Infrared Spectroscopy of Guanine–Cytosine Base Pairs in DNA Oligomers. J. Phys. Chem. B 2013, 117, 14009–14017. [Google Scholar] [CrossRef] [PubMed]
- Garoli, D.; Haung, J.A. Ultrahigh sensitivity SERS detection of DNA and protein translocating through a plasmonic nanopores. Proc. SPIE 2022, 12131, 135–142. [Google Scholar]
- Yang, J.M.; Jin, L.; Pan, Z.Q.; Zhou, Y.; Liu, H.L.; Ji, L.N.; Xia, X.H.; Wang, K. Surface-Enhanced Raman Scattering Probing the Translocation of DNA and Amino Acid through Plasmonic Nanopores. Anal. Chem. 2019, 91, 6275–6280. [Google Scholar] [CrossRef] [PubMed]
- Huang, J.; Mousavi, M.Z.; Giovannini, G.; Zhao, Y.; Hubarevich, A.; Soler, M.A.; Rocchia, W.; Garoli, D.; De Angelis, F. Multiplexed Discrimination of Single Amino Acid Residues in Polypeptides in a Single SERS Hot Spot. Angew. Chem. Int. Ed. 2020, 59, 11423–11431. [Google Scholar] [CrossRef]
- Huang, J.-A.; Mousavi, M.Z.; Zhao, Y.; Hubarevich, A.; Omeis, F.; Giovannini, G.; Schutte, M.; Garoli, D.; De Angelis, F. SERS Discrimination of Single DNA Bases in Single Oligonucleotides by Electro-Plasmonic Trapping. Nat. Commun. 2019, 10, 5321. [Google Scholar] [CrossRef]
- Xu, L.-J.; Lei, Z.-C.; Li, J.; Zong, C.; Yang, C.J.; Ren, B. Label-free surface-enhanced Raman spectroscopy detection of DNA with single-base sensitivity. J. Am. Chem. Soc. 2015, 137, 5149–5154. [Google Scholar] [CrossRef]
- Pazderka, T.; Kopecky, V. Drop coating deposition Raman spectroscopy of proteinogenic amino acids compared with their solution and crystalline state. Spectrochim. Acta Part A 2017, 185, 207–216. [Google Scholar] [CrossRef]
- Wood, B.R.; Caspers, P.; Puppels, G.J.; Pandiancherri, S.; McNaughton, D. Resonance Raman spectroscopy of red blood cells using near-infrared laser excitation. Anal. Bioanal. Chem. 2007, 387, 1691–1703. [Google Scholar] [CrossRef]
- Luo, X.; Xing, Y.; Galvan, D.D.; Zheng, E.; Wu, P.; Cai, C.; Yu, Q. Plasmonic Gold Nanohole Array for Surface-Enhanced Raman Scattering Detection of DNA Methylation. ACS Sens. 2019, 4, 1534–1542. [Google Scholar] [CrossRef] [PubMed]
- Ren, W.; Damayanti, N.P.; Wang, X.; Irudayaraj, J.M.K. Kinase Phosphorylation Monitoring with I-Motif DNA Cross-Linked SERS Probes. Chem. Commun. 2016, 52, 410–413. [Google Scholar] [CrossRef] [PubMed]
- Zhou, J.; Zhou, P.-L.; Shen, Q.; Ahmed, S.A.; Pan, X.-T.; Liu, H.-L.; Ding, X.-L.; Li, J.; Wang, K.; Xia, X.-H. Probing Multidimensional Structural Information of Single Molecules Transporting through a Sub-10 Nm Conical Plasmonic Nanopore by SERS. Anal. Chem. 2021, 93, 11679–11685. [Google Scholar] [CrossRef] [PubMed]
- Doyle, F.; Lapsia, S.; Spadaro, S.; Wurz, Z.E.; Bhaduri-McIntosh, S.; Tenenbaum, S.A. Engineering Structurally Interacting RNA (sxRNA). Sci. Rep. 2017, 7, 45393. [Google Scholar] [CrossRef]
- Almehmadi, L.M.; Curley, S.M.; Tokranova, N.A.; Tenenbaum, S.A.; Lednev, I.K. Surface Enhanced Raman Spectroscopy for Single Molecule Protein Detection. Sci. Rep. 2019, 9, 12356. [Google Scholar] [CrossRef]
- Li, J.; Gershow, M.; Golovchenko, J.A. DNA molecules and configurations in a solid-state nanopore microscope. Nat. Mater. 2003, 2, 611–615. [Google Scholar] [CrossRef]
- Yang, N.; Jiang, X. Nanocarbons for DNA Sequencing: A Review. Carbon 2017, 115, 293–311. [Google Scholar] [CrossRef]
- Thompson, J.; Milos, P.M. The properties and applications of single-molecule DNA sequencing. Genome Biol. 2011, 12, 217. [Google Scholar] [CrossRef]
- Shankla, M.; Aksimentiev, A. Conformational transitions and stop-and-go nanopore transport of single-stranded DNA on charged graphene. Nat. Commun. 2014, 5, 5171. [Google Scholar] [CrossRef]
- Liang, L.; Shen, J.-W.; Zhang, Z.; Wang, Q. DNA sequencing by two-dimensional materials: As theoretical modeling meets experiments. Biosens. Bioelectron. 2017, 89, 280–292. [Google Scholar] [CrossRef]
- Zhang, Z.; Shen, J.-W.; Wang, H.; Wang, Q.; Zhang, J.; Liang, L.; Ågren, H.; Tu, Y. Effects of Graphene Nanopore Geometry on DNA Sequencing. J. Phys. Chem. Lett. 2014, 5, 1602–1607. [Google Scholar] [CrossRef] [PubMed]
- Liang, L.; Zhang, Z.; Shen, J.; Zhe, K.; Wang, Q.; Wu, T.; Ågren, H.; Tu, Y. Theoretical studies on the dynamics of DNA fragment translocation through multilayer graphene nanopores. RSC Adv. 2014, 4, 50494–50502. [Google Scholar] [CrossRef]
- Zhou, Z.; Hu, Y.; Wang, H.; Xu, Z.; Wang, W.; Bai, X.; Shan, X.; Lu, X. DNA translocation through hydrophilic nanopore in hexagonal boron nitride. Sci. Rep. 2013, 3, 3287. [Google Scholar] [CrossRef] [PubMed]
- de Souza, F.A.L.; Amorim, R.G.; Scopel, W.L.; Scheicher, R.H. Electrical detection of nucleotides via nanopores in a hybrid graphene/h-BN sheet. Nanoscale 2017, 9, 2207–2212. [Google Scholar] [CrossRef]
- Zhang, L.; Wang, X. DNA Sequencing by Hexagonal Boron Nitride Nanopore: A Computational Study. Nanomaterials 2016, 6, 111. [Google Scholar] [CrossRef] [PubMed]
- Gilbert, S.M.; Dunn, G.; Azizi, A.; Pham, T.; Shevitski, B.; Dimitrov, E.; Liu, S.; Aloni, S.; Zettl, A. Fabrication of Subnanometer-Precision Nanopores in Hexagonal Boron Nitride. Sci. Rep. 2017, 7, 15096. [Google Scholar] [CrossRef] [PubMed]
- Lee, D.; Lee, S.; Seong, G.H.; Choo, J.; Lee, E.K.; Gweon, D.-G.; Lee, S. Quantitative analysis of methyl parathion pesticides in a polydimethylsiloxane microfluidic channel using confocal surface-enhanced Raman spectroscopy. Appl. Spectrosc. 2006, 60, 322A. [Google Scholar] [CrossRef]
- Bell, S.E.J.; Sirimuthu, N.M.S. Surface-enhanced Raman spectroscopy (SERS) for sub-micromolar detection of DNA/RNA mononucleotides. J. Am. Chem. Soc. 2006, 128, 15580–15581. [Google Scholar] [CrossRef]
- Madzharova, F.; Heiner, Z.; Gühlke, M.; Kneipp, J. Surface-Enhanced Hyper-Raman Spectra of Adenine, Guanine, Cytosine, Thymine, and Uracil. J. Phys. Chem. C 2016, 120, 15415–15423. [Google Scholar] [CrossRef]
- Chen, C.; Li, Y.; Kerman, S.; Neutens, P.; Willems, K.; Cornelissen, S.; Lagae, L.; Stakenborg, T.; Van Dorpe, P. High spatial resolution nanoslit SERS for single-molecule nucleobase sensing. Nat. Commun. 2018, 9, 1733. [Google Scholar] [CrossRef]
- Hu, W.; Ye, S.; Zhang, Y.; Li, T.; Zhang, G.; Luo, Y.; Mukamel, S.; Jiang, J. Machine learning protocol for surface-enhanced raman spectroscopy. J. Phys. Lett. 2019, 10, 6026–6031. [Google Scholar] [CrossRef] [PubMed]
- Zolotoukhina, T.; Yamada, M.; Iwakura, S. Influence of the Au cluster enhancer on vibrational spectra of nucleotides in MD simulation of a SERS sensor. In Proceedings of the 1st International Electronic Conference on Biosensors, Online, 2–17 November 2020; MDPI: Basel, Switzerland. [Google Scholar] [CrossRef]
- Zolotoukhina, T.; Yamada, M.; Iwakura, S. Vibrational Spectra of Nucleotides in the Presence of the Au Cluster Enhancer in MD Simulation of a SERS Sensor. Biosensors 2021, 11, 37. [Google Scholar] [CrossRef] [PubMed]
- Zolotoukhina, T.; Bin Mohd Nasir, M.; Yoshimizu, H. Sensitivity of the Au Cluster Attached to Graphene Nanopore in a SERS Sensor to Characterise Vibrational Spectra of Nucleotides. In Proceedings of the 2st International Electronic Conference on Biosensors (IECB 2022), Online, 14–18 February 2022; MDPI: Basel, Switzerland. [Google Scholar]
- Shankla, M.; Aksimentiev, A. Molecular Transport across the Ionic Liquid–Aqueous Electrolyte Interface in a MoS2 Nanopore. ACS Appl. Mater. Interfaces 2020, 12, 26624–26634. [Google Scholar] [CrossRef]
- Wanunu, M.; Sutin, J.; McNally, B.; Chow, A.; Meller, A. DNA Translocation Governed by Interactions with Solid-State Nanopores. Biophys J. 2008, 95, 4716–4725. [Google Scholar] [CrossRef]
- Lewis, L.J.; Combe, N.; Barrat, J.-L. Diffusion of gold nanoclusters on graphite. Phys. Rev. B 2000, 61, 16084. [Google Scholar] [CrossRef]
- Mante, P.-A.; Belliard, L.; Perrin, B. Acoustic phonons in nanowires probed by ultrafast pump-probe spectroscopy. Nanophotonics 2018, 7, 1759–1780. [Google Scholar] [CrossRef]
- Latorre, F.; Kupfer, S.; Bocklitz, T.; Kinzel, D.; Trautmann, S.; Grafe, S.; Deckert, V. Spatial resolution of tip-enhanced Raman spectroscopy – DFT assessment of the chemical effect. Nanoscale 2016, 8, 10229–10239. [Google Scholar] [CrossRef] [PubMed]
- Otto, C.; Van den Tweel, T.J.J.; de Mul, F.F.M.; Greve, J. Surface-enhanced Raman spectroscopy of DNA bases. J. Raman Spectrosc. 1986, 17, 289–298. [Google Scholar] [CrossRef]
- Pyrak, E.; Jaworska, A.; Kudelski, A. SERS Studies of Adsorption on Gold Surfaces of Mononucleotides with Attached Hexanethiol Moiety: Comparison with Selected Single-Stranded Thiolated DNA Fragments. Molecules 2019, 24, 3921. [Google Scholar] [CrossRef]
- Rojalin, T.; Antonio, D.; Kulkarni, A.; Carney, R.P. Machine Learning-Assisted Sampling of Surfance-Enhanced Raman Scattering (SERS) Substrates Improve Data Collection Efficiency. Mach. Appl. Spectrosc. 2022, 76, 485–495. [Google Scholar] [CrossRef]
- Wang, X.; Huang, S.; Shu, H.; Sen, Y.; Bin, R. Fundamental understanding and applications of plasmon-enhanced Raman spectroscopy. Nat. Rev. Phys. 2020, 2, 253–271. [Google Scholar] [CrossRef]
Disclaimer/Publisher’s Note: The statements, opinions and data contained in all publications are solely those of the individual author(s) and contributor(s) and not of MDPI and/or the editor(s). MDPI and/or the editor(s) disclaim responsibility for any injury to people or property resulting from any ideas, methods, instructions or products referred to in the content. |
© 2023 by the authors. Licensee MDPI, Basel, Switzerland. This article is an open access article distributed under the terms and conditions of the Creative Commons Attribution (CC BY) license (https://creativecommons.org/licenses/by/4.0/).