Proceeding Paper

An Efficient Designing of IIR Filter for ECG Signal Classification Using MATLAB †

by
Nandi Manjula
1,
Ngangbam Phalguni Singh
1,* and
P. Ashok Babu
2
1
ECE Department, Koneru Lakshmaiah Education Foundation (K L Deemed to be University), Vaddeswaram 522302, Andhra Pradesh, India
2
ECE Department, Institute of Aeronautical Engineering, Hyderabad 500043, Telangana, India
*
Author to whom correspondence should be addressed.
Presented at the International Conference on “Holography Meets Advanced Manufacturing”, Online, 20–22 February 2023.
Eng. Proc. 2023, 34(1), 24; https://doi.org/10.3390/HMAM2-14154
Published: 13 March 2023

Abstract

:
The electrocardiogram (ECG) is a biological signal that is frequently employed and plays a significant role in cardiac analysis. In the analysis of important indicators of the distribution of patients’ ECG record, the R wave is crucial for both analyzing abnormalities in cardiac rhythm and determining heart rate variability (HRV). In this article, a brand-new method for classifying and detecting QRS peaks in ECG data based on artificial intelligence is provided. The integration of the ECG signal data is proposed using a reduced-order IIR filter design. To construct the reduced-order filter, the filter coefficient using the min–max method. The main focus of this study is on removing baseline uncertainty and power line interferences from the ECG signal. According to the results, the accuracy increased by about 13.5% in comparison to the fundamental Pan–Tompkins approach and by about 8.1% in comparison to the current IIR-filter-based categorization rules.

1. Introduction

The World Health Organization has determined that heart arrest is the leading cause of mortality worldwide. Due to the strong emphasis on medicine, preventive measures, and technology in cardiac health research, investigators have been working to develop the cardiovascular abilities that are typically used in clinics [1,2]. The majority of heart pathology can be understood by looking at the ECG signal. Heart rate and ECG signals are used to evaluate a healthy heart. A cardiac arrhythmia is recognized if an ECG is recorded from a patient and there is any nonlinearity. Figure 1 depicts an average ECG rhythm. The PQRS-TU wave’s length and amplitude provide important information regarding the severity of the heart disease. In the clinical setting, the ECG signal is subjected to a variety of sounds during acquisition [3]. Important cardiac foundations include frequency determination, signal superiority, noise, and power line interference (PLI), in addition to external electromagnetic field intrusion [4,5]. It is advised that the issue of contaminated noise removal be solved because it improves accuracy and is crucial for the ECG data. Medical professionals use ECG extensively in the assessment and identification of cardiac health. Cardiologists frequently use ECG as a diagnostic tool to identify cardiovascular diseases [6,7,8]. The early stages of heart disease are crucial because they can lessen abrupt cardiac failure. Accurate diagnoses require ECG signals of good quality. Electrodes are used to display and record electrical cardiac activity on the body’s skin [9].
Normal sinus rhythm (NSR), often known as a regular heartbeat, is present in healthy hearts [10,11,12]. Atrial depolarization is indicated by P-waves. Regular Q waves indicate septal depolarization and are an early descending deflection of the P wave. The ECG’s most common waveform for identifying and detecting early ventricular depolarization is the R wave. which shows the late ventricular depolarization [13,14]. Ventricular repolarization is characterized by the T-wave. The Purkinje fibers that show the most recent ventricular residuals, or U waves, repolarize.

2. Relevant Review Work

As communication technology has developed, wireless communication has become one of the most popular ways for people to conveniently exchange ideas and thoughts. An audio noise-reduction system is a technique for eliminating noise from audio transmissions. Devices for audio noise reduction use two main strategies. The complementary type calls for carefully removing the audio signal before recording (primarily on tape) [1,2,3,4,5]. The relative weight that the filter assigns to data samples is determined by these settings. Typically, to accomplish this, particular frequencies or frequency ranges must be eliminated [6,7,8,9,10,11,12,13]. Contrarily, filters have a wide range of extra aims, particularly in the area of image processing. They do not merely operate in the frequency domain. There is no apparent hierarchy, but there are many classification systems, all of which overlap in different ways. Filters come in both linear and nonlinear varieties. The system’s properties include shift invariance, which is sometimes known as time-variant or time-invariant [14,15,16,17]. A filter that operates in a spatial domain is said to be space invariant. The filters that handle time- or spatial-domain signals are slow in time [18,19]. Unlike continuous-time filters, which can be both active and inactive, discrete-time filters can only be active or inactive. This study illustrated the effective use of an optimization-based filter for identifying and categorizing ECG peaks. It participated in both passes. In the first pass, a useful lower-order IIR filter design method based on transfer function optimization was suggested for detecting QRS peaks. For peak detection performance improvement, the IIR filter and Hilbert transform was used. Three distinct approaches were tested for their filtering effectiveness for baseline wondering.
The majority of people today aged between the ages of 40 and 60 experience cardiac-related health problems. An electrocardiogram is the best way to capture heart impulses and identify any abnormalities at an early stage, as demonstrated in Figure 2a, showing anormal ECG, and Figure 2b, showingan abnormal ECG. The heart rate variability and QRS complex are used to classify the abnormalities [20]. For the purpose of removing motion distortions from the ECG data, numerous authors have put forth various methods. The aforementioned techniques include wavelet transforms (WTs), adaptive filters (AFs), and empirical mode decomposition (EMD) [21]. Blanco-Velasco proposed an ECG enhancement technique to remove baseline drift and noise brought on by high frequencies. On the other hand, mode mixing, which yields erroneous intrinsic mode functions, is one of the prevalent problems in empirical mode decomposition.

3. Objectives of Research

Designing an efficient IIR filter for ECG signals to identify heart problems was the main focus of the design, analysis, and implementation of the following subsystems. They are categorized as aspects of the work flow in order to create an effective model for ECG analysis.
  • The first theory is furthered by the implementation of modules such arithmetic circuits for filters used in ECG signal classification, as well as the construction of parallel prefix circuits with the least amount of depth utilizing the FPGA hardware prototype.
  • The second theory is that by creating an algorithm that can identify the difficult QRS problem in real-time ECG classification, we may further investigate the effective filter utilized in ECG signal classification.

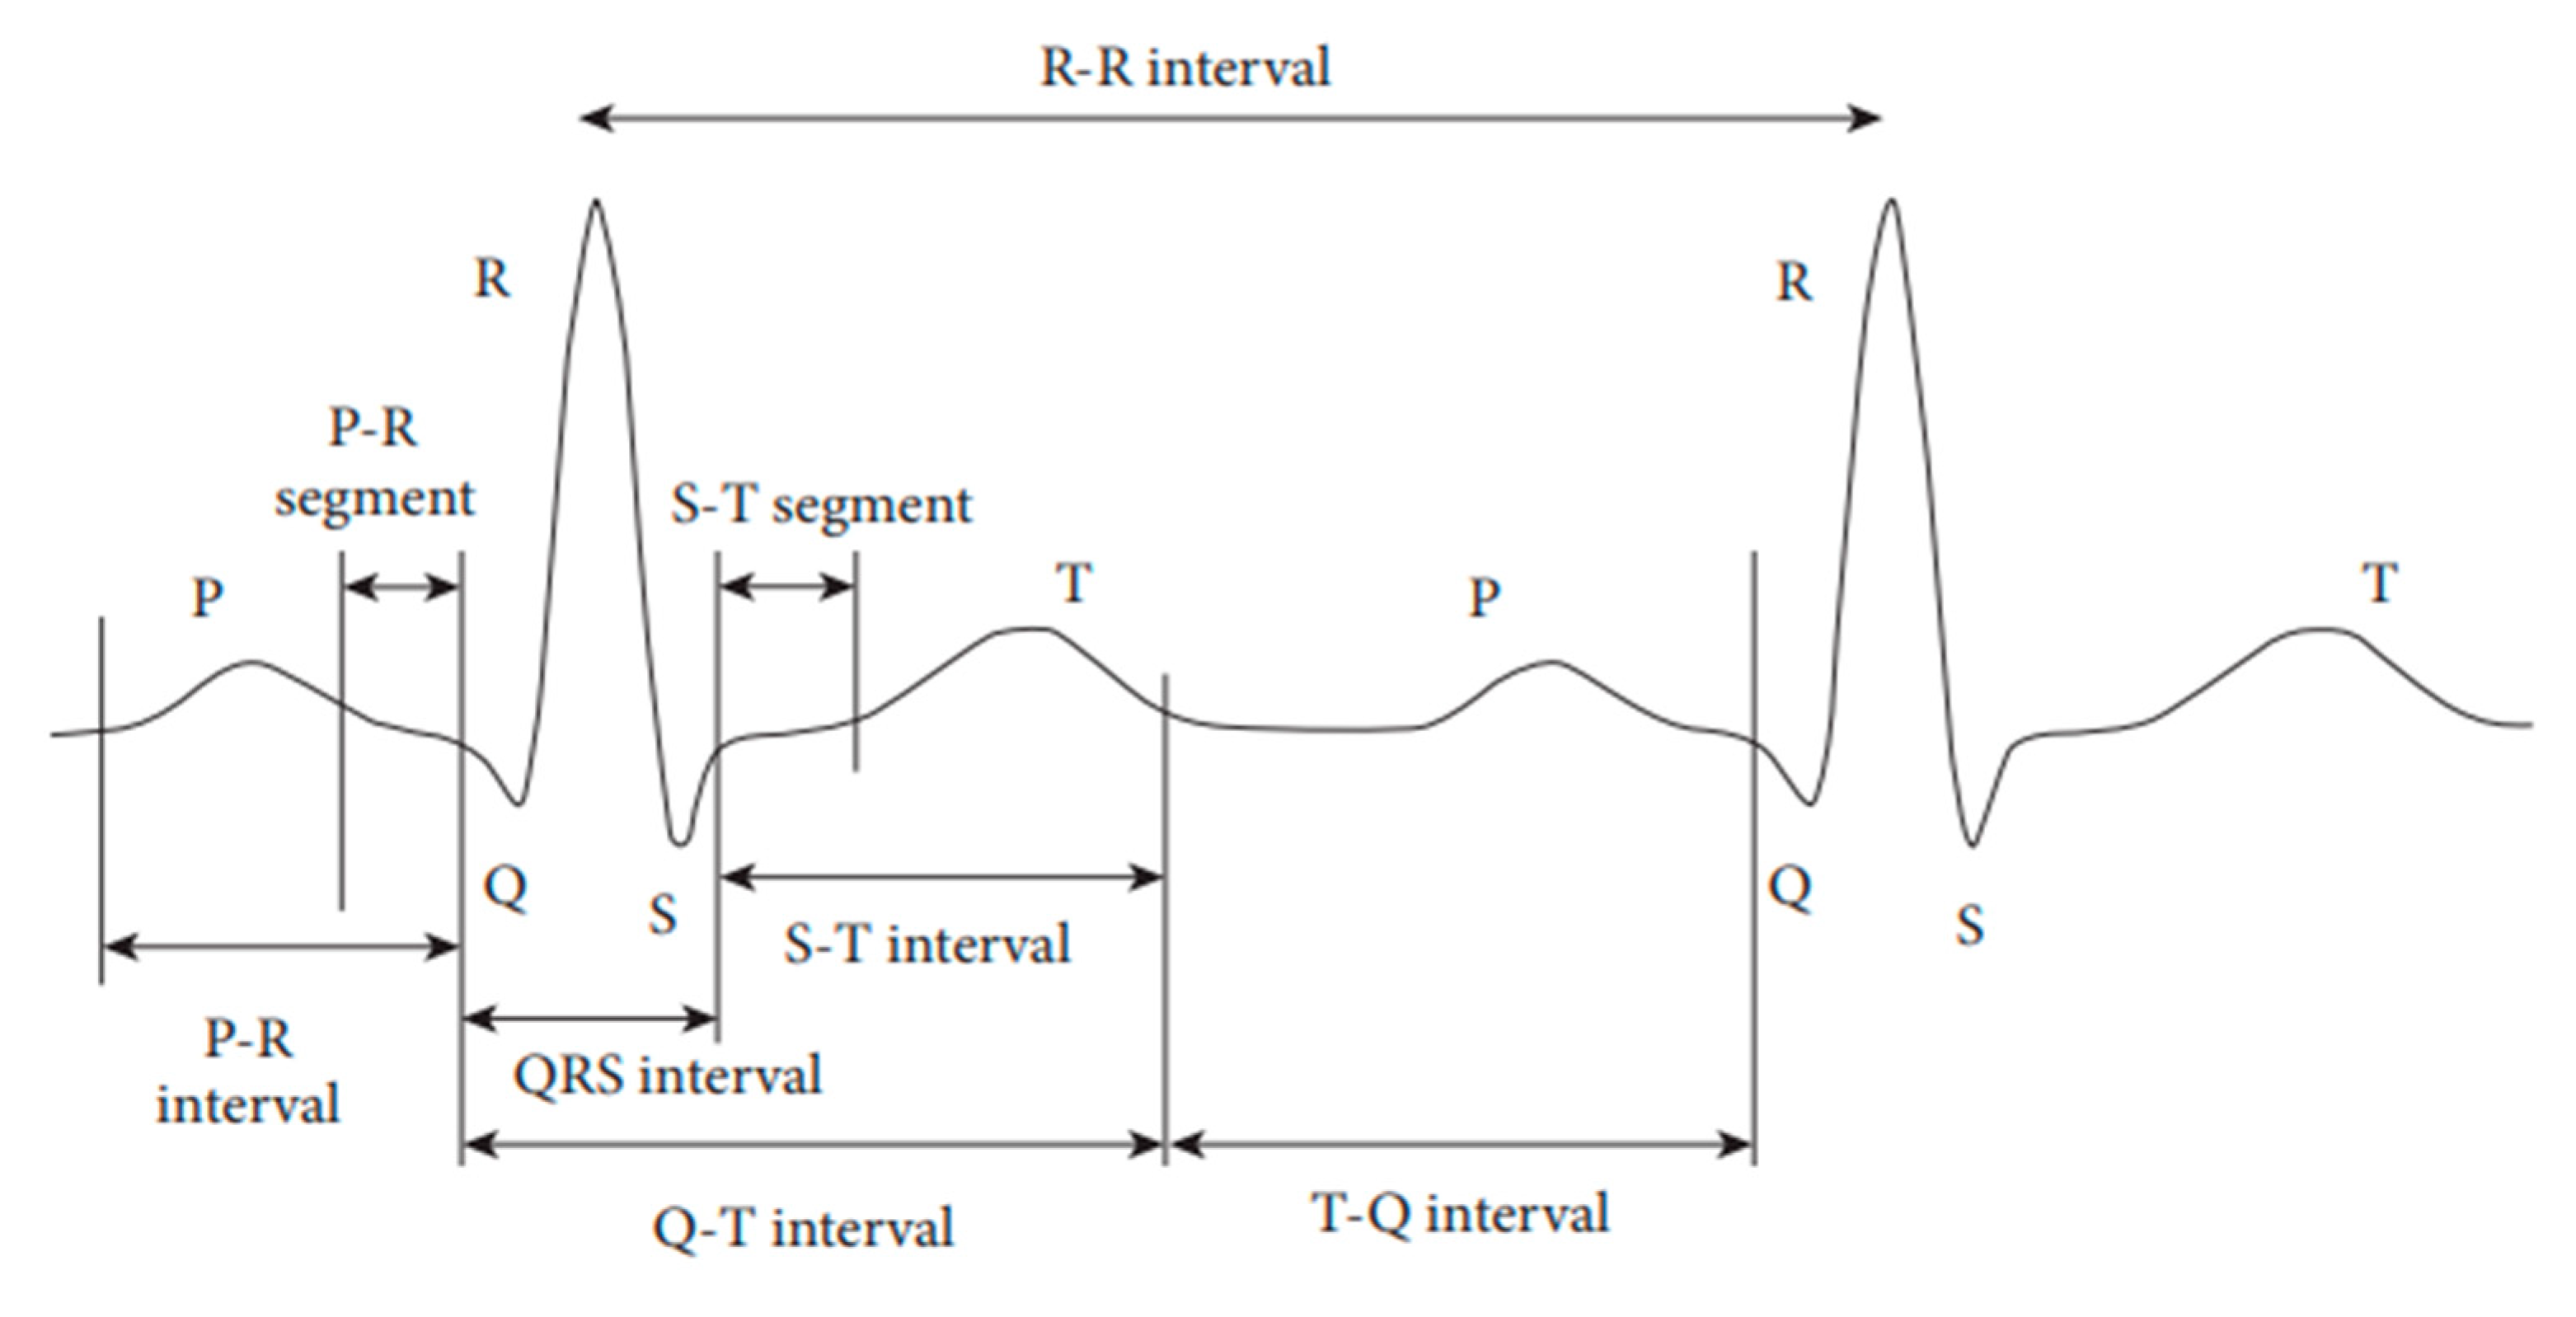
4. Pan–Tompkins Peak Detection Approach

There have been numerous strategies created to enhance the effectiveness peak detection and classification efficiency, which are anticipated to be directly correlated with the effectiveness of the methods used during the preprocessing step. Thus, two current filtering techniques—Pan–Tompkins and a 60-order IIR filter, respectively—were used. For peak identification, the Pan–Tompkins technique was most frequently utilized. However, other variations of the Pan–Tompkins approach were developed to increase the categorization effectiveness of the ECG signal using the updated peak detection algorithm.

5. IIR Filter Design

It is recommended to use the optimization method in order to bring down the expected order of the IIR filter design. A block diagram of the proposed ECG categorization algorithm can be found in Figure 3a. In the proposed IIR filter, which is a two-stage filter, the pass band filters and stop band filters are laid out in the manner that is depicted in Figure 3b.
Y(n) = X(n) * H1 * H2,
where H1 is the pass band filter’s transfer function; and an example of a transfer function for 106 MIT-ECG BIH’s data is provided as
H 1 = 0.20346 s 4 0.7131 s 2 + 0.24566 s 4 + 0.5488 s 3 + 0.4535 s 2 + 0.1763 s + 0.1958
The optimization method is suggested to reduce the expected IIR filter design’s order:
H 2 = 0.3201 s 16 + 4.517 s 15 + 30.45 s 14 + 130 s 13 + 393.2 s 12 + 892.9 s 11 + 1574 s 10 + 2196 s 9 + 2452 s 8 + 2196 s 7 + 1574 s 6 + 892.9 s 5 + 393.2 s 4 + 130 s 3 + 30.45 s 2 + 4.517 s + 0.3201 s 16 + 12.12 s 15 + 70.25 s 14 + 258.1 s 13 + 672.2 s 12 + 1316 s 11 + 2004 s 10 + 2419 s 9 + 2340 s 8 + 1819 s 7 + 113 s 6 + 559.4 s 5 + 214.8 s 4 + 62 s 3 + 12.7 s 2 + 1.649 s + 0.102
Equations (1) and (2) depict the transfer function for the IIR filter, the pass band filter, and the stop band filter, respectively (3).

5.1. Optimization Methods

The methods of ECG processing that are used most frequently are discussed below.

5.1.1. The Low-Pass Differentiation Approach (LPD)

The total band-pass filter significantly reduces the effects of all sorts of unwanted interference and frequency noise. This algorithm chooses the necessary QRS complexes based on a set of thresholds and modifies the threshold according to the magnitude of the peak. Thethresholds for this algorithm are determined by a human component. The operator’s threshold-setting expertise may be the main source of error in this Pan–Tompkins method.

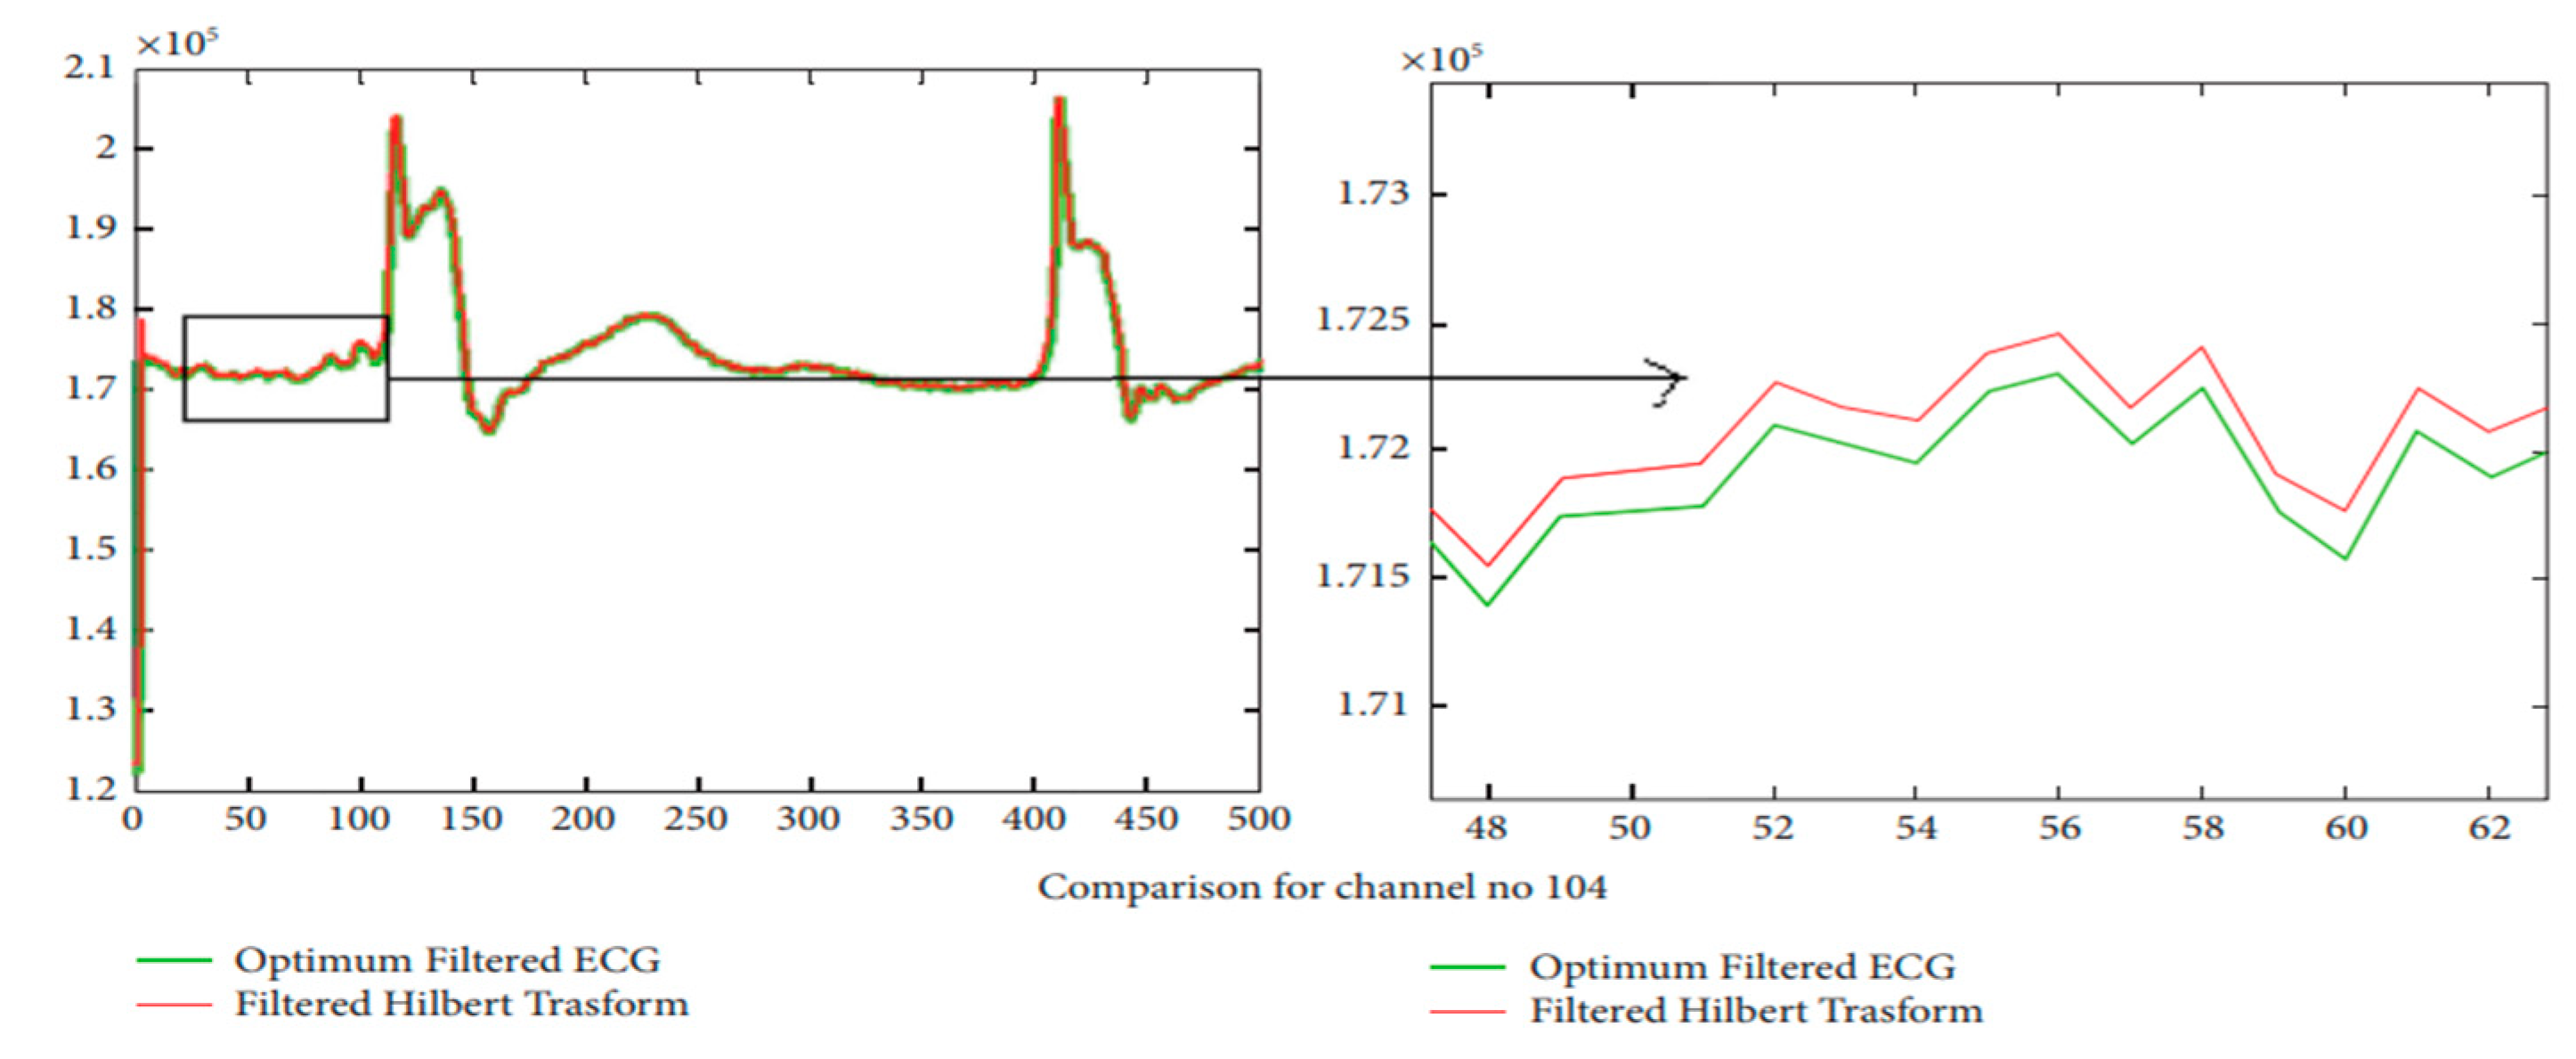
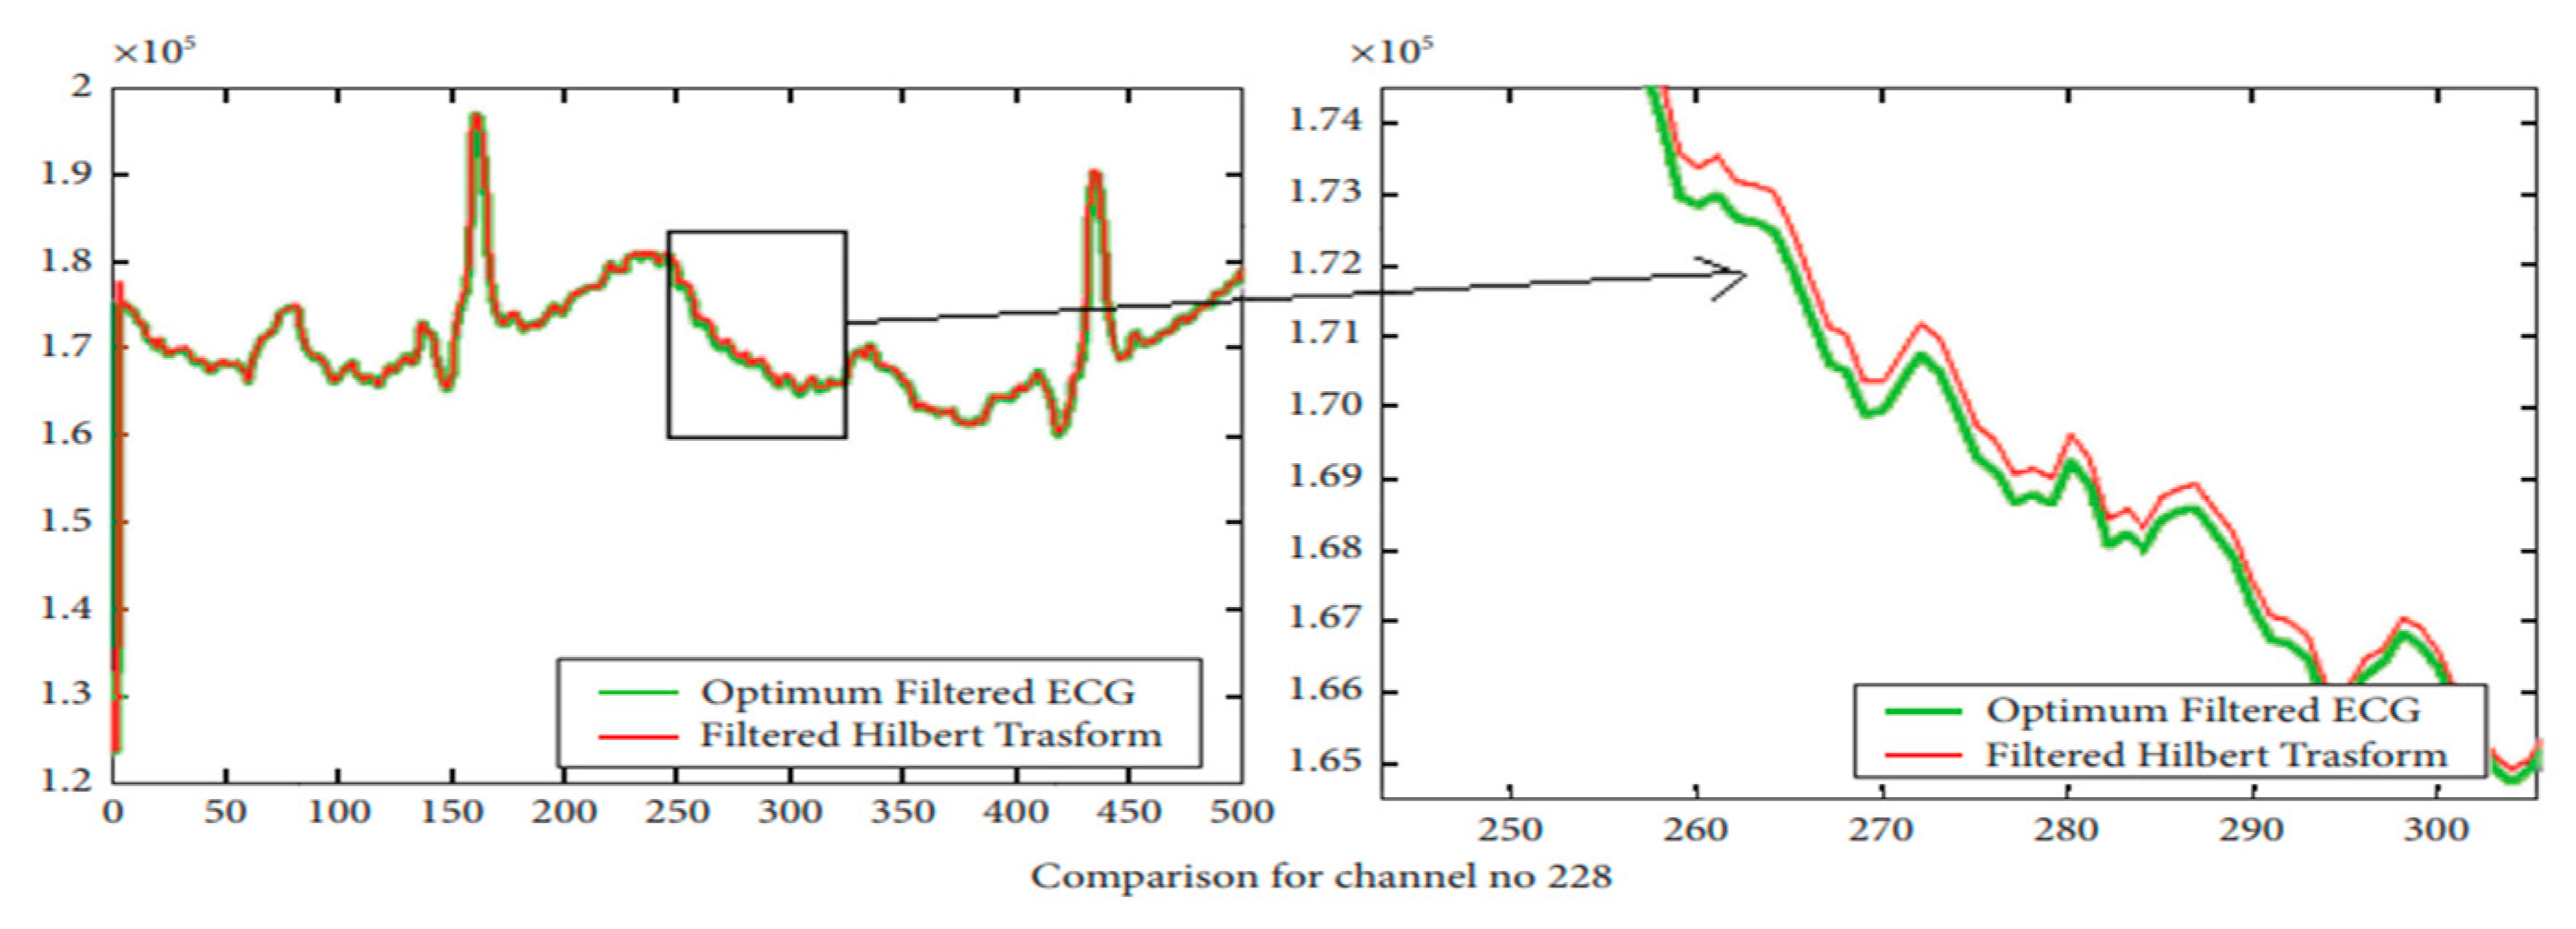
5.1.2. Hilbert Transform (HT)

HT use the 90° phase angle shift method of each component of the signal h(t). The Hilbert transform of h(t), using h(t) as its signal representation, can be written as
h ^ = 1 π h ( p ) t p d p
The HT approach was employed by researchers in Refs. [13,21,22,23] implemented for the recognition of ECG QRS.

5.1.3. Optimum Reduced-Order IIR Filter Design

The basic IIR filter requires 16 orders, as can be seen from the equations above. In this study, MINMAX optimization is proposed as a way to reduce the order of the transfer function. Figure 3 shows the image detection and classification methods in sequence.
min x1∈X max x2∈X f(x1, x2)
where X Rdx1 and Y Rdx2 are convex sets, f is a differentiable objective function, and x1 and x2 are optimization variables. Transfer function coefficients are optimized in a sequential manner, as demonstrated in the sequential min–max optimization technique.
  • To assess a particular instance, a sample was suggested;
  • It was suggested that an optimization approach be designed for the denoising of the herring assistance signal using a minimized-order IIR filter;
  • Two different filters must consider the proposed IIR filter before denoising.

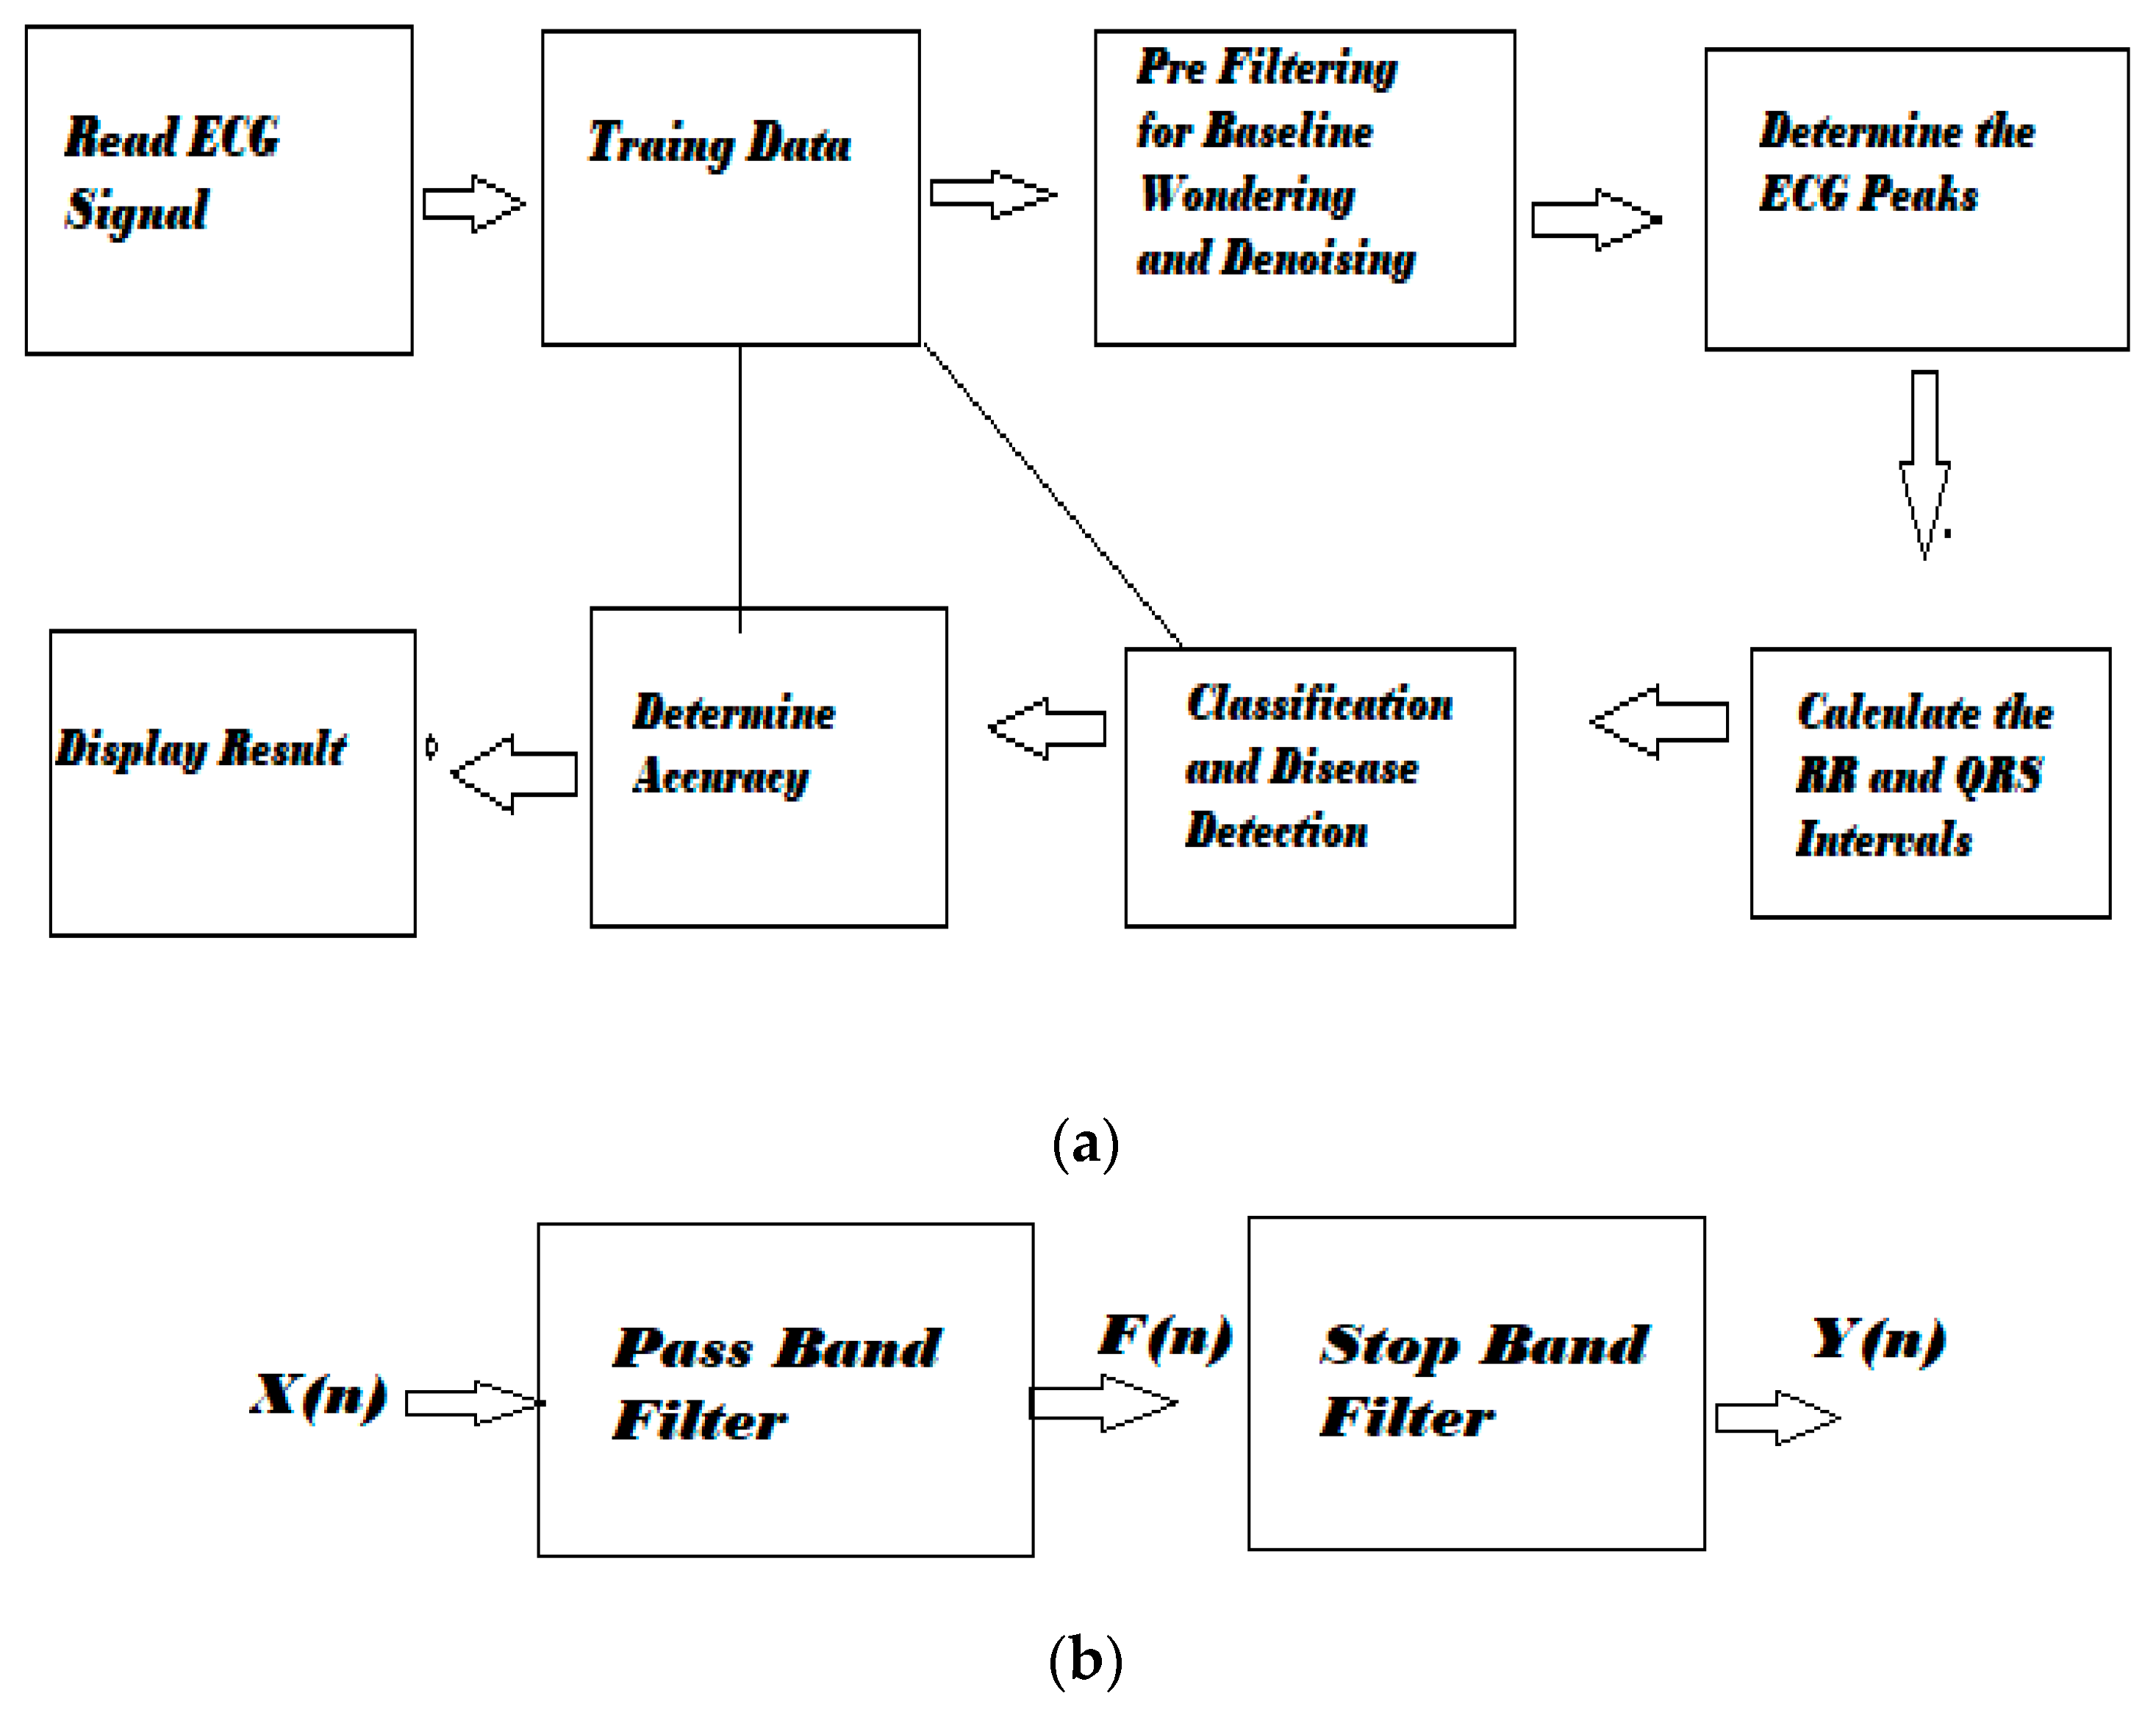
6. IIR Filter Design Algorithm

The following list describes each step taken in the suggested algorithm:
i.
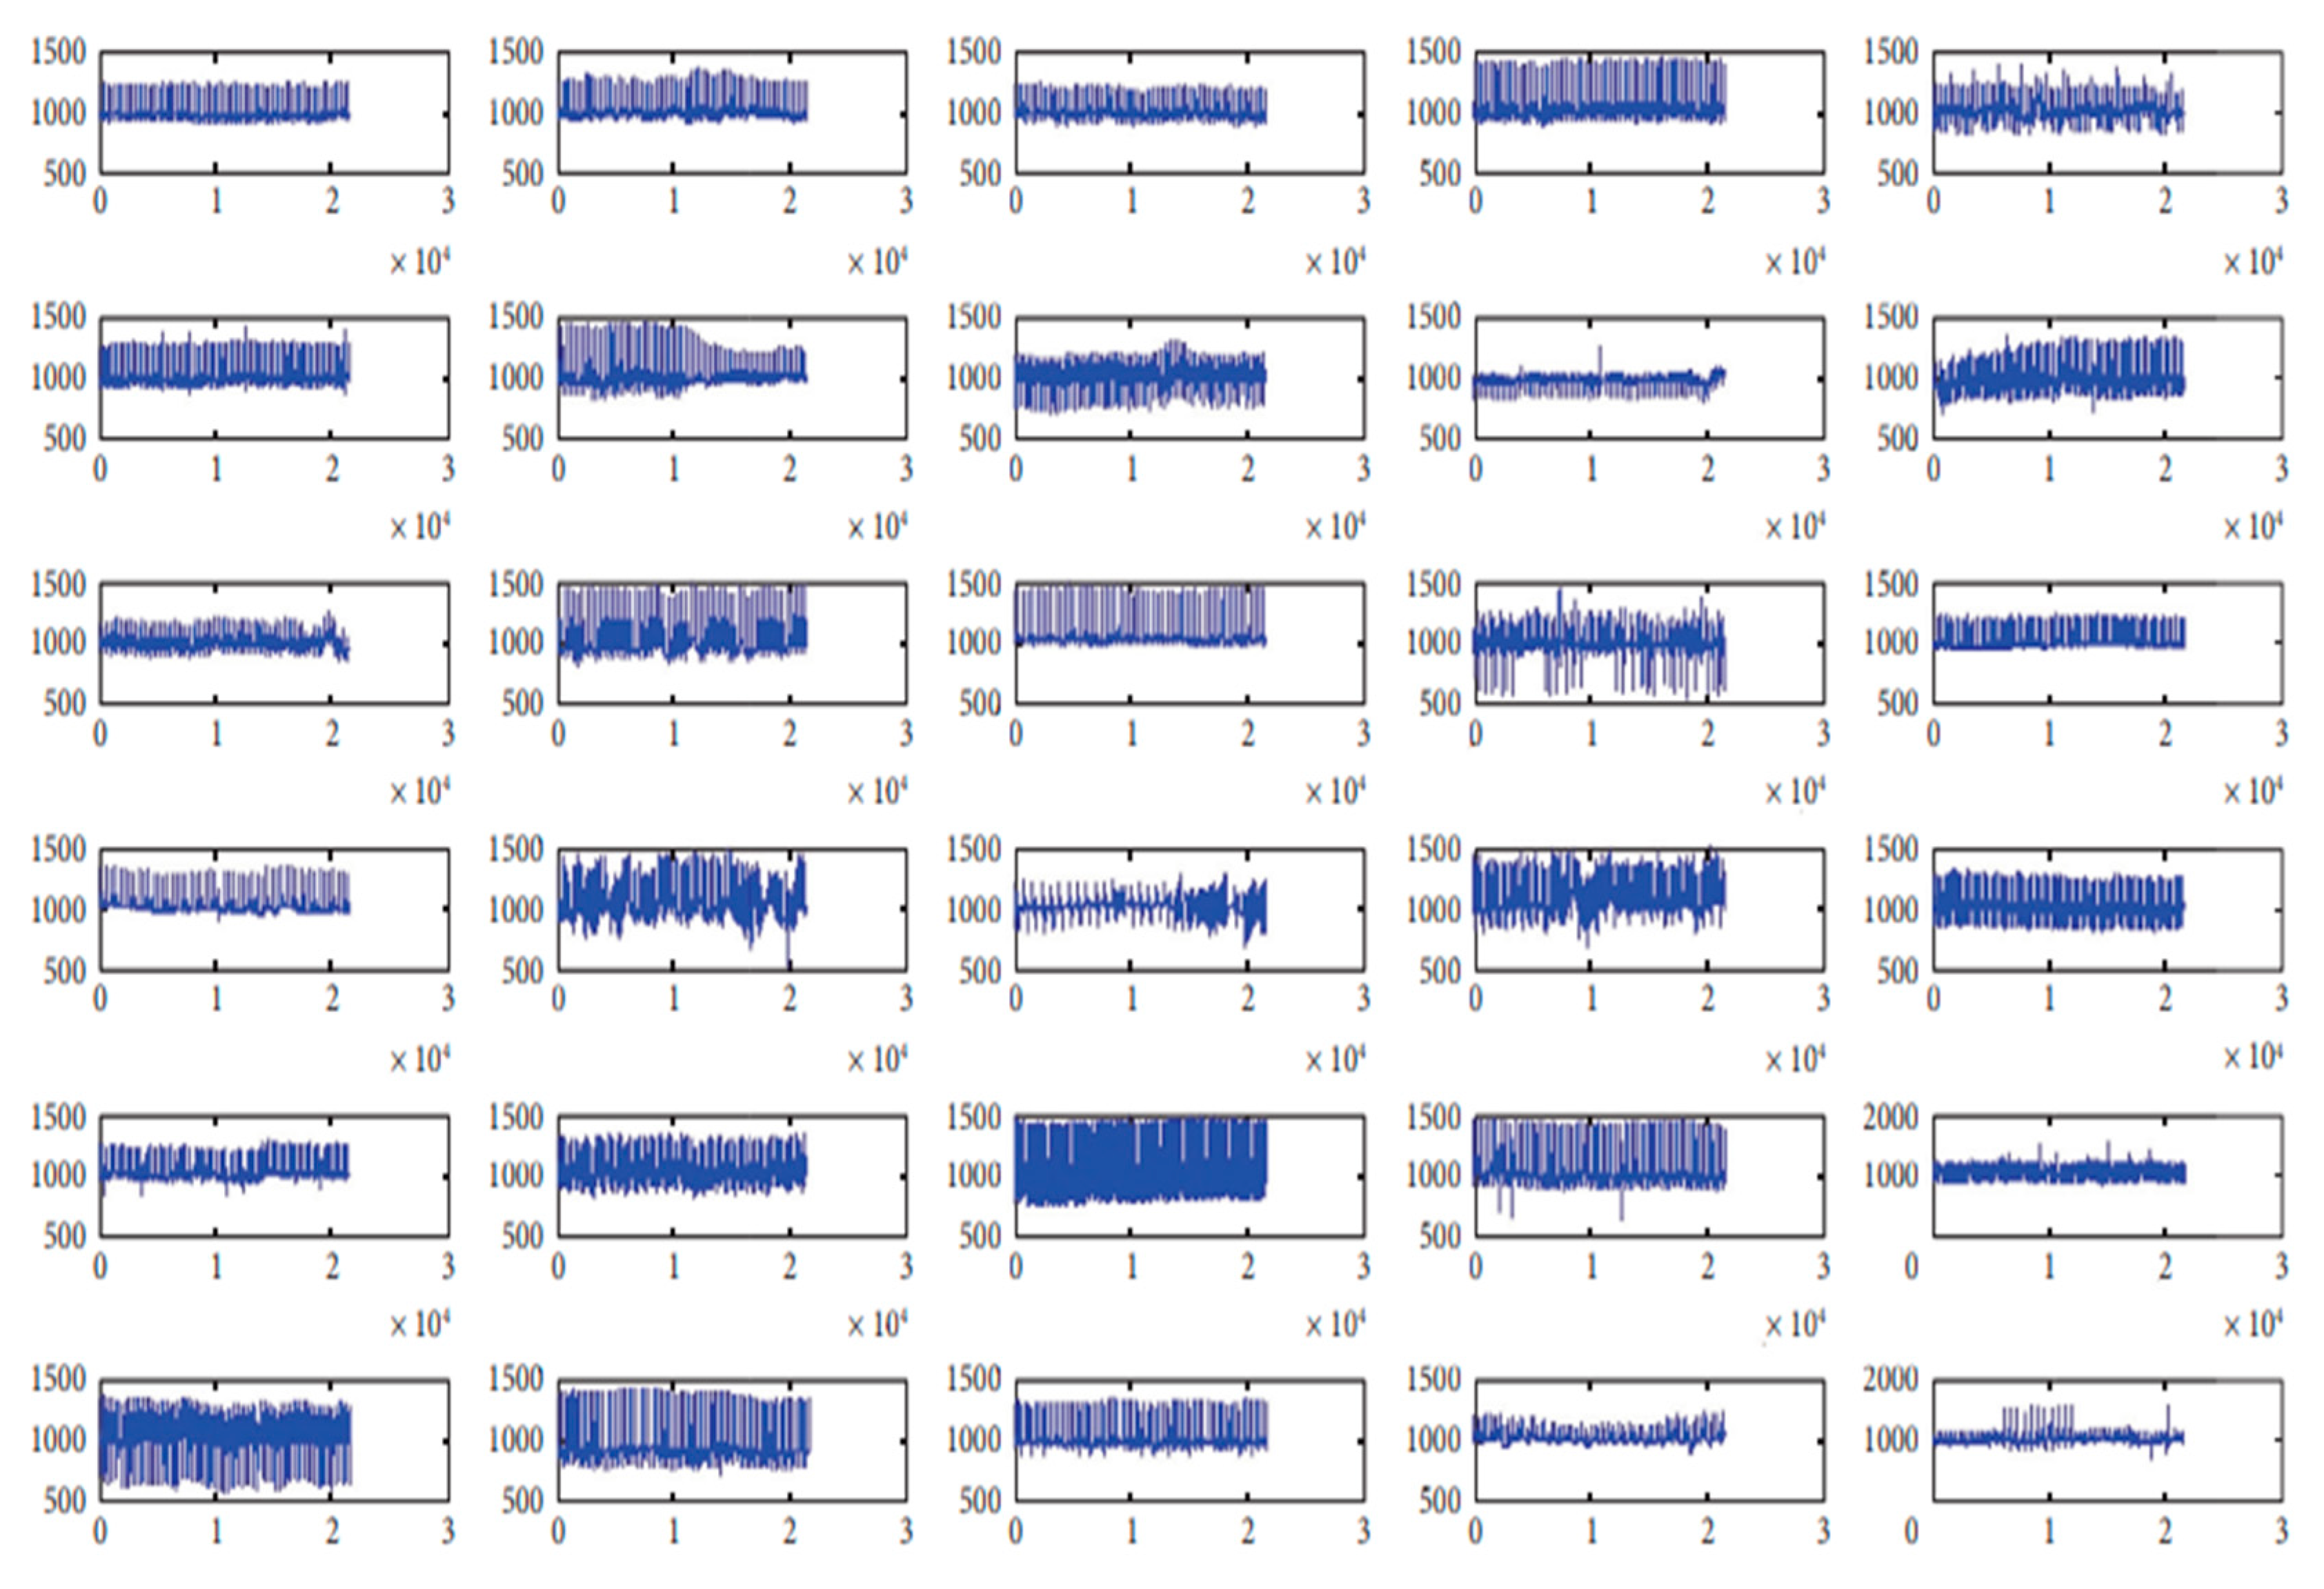
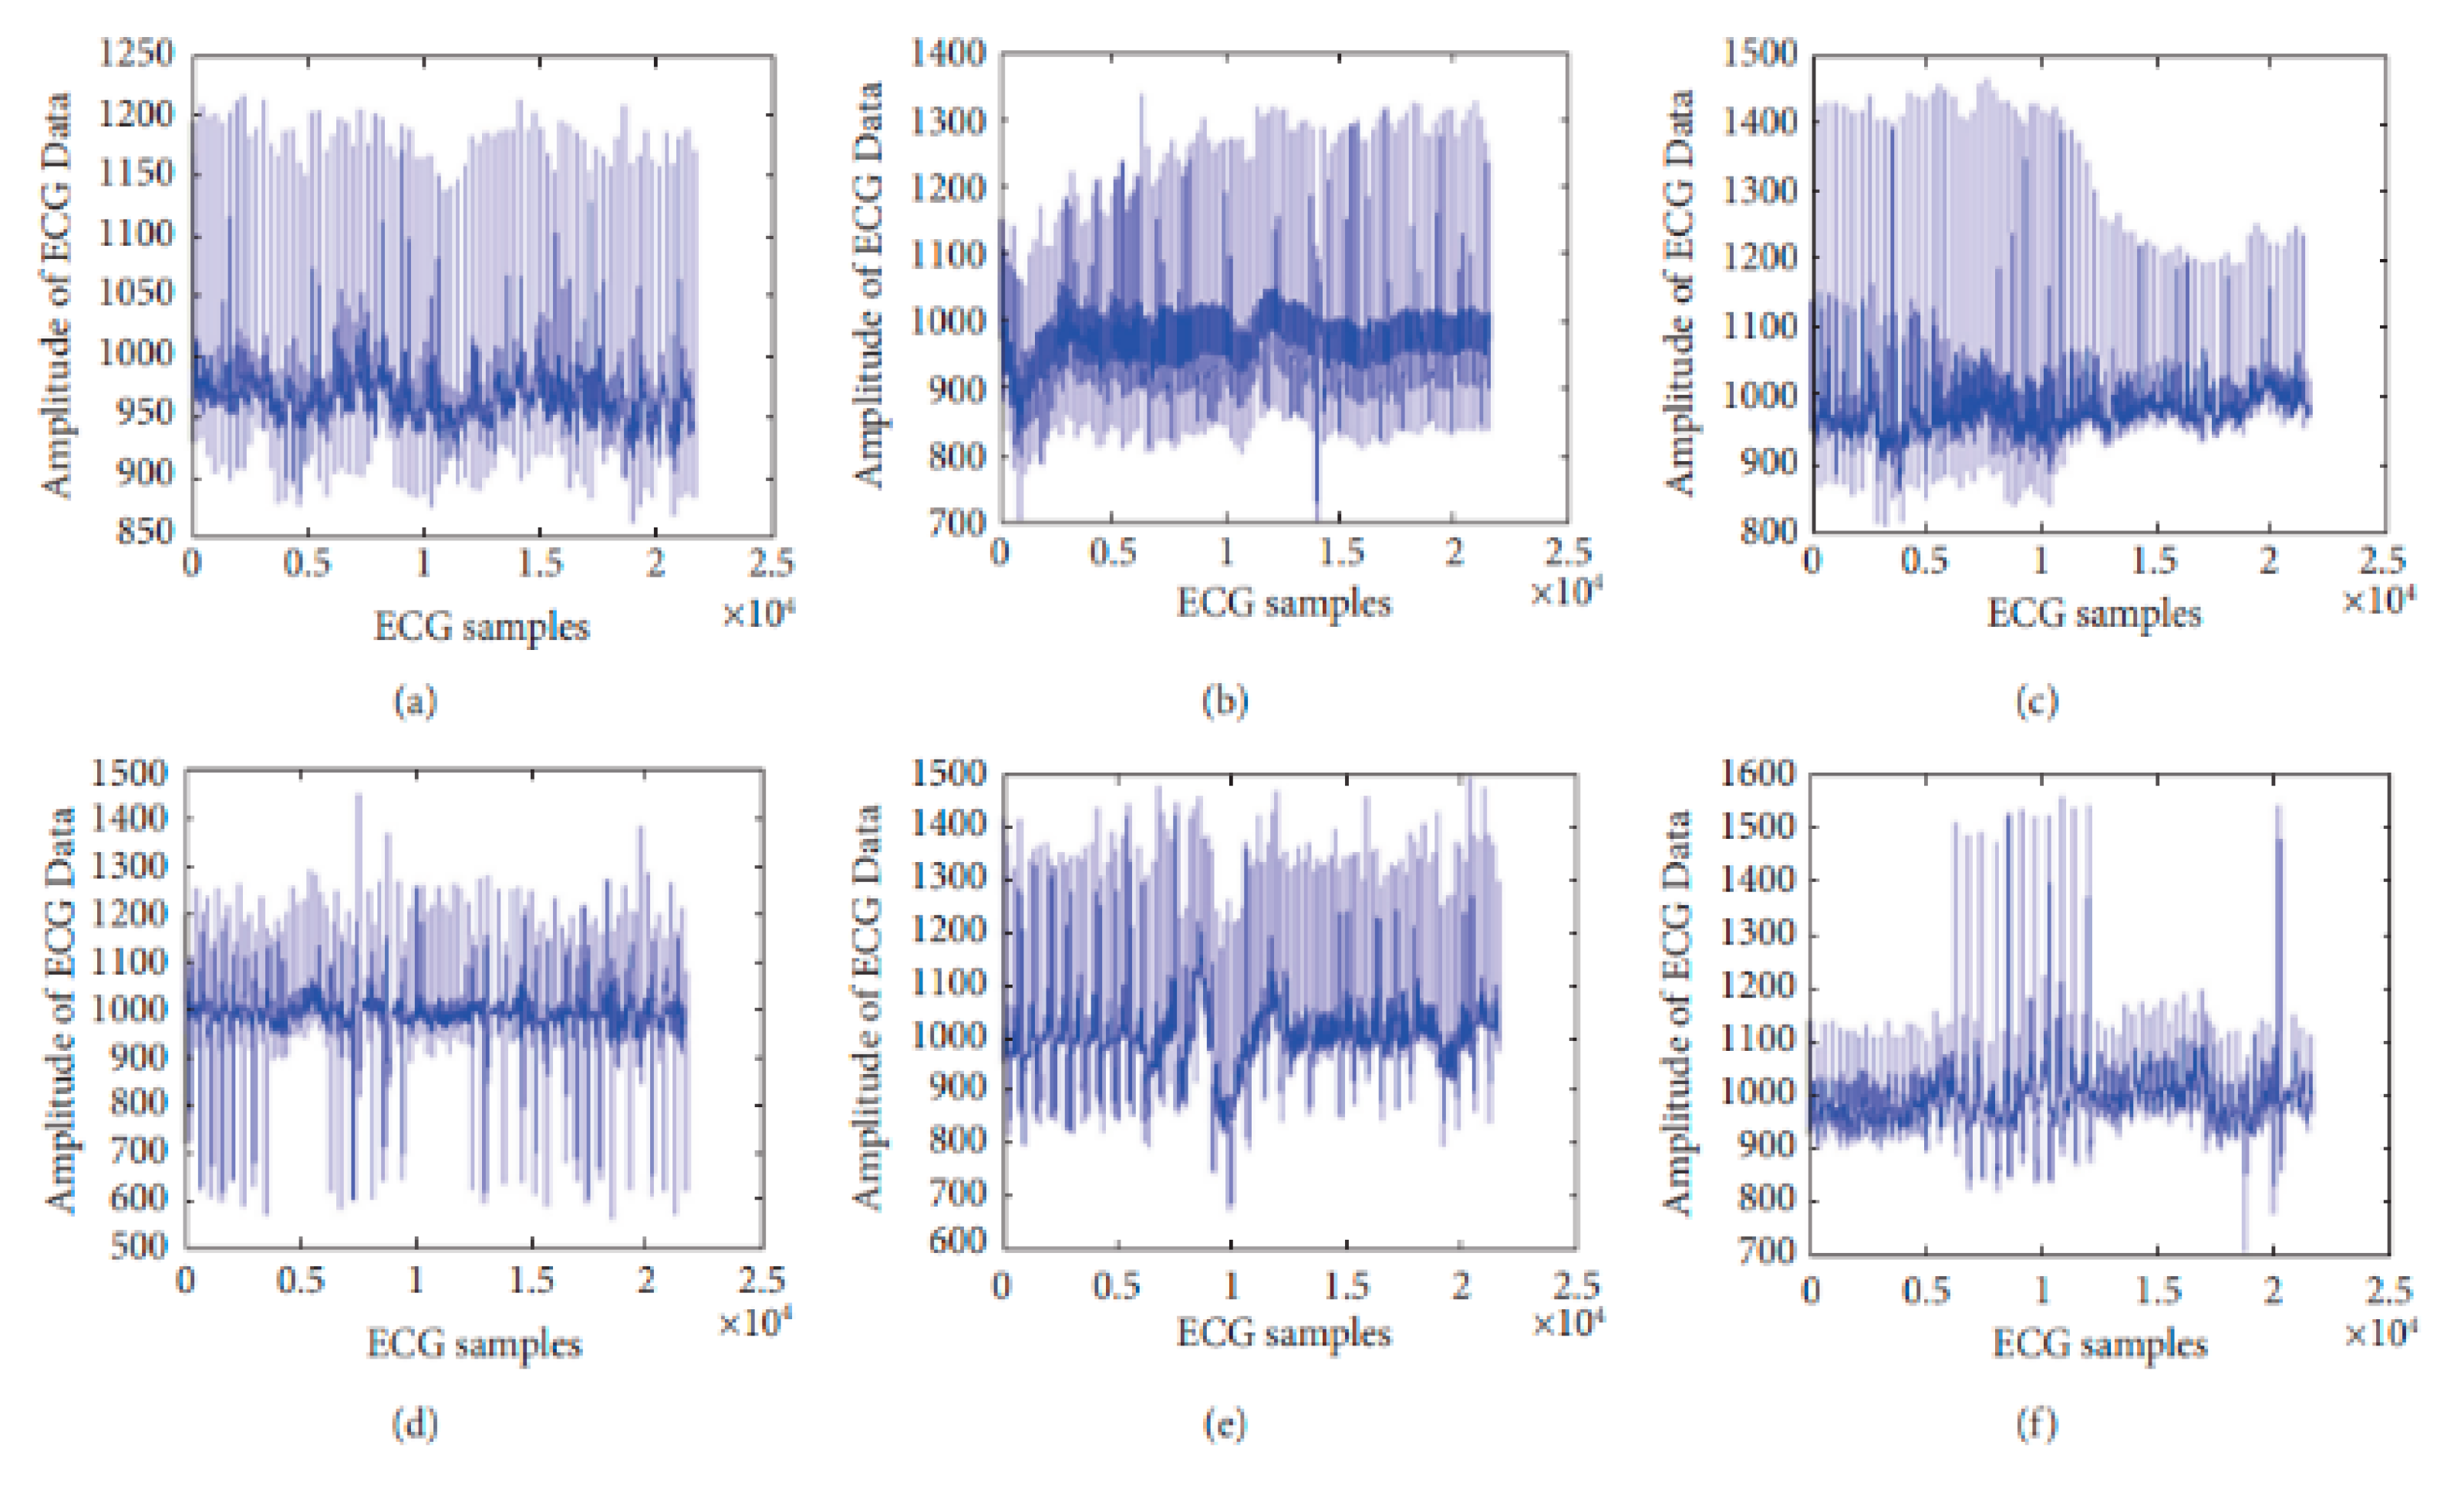
The ECG data containing occurrences of arrhythmia has 48 channels;
ii.
ECG characteristics are defined;
iii.
The standard QRS interval (0.098 s) and sampling frequency Fs (500 Hz), i.e., the QRS (t), are established;
iv.
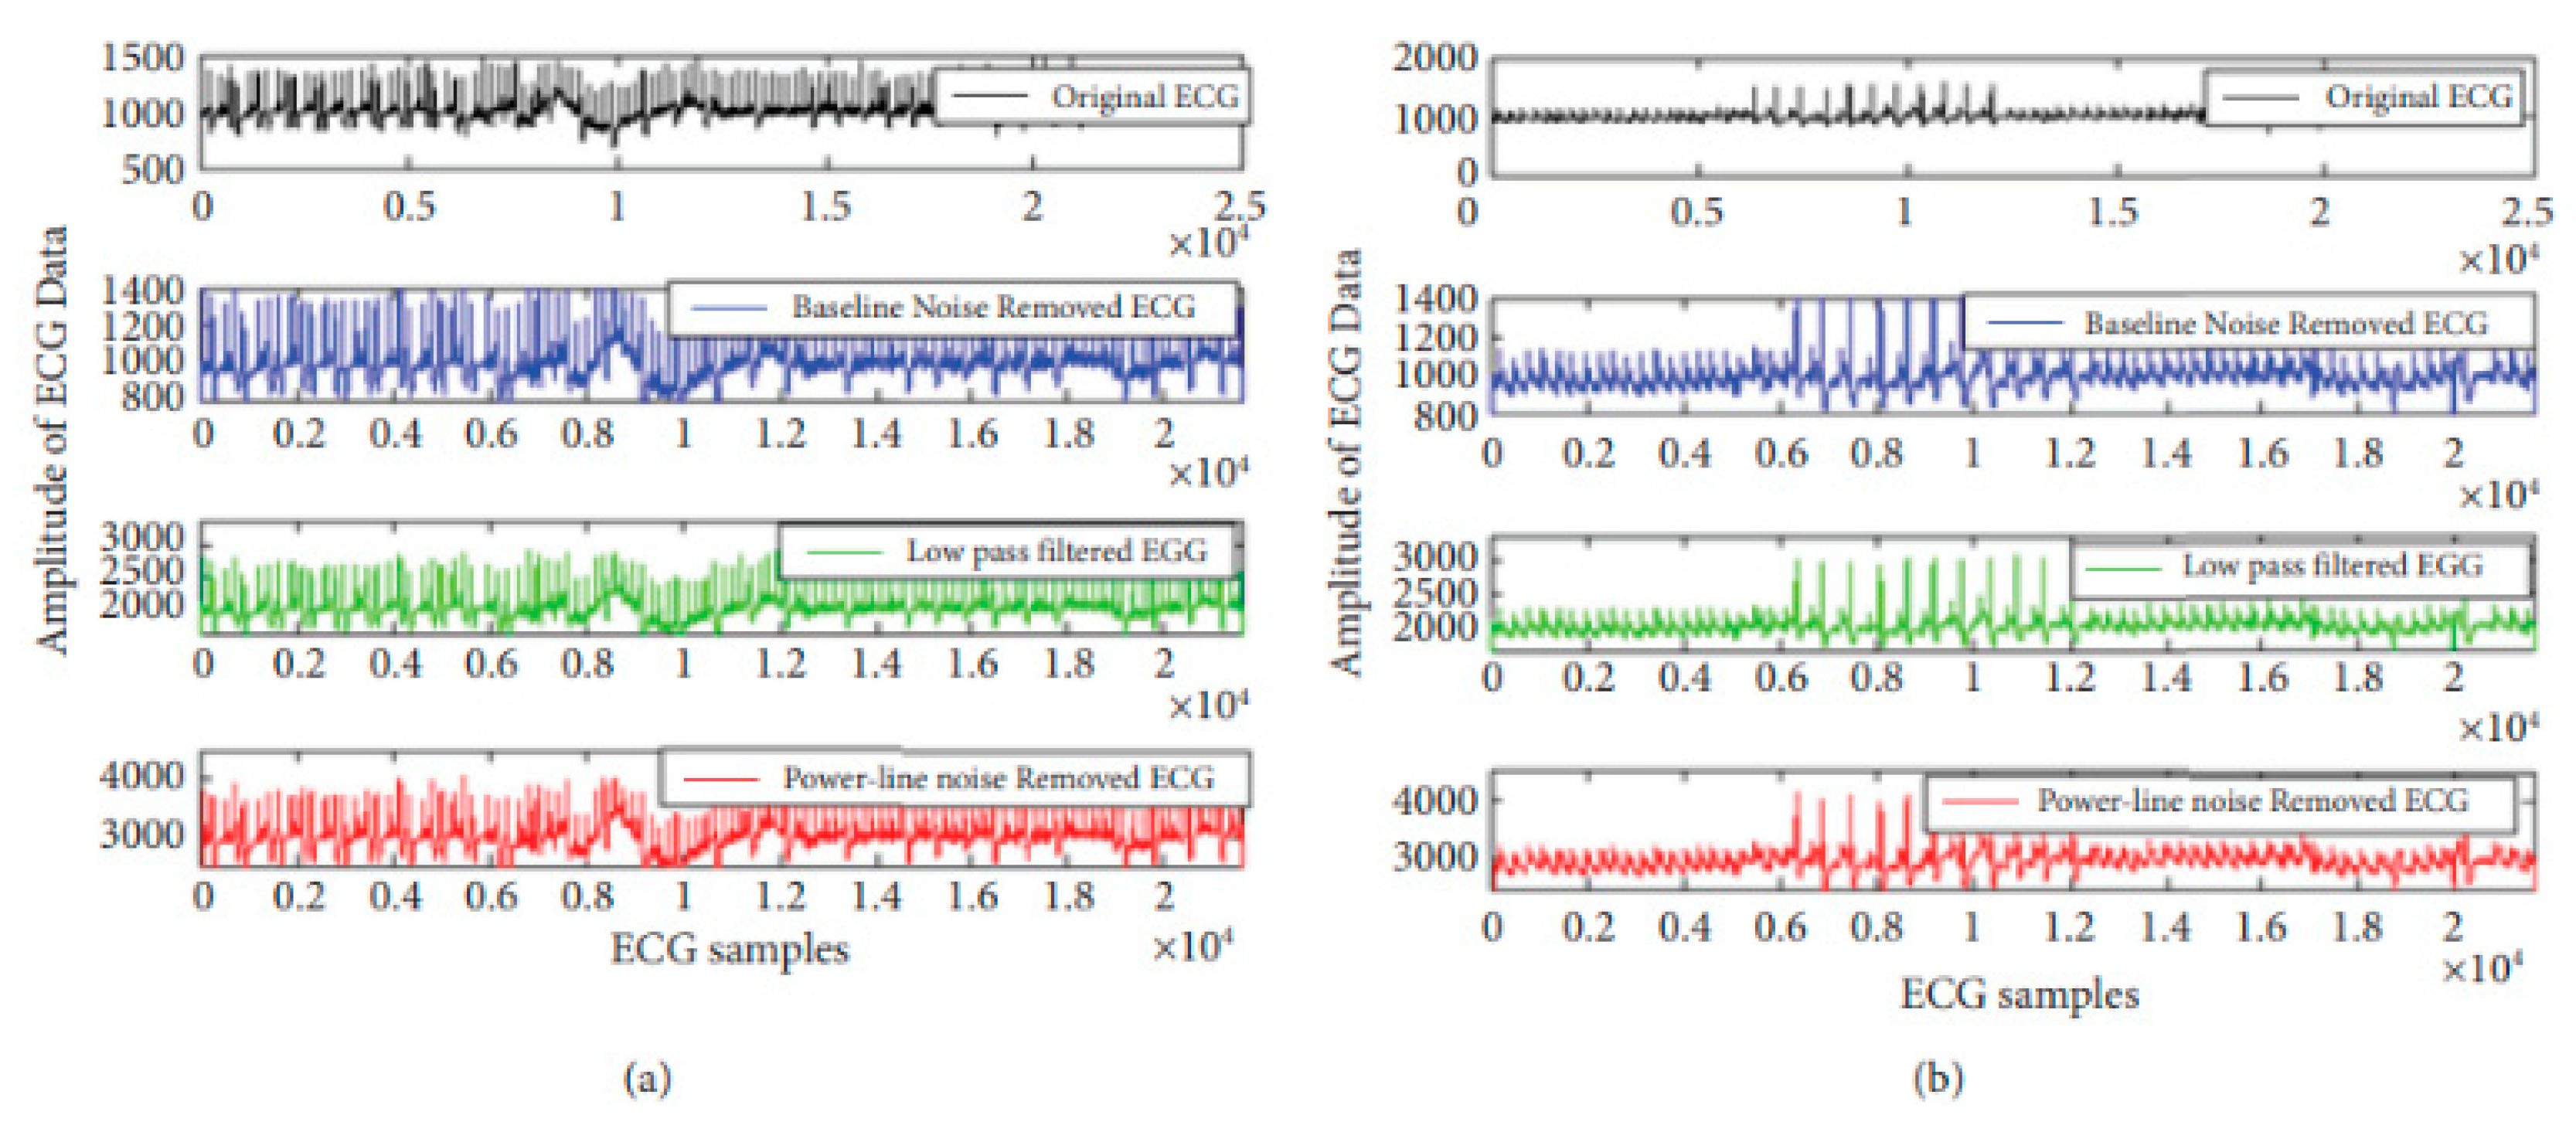
A 60-order IIR high pass filter is used to perform baseline wondering;
v.
The best 150 Hz IIR low-pass filter possible is created. An upper and lower cutoff frequency FL and FH are designed for a pass band Butterworth filter. A stop band is created (Figure 3b). FL1 and FH1 are the lower and higher cutoff frequencies for the Butterworth IIR filter;
vi.
With a 100-coefficient IIR stop band filter, interference from power lines is eliminated;
vii.
The average of the regular and irregular heart rates is determined.
The 30 ECG data, which contain a wide variety of ECG data, were chosen for the current investigation out of the 48 channels that humans have available. Figure 4 displays the input ECG data. At a rate of 360 samples per second, the following ECG data were captured. The ECG information is displayed in Figure 5a–f. The ECG data show the most erratic variations in these channels. Therefore, it is important to show how well the peak detection method works against them. These channels were chosen for another reason; several ECG peak detection techniques already in use, such the ones in Refs. [24,25,26,27,28,29,30,31,32,33,34], also take them into account.

6.1. Min–Max Optimization Enabled Filter Design

This research suggests a fundamental change to the ECG signal processing procedure in order to develop an optimal reduced-order IIR filter. In order to achieve smoothing, the proposed lower-order IIR filter design was used in place of the traditional FIR low-pass filters. The sequential results for the proposed IIR filter using optimization strategies for filtering the ECG signal are shown in the last row in results, making it evident that the projected technique significantly smooths out the artifacts while also maintaining the characteristics of the QRS peaks.

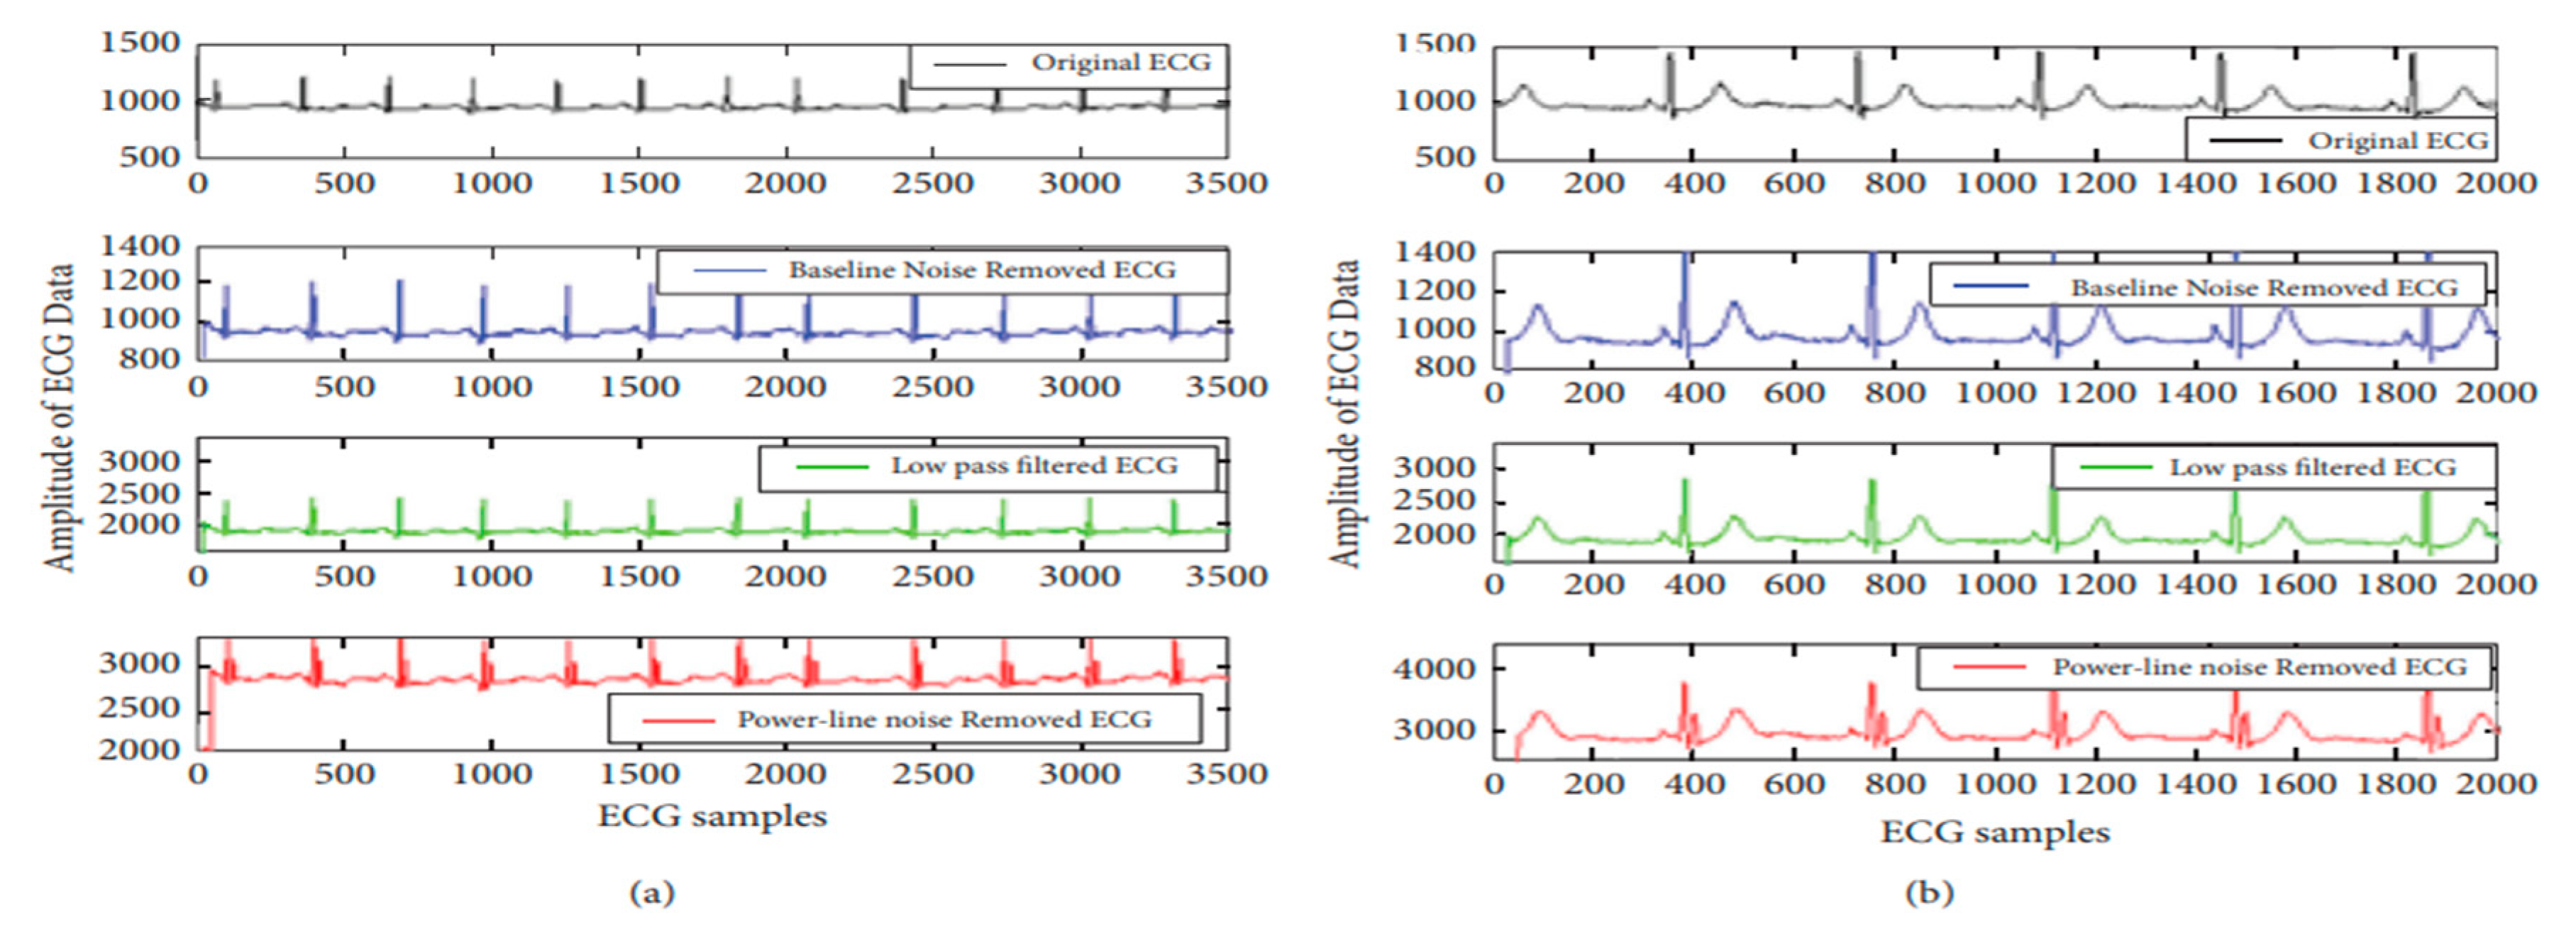
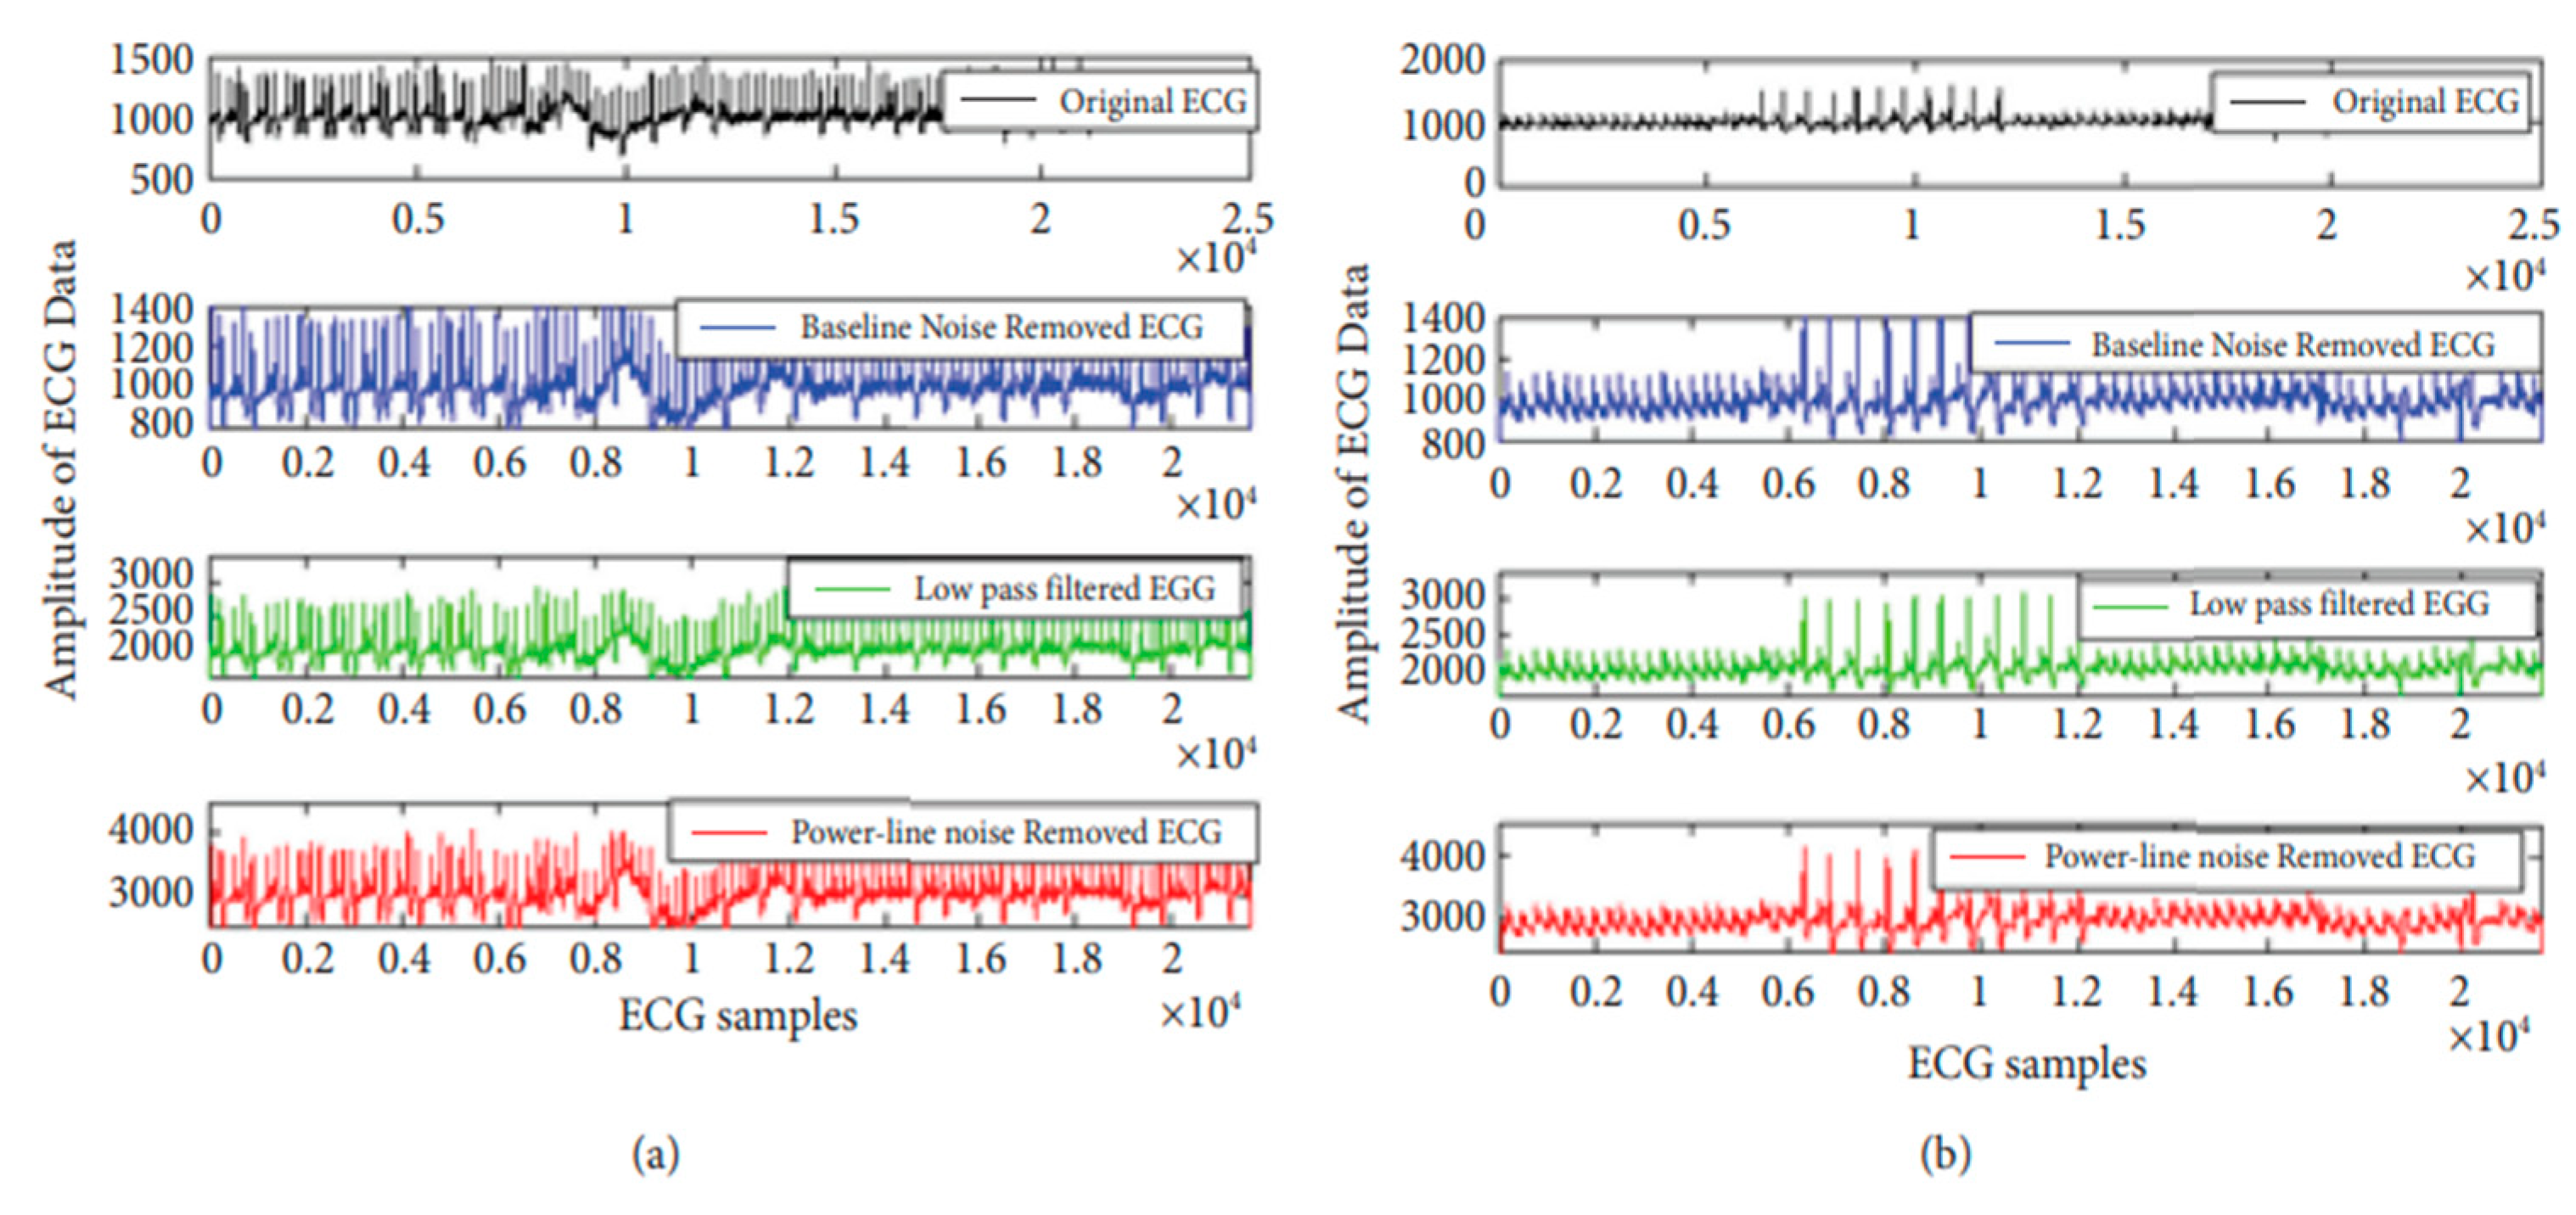
6.2. Results of Optimized Filter ECG Design

Figure 4 provides an outcome comparison for the suggested IIR filter design. Three filters are given after the results with a stop band as an IIR filter.

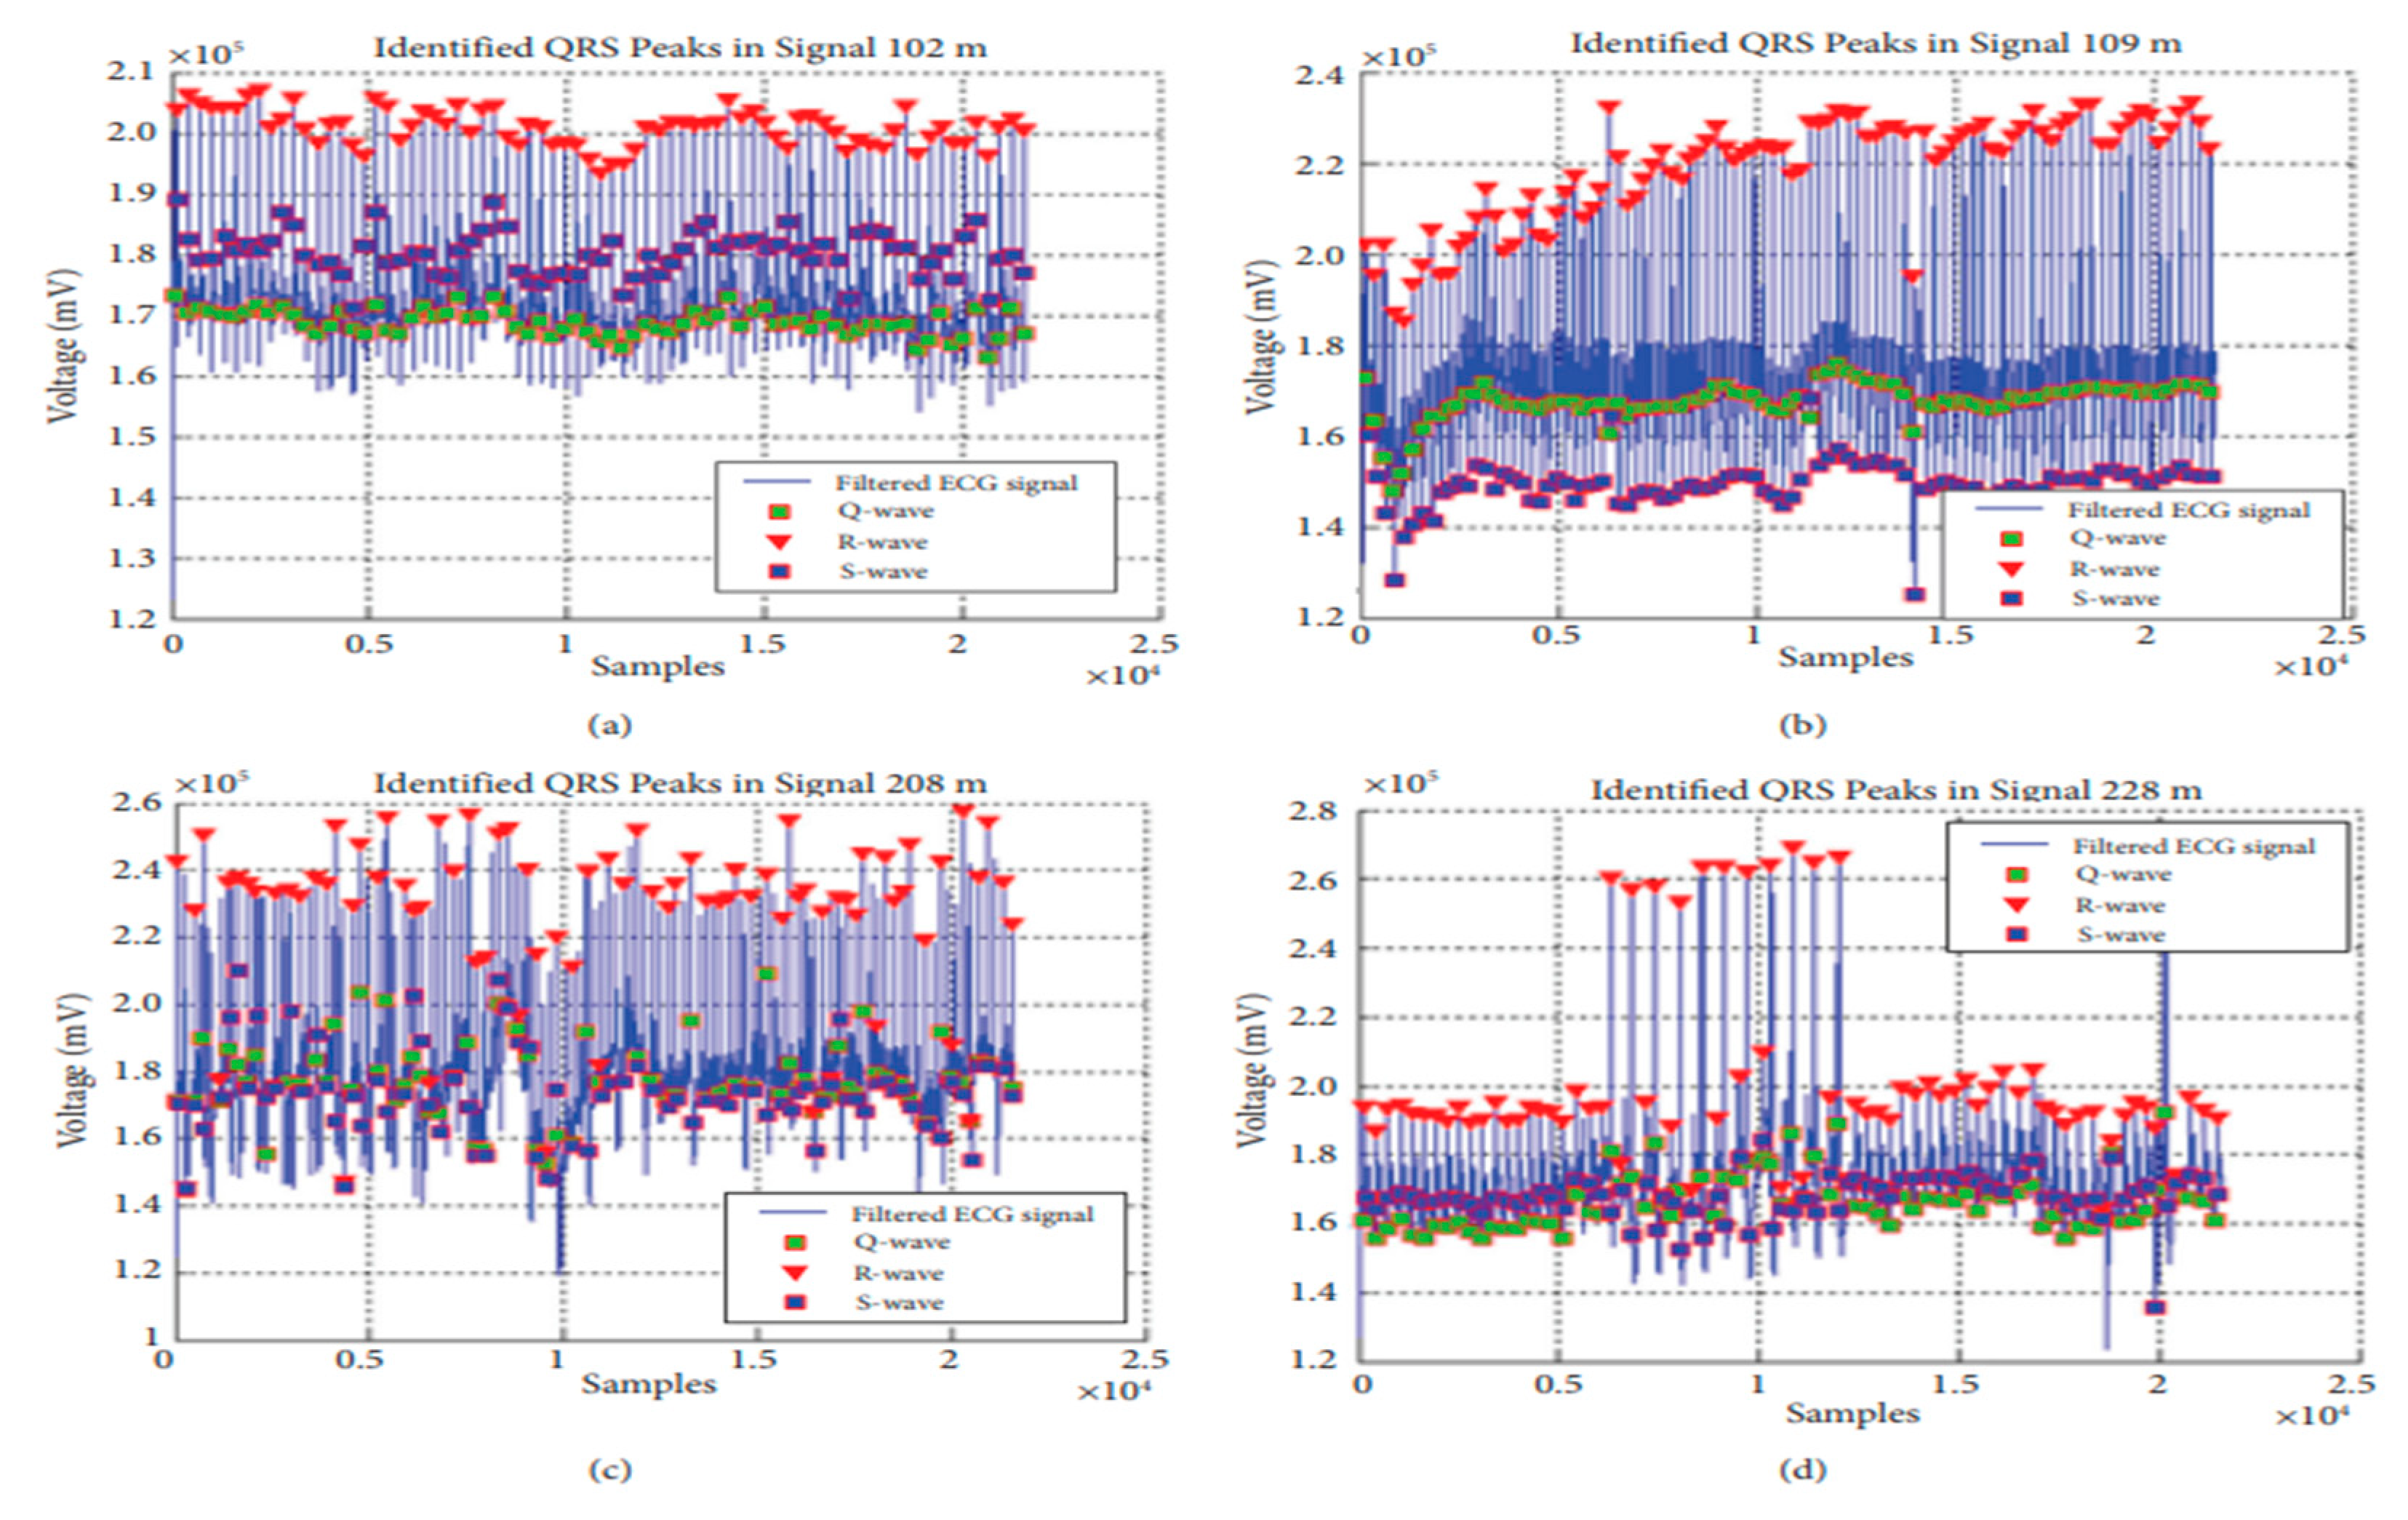
6.3. Simulation Results of QRS Peak Detection in MATLAB

From Figure 5 the proposed filter design, as can be seen, increases the magnitude of the following data, which are included in this collection: 100, 101, 102, 103, 104, 105, 100, 101, 102, 103, 104, 105, 106, 107, 108, 109, 111, 113, 114, 200, 201, 202, 203, 207, 208, 209, 210, 212, 213, 214, 215, 217, 219, 221, 222, and 228.

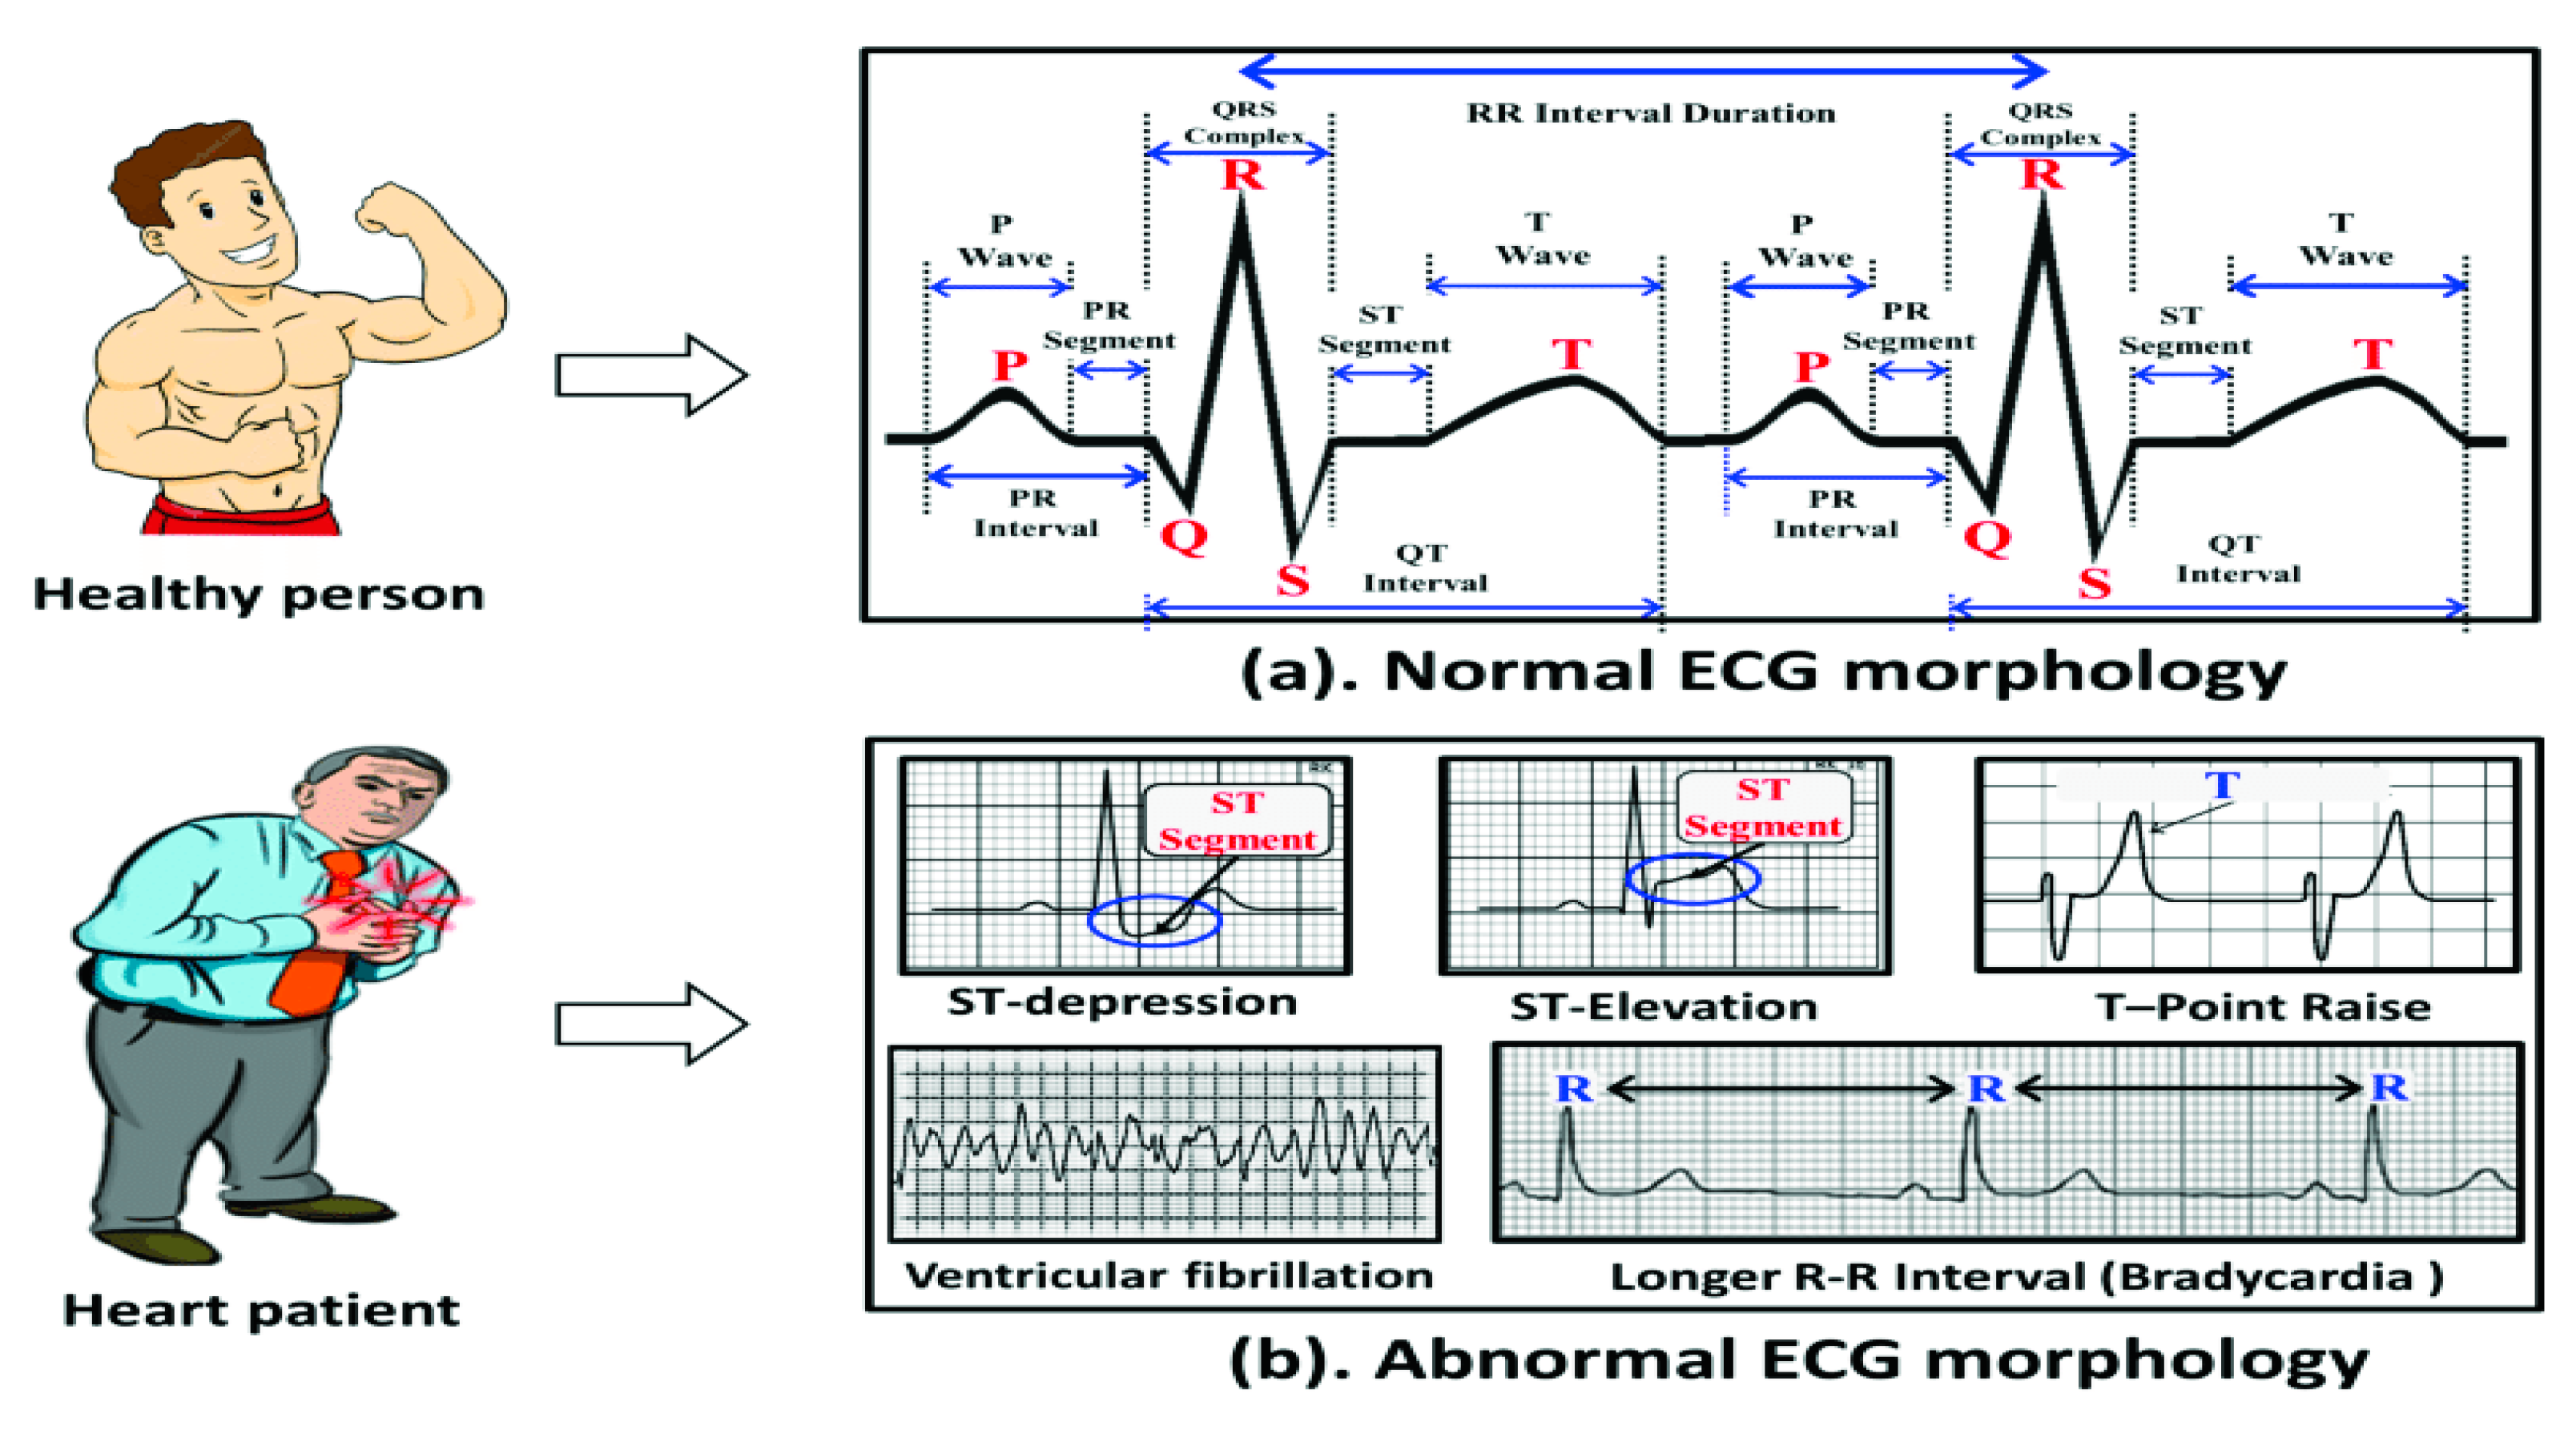
6.4. ECG Image Classification

Three distinct ECG classification rules were offered in our article. In the guidelines for the HRV-based ECG classifications of regular or irregular ECGs are enumerated. When the method fails to locate a precise beat, a false negative (Fn) is produced. Fns are taken out of the corresponding annotation case in the MIT-BIH record. An inaccurate beat outcome is referred to as a false positive (Fp), whereas a true positive (Tp) is indicated by a precise beat recognized using the suggested approach. Additionally, a true negative (Tn) is accurate, and does not include detected beats. From Figure 6 and Figure 7 we can analyze the ECG signals of the optimized and Hilbert transform filtered signals with respect to R peak detection efficiency.
The original ECG signal’s characteristics are preserved as well. With the improved filtering representation for the 3500 and 2000 initial samples, which is clearly displayed in Figure 8, further analysis becomes much clearer. The results for the ECG 110 m signal are shown in Figure 8a. Figure 8b shows a zoomed-in view of the filtering, which makes the baseline filtering effects for 2000 samples very obvious.
Figure 8a,b shows the number of samples taken into consideration for the experiment on the x-axis.

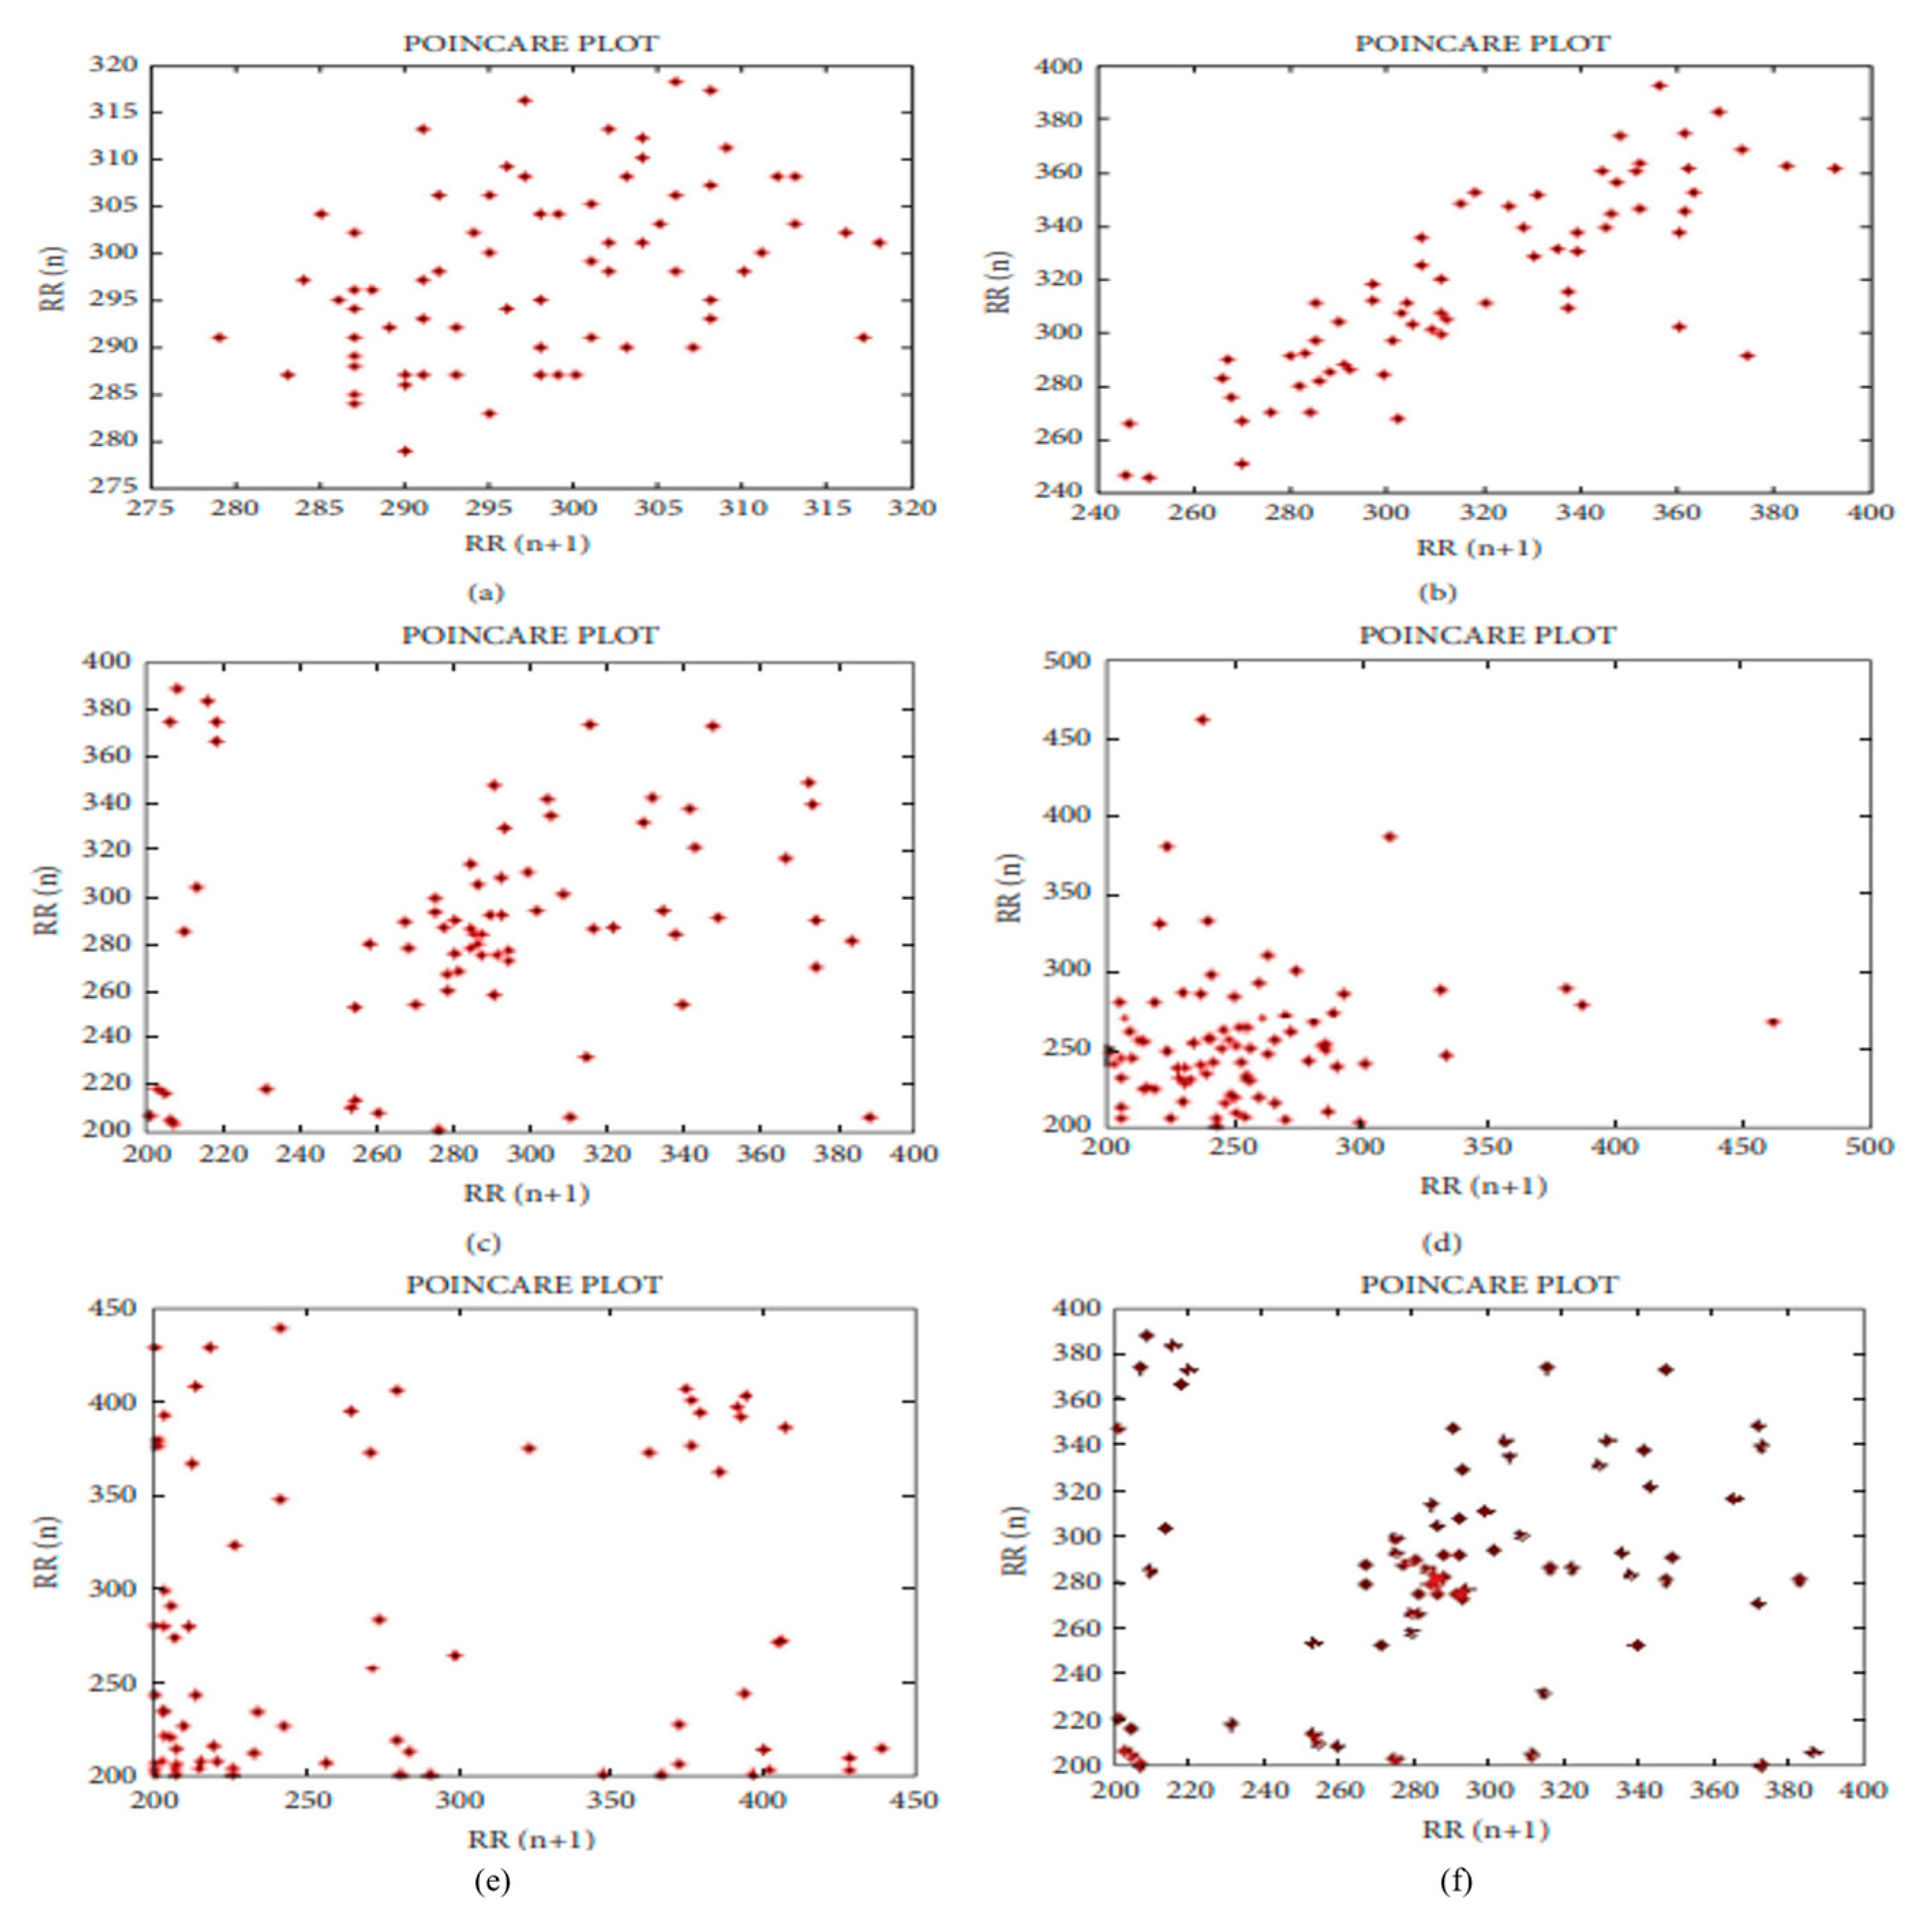
6.5. Time Domain HRV Parameter Analysis

The proposed ECG classification and peak detection approach includes the examination of time domain statistical HRV characteristics. Using the same RR intervals that were used to analyze the ECG signal, several parameters in the time domain were determined. The following definitions apply to the parameters which this study employed for analysis. Table 1 displays the statistical results of the measured parameters for the six input ECG signals using the suggested peak detection method. According to Table 1, SDNN was produced at its highest level for 228 m channels and at its lowest level for 106 m ECG channels
Maximum and lowest heart rate evaluations were conducted for the 106 m ECG channels, respectively. The most effective method for keeping track of the dynamic shift in self-care under anesthesia may be Poincare plotting. The point on the plot is represented by the value of each subsequent pair of RR intervals.
From Figure 9 The maximum evaluation of the parameter The minimal RMSSD was 106 m ECG channel for the following maths problems: 102m.mat, 106m.mat, and 102m.ECG. The following definitions apply to the parameters this study employed for analysis:
From Figure 10a–d, we are analyzing QRS peaks in signal 102 m, 109 m, 208 m and 228 m.
(a)
Standard deviation of NN interval (SDNN): For each pair of RR intervals is used to define the SDNN.
(b)
Root mean square SD (RMSSD):
RMSSD = 1 / M ( diff ( RR   region ) 2 )
where M is the RR interval vector’s length, denoted by the symbol RR region.
(c)
NN50 value: The number of R to R intervals that are longer than the 50 ms interval is known as the NN50 value.
The sequential results for the proposed IIR filter using optimization strategies for filtering the ECG signal are shown in the last row in Figure 10, making it evident that the projected technique significantly smooths out the artifacts while also maintaining the characteristics of the QRS peaks. Figure 11a,b are representing the signal preprocessing of the data for 101st and 106th ECG samples respectively.
By analyzing of Figure 12 from (a) to (f), the most effective method for keeping track of the dynamic shift in self-care under anesthesia may be Poincare plotting. The point on the plot is represented by the value of each subsequent pair of RR intervals.

7. Conclusions

QRS peak detection helps to detect diseases and heart rate variability (HRV). The temporal history affects HRV detection. This study proposed a new ECG data classification and QRS peak detection method. The min–max method optimizes reduced-order filter coefficients. This study proposes a fuzzy-based ECG classification rule to improve performance. The projected ideal filter increases amplitude and maintains ECG characteristics, thus improving detection. The classification rule increases true positives and decreases false negatives. This study reported Poincare plot results of ECG analysis. The projected filter with the optimization method outperformed the other methods, because it achieved 100% precession and improved accuracy by 13.5% over the basic Pan–Tompkins approach and by 8.1% over the current IIR-filter-based classification rules. We hope to find more ECG signal peaks using our analysis method. The identification of ECG peaks can be used for many CVD detection applications.

Author Contributions

Conceptualization, N.M. and N.P.S.; methodology, N.M. and N.P.S.; software, N.M.; validation, N.M., N.P.S., and P.A.B.; formal analysis, N.M.; investigation, N.M.; resources, N.M.; data curation, N.M.; writing—original draft preparation, N.M.; writing—review and editing, N.M.; visualization, N.M.; supervision, N.P.S.; project administration, N.M. and N.P.S.; funding acquisition, N.P.S. and P.A.B. All authors have read and agreed to the published version of the manuscript.

Funding

This research received no external funding.

Institutional Review Board Statement

Not applicable.

Informed Consent Statement

Not applicable.

Data Availability Statement

Not applicable.

Acknowledgments

We would like to thank our supervisors for their constant encouragement and guidance toward this research work. Special thanks to Koneru Lakshmaiah Education Foundation (K L Deemed to be University) for providing institutional facilities and necessary administrative and authoritative assistance during University work.

Conflicts of Interest

The authors declare no conflict of interest.

References

  1. Benmalek, M.; Charef, A. Digital fractional order operators for R-wave detection in electrocardiogram signal. IET Signal Process. 2009, 3, 381–391. [Google Scholar] [CrossRef]
  2. Kaya, Y.; Pehlivan, H.; Tenekeci, M.E. Effective ECG beat classification using higher order statistic features and genetic feature selection. J. Biomed. Res. 2017, 28, 7594–7603. [Google Scholar]
  3. Pandit, S.; Shukla, P.K.; Tiwari, A.; Shukla, P.K.; Maheshwari, M.; Dubey, R. Review of video compression techniques based on fractal transform function and swarm intelligence. Int. J. Mod. Phys. B 2020, 34, 2050061. [Google Scholar] [CrossRef]
  4. Kaya, Y.; Pehlivan, H. Feature selection using genetic algorithms for premature ventricular contraction classification. In Proceedings of the Ninth International Conference on IEEE Electrical and Electronics Engineering, Bursa, Turkey, 26–28 November 2015; pp. 1229–1232. [Google Scholar]
  5. Shukla, P.K.; Sandhu, J.K.; Ahirwar, A.; Ghai, D.; Maheshwary, P.; Shukla, P.K. Multiobjective Genetic Algorithm and Convolutional Neural Network Based COVID-19 Identification in Chest X-ray Images. Math. Probl. Eng. 2021, 2021, 7804540. [Google Scholar] [CrossRef]
  6. Manikandan, M.S.; Seaman, K.P. A novel method for detecting R-peaks in electrocardiogram (ECG) signal. J. Biomed. Signal Process. Control. 2012, 7, 118–128. [Google Scholar] [CrossRef]
  7. Roy, V.; Shukla, S. Designing Efficient Blind Source Separation Methods for EEG Motion Artifact Removal Based on Statistical Evaluation. Wirel. Pers. Commun. 2019, 108, 1311–1327. [Google Scholar] [CrossRef]
  8. Kaur, H.; Rajni, R. On the detection of Cardiac Arrhythmia with Principal Component Analysis. Wirel. Pers. Commun. 2017, 97, 5495–5509. [Google Scholar] [CrossRef]
  9. Padmavathi, K.; Ramakrishna, K.S. Classification of ECG Signal during Atrial Fibrillation Using Autoregressive Modeling. Procedia Comput. Sci. 2015, 46, 53–59. [Google Scholar] [CrossRef]
  10. Roy, V.; Shukla, P.K.; Gupta, A.K.; Goel, V.; Shukla, P.K.; Shukla, S. Taxonomy on EEG Artifacts removal methods, issues, and healthcare applications. J. Organ. End User Comput. 2021, 33, 19–46. [Google Scholar] [CrossRef]
  11. Peterkova, A.; Stremy, M. The raw ECG signal processing and the detection of QRS complex. In Proceedings of the IEEE European Modelling Symposium, Madrid, Spain, 6–8 October 2015. [Google Scholar]
  12. Pan, J.; Tompkins, W.J. A real-time QRS detection algorithm. IEEE Trans. Biomed. Eng. 1985, 32, 230–236. [Google Scholar] [CrossRef]
  13. Roy, V.; Shukla, S.; Shukla, P.K.; Rawat, P. Gaussian Elimination-Based Novel Canonical Correlation Analysis Method for EEG Motion Artifact Removal. J. Health Eng. 2017, 2017, 9674712. [Google Scholar] [CrossRef] [PubMed]
  14. Verma, V.; Rathore, S.S. Comparative study of QRS complex detection by threshold technique. Int. J. Adv. Eng. Technol. 2015, 8, 22311963. [Google Scholar]
  15. Salih, S.K.; Aljunid, S.A.; Yahya, A.; Ghailan, K.Y. A novel approach for detecting QRS complex of ECG signal. Int. J. Comput. Sci. Issues 2012, 9, 205. [Google Scholar]
  16. Roy, V.; Shukla, S. A methodical health-care model to eliminate motion artifacts from big EEG data, JOEUC, big data analytics in business. Healthc. Gov. 2016, 29, 1546–2234. [Google Scholar]
  17. Sharma, T.; Sharma, K.K. QRS complex detection in ECG signals using the synchros queezed wavelet transform. IETE J. Res. 2016, 62, 885–892. [Google Scholar] [CrossRef]
  18. Naaz, A.; Singh, M. QRS complex detection and ST segmentation of ECG signal using wavelet transform. Int. J. Res. Advent Technol. 2015, 3, 45–50. [Google Scholar]
  19. Moody, G.B.; Mark, R.G. The impact of the MIT-BIH Arrhythmia Database. IEEE Eng. Med. Biol. Mag. 2001, 20, 45–50. [Google Scholar] [CrossRef]
  20. Dohare, A.K.; Kumar, V.; Kumar, R. An efficient new method for the detection of QRS in electrocardiogram. Comput. Electr. Eng. 2014, 40, 1717–1730. [Google Scholar] [CrossRef]
  21. Kaur, I.; Rajni, R.; Marwaha, A. ECG Signal Analysis and Arrhythmia Detection using Wavelet Transform. J. Inst. Eng. Ser. B 2016, 97, 499–507. [Google Scholar] [CrossRef]
  22. Benitez, D.; Gaydecki, P.A.; Zaidi, A.; Fitzpatrick, A.P. +e use of the Hilbert transform in ECG signal analysis. Comput. Biol. Med. 2001, 31, 399–406. [Google Scholar] [CrossRef]
  23. Hamilton, P.S.; Tompkins, W.J. Quantitative investigation of QRS detection rules using the MIT/BIH arrhythmia database. IEEE Trans. Biomed. Eng. 1986, 33, 1157–1165. [Google Scholar] [CrossRef] [PubMed]
  24. Sun, Y.; Chan, K.L.; Krishnan, S.M. Characteristic wave detection in ECG signal using morphological transform. BMC Cardiovasc. Disord. 2005, 5, 28. [Google Scholar] [CrossRef] [PubMed]
  25. Sargar, L.S.; Gharat, M.M.; Bhat, S.N.; Bagal, U.R. Automated detection of R-peaks in electrocardiogram. Int. J. Sci. Eng. Res. 2015, 6, 1265–1269. [Google Scholar]
  26. Qin, Q.; Li, J.; Yue, Y.; Liu, C. An adaptive and time efficient ECG R-peak detection algorithm. J. Healthcare Eng. 2017, 2017, 14. [Google Scholar] [CrossRef] [PubMed]
  27. Slimane, Z.H.; Ali, A.N. QRS complex detection using empirical mode decomposition. Digit. Signal Process. 2010, 20, 1221–1228. [Google Scholar] [CrossRef]
  28. Sivakumar, R.; Tamilselvi, R.; Abinaya, S. Noise analysis & QRS detection in ECG signals. Int. Conf. Comput. Technol. Sci. 2012, 47, 141–146. [Google Scholar]
  29. Khan, M.T.; Ahamed, S.R. A New High Performance VLSI Architecture for LMS Adaptive Filter Using Distributed Arithmetic. In Proceedings of the 2017 IEEE Computer Society Annual Symposium on VLSI (ISVLSI), Bochum, Germany, 3–5 July 2017; IEEE: New York, NY, USA; pp. 219–224. [Google Scholar]
  30. Haykin, S.; Widrow, B. Least-Mean-Square Adaptive Filters; Wiley-Interscience: Hoboken, NJ, USA, 2003. [Google Scholar]
  31. Allred, D.; Yoo, H.; Krishnan, V.; Huang, W.; Anderson, D. LMS adaptive filters using distributed arithmetic for high throughput. IEEE Trans. Circuits Syst. I Regul. Pap. 2005, 52, 1327–1337. [Google Scholar] [CrossRef]
  32. Krad, H.; Al-Taie, A.Y. Performance Analysis of a 32-Bit Multiplier with a Carry-Look-Ahead Adder and a 32-bit Multiplier with a Ripple Adder using VHDL. J. Comput. Sci. 2008, 4, 305–308. [Google Scholar] [CrossRef]
  33. Mottaghi-Dastjerdi, M.; Afzali-Kusha, A.; Pedram, M. BZ-FAD: A Low-Power Low-Area Multiplier Based on Shift-and-Add Architecture. IEEE Trans. Very Large Scale Integr. (VLSI) Syst. 2009, 17, 302–306. [Google Scholar] [CrossRef]
  34. Saha, A.; Pal, D.; Chandra, M. Low-power 6-GHz wave-pipelined 8b × 8b multiplier. IET Circuits Devices Syst. 2013, 7, 124–140. [Google Scholar] [CrossRef]
Figure 1. Two-cycle regular ECG waveform.
Engproc 34 00024 g001
Figure 2. (a) Healthy ECG; (b) diseased ECG.
Engproc 34 00024 g002
Figure 3. (a): Image detection and classification methods.(b): Basic IIR filter design procedure in two stages.
Engproc 34 00024 g003
Figure 4. Data from the 5.556-s ECG arrhythmia database of 35 people recorded for more than 25 min at the MIT-BIH/Physio Net were used in the current investigation.
Engproc 34 00024 g004
Figure 5. For perceptual result representation, six distinct ECG data with various feature difficulties were taken into account: (a) 102, (b) 106, (c) 109, (d) 200, (e) 208, and (f) 228.
Engproc 34 00024 g005
Figure 6. Hilbert transform for channel number 104.
Engproc 34 00024 g006
Figure 7. The channel number 228’s R peak detection efficiency.
Engproc 34 00024 g007
Figure 8. For the 3500 samples, ECG signal pre-processing is plotted for the (a) 101st ECG data and (b) 106th ECG data.
Engproc 34 00024 g008
Figure 9. A signal provides a effects of ECG signal artifact reduction. (a) 101st ECG data, (b) 106th ECG data.
Engproc 34 00024 g009
Figure 10. Results of the suggested optimum IIR filter technique for QRS peak identification for four ECG signals.
Engproc 34 00024 g010
Figure 11. For collected more samples, ECG signal pre-processing is plotted for the (a) 101st ECG data and (b) 106th ECG data.
Engproc 34 00024 g011
Figure 12. (af) Results of HRV analysis for point on the plot is represented by the value of each subsequent pair of RR intervals.
Engproc 34 00024 g012
Table 1. Comparative analysis for statistics parameters of existing method with proposed method.
Ref. No.AccuracyQRS Peak
Detection
RR IntervalHRV Analysis
[2]85%NoNo detectedNo
[4]85.6%NoNo detectedNo
[6]88%NoNo detectedYES
[8]89%NoNo detectedNo
[14]90%YESdetectedYES
[20]91%YESdetectedNo
[26]92.67%YESdetectedYES
This work96.87%YESdetectedYES
Disclaimer/Publisher’s Note: The statements, opinions and data contained in all publications are solely those of the individual author(s) and contributor(s) and not of MDPI and/or the editor(s). MDPI and/or the editor(s) disclaim responsibility for any injury to people or property resulting from any ideas, methods, instructions or products referred to in the content.

