Proceeding Paper

Study on Affect by Calculation Algorithm for Material Probability Curve to Roughness Parameters of Plateau Surface †

1
Graduate School of Science and Engineering, Hosei University, Tokyo 102-8160, Japan
2
Department of Mechanical Engineering, Faculty of Science and Engineering, Hosei University, Tokyo 102-8160, Japan
*
Author to whom correspondence should be addressed.
Presented at the 3rd International Electronic Conference on Applied Sciences, 1–15 December 2022; Available online: https://asec2022.sciforum.net/.
Eng. Proc. 2023, 31(1), 79; https://doi.org/10.3390/ASEC2022-13795
Published: 2 December 2022
(This article belongs to the Proceedings of The 3rd International Electronic Conference on Applied Sciences)

Abstract

:
The automotive industry requires effective evaluation methods for the quality control of automobile parts and bearings. The ISO standard defines the calculation of roughness parameters from the material ratio curve (“MRC”) and material ratio curve on normal probability paper (“MPC”) as effective methods for evaluating surfaces with excellent lubrication and frictional characteristics. ISO 4287 specifies the slice method as a calculation method for the MRC. The analysis time of the slice method is long due to the large amount of calculation required. Therefore, ISO 21920-2 specifies the use of the sort method. The sort method reduces the analysis time significantly due to the small amount of calculation required. A previous study revealed that errors occur in the MRC using the sort method compared to the slice method. However, the previous study concluded that the errors were acceptable compared to the time cost. In addition, the plateau surface is a surface with excellent sliding properties. The roughness parameters of the plateau surface have to be calculated from the MPC. However, in the case of expression on normal probability paper, the difference between MRCs calculated by the sort and slice methods increases as both ends approach. Therefore, the results of roughness parameters calculated by each MPC are expected to be different. This study reports the results of an investigation into the effect that increasing differences have on the roughness parameters. We aim to contribute to the establishment of a highly effective evaluation method by verifying the validity of using the sort method in the calculation of the MPC.

1. Introduction

The automotive industry is required to reduce the environmental load and improve the performance of mechanical parts. Therefore, effective evaluation methods are required for the quality control of automotive parts. The International Organization for Standardization (ISO) specifies roughness parameters obtained from the material ratio curve (MRC) and material ratio curve on normal probability paper (MPC) as effective evaluation methods for surfaces with excellent lubrication and friction characteristics [1,2,3,4]. Figure 1a,b shows the MRC and MPC, respectively. In ISO 4287 [5], the standard method for calculating the MRC is the slice method [6]. Owing to the large amount of calculation, the analysis time of the slice method is long [4,7,8]. Therefore, to significantly reduce the analysis time, ISO 21920-2 [9] specifies the use of the sort method that requires a small amount of calculation. A previous study [8,10] revealed that the differences in calculation of the two methods lead to errors in the MRC calculated by the sort method compared to that of the slice method. In addition, the previous study concluded that the error was within an acceptable range, considering the short analysis time of the sort method [10]. On the other hand, the MPC, not the MRC, is used to evaluate surfaces with excellent sliding properties [3,9]. However, when plotted on a normal probability paper, the difference between the MRCs calculated using the sort and slice methods increases as one approaches the two ends of the paper. Therefore, the roughness parameters calculated from the MPCs by the slice and sort methods may produce different results. This study reports the effect of an increase in errors on the roughness parameters. We aim to contribute to the establishment of an effective evaluation method by verifying the validity of using the sort method in the calculation of the MPC.

2. Errors Owing to the MRC Calculation Method

The MRC is a curve representing the ratio of the material and void parts of a surface profile with respect to the height direction [9]. ISO 4287 specifies the slice method as the method for calculating the MRC [5]. The steps for calculating the MRC with the slice method are as follows:
  • Set the slice height;
  • Calculate the intersections of the roughness curve and the slice height;
  • Calculate the length of the material part between intersections;
  • Calculate the sum of the lengths of the material parts;
  • Calculate the material ratio MR by substituting the sum of the lengths of the material parts L and evaluated length E into Equation (1).
MR = L/E × 100
The slice method calculates the ratio of the material and void parts of the roughness profile from intersections of the slice height and roughness curve. Therefore, an increase in the number of data points increases the number of intersections, which in turn increases the calculation time. Furthermore, the calculation time increases owing to an increase in the number of times the roughness profile is sliced. Therefore, ISO 21920-2 [9] specifies the sort method to reduce the calculation time. The steps for calculating the MRC using the sort method are as follows:
  • Sort the roughness data in descending order;
  • Calculate the material ratio MR by substituting the evaluated length E, rank N, and pitch Δx into Equation (2).
MR = ({(N − 1) × ∆x})/E × 100
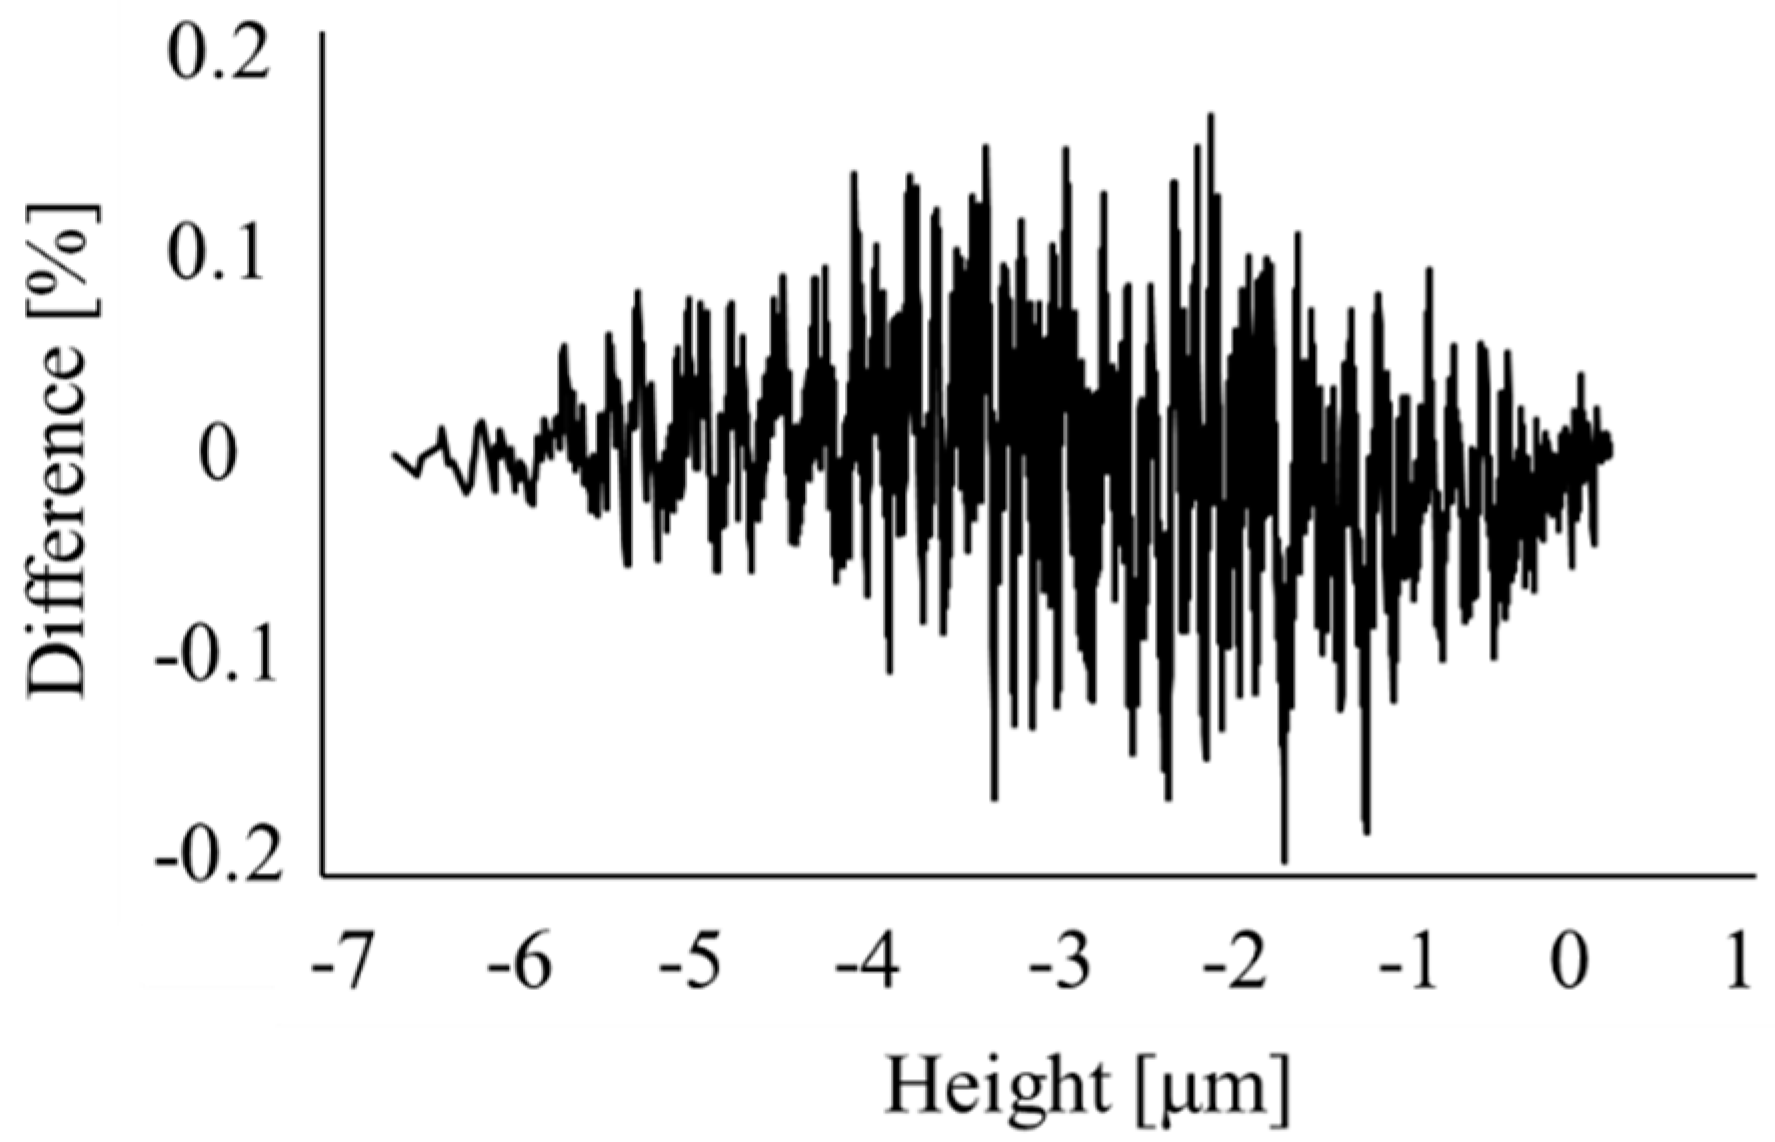
The sort method only calculates Equation (2) after sorting the roughness data in descending order. The calculation time of the sort method is shorter than that of the slice method because the sort method requires fewer calculations with respect to height. Therefore, ISO 21920-2 [9] recommends using the sort method to calculate the MRC. However, the differences in the calculation of the two algorithms can lead to errors in the MRC. Figure 2 shows the error in the MRCs by the slice and sort methods. Figure 2 shows that the maximum error is 0.16%. A reason for the error is that in the case of a series of data points of the same height (hereafter referred to as “continuous points”), the occurrence of duplicate counts leads to erroneous calculations. A previous study developed an improved sort method to solve this problem of calculating contiguous points [8,10]. As a result, the improved sort method eliminated errors due to continuous points. In addition, the analysis time of the improved sort method reduced to less than 1/10,000 that of the slice method. Therefore, the previous study [10] concluded that the error of the improved sort method relative to the slice method was acceptable with respect to the analysis time.

3. Influence on the Evaluation Method for Plateau Surfaces

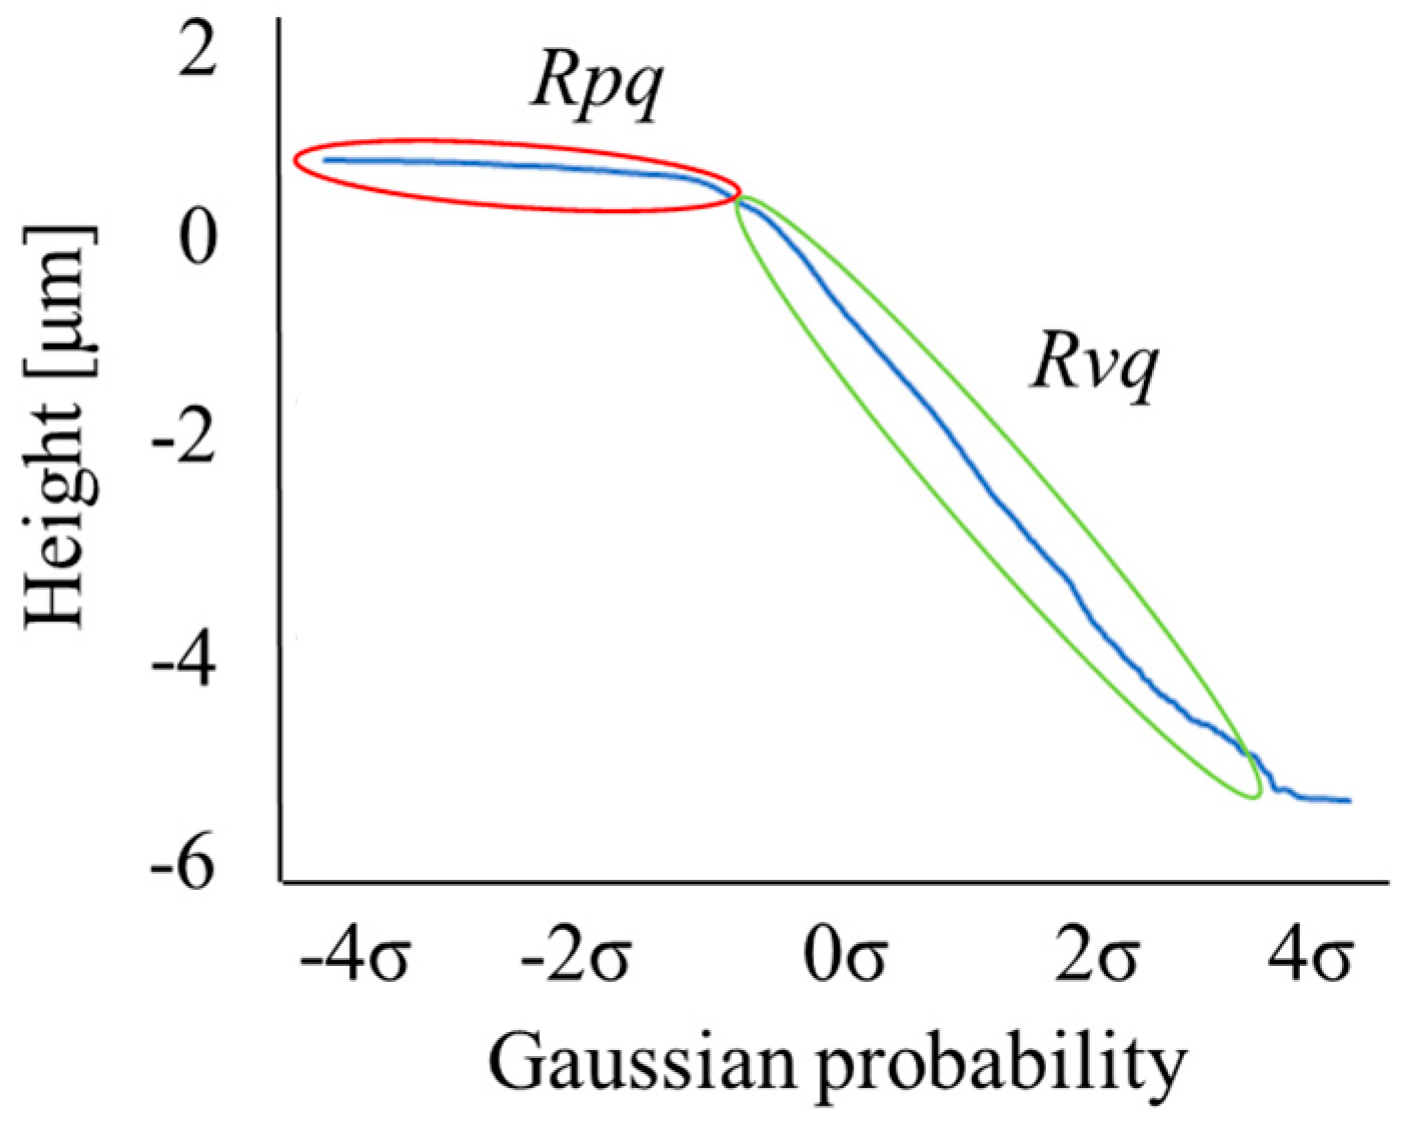
Plateau surfaces have excellent sliding properties. Because the plateau surface consists of, in roughness, a plateau region where a convex part is smoothed and a valley region where a concave part remains. The plateau region reduces friction and plays the load-bearing role, whereas a valley region acts as an oil reservoir. The plateau surface has high sliding properties due to these roles. An evaluation of the plateau surface requires using the MPC [9,11]. In Figure 3, the area circled in red on the MPC represents the plateau region and green represents the valley region. The steps of the evaluation method for the plateau surface are as follows:
  • Convert the roughness curve to an MRC;
  • Convert the MRC to an MPC;
  • Fit straight lines to the plateau and valley regions on the MPC.
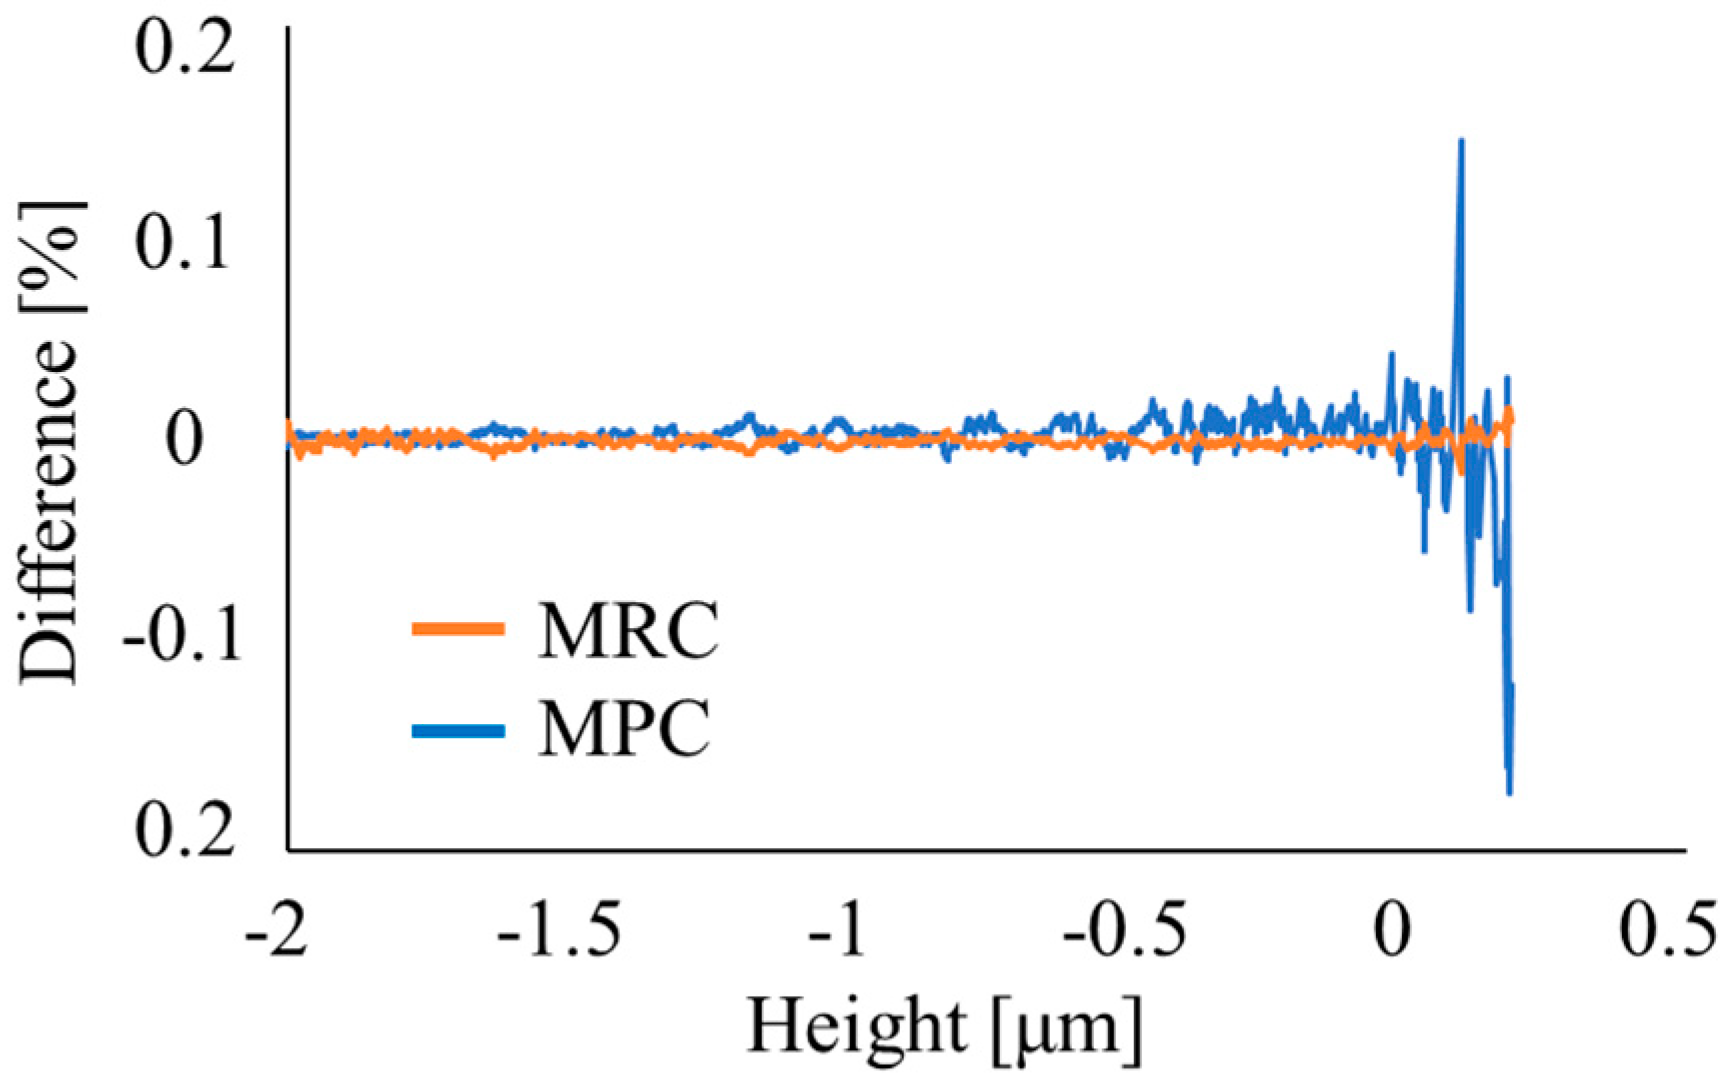
The roughness parameters Rpq and Rvq are the absolute values of the slopes of the respective straight lines calculated using the abovementioned procedure. Figure 4 shows that the error of the MRC using the slice and sort methods increases following conversion to the MPC. The reasons for this are as follows: The interval between the data points in the MPC increases as one moves away from the center of the x-axis. Therefore, on normal probability paper, the errors at both ends of the MRC become significantly larger. In addition, the increase in the errors is more pronounced in the plateau region of the MPC. Therefore, the straight lines fitted on the MPCs calculated using the slice and sort methods may not coincide. Thus, this study investigates the effect that an increase in errors gives to the calculated results of the roughness parameters in the plateau region.

4. Experiments and Results

The experiment investigates the difference in the Rpq values calculated from MPCs via the slice and sort methods. The sample used in the experiment is a roughness profile of a sufficiently worn plateau surface. Table 1 shows Rpq values obtained from the MPCs calculated using the slice and sort methods. Table 1 shows that Rpq values obtained from the MPCs calculated using the sort and slice methods do not differ largely. Hence, the calculation of the MPC using the sort method is expected to have no significant effect on the results of the roughness parameter calculation for the plateau region.

5. Conclusions

This study investigated the effect on the roughness parameters of the plateau surface due to the increase in errors from the conversion of the MRC to MPC. The following summarizes the results and future prospects of this study. The increase in error from the conversion to the MPC is considered to have little effect on the evaluation of the plateau surface with respect to a sufficiently worn surface. In future studies, we will further verify the validity of using the sort method for the calculation of the MPC in the evaluation of plateau surfaces by increasing the number of samples with plateau surface profiles.

Author Contributions

Conceptualization, I.Y.; methodology, I.Y. and S.N.; software, S.N. and R.S.; validation, S.N., R.S. and I.Y.; formal analysis, I.Y.; investigation, I.Y., S.N. and R.S.; resources, I.Y.; data curation, S.N.; writing—original draft preparation, S.N. and I.Y.; writing—review and editing, S.N., I.Y. and R.S.; visualization, S.N. and I.Y.; supervision, I.Y.; project administration, I.Y.; funding acquisition, I.Y. All authors have read and agreed to the published version of the manuscript.

Funding

This work was partly supported by the Precise Measurement Technology Promotion Foundation (PMTP-F) grant number 1-38.

Institutional Review Board Statement

Not applicable.

Informed Consent Statement

Not applicable.

Conflicts of Interest

The authors declare no conflict of interest.

References

  1. Pawlus, P.; Reizer, R.; Wieczorowski, M.; Krolczyk, G. Material ratio curve as information on the state of surface topography-A review. Precis. Eng. 2020, 65, 240–258. [Google Scholar] [CrossRef]
  2. Yoshida, I.; Tsukada, T.; Arai, Y. Characterization of Three-Stratum Surface Textures. J. Jpn. Soc. Tribol. 2008, 53, 99–111. [Google Scholar]
  3. ISO 13565-2:1996; Geometrical Product Specifications (GPS)-Surface Texture: Profile Method; Surfaces Having Stratified Functional Properties-Part 2: Height Characterization Using the Linear Material Ratio Curve (JIS B 0671-2: 2002). ISO: Geneva, Switzerland, 1996.
  4. Arai, Y.; Yoshida, I.; Tsukada, T. A Method to Derive the Material Ratio Curve of Surface Texture. Proc. JSPE Semest. Meet. 2007, 2007A, 703–704. (In Japanese) [Google Scholar]
  5. ISO 4287:1997; Geometrical Product Specifications (GPS)-Surface Texture: Profile Method-Terms, Definitions and Surface Texture Parameters (JIS B 0601: 2013). ISO: Geneva, Switzerland, 1997.
  6. Okamoto, J.; Nakayama, K.; Sato, M. Introduction to Tribology, 1st ed.; Saiwai Shobo: Tokyo, Japan, 1990; pp. 10–11. (In Japanese) [Google Scholar]
  7. Machida, H.; Yoshida, I. Proposal of Calculating Method for Material Ratio Curve of Suface Texture. In Proceedings of the 5th International Conference on Science of Technology Innovation, Nagaoka University of Technology, Niigata, Japan, 30–31 October 2020; STI-9-31. p. 80. [Google Scholar]
  8. Machida, H.; Nagai, S.; Yoshida, I. Study on a Computational Algorithm for Material Ratio of Surface Texture. In Proceedings of the 6th International Conference on “Science of Technology Innovation”, Nagaoka University of Technology, Niigata, Japan, 22 October 2021; STI-9-28. p. 104. [Google Scholar]
  9. ISO 21920-2:2021; Geometrical Product Specifications (GPS)—Surface Texture: Profile—Part 2: Terms, Definitions and Surface Texture Parameters. ISO: Geneva, Switzerland, 2021.
  10. Machida, H.; Yoshida, I.; Kondo, Y. Proposal of Computational Algorithm for Calculating Material Ratio of Surface Texture. In Proceedings of the ASEC2021, Online, 15–31 October 2021. [Google Scholar]
  11. Yoshida, I. Surface Roughness-Part 2, How to Use and Clues of the Surface Texture Parameters. J. Jpn. Soc. Precis. Eng. 2013, 79, 405–409. [Google Scholar] [CrossRef]
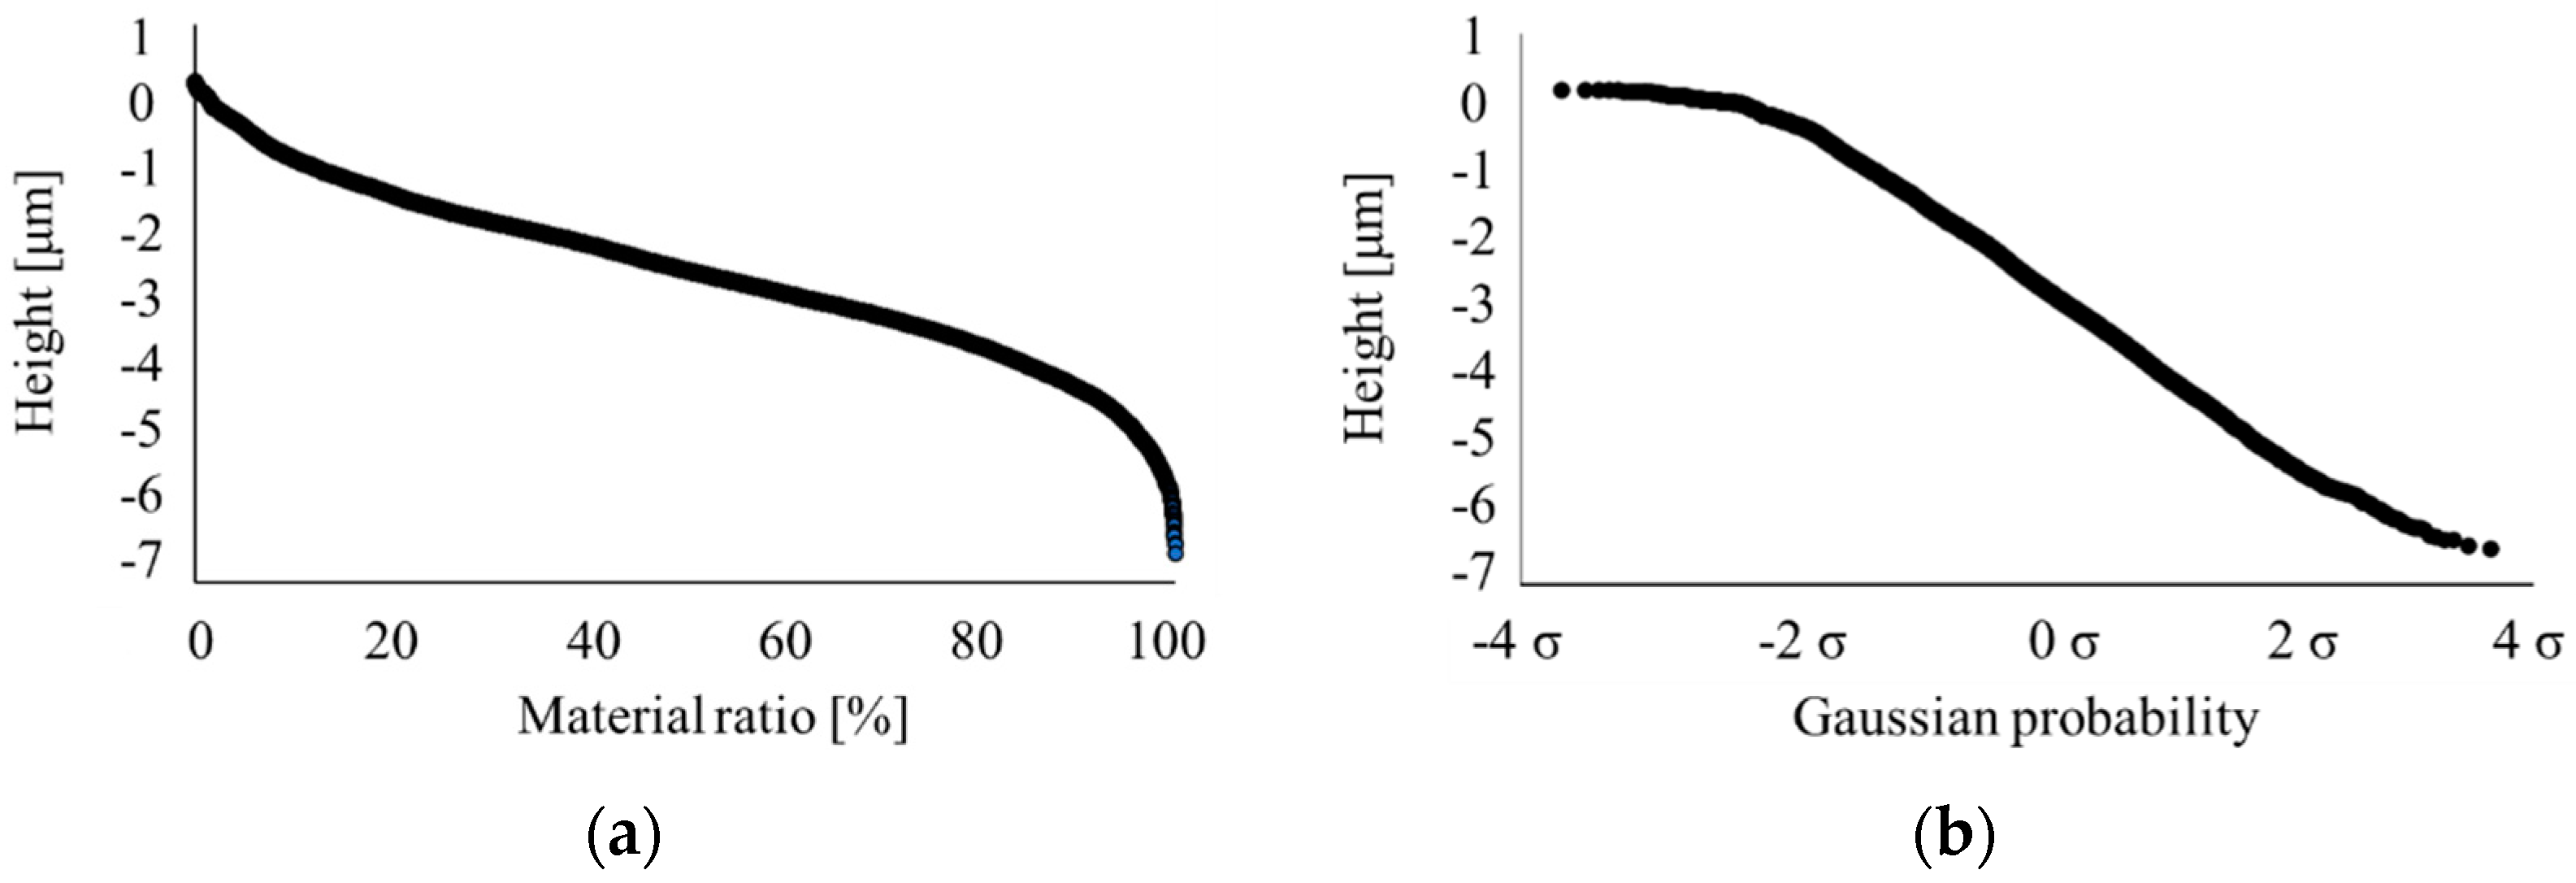
Figure 1. MRC and MPC: (a) MRC; (b) MPC.
Engproc 31 00079 g001
Figure 2. Error in MRCs by slice and sort methods.
Engproc 31 00079 g002
Figure 3. MPC and roughness parameters of the plateau surface.
Engproc 31 00079 g003
Figure 4. Increase in error owing to the conversion of MRC to MPC.
Engproc 31 00079 g004
Table 1. Rpq values obtained from the MPCs calculated using the slice and sort methods.
Rpq in Slice Method [μm]Rpq in Sort Method [μm]
Sample 1 0.290.29
Sample 20.250.25
Sample 30.070.07
Sample 40.060.06
Disclaimer/Publisher’s Note: The statements, opinions and data contained in all publications are solely those of the individual author(s) and contributor(s) and not of MDPI and/or the editor(s). MDPI and/or the editor(s) disclaim responsibility for any injury to people or property resulting from any ideas, methods, instructions or products referred to in the content.