1. Introduction
In Bangladesh, the most prevalent livestock are dairy animals such as cows and buffaloes, which are very important to the development of the nation’s economy. Because of the fast rate of population growth, the expansion of education, and greater nutrition awareness, the demand for milk and milk products is expanding. As a result of these factors, dairy development has become a top priority in Bangladesh’s economy. Apart from milk production, these animals provide a large amount of organic manure, which is one of the most important agricultural inputs in Bangladesh. Dairy farming is a sideline for practically all Bangladeshi farmers [
1]. In terms of essential nutrients, dairy products are among the highest sources in humans’ diets, and they play a significant role in meeting their nutritional needs. Dairy products have a relatively short life span, and as they break down, they cause a lot of environmental problems. Compared to other industries, the dairy industry has become one of the most significant wastewater generators in Bangladesh [
2].
Wastewater management has become a major issue in recent years. The effluents produced by domestic and industrial activities are the primary sources of pollution in natural water. The poor quality of wastewater effluents causes the deterioration of receiving water bodies because untreated or improperly treated wastewater effluent can promote eutrophication in receiving water bodies and generate circumstances that encourage the expansion of toxin-producing cyanobacteria pathogens in the water [
3]. The dairy sector is one of the leading sources of wastewater. Cleaning requires a large volume of water; therefore, the wastewater produced by this sector may contain detergent, base, sanitizers, salts, and organic materials, depending on the source (equipment cleaning vs. spills on the floor) [
4]. Temperature, color, DO, COD, pH (6.5–8.0), BOD, dissolved solids, suspended particles, chlorides, sulphate, oil, and grease are all factors contained in dairy effluent. In addition, dairy effluent contains soluble organics, suspended solids, and trace organics. All of these factors contribute to the high biological oxygen demand (BOD) and chemical oxygen demand (COD) in the water body [
5].
Bacillus cereus,
Bacillus subtilis,
Pseudomonas fluorescens,
Pseudomonas aeruginosa,
Escherichia coli,
Enterobacter,
Streptococcus faecalis, and other heterotrophic bacteria can be detected in dairy wastewater. Yeasts from the genera
Candida, Saccharomyces, and
Cryptococcus can also be found [
6]. Pathogenic bacteria, including
E. coli O157:H7, Salmonella, Campylobacter, and others, have been linked to cow manure and could contaminate crops. Pathogenic bacteria and nutrients, such as sodium chloride, phosphate, and nitrate can build up in soils and leach into surface and groundwaters, rendering them unfit for human and animal use [
7]. Dairy effluents degrade quickly, depleting the dissolved oxygen level in receiving streams and leading to the development of anaerobic conditions and the formation of strong foul odors. Wastewater disposal into rivers, land, fields, and other aquatic bodies, without or with partial treatment in crude tanks, will pose many severe health and hygiene problems in the foreseeable future [
4].
The properties of wastewater that will be released into the aquatic environment or treated and reused must be appropriately characterized to assess the quality of the wastewater. Hence, this research focuses on determining the physicochemical properties of tap water and wastewater effluent from dairy farms and the bacterial colony count of both water samples to assess their quality.
2. Materials and Methods
2.1. Sample Collection
Three domestic dairy farms in the Islamnagar region of Savar, Dhaka, Bangladesh, were selected to collect the water samples. On each farm, two samples were collected from two different sources (tap water and wastewater). The three selected farms provided a total of 12 samples. Tap water and wastewater samples were collected in 6 disinfected plastic bottles for evaluation of the physical and chemical characteristics, while samples for a viable microbiological count were collected in 6 falcon tubes. Plastic bags were used to retain the samples. Permanent marker pens were used to write down the numbers on the samples.
2.2. Work Plan and Materials
Laboratory experiments were carried out in the two specialized laboratories:
Department of Environmental Sciences, Jahangirnagar University, Savar, Dhaka, and Bangladesh Livestock Research Institute (BLRI), Savar, Dhaka. Various apparatus, instruments, and chemicals were used to carry out this study. They are as follows:
Plastic sample bottles, falcon tubes, plastic bags, hand gloves, a beaker and a petri dish, a pH meter, an EC meter, a DO meter, a TDS meter, an autoclave, an incubator, vortex mixture, an inter-science easy spiral dilute and laminar flow cabinet, distilled water, and nutrient agar media.
2.3. Physicochemical Properties Analysis
The color of the water samples was observed with the naked eye. Sensory measures using the nose as a detector were used to determine odor. Temperature, DO, TDS, EC, and pH were measured in the laboratory using their respective meters.
2.4. Count of Microbial Colony
After collecting the samples, they were taken to the laboratory and thoroughly mixed with a vortex mixer. The nutrient agar media was prepared by using an autoclave. The media was poured into petri dish and left to settle. Using nutritional agar media Petri plates, the viable microbe count was assessed. An inter-science easy spiral dilutes machine with a dilution factor of 10−3 was used to execute step-by-step serial dilutions of water samples. The serial dilution was performed using the spread plate technique and NaCl saline solution. The plates were then incubated at 37 °C for 24 h. After the incubation period, the petri dish was observed, and the colony that had been produced was counted.
2.5. Questionnaire Suzrvey
A survey was carried out to gather general information about the farms. Close-ended questions were used to collect the initial half of the socio-demographic data. The second segment included open-ended questions that allowed participants to elaborate on their responses. The routine practices on the farm and farm waste, such as where waste is disposed of and what disinfectant is used for cleaning, were also examined.
4. Discussion
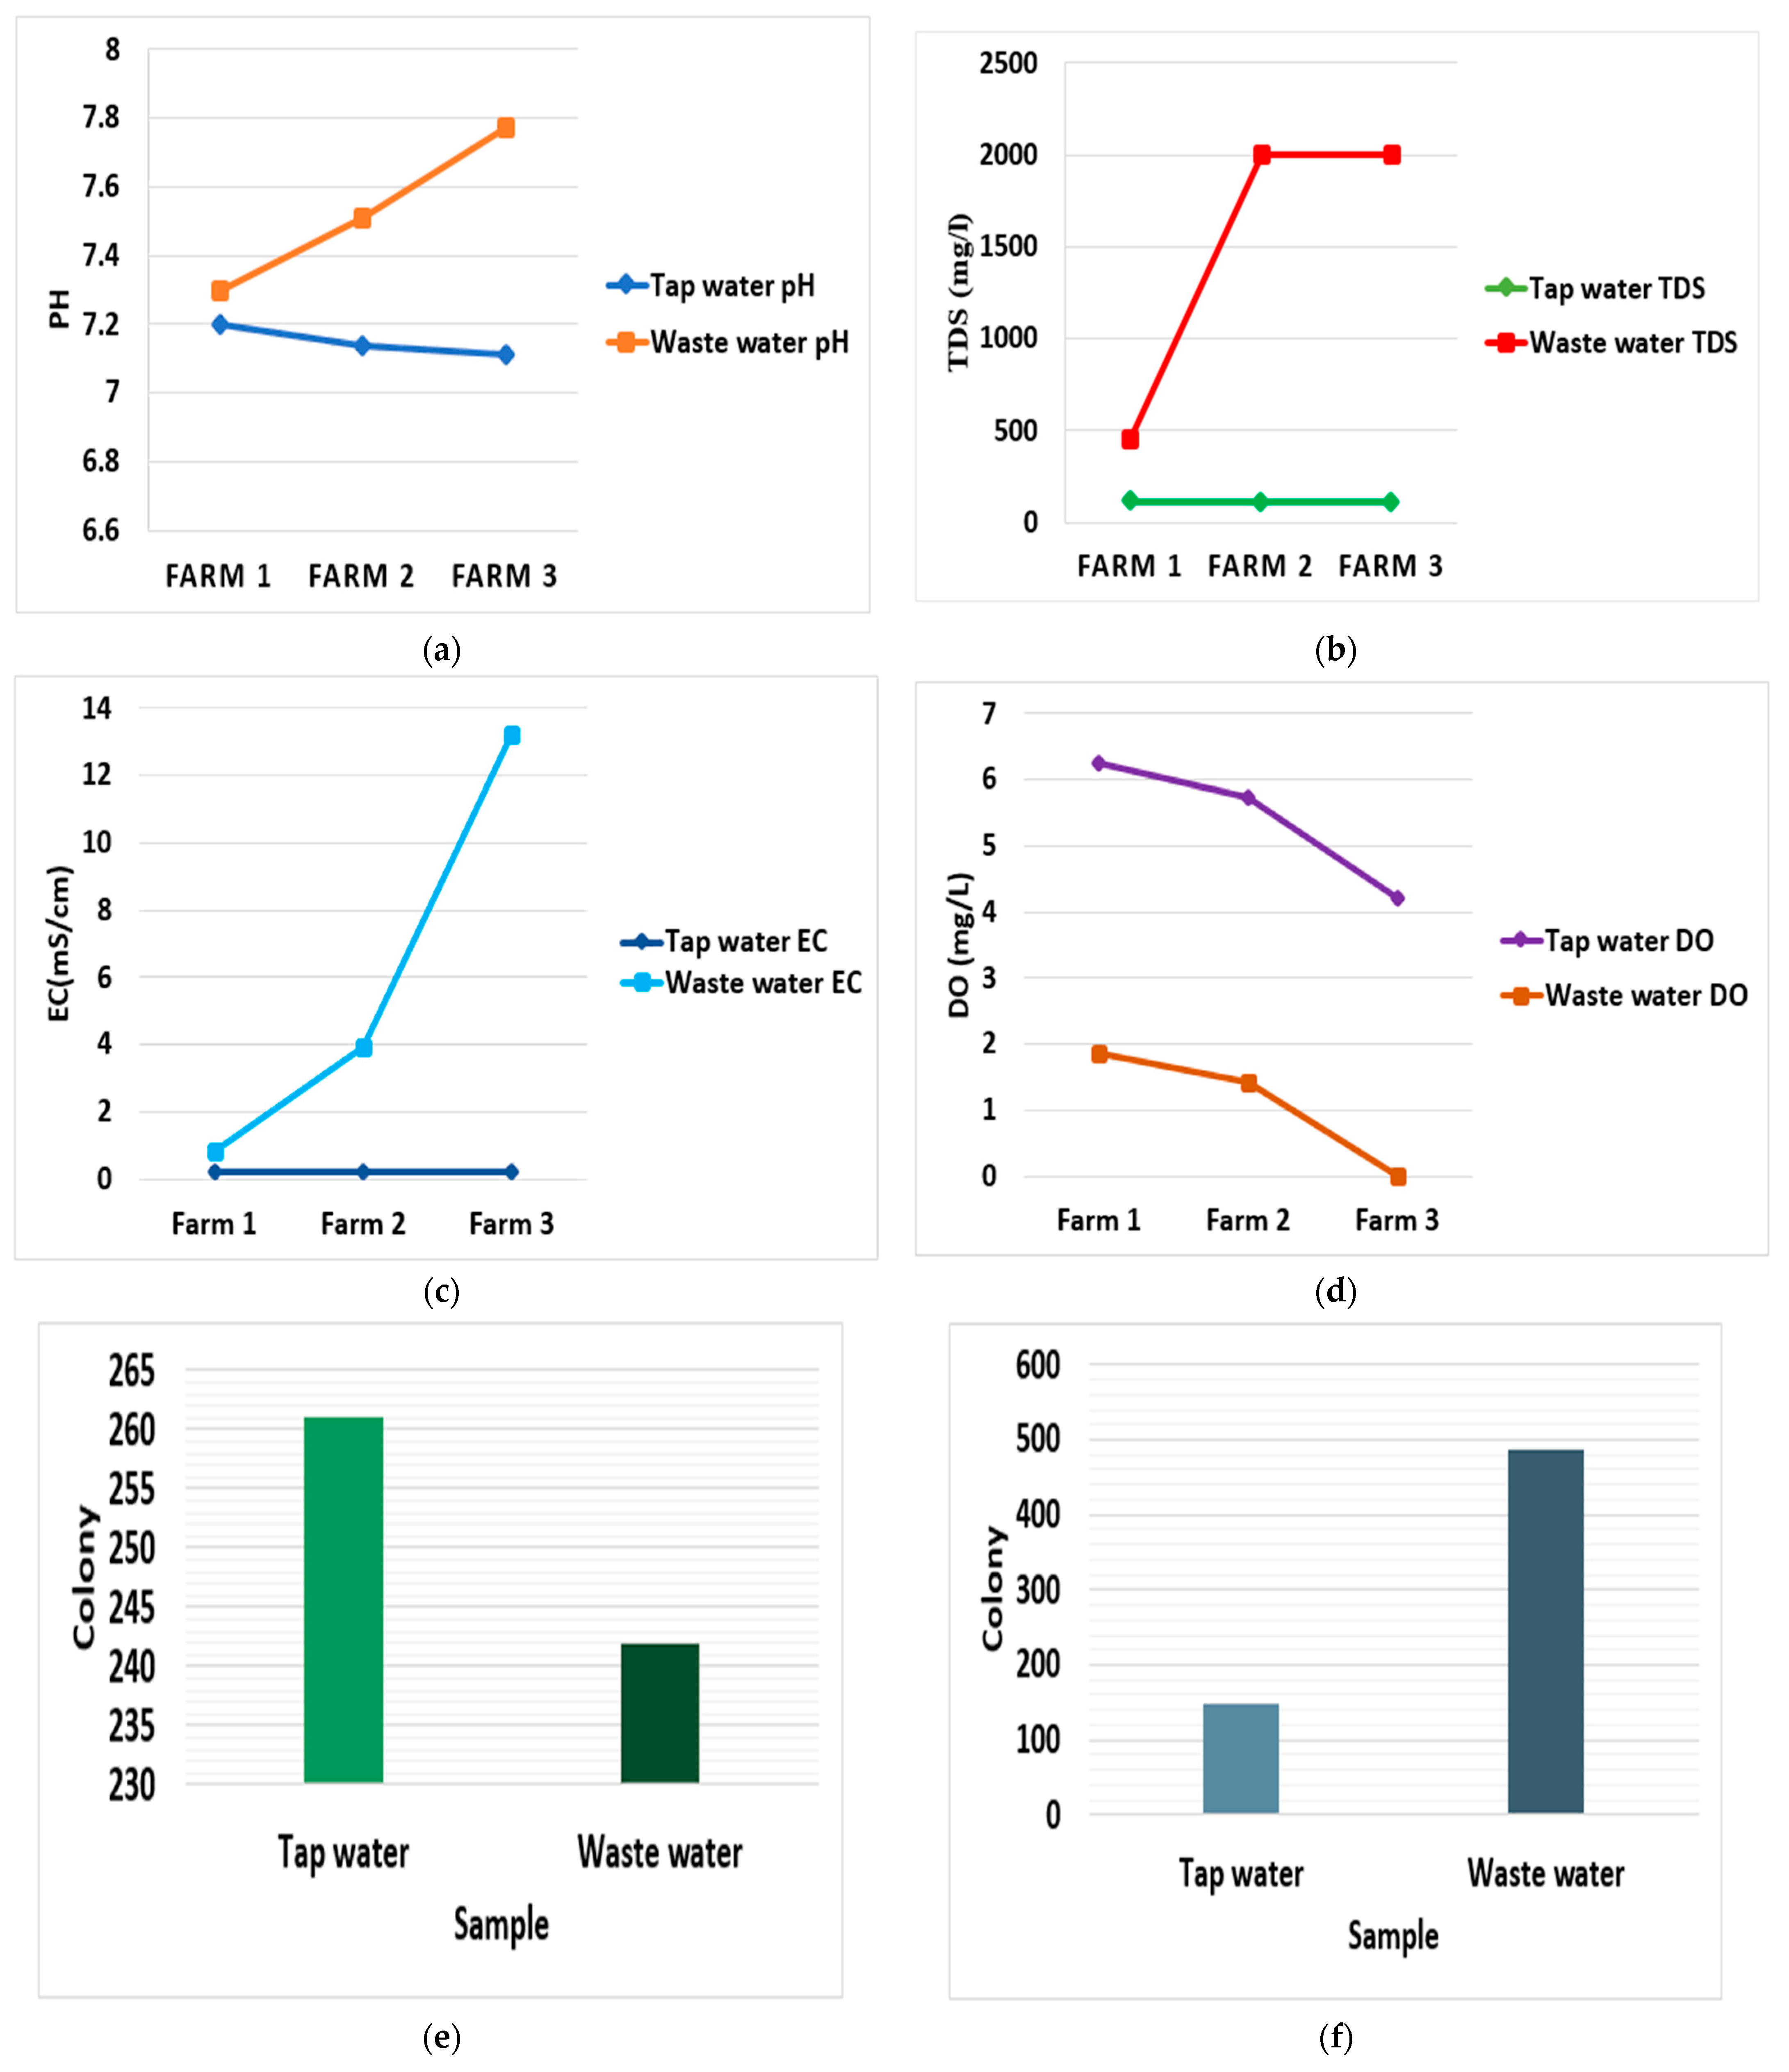
Color and odor: Most of the wastewater samples were light brown or dark brown, whereas the tap water samples were clear, and the wastewater samples had a strong or weak odor, but the tap water samples had no odor, indicating the presence of undesired pollutants.
pH: The large range in the pH value of effluent can have an impact on the rate of biological processes, the survival of different microorganisms, and the soil’s quality [
9]. According to the current investigation, the pH appears to be under the national guideline for wastewater disposal (
Table 1). The pH measurements range from 7.30 to 7.77, which shows that the effluent from these farms is just slightly alkaline (
Figure 1a).
Total Dissolved Solids (TDS): The variation of the total value of dissolved solids is caused by the collision of these colloidal particles, and the total solid concentration in waste effluent [
9]. For the effluent samples used in this investigation, TDS ranged from 451 to 2000 mg/L (
Figure 1b), which is within the permitted range (
Table 1).
Electrical Conductivity (EC): Tap water EC values ranged from 0.22 to 0.23 mS/cm, whereas wastewater EC levels ranged from 0.86 to 13.20 mS/cm (
Figure 1c). According to the DoE’s water quality discharge limit of 1.2 mS/cm, the EC is not within the permissible level for the samples taken (
Table 1). Wastewater has a higher EC than the farm’s tap water, indicating that more chemicals have been dissolved in the water.
Dissolved Oxygen (DO): One of the key factors in determining the quality of water is the amount of dissolved oxygen in the water, which is necessary to support a range of aquatic life forms [
9]. In the present study, the DO is not within the allowed threshold for the samples taken, according to the DoE’s standard (
Table 1). The wastewater on all of the farms had a lower DO than the farm’s tap water, indicating that more microorganisms in the wastewater use more oxygen for respiration (
Figure 1d).
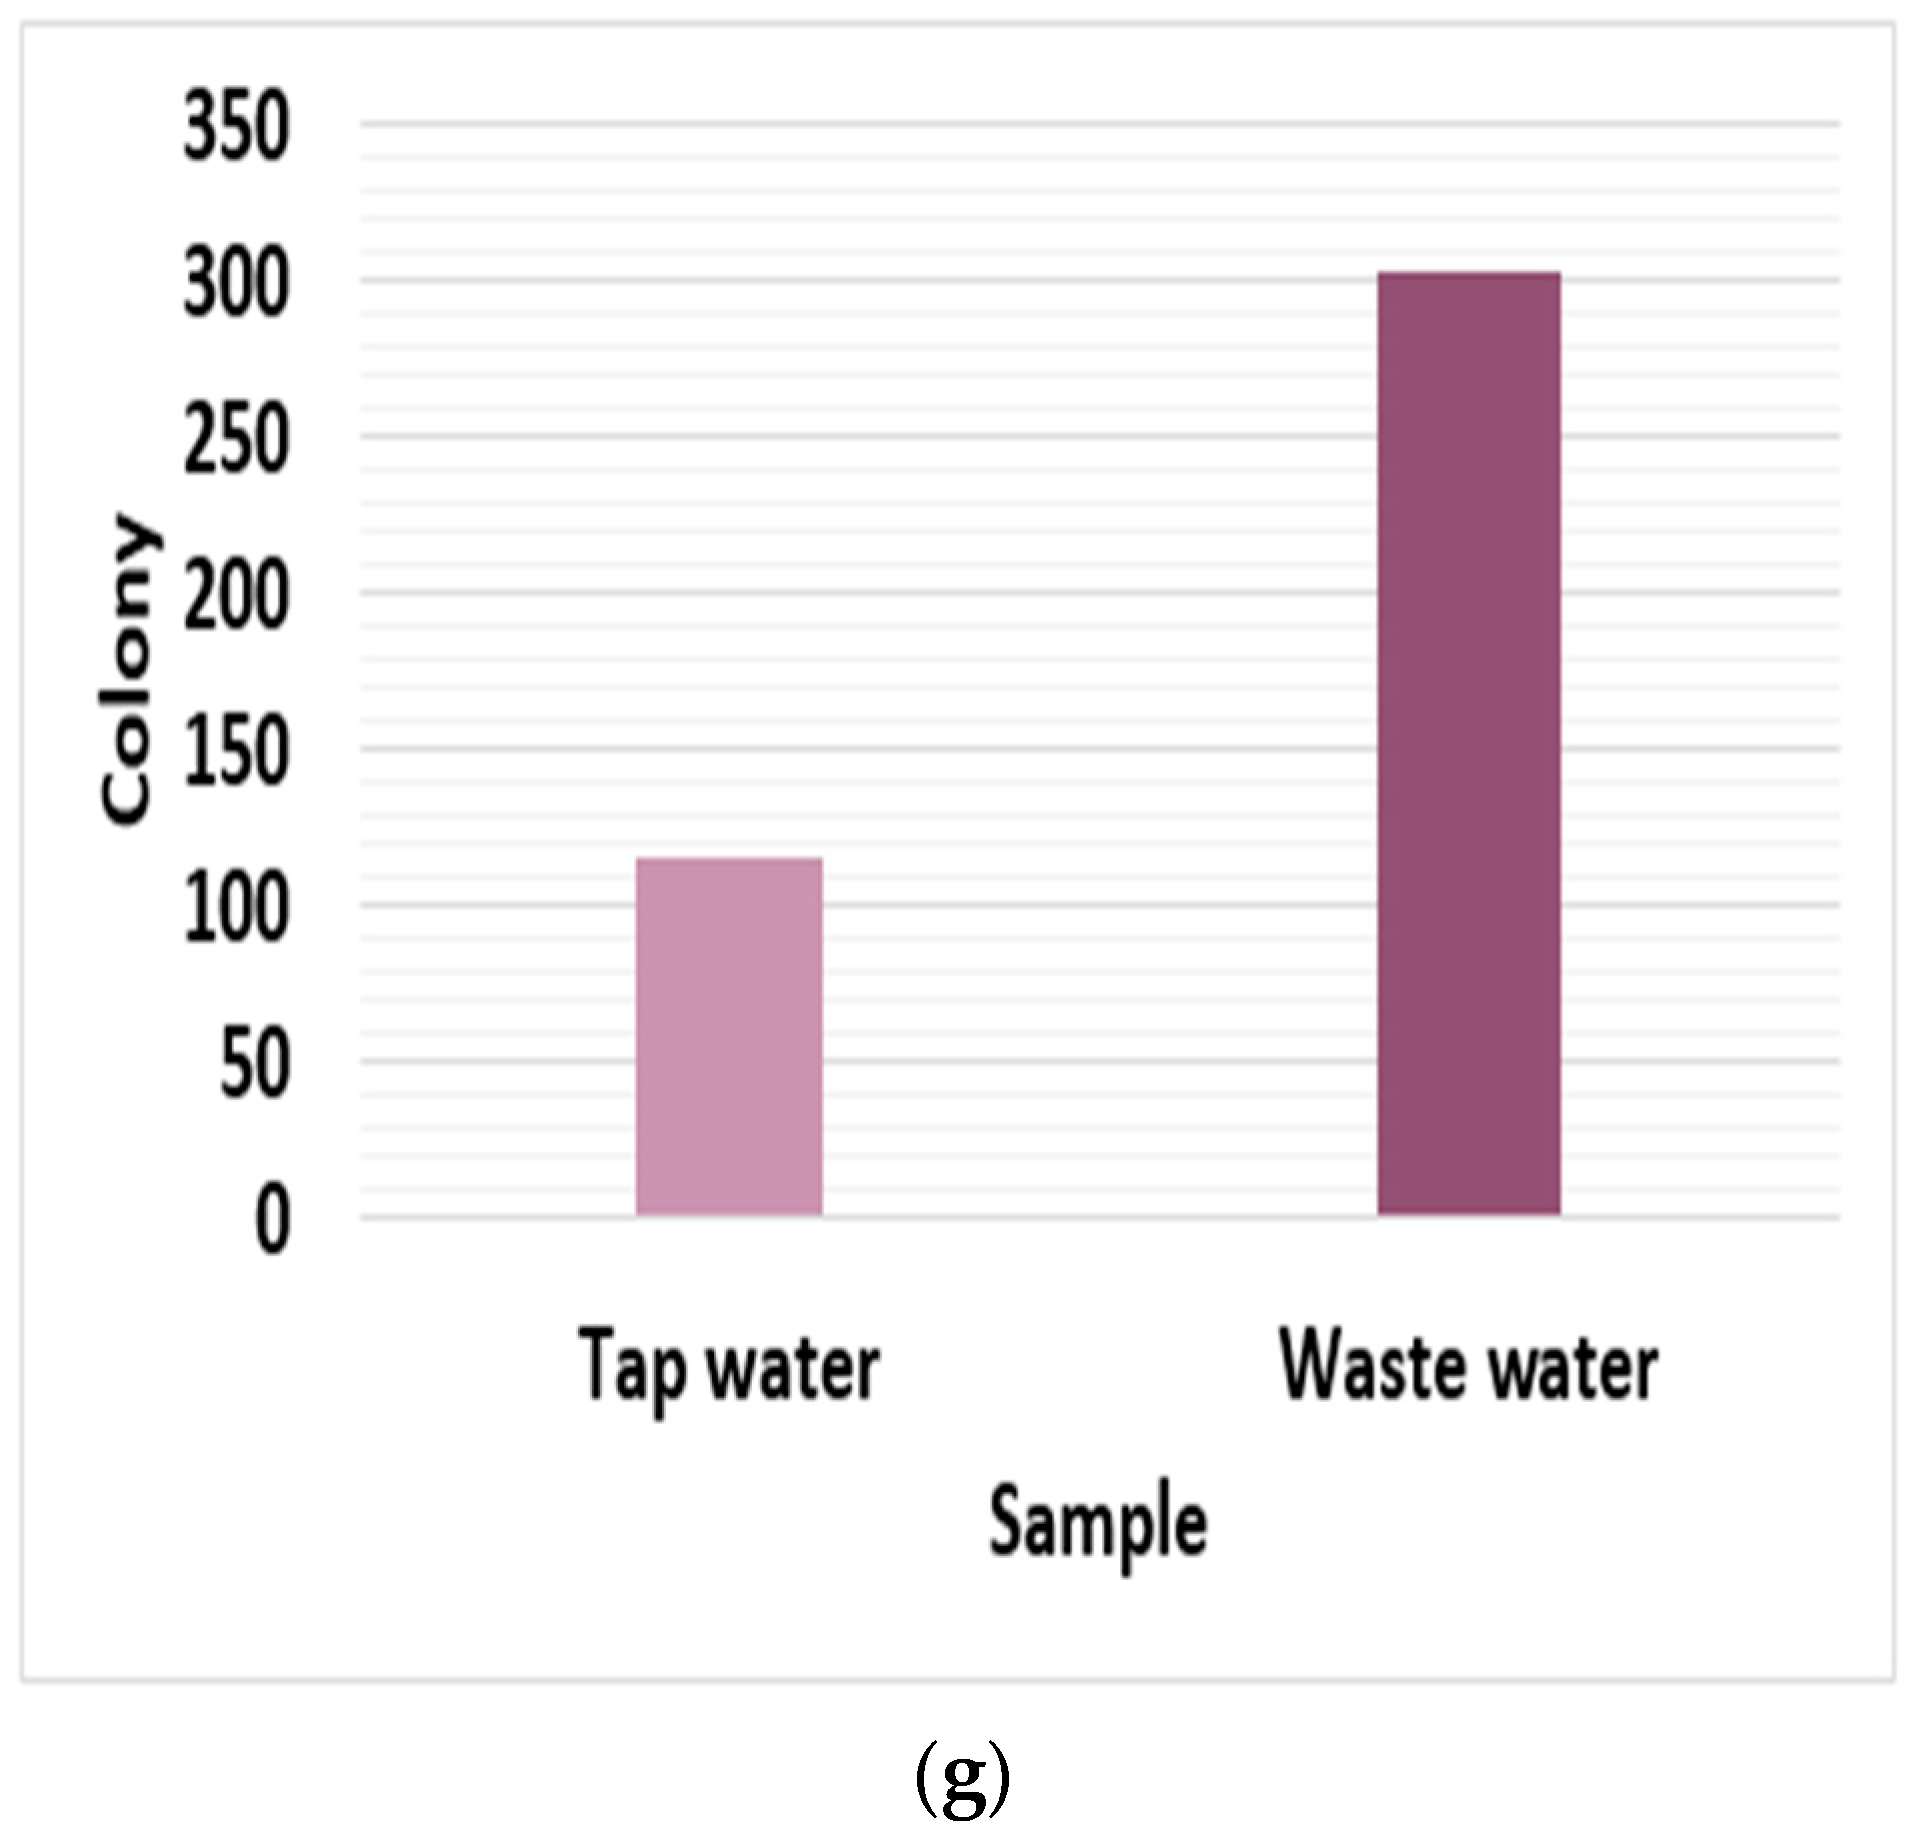
Microbial viable count: As seen in Figure, microbial colonies form more frequently in tap water than in wastewater.
According to the survey, Farm #1 uses bleaching powder twice daily, which is why the wastewater has a smaller microbial colony than tap water.
Environmental Impact: Compared to other toxic solid and gaseous waste, the organic wastewater emitted by the dairy sector is highly detrimental to the ecosystem. Fresh water sources are harmed in every way by the organic garbage dumped into them [
2]. Low amounts of dissolved oxygen influence the survival of fish by raising their susceptibility to disease and slowing down their growth, and long-term reductions can modify the species’ makeup. Water bodies that receive wastewater effluent may also undergo physical changes. Many direct and indirect environmental consequences can result from the discharge of suspended solids into receiving waters, including reduced sunlight penetration, physical injury to fish, and toxic effects from toxins linked to suspended particles. The phenomenon of bioaccumulation and biomagnifications is one of the potential health effects of untreated wastewater effluent on the environment [
3].
5. Conclusions
In the current study, the wastewater samples taken from the study area are light brown and slightly alkaline. All water samples’ pH and TDS levels are within the acceptable range. Farm #1 is within the acceptable limit regarding electrical conductivity, but the EC values of the other two farms are not. DO levels in the tests conducted on any of the farms were found to be higher than the allowable limit. For two farms, the microbiological quality of all the water samples in this study was poor. In Farms #2 and #3, wastewater contains more microbes than tap water. Because this farm discharges enormous volumes of wastewater effluents into the adjacent pond and soil regularly, the soil, surface water, and groundwater might be contaminated. As a result, remediation and mitigation of these effluents’ overall consequences on receiving water bodies and soil are required. Wastewater should be treated before release to avoid contamination of soil and water bodies. Planning, monitoring, management, treatment, and legislation are recommended to maintain the water quality.


