Proceeding Paper

Simulating the Surface Solar Irradiance of Africa Using a Regional Climate Model: Influence of Vegetation-Runoff Coupled System †

Egyptian Meteorological Authority, Qobry EL-Kobba, Cairo P.O. Box 11784, Egypt
Presented at the 3rd International Electronic Conference on Applied Sciences, 1–15 December 2022; Available online: https://asec2022.sciforum.net/.
Eng. Proc. 2023, 31(1), 15; https://doi.org/10.3390/ASEC2022-13814
Published: 5 December 2022
(This article belongs to the Proceedings of The 3rd International Electronic Conference on Applied Sciences)

Abstract

:
Surface solar irradiance (SSI) is influenced by important factors such as total cloud cover and aerosols. However, the influence of vegetation-runoff coupled system on SSI has not been investigated yet. The present study aims to study this issue in tropical Africa within the framework of the regional climate model (RegCM4) using two runoff schemes: (TOPMODEL; TOP and Variable Infiltration Capacity; VIC). For the vegetation-runoff systems to be coupled, the Carbon-Nitrogen (CN) module was enabled. The two simulations were designated as: CN-TOP and CN-VIC. Furthermore, the RegCM4 was downscaled by NCEP/NCAR2 reanalysis for a duration of 13 years and evaluated with respect to a reliable reanalysis product. The results showed that the CN-VIC outperforms the CN-TOP in all seasons particularly during the summer season. For instance, the CN-VIC underestimates the SSI over the Northern Savannah region by 15 W m−2; while the CN-TOP underestimates the SSI by 30–50 W·m−2. Over different sub-regions, the CN-VIC performs better than the CN-TOP over Northern Savanna during the summer season and over the Congo basin during the winter season. Moreover, the four parameters of the VIC surface dataset need to be recalibrated with respect in-situ observation of tropical Africa, and additional sensitivity experiments are needed to ensure a better performance of the CN-VIC.

1. Introduction

Surface solar irradiance (SSI) is a key variable in the dynamic process that occurs in the boundary layer. SSI plays an important role in different vital processes such as: photosynthesis, energy generation, agriculture and water resources management. For energy generation, the direct use of SSI requires solar energy technologies such as photovoltaic (PV) and Concentrated Solar Power technologies (CSP). PV technology and CSP are clean, sustainable, and renewable energy conversion technology that can contribute in meeting the energy demands of the world’s growing population, whilst reducing the adverse anthropogenic impacts of fossil fuel use. Ref. [1] examined the current and future potential of solar and wind energy over Africa using the RegCM4 within the framework of the CORDEX-CORE ([2]-Coordinated Output for Regional Evaluations; CORE) ensemble. They found that the RegCM4 model has a good capability in reproducing the spatial pattern of the SSI against satellite products (SARAH-2).
Ref. [3] showed that runoff parameterization plays an important role in simulating the surface climate, particularly in the June-July-August (JJA) season. However, this role was not examined for the SSI. In addition, the vegetation status was static (i.e., vegetation parameters were retrieved from the MODIS satellite product). Therefore, this study aims to explore the potential role of the vegetation-runoff coupled system (in simulating the SSI) within the framework of the regional climate model (RegCM4). Section 2 describes the study area, data and methodology, while Section 3 presents the study results and are discussed in Section 4.

2. Materials and Methods

The model domain (Figure 1) and simulation design were customized following the study conducted by [3]. With a special focus on the tropical region of Africa, version 4.5 of the RegCM model was used in this study (RegCM4; [4]). The community land model version 4.5 (CLM45; [5]) provides all physical configurations for the vegetation-runoff system to be fully coupled within the framework of the RegCM4 (i.e., CN module and two runoff schemes: TOP and VIC). The vegetation-runoff system is coupled in the sense that leaf area index (LAI) is predicted every time step [6], so vegetation transpiration and relative humidity are affected by both LAI and soil moisture changes. Eventually, the simulated SSI is affected by changes in the relative humidity. In this study, the Solar Radiation Budget (SRB; [7,8]) reanalysis product was used to evaluate the SSI from the two simulations. Only the period January 1998 to November 2007 was considered, in order to make a compromise between the simulation length and availability of the SRB. SRB was bilinearly interpolated onto the RegCM4-CLM45 as reported by [9,10]).

3. Results

3.1. Seasonal Climatology of SSI

Figure 2 shows the seasonal climatology of the simulated SSI for the two coupled vegetation-runoff systems with respect to the SRB for: winter (December-January-February; DJF), spring (March-April-May; MAM), summer (June-July-August; JJA) and autumn (September-October-November; SON). In general, the RegCM4 reproduces well the spatial pattern of SSI in comparison with the SRB in all seasons. Furthermore, both simulations tend to overestimate the SSI over large parts of the Sahara region with biases about 20–60 W m2. Over tropical Africa, the simulated biases vary across the seasons. For instance in the MAM season; both CN-TOP and CN-VIC underestimate SSI by 20 W m2 over the region of (7–15° N) and underestimate by 40–50 W·m2 over the Evergreen Forest (Congo basin; 5° N–5° S, 10–40° E). Over the aforementioned regions, the CN-VIC underestimates the SSI by 25 W m2. In JJA and SON, both CN-TOP and CN-VIC show a similar performance particularly over the Congo Basin. Over the region 15–30° S, 10–40° E, both coupled systems overestimate the SSI (by 10–40 W m2). In addition, the SSI simulated biases by CN-VIC (in the DJF) were about 10 W m2 lower than those found with the CN-TOP. In comparison with a study conducted by [11], the difference between the two vegetation-runoff systems (CN-TOP and CN-VIC) is larger than the induced vegetation cover/fraction changes. Therefore, vegetation-runoff systems play a more important role in the constraint of the SSI of tropical Africa than if only vegetation cover/fraction changes are considered. A simple flow chart explains the role of vegetation-runoff systems (in simulating the SSI) is shown in Figure 3.

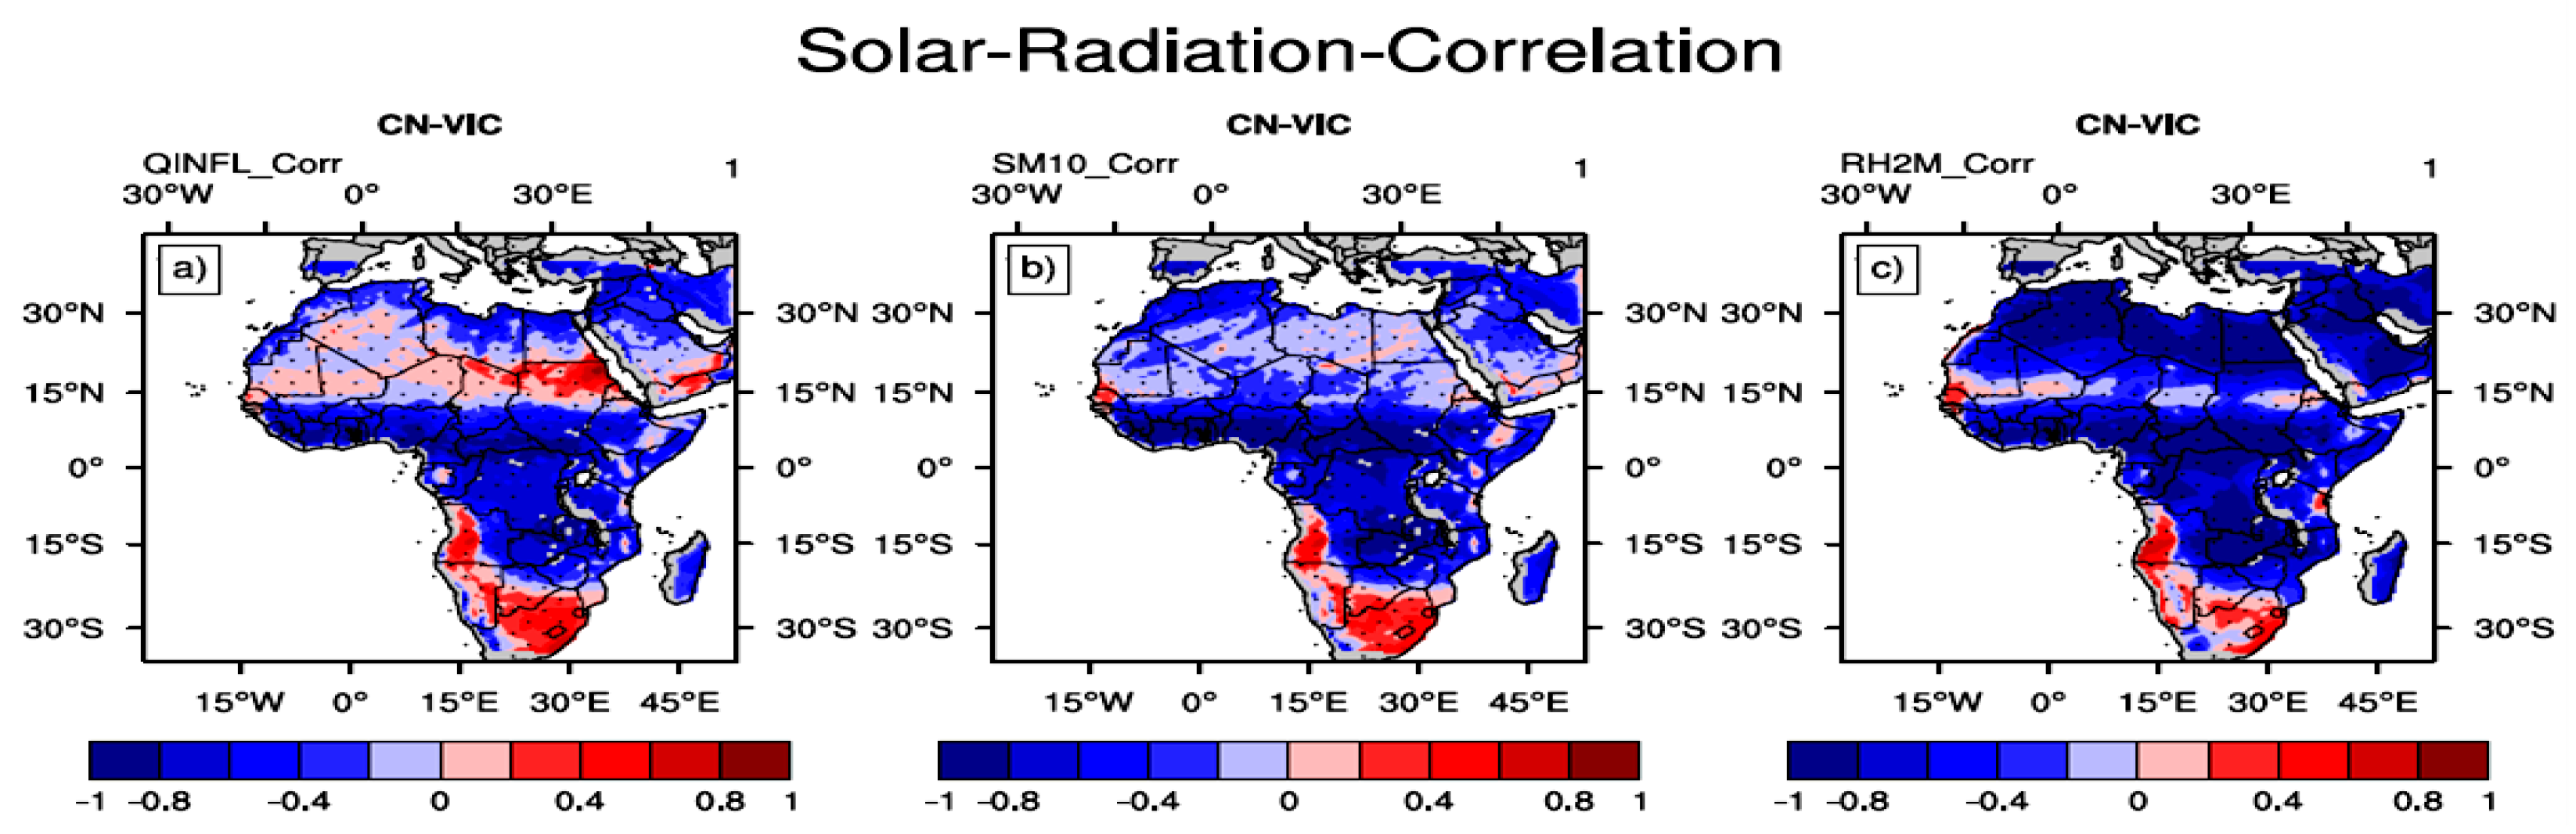
3.2. Correlating the SSI with Hydrological Variables

To further emphasis the role of the coupled vegetation-runoff system in simulating the SSI, a spatial correlation map (Figure 4) between the SSI, hydrological variables (infiltration rate and soil moisture) and meteorological variables (relative humidity) is plotted. From Figure 4, it can be observed that there is a high negative spatial correlation between the SSI, hydrological (−0.4 to −0.8) and meteorological variables (−0.6 to −1) variables. Such high negative spatial correlation confirms the inverse relationship between the SSI, hydrological and meteorological variables as suggested by [12,13]. This result supports the fact that the land-surface process (runoff in this study) plays a critical role in constraining the SSI using a regional climate model. In addition, ref. [14] reported that there is a strong negative correlation between SSI and gross primary production (GPP; correlation ranges from −0.6 to −1). This strong inverse relationship ensures the favorable conditions for maximizing the GPP [15].
The RegCM4 performance can be further quantified using a box-and-whisker plot following [16]. From Figure 5, it can be noticed that the RegCM4 model performance varies both spatially and temporarily. For instance, the CN-VIC is closer to the SRB than the CN-TOP during the summer season of area 1. In the winter season, the CN-VIC overestimates the SSI more than the CN-TOP in comparison with the SRB; such behaviour is in agreement with the results reported in Section 3.1. Over area 2, the CN-VIC severely overestimates the results more than the CN-TOP with respect to the SRB. In addition, the CN-VIC has a higher spread than the CN-TOP and SRB. On the other hand, the CN-VIC shows a better agreement than the CN-TOP when it is compared with the SRB. Lastly over area 3, both simulations are close to the SRB during the summer season, while both simulations severely underestimate the SSI during the winter season.

4. Summary and Conclusions

In this work, the potential role of two vegetation-runoff systems (in simulating the SSI of Tropical Africa) was investigated within the framework of the RegCM4. The results showed that the CN-VIC performs better than CN-TOP scheme, particularly in the JJA season in agreement with the results reported by [17]. Quantitatively, the RegCM4 model performance varies with space and time. For instance, the CN-VIC shows a better agreement than the CN-TOP in area 1 during the summer/winter season. In addition, there is no considerable difference between the two simulations over area 3.
Despite noted biases, the CN-VIC coupled system can be used in future studies concerning the SSI over tropical Africa. However, the four parameters of the VIC surface dataset need to be recalibrated in comparison with in-situ observations of Africa as reported by [3,6,14] and additional sensitivity studies are needed to ensure a good performance of the CN-VIC over tropical Africa. Additionally, the role of land-surface hydrology schemes needs to be incorporated in high resolution RCMs to better constrain the SSI with respect to reanalysis/satellite products and improve the simulated SSI in comparison with reanalysis or satellite products and in-situ observations.
Possible effects of the simulated SSI on the surface energy balance, surface climate, terrestrial carbon fluxes (e.g., gross primary production; GPP) and potential evapotranspiration (PET) of tropical Africa were also discussed. For instance, ref. [6] reported that the CN-VIC simulates more downward short and long wave radiation fluxes than the CN-TOP against reanalysis product leading to high rate of heat emitted from the ground. Such behaviour can explain why the CN-VIC overestimates the sensible heat flux (SHF) more than the CN-TOP particularly over the Congo basin. Furthermore, the low bias of the SSI (as simulated by the CN-VIC) contributes to the high warm bias of the 2-m mean air temperature (T2M) in comparison with the Climate Research Unit gridded product (CRU; [18]). In addition, the SSI biases can be partially responsible for the positive/negative biases of the GPP as reported by [6,14]. Also, ref. [6] reported that vegetation-runoff systems show significant changes in the simulated SSI and T2M. Therefore, the simulated boreal summer PET changes considerably between the two systems with respect to the CRU product as reported by [16].
Future study will address the following points:
  • The role of aerosols and various clouds cover schemes which notably affect the simulated SSI.
  • Downscaling CMIP5 General Circulation Models (GCMs) participating in the CMIP5/CMIP6 simulations (e.g., [19,20]) using the regional coupled RegCM4-CLM45-CN-VIC model with enabling the dynamic vegetation (DV) module and LULCC to assess the possible future changes in the simulated SSI under the moderate scenario (RCP4.5) and extreme scenario (RCP8.5).
  • Examine the potential influence of the vegetation-runoff systems on the vertical radiation profile.

Funding

This research received no external funding.

Institutional Review Board Statement

Not applicable.

Informed Consent Statement

Not applicable.

Data Availability Statement

Not applicable.

Acknowledgments

This work was conducted as a part of the OFID-ICTP program in the ICTP institute. The climate group in the ICTP (Earth System Physics; ESP) team is acknowledged for providing the RegCM code, computational facilities and input data to run the model. SRB data were obtained from the NASA Langley Research Center Atmospheric Sciences Data Center NASA/GEWEX SRB Project. NCEP/NCAR2 Reanalysis data provided by the NOAA/OAR/ESRL PSD, Boulder, Colorado, USA, from their Web site at http://www.esrl.noaa.gov/psd (accessed on 1 May 2018).

Conflicts of Interest

There is no conflict of interest.

References

  1. Sawadogo, W.; Reboita, M.S.; Faye, A.; Da Rocha, R.P.; Odoulami, R.C.; Olusegun, C.F.; Adeniyi, M.O.; Abiodun, B.J.; Sylla, M.B.; Diallo, I.; et al. Current and future potential of solar and wind energy over Africa using the RegCM4 CORDEX-CORE ensemble. Clim. Dyn. 2021, 57, 1647–1672. [Google Scholar] [CrossRef]
  2. Giorgi, F.; Jones, C.; Asrar, G.R. Addressing climate information needs at the regional level: The CORDEX framework. World Meteorol. Organ. (WMO) Bull. 2009, 58, 175. [Google Scholar]
  3. Anwar, S.A.; Zakey, A.S.; Robaa, S.M.; Wahab, M.M. The influence of two land-surface hydrology schemes on the regional climate of Africa using the RegCM4 model. Theor. Appl. Climatol. 2019, 136, 1535. [Google Scholar] [CrossRef]
  4. Giorgi, F.; Coppola, E.; Solmon, F.; Mariotti, L.; Sylla, M.B.; Bi, X.; Elguindi, N.; Diro, G.T.; Nair, V.; Giuliani, G.; et al. RegCM4: Model description and preliminary tests over multiple CORDEX domains. Clim. Res. 2012, 52, 7–29. [Google Scholar] [CrossRef] [Green Version]
  5. Oleson, K.W.; Lawrence, D.M.; Bonan, G.B.; Drewniak, B.; Huang, M.; Koven, C.D.; Levis, S.; Li, F.; Riley, W.J.; Subin, Z.M.; et al. Technical Description of Version 4.5 of the Community Land Model (CLM); NCAR technicalnote NCAR/TN-503 + STR; National Center for Atmospheric Research: Boulder, CO, USA, 2013. [Google Scholar]
  6. Anwar, S.A.; Diallo, I. On the role of a coupled vegetation-runoff system in simulating the tropical African climate: A regional climate model sensitivity study. Theor. Appl. Climatol. 2021, 145, 313–325. [Google Scholar] [CrossRef]
  7. Stackhouse, P.W.; Gupta, S.K.; Cox, S.J.; Mikovitz, J.C.; Zhang, T.; Hinkelman, L.M. The NASA/GEWEX Surface Radiation Budget Release 3.0: 24.5-Year Dataset. GEWEX News 2001, 21, 10–12. [Google Scholar]
  8. Riihelä, A.; Key, J.R.; Meirink, J.F.; Munneke, P.K.; Palo, T.; Karlsson, K. An intercomparison and validation of satellite-based surface radiative energy flux estimates over the Arctic. J. Geophys. Res.-Atmos. 2017, 122, 4829–4848. [Google Scholar] [CrossRef]
  9. Krishnan, A.; Bhaskaran, P.K. Performance of CMIP5 wind speed from global climate models for the Bay of Bengal region. Int. J. Climatol. 2020, 40, 3398–3416. [Google Scholar] [CrossRef]
  10. Wang, Z.; Zhan, C.; Ning, L.; Guo, H. Evaluation of global terrestrial evapotranspiration in CMIP6 models. Theor. Appl. Climatol. 2021, 143, 521–531. [Google Scholar] [CrossRef]
  11. Wang, G.; Yu, M.; Pal, J.S.; Mei, R.; Bonan, G.B.; Levis, S.; Thornton, P. On the development of a coupled regional climate–vegetation model RCM–CLM–CN–DV and its validation in Tropical Africa. Clim. Dyn. 2016, 46, 515–539. [Google Scholar] [CrossRef]
  12. Amajama, J.; Oku, D.E. Effect of Relative humidity on Photovoltaic panels’ Output and Solar Illuminance/Intensity. J. Sci. Eng. Res. 2016, 3, 126–130. [Google Scholar]
  13. Tasie, N.N.; Israel-Cookey, C.; Banyie, L.J. The Effect of Relative Humidity on the Solar Radiation Intensity in Port Harcourt, Nigeria. Int. J. Res. 2018, 5, 128–136. [Google Scholar]
  14. Anwar, S.A.; Diallo, I. A RCM investigation of the influence of vegetation status and runoff scheme on the summer Gross Primary Production of Tropical Africa. Theor. Appl. Climatol. 2021, 145, 1407–1420. [Google Scholar] [CrossRef]
  15. Stuart, S.F.; Matson, P.A.; Mooney, H.A. Principles of Terrestrial Ecosystem Ecology; QH541.C3595 ©; Springer: New York, NY, USA, 2002. [Google Scholar]
  16. Anwar, S.A.; Mamadou, O.; Diallo, I.; Sylla, M.B. On the Influence of Vegetation Cover Changes and Vegetation-Runoff Systems on the Simulated Summer Potential Evapotranspiration of Tropical Africa Using RegCM4. Earth. Syst. Environ. 2021, 5, 883–897. [Google Scholar] [CrossRef]
  17. Wang, X.; Chen, D.; Pang, G.; Anwar, S.A.; Ou, T.; Yang, M. Effects of cumulus parameterization and land-surface hydrology schemes on Tibetan Plateau climate simulation during the wet season: Insights from the RegCM4 model. Clim. Dyn. 2021, 57, 1853–1879. [Google Scholar] [CrossRef]
  18. Harris, I.; Osborn, T.J.; Jones, P.; Lister, D. Version 4 of the CRU TS monthly high-resolution gridded multivariate climate dataset. Sci. Data 2022, 7, 109. [Google Scholar] [CrossRef] [PubMed] [Green Version]
  19. Erfanian, A.; Wang, G.; Yu, M.; Anyah, R. Multi-model ensemble simulations of present and future climates over West Africa: Impacts of vegetation dynamics. J. Adv. Model. Earth. Syst. 2016, 8, 1411–1431. [Google Scholar] [CrossRef]
  20. Mehboob, M.S.; Kim, Y.; Lee, J.; Um, M.J.; Erfanian, A.; Wang, G. Projection of vegetation impacts on future droughts over West Africa using a coupled RegCM-CLM-CN-DV. Clim. Chang. 2020, 163, 653–668. [Google Scholar] [CrossRef]
Figure 1. This figure shows the model domain topography (in meters) including three sub-area averages. The domain was customized with permission from Ref. [3].
Engproc 31 00015 g001
Figure 2. This figure shows the Surface Solar Irradiance (SSI) over the period 1998–2007 (in W·m−2) for: MAM season in the first row (af); JJA in the second (gl); SON in the third (mr), DJF in the fourth (sx). For each row, CN-TOP is on the left, followed by CN-VIC, SRB is in the third from left, CN-TOP minus SRB, CN-VIC minus SRB and the difference between CN-VIC and CN-TOP. Significant model bias is indicated in black dots using Student’s t-test with α equals 5%.
Engproc 31 00015 g002
Figure 3. The figure shows a simple chart describes the influence of the land-surface hydrology scheme (TOP/VIC) on the simulated SSI.
Engproc 31 00015 g003
Figure 4. The figure shows the average spatial correlation between SSI and different hydrological and meteorological variables. (a) correlation between SSI and infiltration rate (QINFL_Corr), (b) correlation between SSI and Soil moisture of depth 10 cm (SM10_Corr), (c) correlation between SSI and 2-m relative humidity (RH2M_Corr). Areas with black dots are statistically significant at 95% confidence level of Student’s t-test.
Engproc 31 00015 g004
Figure 5. The figure shows a Box-and-whisker plot to show the simulated surface solar irradiance (SSI; in W m−2) spread for the CN-TOP (in red) and CN-VIC (in green) with respect to the SRB reanalysis product (in blue) for the winter (right column) and summer (left column) seasons over three sub-area averages highlighted in Figure 1.
Engproc 31 00015 g005
Disclaimer/Publisher’s Note: The statements, opinions and data contained in all publications are solely those of the individual author(s) and contributor(s) and not of MDPI and/or the editor(s). MDPI and/or the editor(s) disclaim responsibility for any injury to people or property resulting from any ideas, methods, instructions or products referred to in the content.

