Proceeding Paper

Low-Cost Environmental and Motion Sensor Data for Complex Activity Recognition: Proof of Concept †

1
Department of Environmental Sciences, Jožef Stefan Institute, 1000 Ljubljana, Slovenia
2
Ecotechnologies Programme, Jožef Stefan International Postgraduate School, 1000 Ljubljana, Slovenia
3
Environmental Engineering Laboratory, Department of Chemical Engineering, Aristotle University of Thessaloniki, 54124 Thessaloniki, Greece
4
HERACLES Research Centre on the Exposome and Health, Center for Interdisciplinary Research and Innovation, 57001 Thessaloniki, Greece
5
Environmental Health Engineering, Department of Science, Technology and Society, University School of Advanced Study IUSS, Pavia, Italy
6
Department of Knowledge Technologies, Jožef Stefan Institute, 1000 Ljubljana, Slovenia
*
Author to whom correspondence should be addressed.
Presented at the 7th Electronic Conference on Sensors and Applications, 15–30 November 2020; Available online: https://ecsa-7.sciforum.net/.
Eng. Proc. 2020, 2(1), 54; https://doi.org/10.3390/ecsa-7-08194
Published: 14 November 2020
(This article belongs to the Proceedings of 7th International Electronic Conference on Sensors and Applications)

Abstract

:
The merge of new sensing technologies with machine learning methods can be used as a tool to recognize complex activities. A wearable particulate matter (PM) sensor, in combination with a motion tracker, was provided to 97 individuals for 7 days in two seasons. These data sets were used in three different models, constructed by the classification of activity. Using algorithms IBk, J48 and RandomForest for hourly (minute) values, an accuracy of 31.0 (23.1)%, 28.6 (22.0)% and 35.7 (23.0)%, respectively, was achieved. Most misclassified instances concern vaguely defined activities. Low accuracy can also be explained with the differences in time scales. The accuracy could be improved by more clearly defining the activities and collecting per-minute data.

1. Introduction

Exposure to particulate matter (PM) and the intake dose can be heavily dependent on a specific activity an individual is performing [1,2]. By aggregating data per activity, instead of per time interval, the user is provided with another view to better discern where steps should be taken to reduce possible harm, caused by increased PM exposure or intake dose. Although activity recognition software is widely used in many commercial and research devices, it is confined to recognizing simpler activities, such as walking, running or other sports activities [3,4]. Recognizing complex activities still proves to be quite challenging [5]. Devices (in general) use integrated movement sensors, such as accelerometers and gyroscopes, for activity recognition. These sensors are also present in smartphones, allowing them to perform activity recognition, for example, counting steps. Adding environmental sensors to the input dataset could potentially improve the accuracy of recognition of complex activities. Measuring the concentration of PM, the temperature and relative humidity in the vicinity of an individual could give valuable insight into their activity. Elevated levels of PM have been found for complex activities, such as cooking, cleaning and smoking [6,7,8], and combining these data points with ambient temperature, heart rate and movement could allow the algorithms to distinguish between these activities, for example, high PM and high temperature for cooking, high PM and low heart rate for smoking, et cetera.
Machine learning classification algorithms can be used for activity recognition, and with powerful algorithms, such as RandomForest, the percent of accurately labeled instances is >99% in certain cases [3,4]. A training dataset which provides quality data (“quality” can be differently defined on a case by case basis) can sufficiently train the model to provide high accuracy from correctly labeling data points. This can sometimes mean that the model needs data with high temporal resolution or clearly defined activity labels, clearly delimited sets of activities, et cetera.

2. Methodology

2.1. Data Collection

Data used in the study was collected from 97 participants in the ICARUS campaign [9]. Most participants were involved in the winter (February to March 2019) and summer (April to June 2019) season of the campaign for approximately 7 days each and equipped with two sensor devices:
  • A Garmin Vivosmart 3 smart activity tracker (SAT) [10], which was strapped on each participant’s wrist for the entire duration of the data collection period. Temporal resolution for the data was one minute. The data used from the SAT was primarily the average minute heart rate and the number of steps and distance per minute, which indicated movement.
  • A portable PM measuring device (PPM), which was developed for the ICARUS project by IoTech Telecommunications [11], using a Plantower [12] pms5003 sensor, based on the laser light scattering principle. The device provided minute resolution data for three size classes of PM (1 µm, 2.5 µm, 10 µm), temperature, relative humidity and speed.
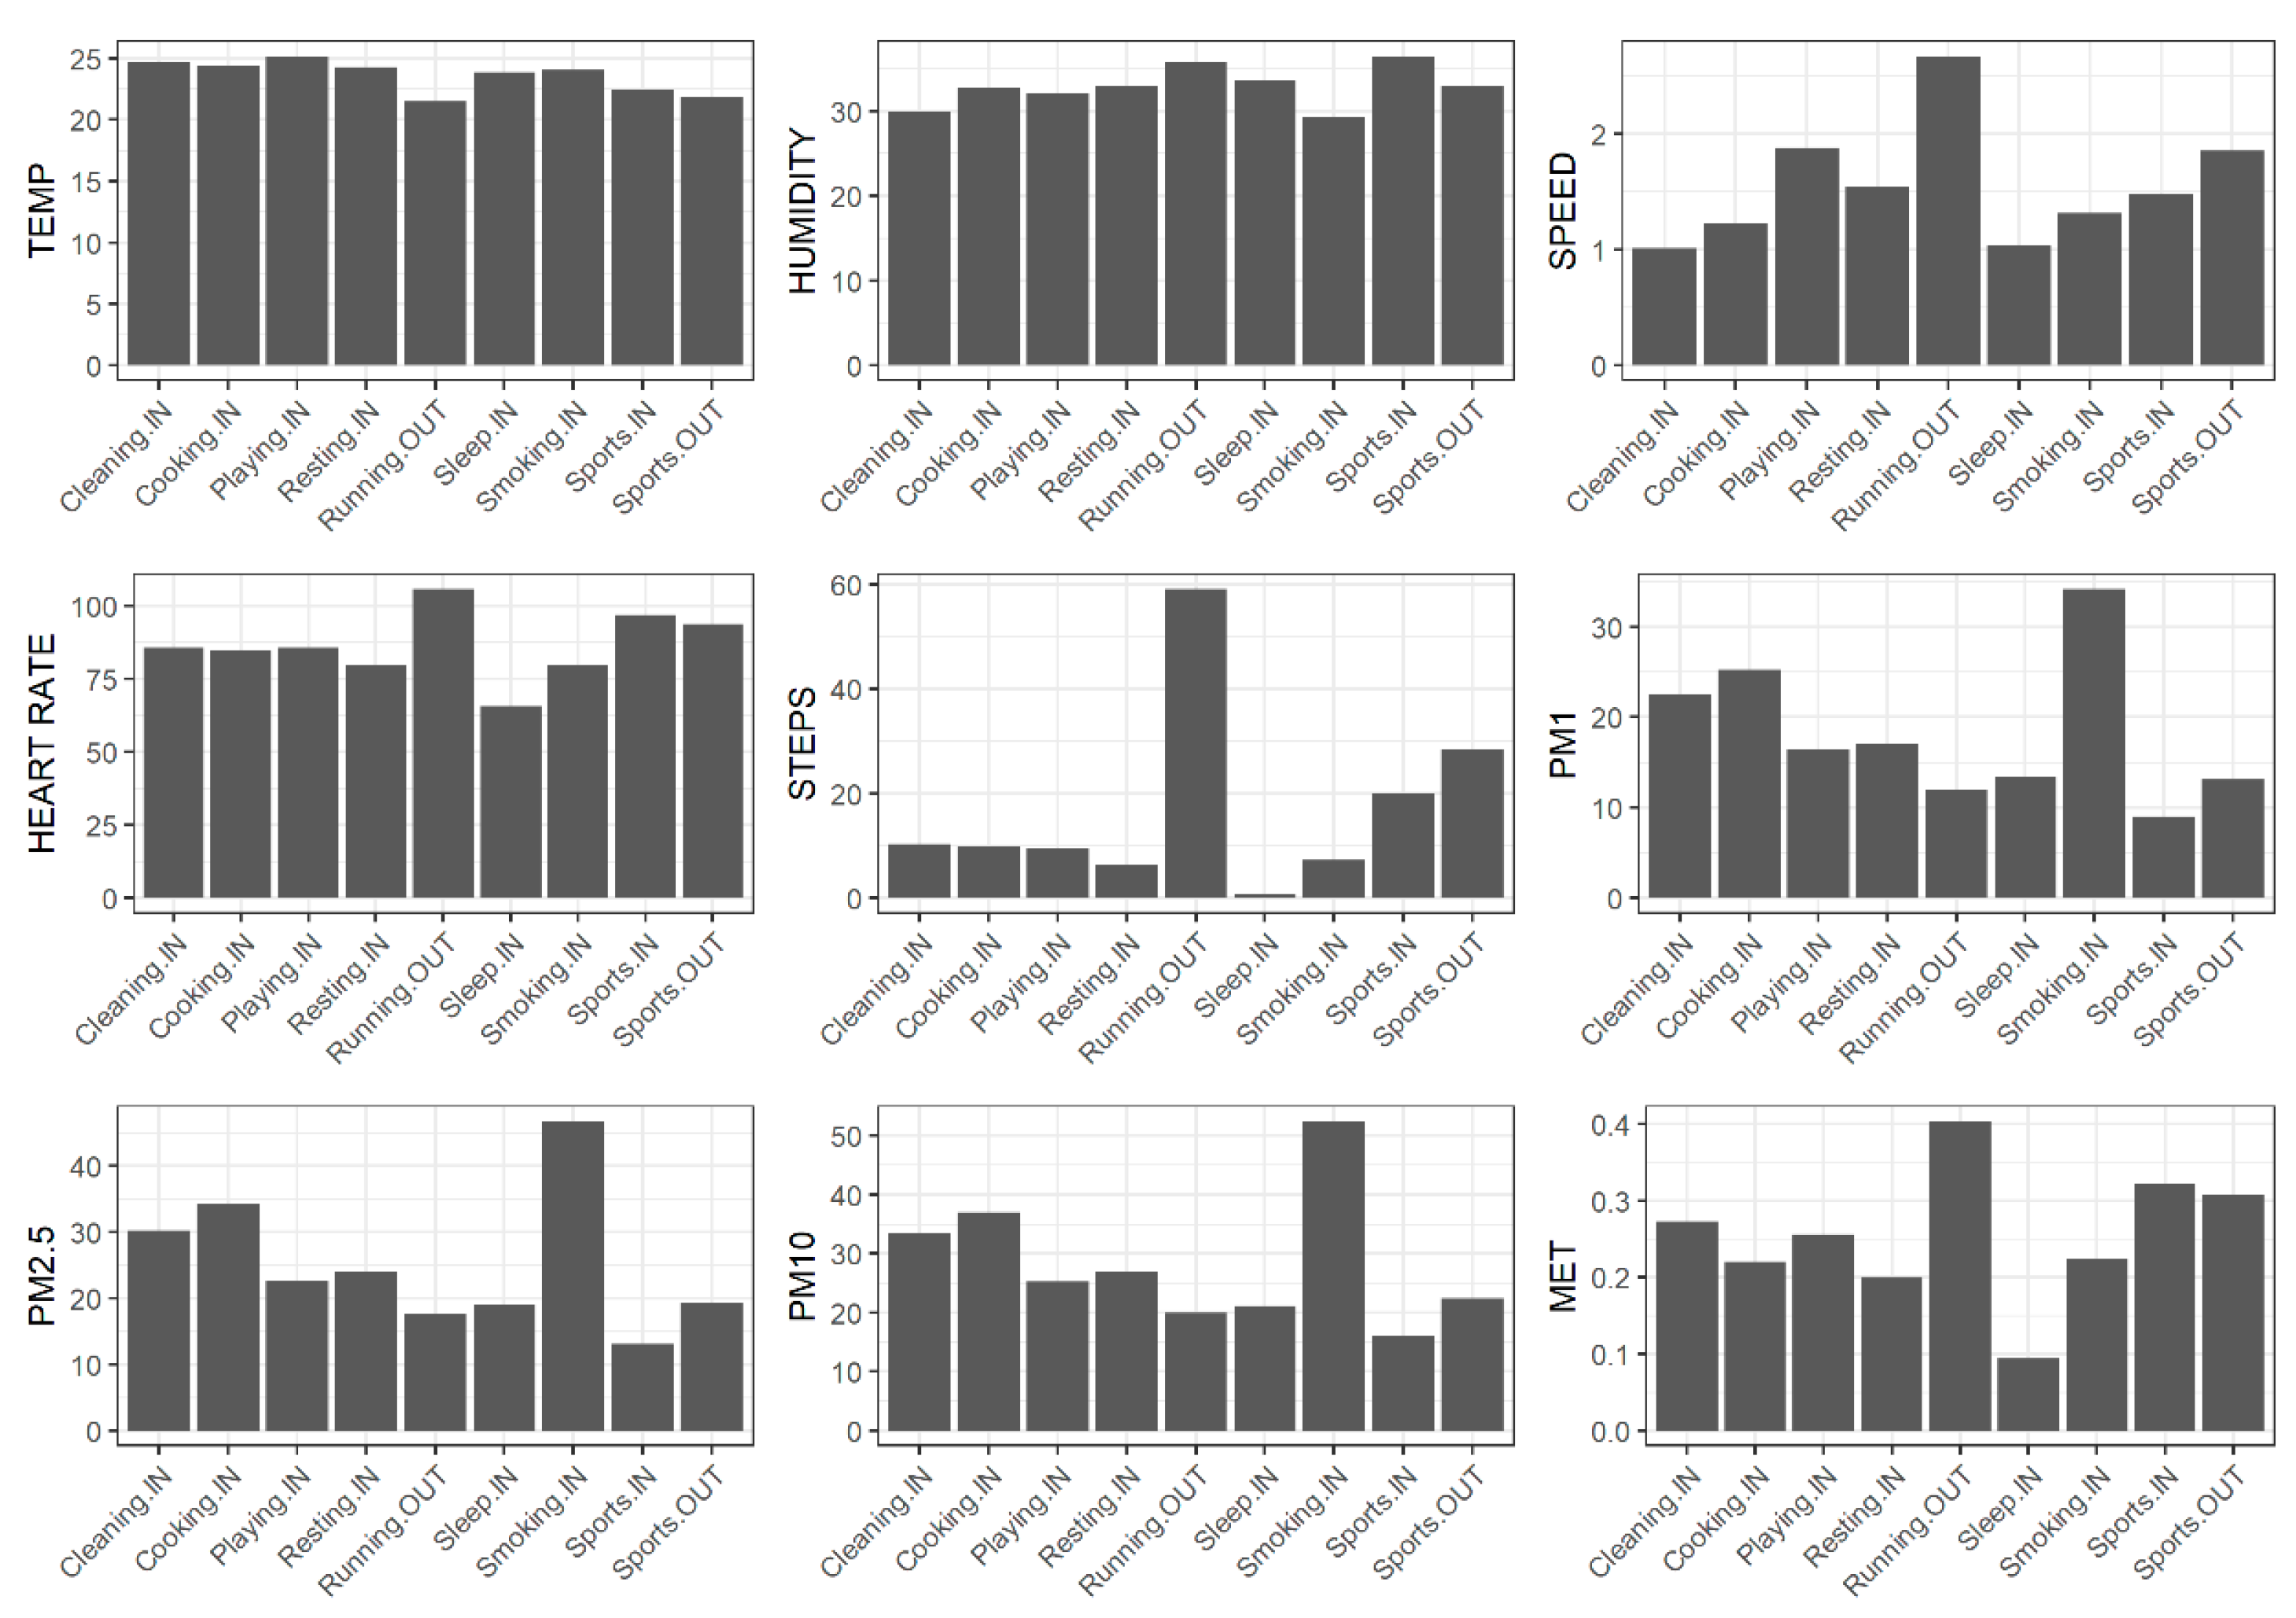
All participants had to fill out a time activity diary (TAD), where information about their activities was provided for each hour. They were given 7 blank daily TADs, where they were able to fill in circles for each activity they performed for every hour of the day. These files were collected and digitalized. Information about all indoor and outdoor activities was used.

2.2. Data Overview

The minimum, 1st quartile, median, mean, 3rd quartile and maximum values for all numeric variables in the final dataset are presented in Table 1.
After cleaning the data, all values are within expected limits. The PM values were fixed at 180 µg/m3 as the highest possible value, otherwise the mean, median and quartile values are as expected. Values for speed are quite low, due to the fact that all values above 20 km/h were removed, as there are no activities included in this research where speed could be above 20 km/h.
For a more thorough overview of the dataset, the average values, were calculated for each activity separately and plotted in Figure 1.
Running has the highest value of speed, heart rate, steps and MET (Metabolic Equivalent of Task, as a proxy for movement), and the lowest for temperature. sports.OUT (sport activities outdoors, except running) and sports.IN (all sport activities indoors) also stand out in all of these values, while also having low average PM concentrations. Importantly, sports.IN also has a higher average temperature and relative humidity than sports.OUT.
Highest PM values are observed for smoking, followed by cooking and cleaning, and lowest for sleep. Sleep also has the lowest speed, heart rate, number of steps and MET, all of which are expected. It does not stand out with regard to temperature and humidity.

2.3. Classifiers Used

Three classification algorithms were chosen, based on best practices and recommendations. The classifiers used are listed in Table 2 along with a short description of each. All of these algorithms are included in WEKA 3.8.3 [13], which was used for the analysis. After the data was imported into WEKA and before it was analyzed, it was normalized by rescaling all attributes to the range of 0–1 as the distribution was not Gaussian.

3. Results and Discussion

3.1. Comparing Classifiers

There are several measures of predictive performance of classifiers, such as the overall classification accuracy and the Κ coefficient, and the (per-class and average) true positive (TP) and false positive (FP) rates, and precision, among others. Table 3 shows a comparison of the listed metrics for all the classifiers used in this research.
10-fold cross-validation was used to estimate performance on unseen cases.
As evident in Table 3, the RandomForest method mostly performs better in this specific task than IBk and J48. It correctly classifies instances 10.4 percentage points better than IBk and 3.6 percentage points better than J48. Its kappa coefficient is also better than IBk and J48. FP rates are lower and TP rates are higher for RandomForest. All metrics show that in terms of accurately predicting an activity, the models can be ranked as follows: RandomForest > J48 > IBk.

3.2. IBk

The IBk classifier correctly classified 2939 (32.7%) of instances, with a Κ (kappa coefficient) of 0.2424. True positive (TP) rates are >0.4 for two activities: the highest (0.7) for sleeping, the next best for running (0.5). Most misclassified instances of sleep were labeled as resting. This is expected, as the two activities share several similar characteristics, such as low heart rate, no movement and low levels of PM.
A relevant observation is that sleeping typically has very clearly defined time intervals (at night), a low heart rate and no movement. Sleeping is also one of the few activities that every participant indicated and is consequently very homogeneously distributed. On top of this, it is the only activity that is performed consecutively for several hours, without interruptions, which in turn means that there are very few instances where there are distorted minute values present inside an hour. An example of such distorted values would be that a person only runs for 20 min, but indicates that running was the main activity in that hour. Only 1/3 of the data would really confirm this fact, the other 40 min are other activities, which distort the final result. On the other hand, this is not common for sleeping, as most people sleep in one single block of time.
Resting is also somewhat characterized with longer consecutive time intervals without interruptions. It also has the most misclassifications and highest false positive (FP) rate, which is due to the fact that resting is the second most frequent activity chosen by participants (after sleeping) in the whole study and in turn should overlap with most activities very frequently (the “default” activity being resting). It is also vaguely defined and open to interpretation, which can prompt participants to include a whole swath of activities under this term, for example, reading a book, playing board or computer games, watching television, chatting with friends, taking a leisurely walk, napping, having a dinner party, et cetera. All of these activities can differ in many aspects, such as heart rate, movement, speed or PM concentrations, which would make accurate predictions more difficult.
Besides sleeping and resting, TP rates are >0.25 for all activities, with the exception of the two sport activities. An interesting observation is that running also had quite a small false positive (FP) rate of 0.065, mostly being misclassified as sports outdoors. This could also be a consequence of activities being mislabeled by the participants (confusing sports outdoors and running when labeling activities).

3.3. J48

Results show that the model learned by J48 correctly classified approximately 39.5% of instances, with a Κ value of 0.3195. One noticeable difference of TP rate is evident with cooking, where it was 0.327 with IBk and 0.427 with J48, otherwise the TP values do not differ much between the different models. Similar patterns are obvious with all other measures of accuracy.

3.4. RandomForest

The results from the model based on RandomForest, showed the highest accuracy (43.1%) and lowest errors. Although the TP and FP values are somewhat higher, they do not differ much from IBk and J48, with sleeping and running again being at the top with 0.850 and 0.604 TP rates, respectively. A similar pattern as in the previous classifiers was observed, where running had few misclassified instances, mostly as sports outdoors. Again, very few activities were misclassified as sleeping, the only outlier being resting with 60 misclassifications.

4. Conclusions

All the classifiers used had accuracy above 30%, with RandomForest being the most accurate (43.1%). As the labeled data consisted of hourly labeled activities, this gives it less resolution and more errors (some activities do not last an hour, and most do not last exactly a set number of full hours). A future improvement would be to label data by minute, not by hour. This would match the desired output of per-minute predictions and allow finer granularity.
All of the models had several misclassified instances from the resting activity. This could be the result of the vague definition of resting in comparison to sleeping, running and most other activities. On the other hand, sleeping or smoking are quite well-defined activities, where there is little room for subjectivity. A prospect for future studies would be to take the most ambiguous or subjective activities and break them down into more defined activities, as specified above. Although, this would mean more challenges for collecting data, it could provide more detailed and accurate final results.
Combining the data points used in this research with environmental stressors, measured with portable low-cost sensors, could provide detailed results of exposure and intake dose. Further research is needed to test and validate these approaches.
As low-cost sensors become more widely used and individuals are able to gain access to more information about their living environment, it is crucial for researchers to provide adequate tools to assess and improve accuracy of activity classification. A promising step forward would be to reduce the input of individuals and increase the role of machine learning. This research shows a novel approach of using classification methods with data from low-cost portable environmental and activity sensors, to recognize specific activities without direct human input.

Author Contributions

R.N. and D.K. conceptualized the idea, collected the data with J.A.R. and T.K., analyzed, validated and visualized the data, and prepared the original draft; S.D. reviewed and edited the content; D.S. coordinated and led the design efforts for the ICARUS project; M.H. headed the project on a local level, ensured funding and contributed to the final review and editing. All authors have read and agreed to the published version of the manuscript.

Funding

This project has received funding from the European Union’s Horizon 2020 research and innovation program under grant agreement No. 690105, and the Young Researchers Program and P1-0143 program “Cycling of substances in the environment, mass balances, modelling of environmental processes and risk assessment«, both funded by the Slovenian Research Agency.

Conflicts of Interest

The authors declare no conflict of interest.

References

  1. Ferro, A.R.; Kopperud, R.J.; Hildemann, L.M. Elevated personal exposure to particulate matter from human activities in a residence. J. Expo. Sci. Environ. Epidemiol. 2004, 14, S34–S40. [Google Scholar] [CrossRef] [PubMed]
  2. Patel, S.; Sankhyan, S.; Boedicker, E.K.; DeCarlo, P.F.; Farmer, D.K.; Goldstein, A.H.; Katz, E.F.; Nazaroff, W.W.; Tian, Y.; Vanhanen, J.; et al. Indoor Particulate Matter during HOMEChem: Concentrations, Size Distributions, and Exposures. Environ. Sci. Technol. 2020, 54, 7107–7116. [Google Scholar] [CrossRef] [PubMed]
  3. Barna, A.; Masum, A.K.M.; Hossain, M.E.; Bahadur, E.H.; Alam, M.S. A study on Human Activity Recognition Using Gyroscope, Accelerometer, Temperature and Humidity data. In Proceedings of the 2019 International Conference on Electrical, Computer and Communication Engineering (ECCE), Bangladesh, 7–9 February 2019; pp. 1–6. [Google Scholar]
  4. Shelke, S.; Aksanli, B. Static and Dynamic Activity Detection with Ambient Sensors in Smart Spaces. Sensors 2019, 19, 804. [Google Scholar] [CrossRef] [PubMed]
  5. Dernbach, S.; Das, B.; Krishnan, N.C.; Thomas, B.L.; Cook, D.J. Simple and Complex Activity Recognition through Smart Phones. In Proceedings of the 2012 Eighth International Conference on Intelligent Environments, Guanajato, Mexico, 26–29 June 2012; pp. 214–221. [Google Scholar]
  6. Holm, S.M.; Balmes, J.; Gillette, D.; Hartin, K.; Seto, E.; Lindeman, D.; Polanco, D.; Fong, E. Cooking behaviors are related to household particulate matter exposure in children with asthma in the urban East Bay Area of Northern California. PLoS ONE 2018, 13, e0197199. [Google Scholar] [CrossRef] [PubMed]
  7. Wan, M.-P.; Wu, C.-L.; To, G.-N.; Chan, T.-C.; Chao, C. Ultrafine particles, and PM 2.5 generated from cooking in homes. Atmos. Environ. 2011, 45, 6141–6148. [Google Scholar] [CrossRef]
  8. Corsi, R.L.; Siegel, J.A.; Chiang, C. Particle resuspension during the use of vacuum cleaners on residential carpet. J. Occup. Environ. Hyg. 2008, 5, 232–238. [Google Scholar] [CrossRef] [PubMed]
  9. ICARUS2020.eu. icarus. Available online: https://icarus2020.eu/ (accessed on 12 October 2018).
  10. Garmin and G. L. or Its Subsidiaries, ‘Vívosmart 3|Activity Tracking’. Garmin. Nov. 16, 2018. Available online: https://buy.garmin.com/en-US/US/p/567813 (accessed on 16 November 2018).
  11. IoTECH TELECOMMUNICATIONS. Available online: https://iotech.gr/ (accessed on 13 May 2019).
  12. Plantower PMS5003 Datasheet.pdf. Available online: http://www.aqmd.gov/docs/default-source/aq-spec/resources-page/plantower-pms5003-manual_v2-3.pdf (accessed on 15 June 2019).
  13. Frank, E.; Hall, M.A.; Witten, I.H. The WEKA Workbench. Online Appendix for “Data Mining: Practical Machine Learning Tools and Techniques”, 4th ed.; Morgan Kaufmann: Burlington, MA, USA, 2016. [Google Scholar]
  14. IBk. Available online: https://weka.sourceforge.io/doc.dev/weka/classifiers/lazy/IBk.html (accessed on 9 June 2020).
  15. J48. Available online: https://weka.sourceforge.io/doc.stable-3-8/weka/classifiers/trees/J48.html (accessed on 9 June 2020).
  16. Quinlan, J.R. C4.5: Programs for Machine Learning; Morgan Kaufmann Publishers, Inc.: Burlington, MA, USA, 1993. [Google Scholar]
  17. Wu, X.; Kumar, V.; Ross Quinlan, J.; Ghosh, J.; Yang, Q.; Motoda, H.; McLachlan, G.J.; Ng, A.; Liu, B.; Yu, P.S.; et al. Top 10 algorithms in data mining. Knowl. Inf. Syst. 2008, 14, 1–37. [Google Scholar] [CrossRef]
  18. RandomForest. Available online: https://weka.sourceforge.io/doc.stable-3-8/weka/classifiers/trees/RandomForest.html (accessed on 9 June 2020).
  19. Breiman, L. Random Forests. Mach. Learn. 2001, 45, 5–32. [Google Scholar] [CrossRef]
Figure 1. Average values for all variables and activities.
Engproc 02 00054 g001
Table 1. Basic statistics for all numeric variables in the dataset.
MedianMeanMaxMin1st Q3rd Q
PM1 (µg/m3)9.015.21800.05.017.0
PM2.5 (µg/m3)12.021.21800.07.024.0
PM10 (µg/m3)13.023.71800.07.026.0
Temperature (°C)24.124.035.25.822.825.3
Relative humidity (%)32.733.080.76.72837.9
Speed (km/h)0.521.2120.0001.65
Avg. Heart rate (bpm)71.074.1205346283
Steps (no.)05.40276000
Table 2. Classifiers used in this research with a short description.
ClassifierDescription
IBk [14]Instance based learner, otherwise known as the k-nearest neighbor (kNN) classifier; selects value of k based on internal cross-validation.
J48 [15]J48 is a Java implementation of the C4.5 decision tree algorithm developed in 1993 by Ross Quinlan [16]. It can be used for classification and allows a high number of attributes. Deemed as a “machine learning workhorse”, ranked no. 1 in the Top 10 Algorithms in Data Mining [17].
RandomForest [18]Constructs a forest of decision trees in a randomized manner. Developed by Leo Breiman in 2001 [19].
Table 3. Summary of results for all models.
ClassifierCorrectly ClassifiedKappaTPFPPrecisionROC AreaPRC Area
IBk32.7%0.24240.3270.0840.3630.6210.220
J4839.5%0.31950.3950.0760.4070.7670.370
RandomForest43.1%0.36010.4310.0710.4320.8070.444
Publisher’s Note: MDPI stays neutral with regard to jurisdictional claims in published maps and institutional affiliations.

