Abstract
To reduce the impact on climate change, many countries have developed strategies for the building sector with a goal to reduce the energy demands and carbon emission of buildings. As most buildings that exist today will very likely exist in foreseeable future, many buildings will need to undergo major renovations. One of the most important parameters in determining the transmission heat losses through the building envelope is the U-value, i.e., thermal transmittance, and it is simply the rate of heat transfer per unit temperature. Since the U-value is one of the most important parameters regarding building energy performance, envelope elements that do not perform well in terms of transmission heat losses must undergo a renovation processes. The in-situ U-value of building elements is usually determined by the Heat Flux Method (HFM). One of the issues of current application of the HFM is the measurement duration. This paper explores the possibilities of reducing the measurement time by predicting the heat flux rate using a multilayer perceptron (MLP), a class of artificial neural network. The MLP uses two input layers that are the interior and exterior air temperatures, and the output layer that is the predicted heat flux rate. The predicted value is trained by comparing the predicted heat flux rates with the measured values, and by rearranging the neural network parameters (weights and biases) in corresponding neurons by minimizing the mean squared error defined for trained values (measured versus predicted heat flux rates). The use of MLP shows promising results for predicting the heat flux rates for the analyzed cases (4 days HFM results) when the training is performed on 2/3 or 1/2 of the overall measurement time. The application of the MLP could be in reducing the in-situ measurement time when determining heat losses through building elements in shorter time periods.
1. Introduction
Assessment of the building energy performance came into focus in the European Union (EU) Member states because of the EU’s policy decisions to mandate that every new building must be a Nearly Zero-Energy Building (NZEB); this also applies to every building that undergoes a major renovation. Buildings that exist today will very likely exist in the near future [1], and this is a reason why EU Member states must develop plans for renovation of building stock. Problems occur in assessment of building envelope performance (in view of transmission heat losses) of existing buildings due to lack of technical drawings, or because of degradation of construction materials. One of the most important parameters in determining the transmission heat losses through the building envelope is the thermal transmittance (U-value), which is the rate of heat transfer per unit temperature. To overcome the problem of assessing the envelope performance, in-situ U-value can be determined by using the Heat Flux Method (HFM). HFM is standardized [2] nondestructive method based on heat flow rate measurement using a heat flow sensor, and simultaneous measurement of interior and exterior air temperatures using thermocouples. In order to shorten the measurement time, this paper analyzes a possibility of application of an artificial intelligence (AI) Multilayer Perceptron (MLP) method and its applicability on HFM results. The idea is to construct an artificial neural network (ANN) that has two inputs (interior and exterior air temperatures) and one output (heat flow rates). The ANN learns how to assess the heat flow rate based on measured interior/exterior temperatures and heat flow rates, by minimizing the ANN cost function. After the ANN achieves satisfactory precision depending on certain measurements, the heat flow sensor can be moved to a new measurement location, and only thermocouples are needed to ensure the inputs of the ANN in order to finish the measurement. The application of proposed method shortens the measurement time when there are more than one envelope elements that are examined by one heat flow sensor.
Experimental Data
Measurement was carried out in the period between the 28th of February up until 3rd of March 2019. The measurement site can be seen in Figure 1. Experimental data contains 510 data points (heat fluxes and air temperatures) [3]. These data points are a part (HFM results) of research from [4].
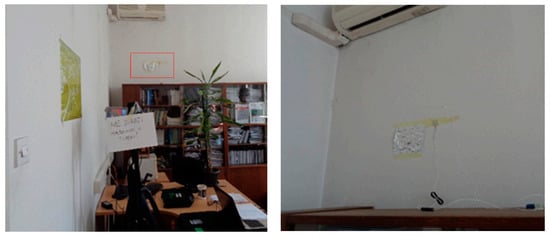
Figure 1.
Measurement site showing experimental setup.
The analyzed wall is located in Zagreb (on the Faculty of Civil Engineering, UNIZG) and it is oriented towards the east. The internal environment was heated from 06:00 until 22:00 with radiators every day during the measurement period. Air conditioning unit was turned off during the measurement. External wall surface was exposed to the real environmental conditions (rain, sun, etc.). Heat flux sensor was placed 0.85 m from the adjacent wall and minimally 0.4 m from all the other obstacles. Interior and exterior air temperatures were measured with thermocouples. More information about the heat flux sensor and the thermocouples can be seen in Section 2.1.
2. Methods
The paper presents an application of MLP on HFM results for a 47.3 cm wall with the designed U-value of 0.91 W/(m K). The MLP method, as well as its application on the HFM results, are defined in Section 2.2. All the files used in this research can be found in of one of the author’s GitHub repository [5]. The MLP method is modeled with the Python machine learning library Keras [6] which is a generalization of Python Tensorflow source library [7].
2.1. Heat Flux Method
HFM is based on measuring the heat flux density by the heat flow sensor, and on measuring the interior and exterior air temperatures using thermocouples. Measurement equipment specification is shown in Table 1.

Table 1.
Heat flux kit specifications—heat flux sensors and 2 thermocouples.
A heat flux sensor is a device that produces an electrical signal that is a linear function of the heat flow passing through it. These sensors are usually flat, thermally resistive plates (schematically shown in Figure 2) with thermocouples that have several thermophiles integrated inside of the thermocouple substrate. Sensors for air temperature measurements produce an electrical signal that is a linear function of its temperature.
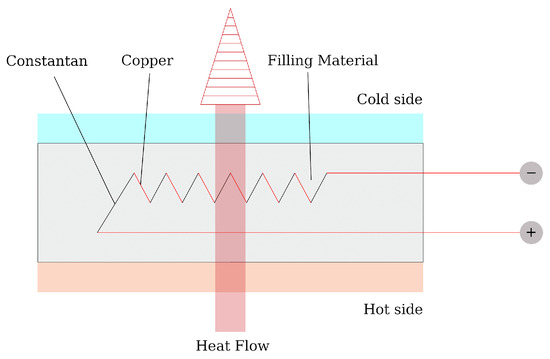
Figure 2.
Schematic cross section of heat flux sensor.
The goal of this research is to calculate the U-value using the MLP method and compare it to the U-value calculated using the average method defined in the ISO 9869 standard [2] (1):
where T and T are the internal and external air temperatures, respectively, and q is the heat flow rate. Index j is corresponding to the measurement data point.
2.2. Artificial Neural Networks—Multilayer Perceptron
The MLP is a class of feedforward ANN that consists of a minimum of three layers—visible input layer, hidden layer, and output layer. The input layer brings certain information to the ANN model that, with a set of weights and biases, carry a certain information from one neuron to another. Each neuron in the hidden layer has an activation function that transforms information and carries it to the neurons in the next layer. The last layer is the output layer with its activation function. The ANN model is trained in a way that the output layer neurons (outputs) are compared to the training data points forming the cost function based on the chosen loss function (e.g., the mean squared error). The loss function is minimized by rearranging the ANN model weights, biases, and activation functions. When the error tolerance is satisfied, the model can be used for predicting the certain phenomena, or in this case the U-value.
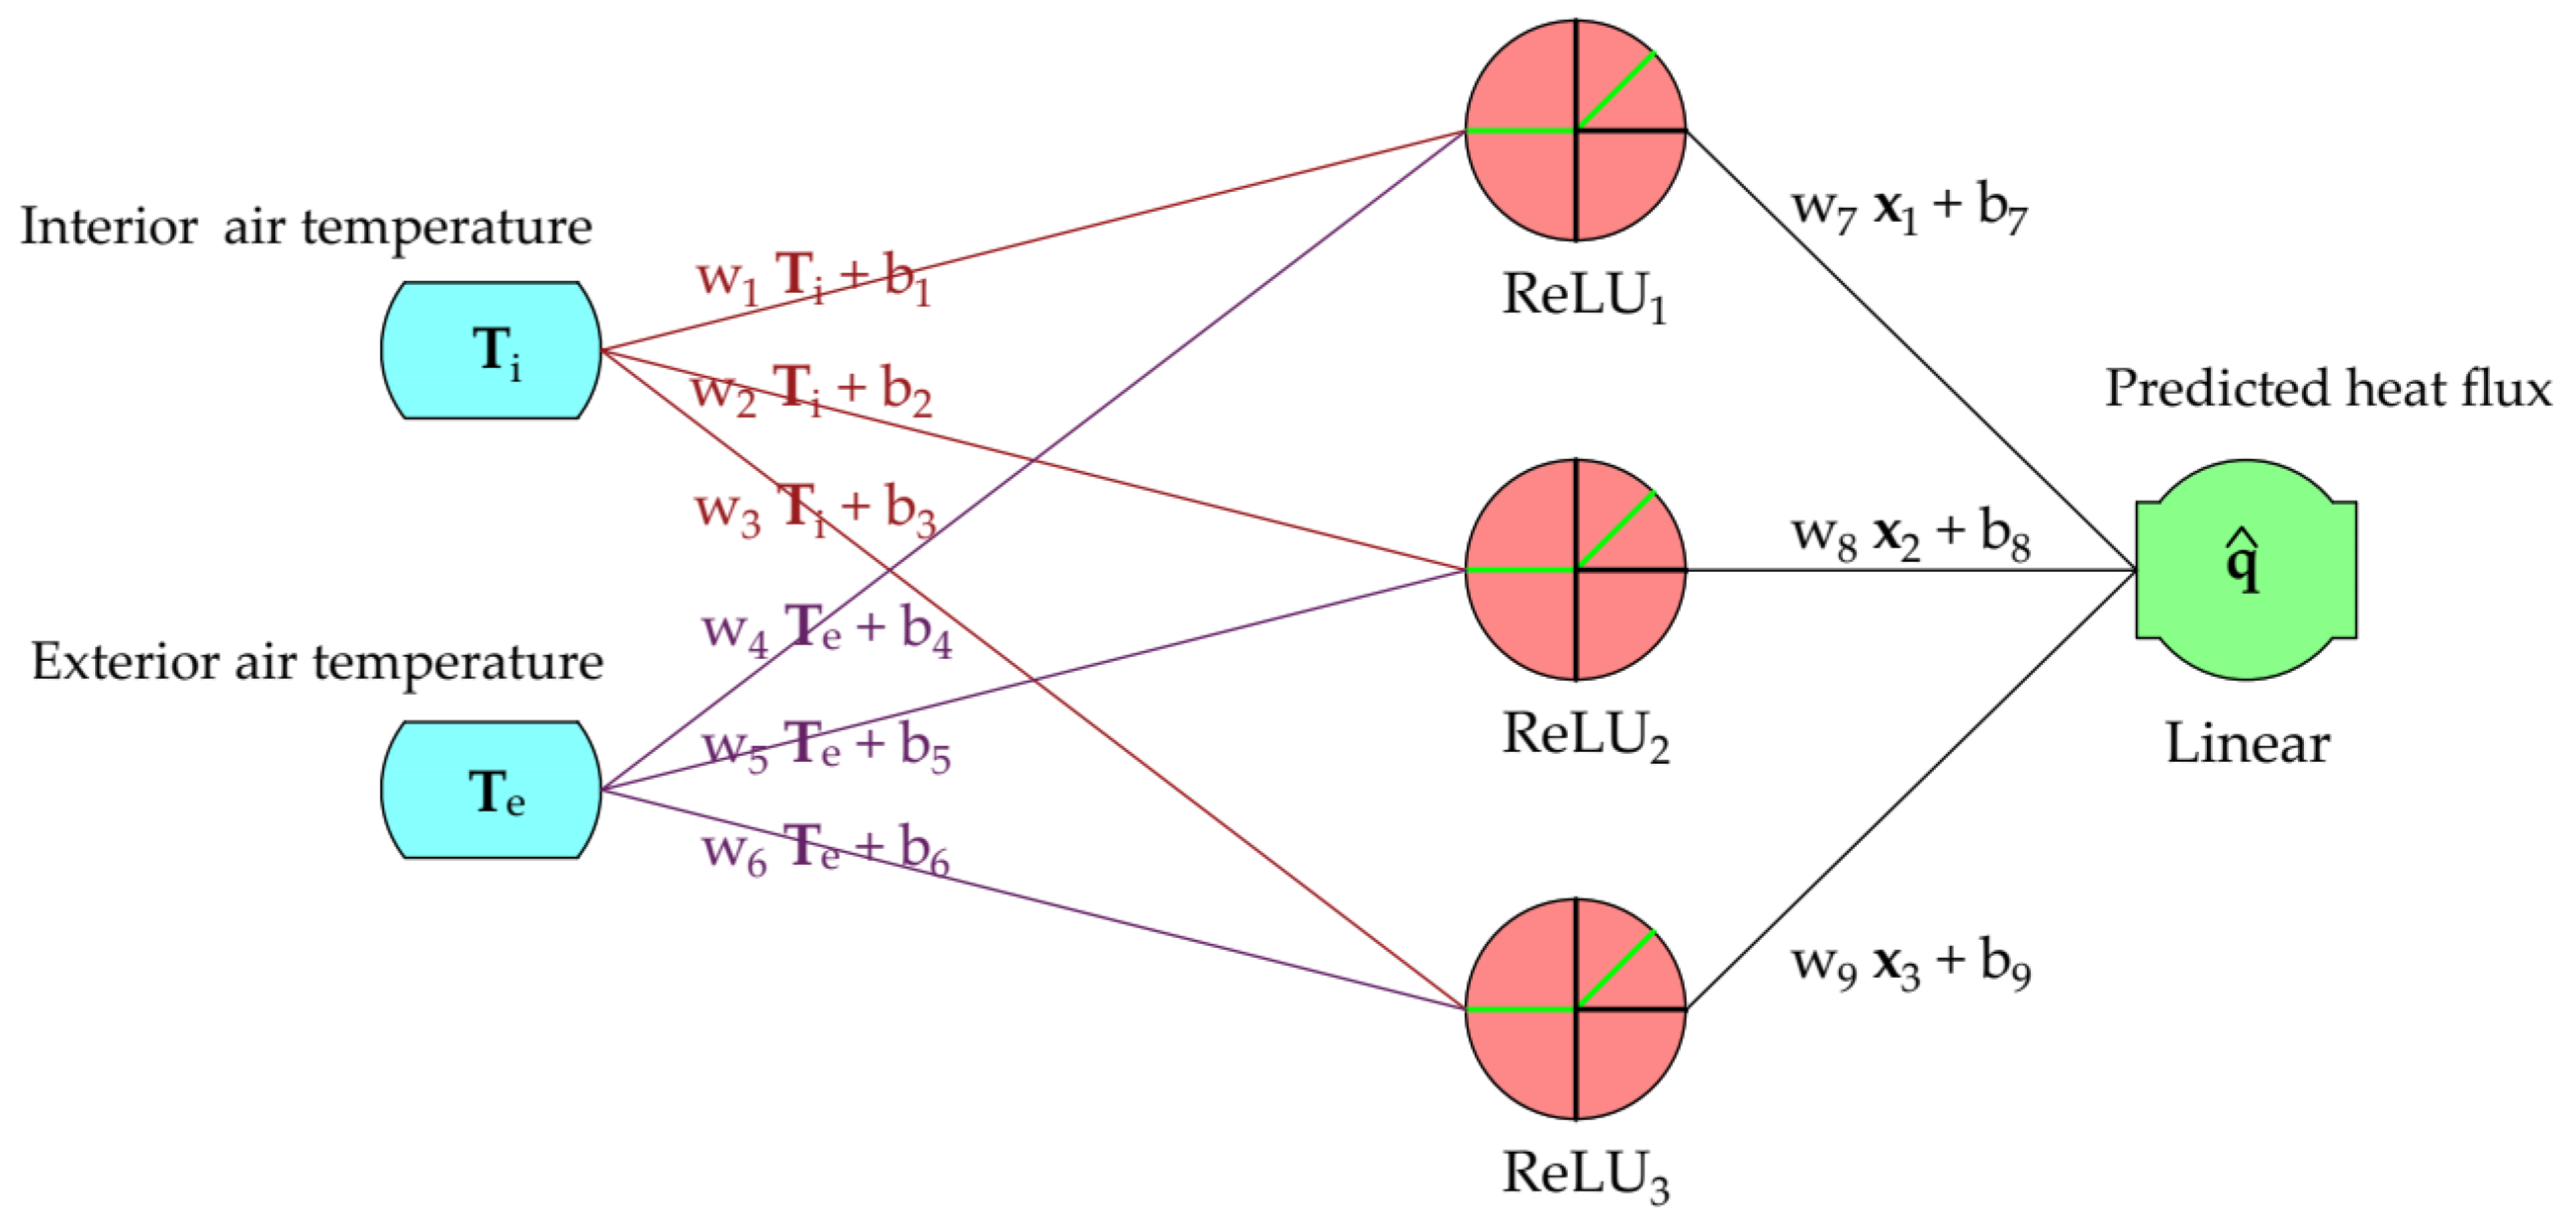
The ANN in this paper consists of two inputs (neurons) in the input layer, one hidden layer with three perceptrons (neurons), and an output layer with one output. This type of the ANN MLP (with one hidden layer) is usually called plain vanilla. The inputs are internal and external air temperatures used for “feeding” the ANN, and the output is the predicted heat flux used for back-propagation process. This ANN model is trained on three sets of data points derived from [3]. The first case is done on 1/4 of the total data points, the second on 1/2 of the total data points and the third on the 2/3 of the total data points. The cost function is created using the mean squared error (MSE) and it is minimized using the stochastic gradient descent method with Adam [8] optimizer. The schematic architecture of the ANN model is shown in Figure 3. The activation functions for all the neurons in the hidden layer is a ReLU function, and the activation function for the output layer is a linear function. For the prediction comparison two more parameters, alongside with the MSE, were used – the Root Mean Squared Error (RMSE) and the Mean Absolute Error (MAE).
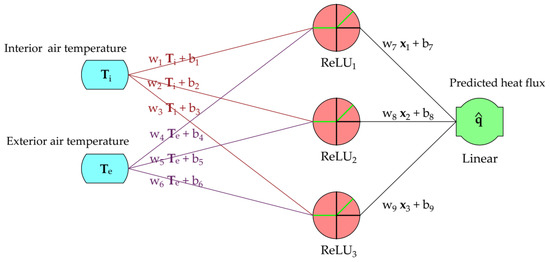
Figure 3.
Schematic view of artificial neural network model.
3. Results
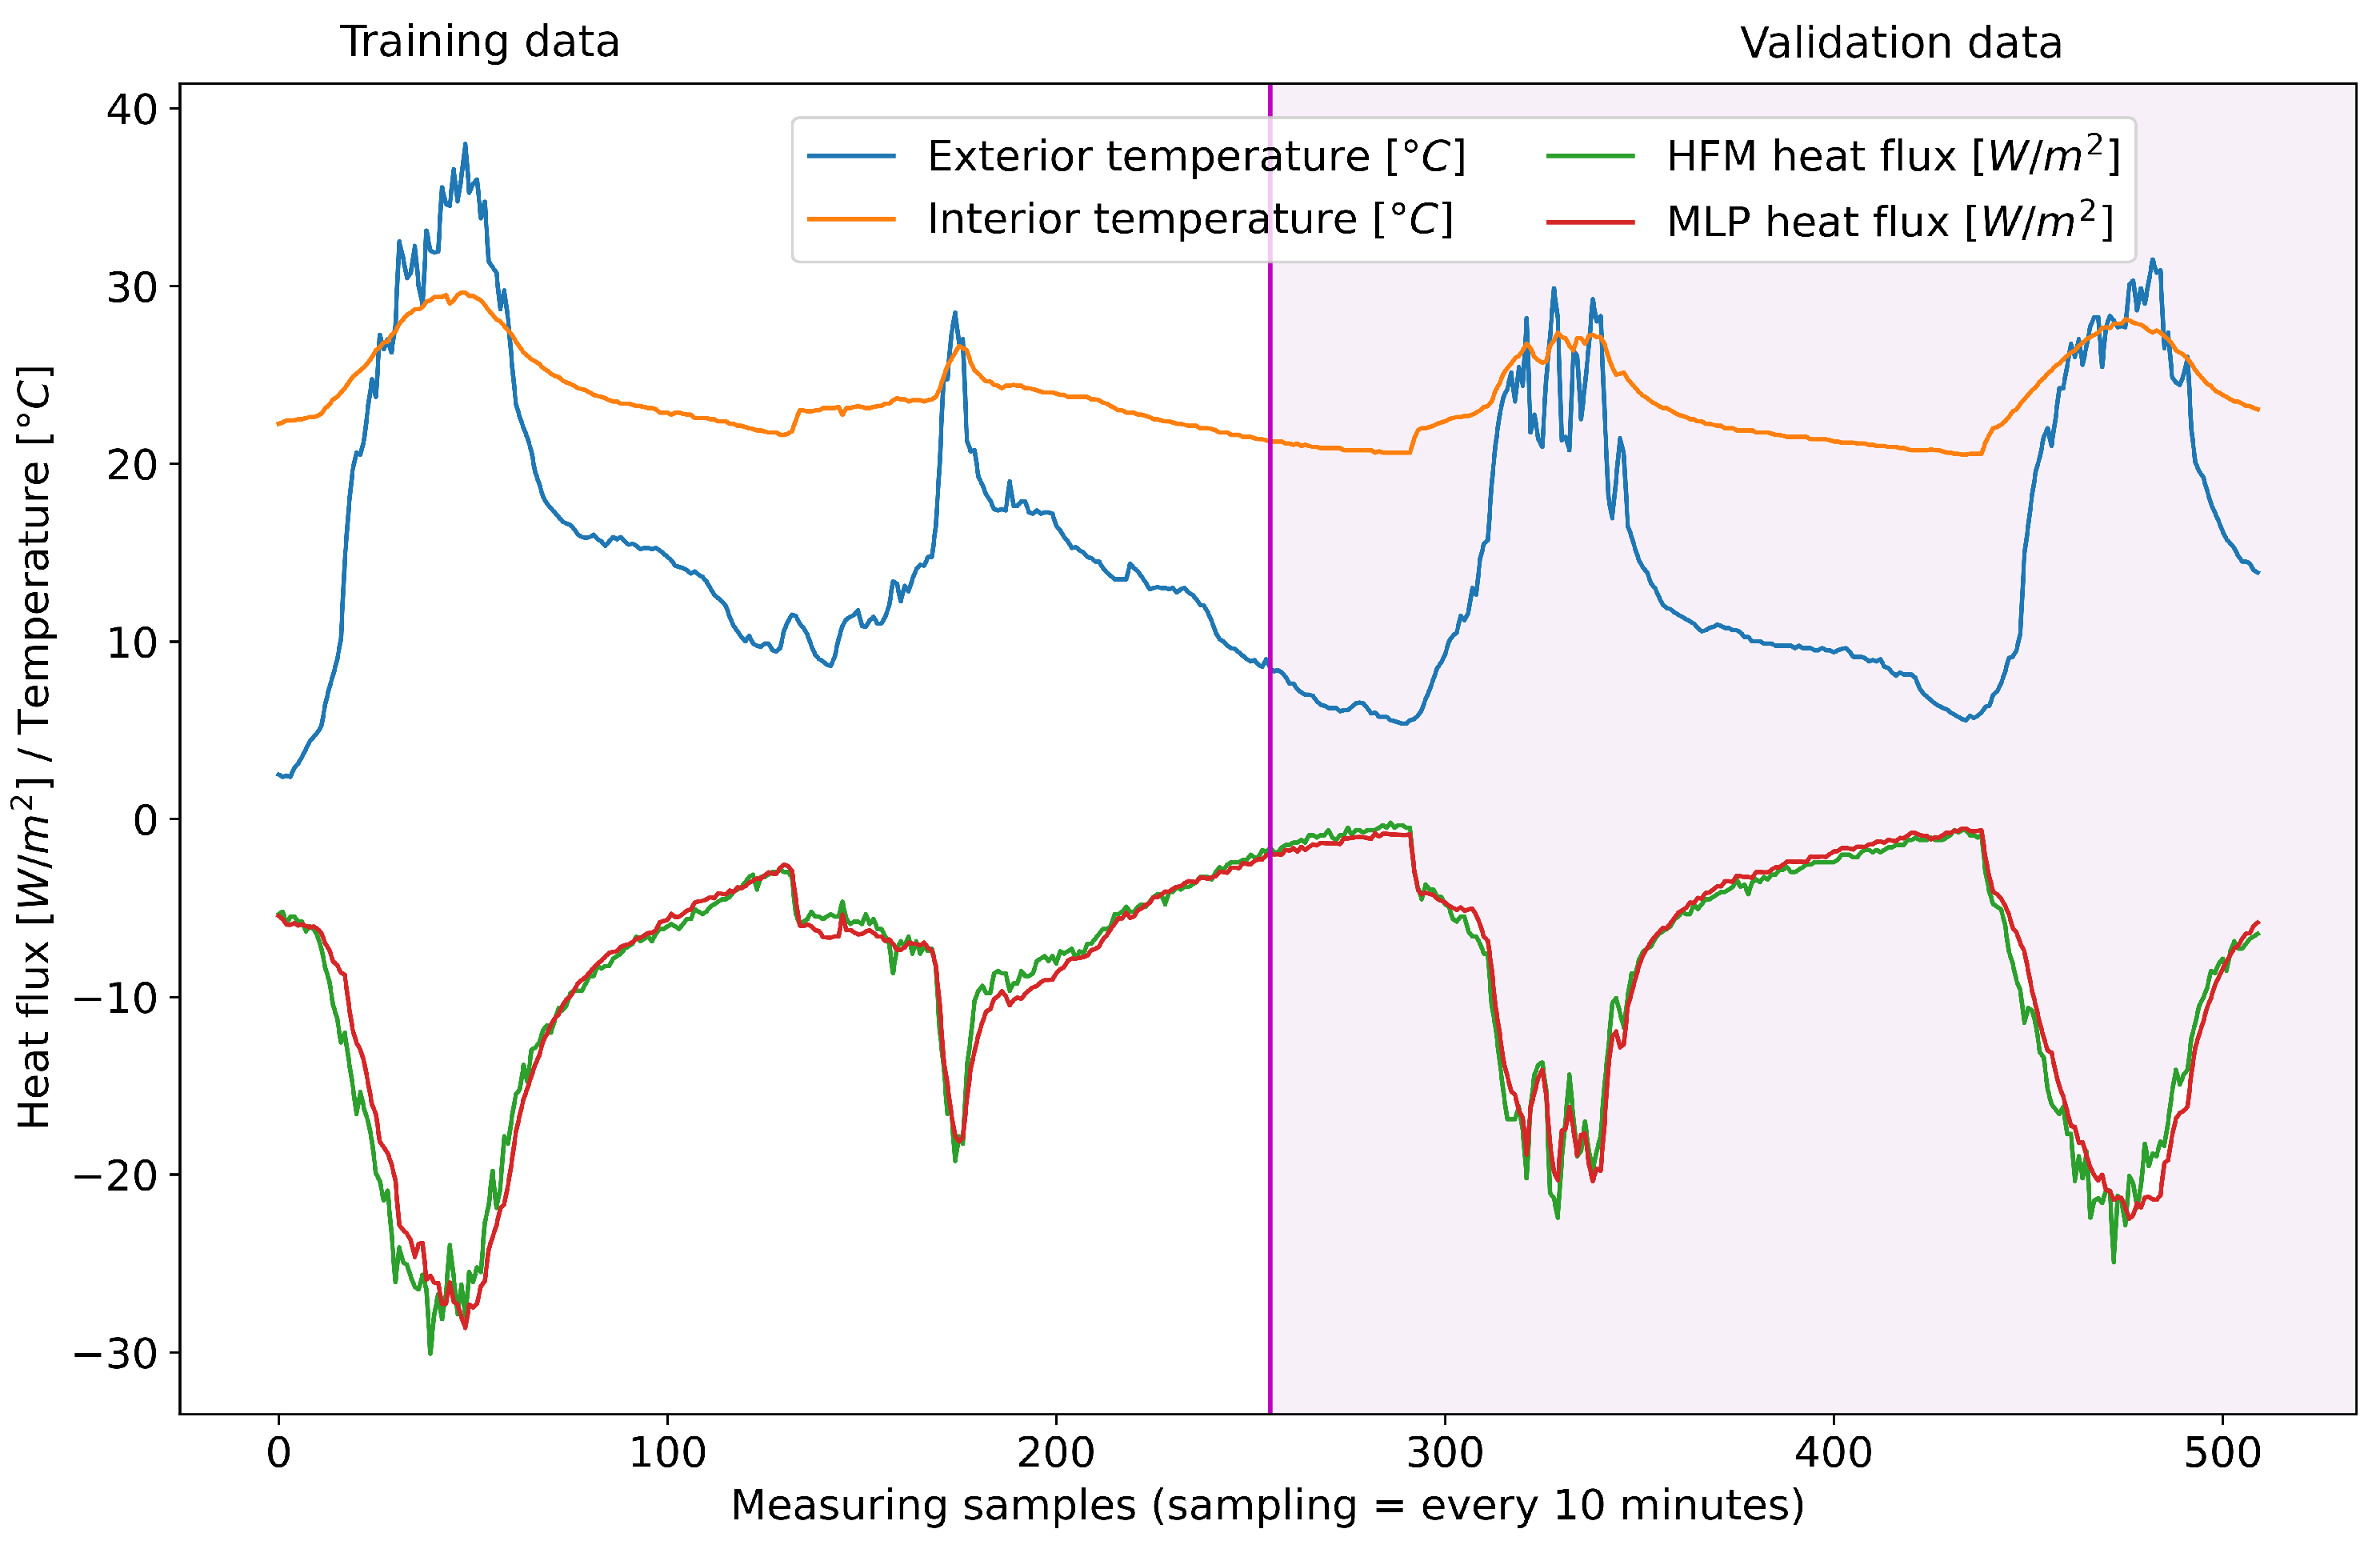
As stated in Methodology, three cases were analyzed on one measurement dataset (510 data points). The first case is an ANN prediction of the model trained on 1/4 of the total data points (128 entries), and the comparison between the predicted results and the measured values is shown in Figure 4. Figure 5 and Figure 6 show the results for the ANN trained on 1/2 (255 entries) and 2/3 (340 entries) of the total data points.
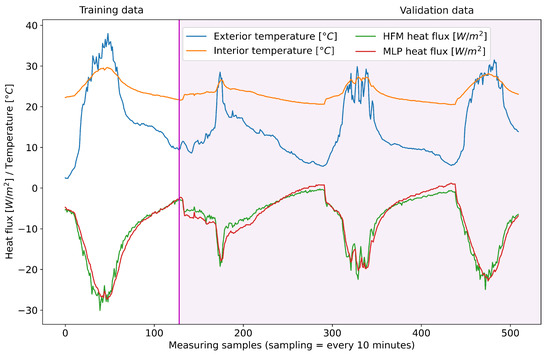
Figure 4.
Heat flux prediction based on ANN training on 1/4 of measurement data.
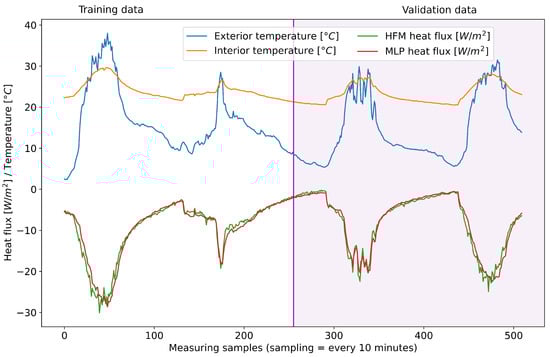
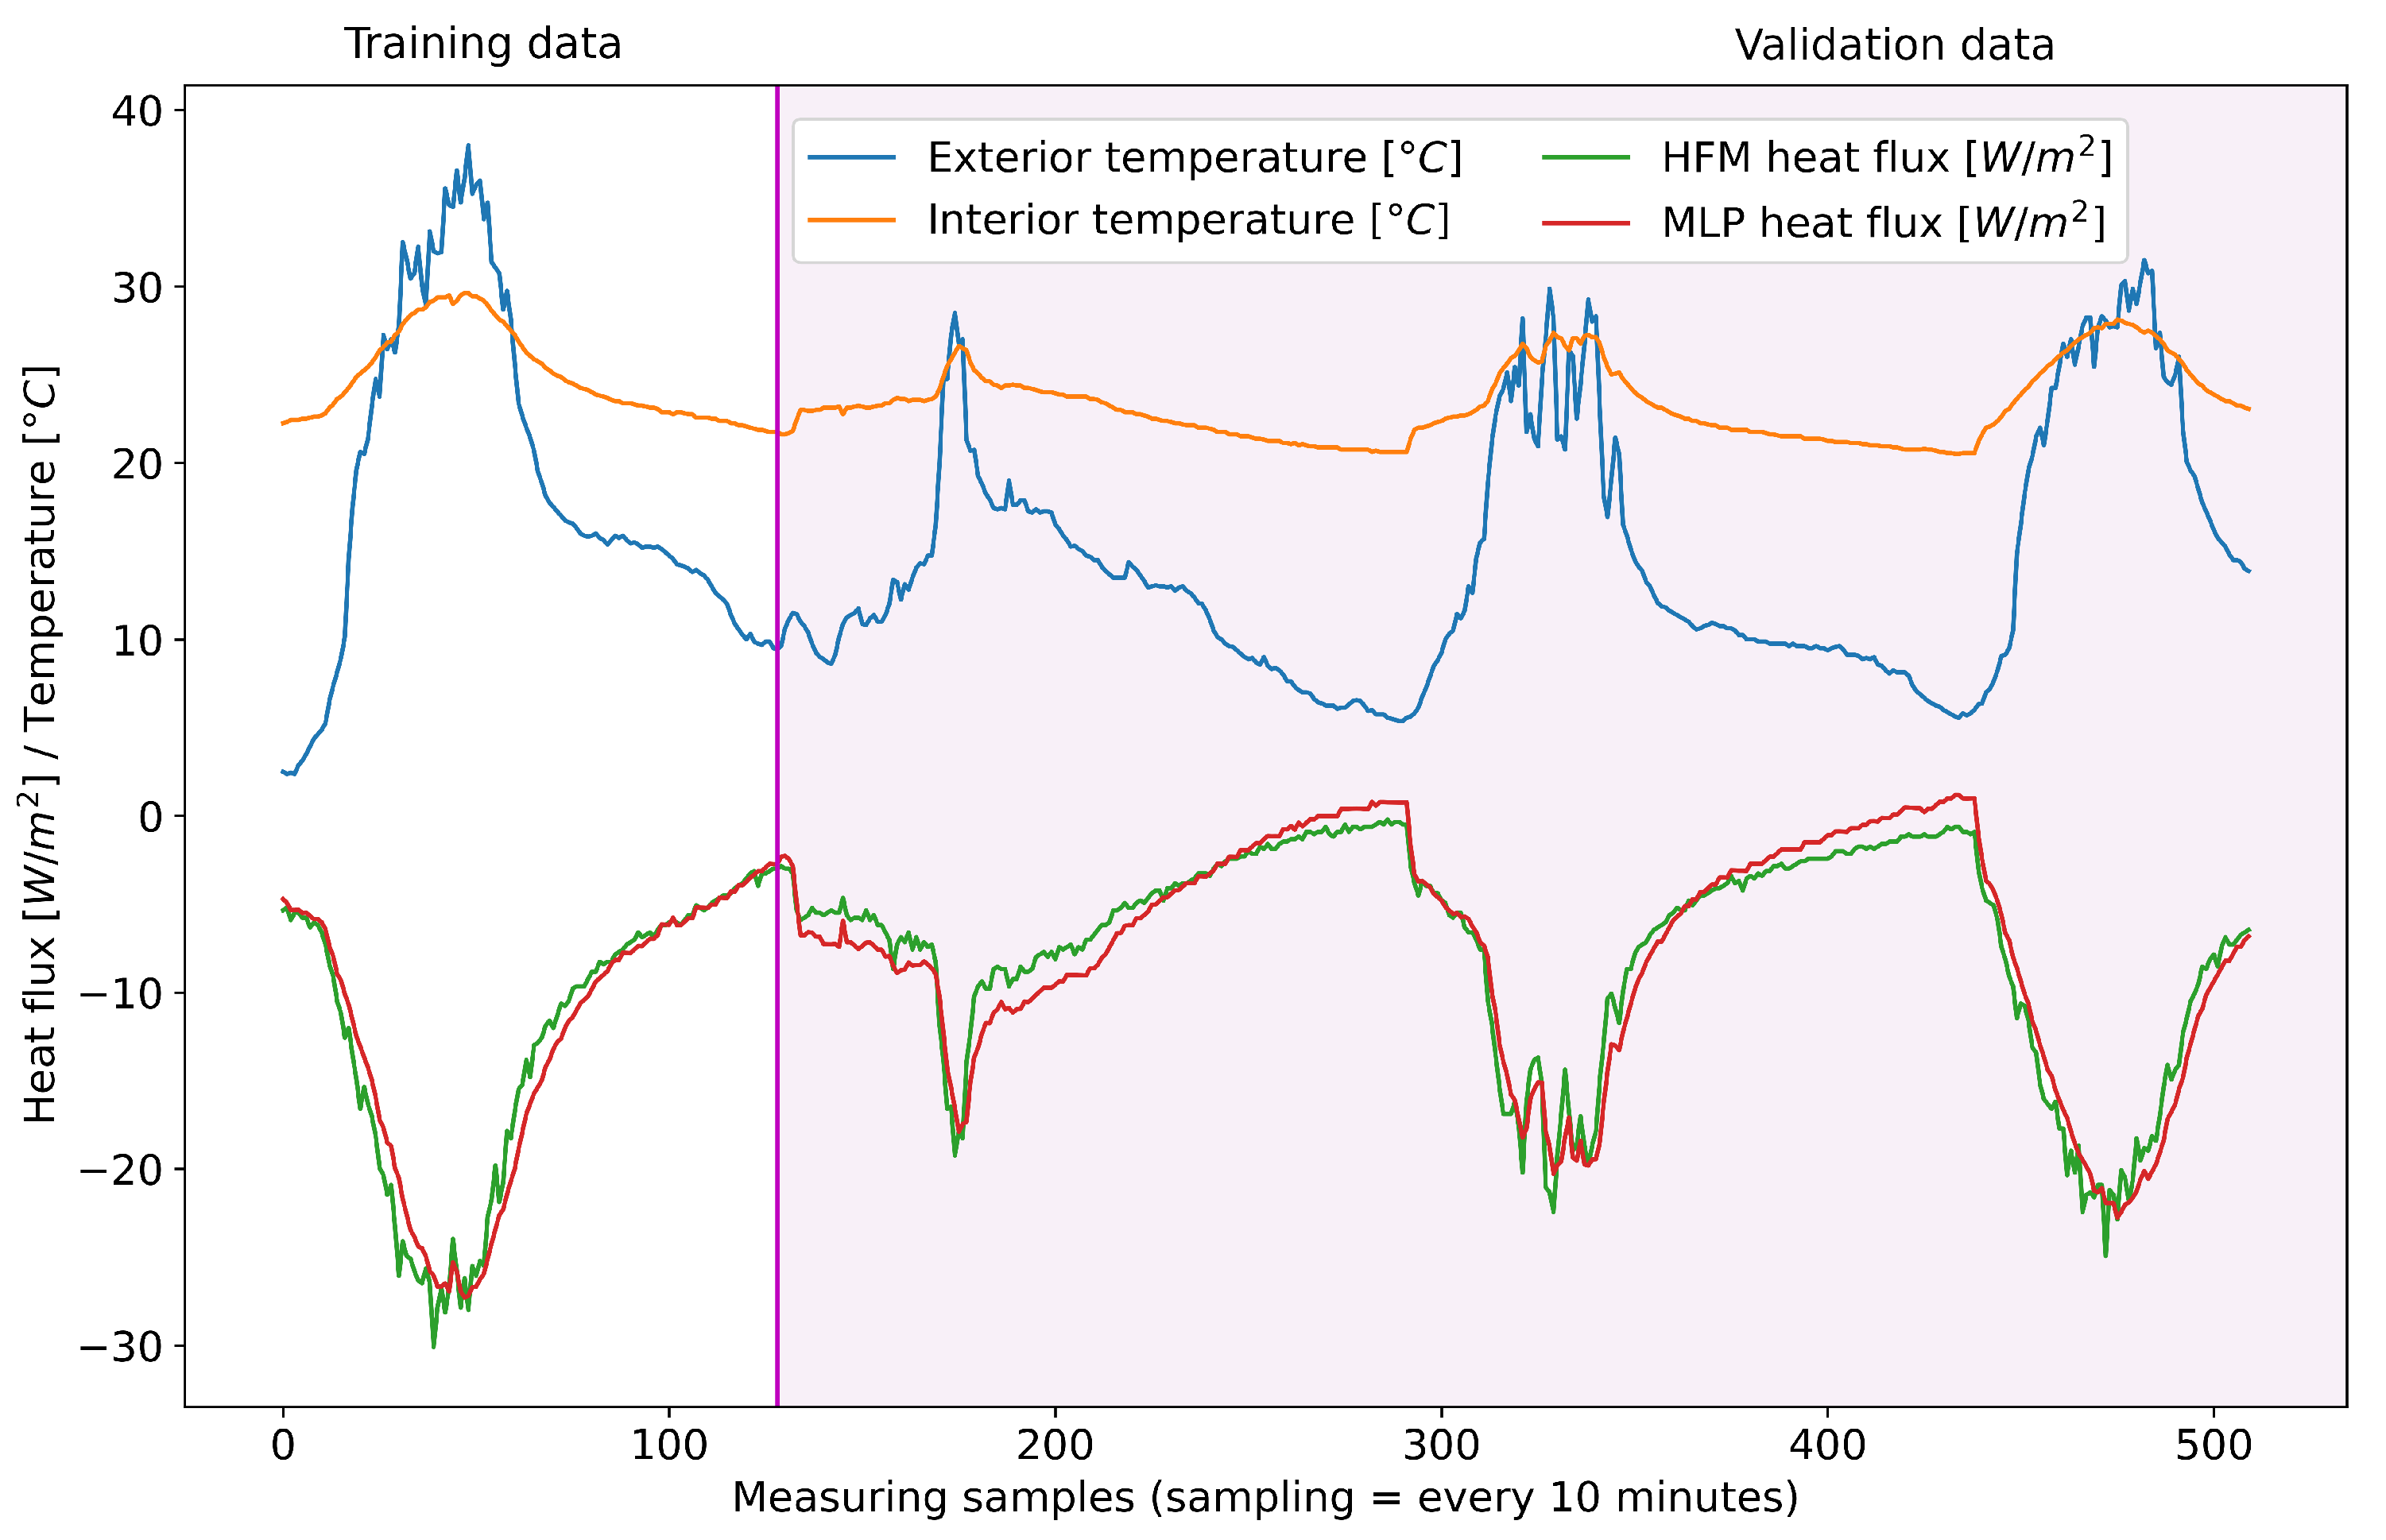
Figure 5.
Heat flux prediction based on ANN training on 1/2 of measurement data.
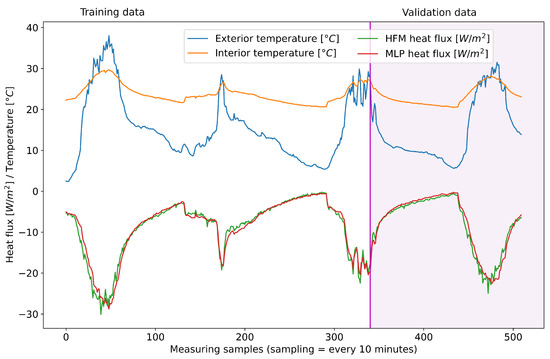
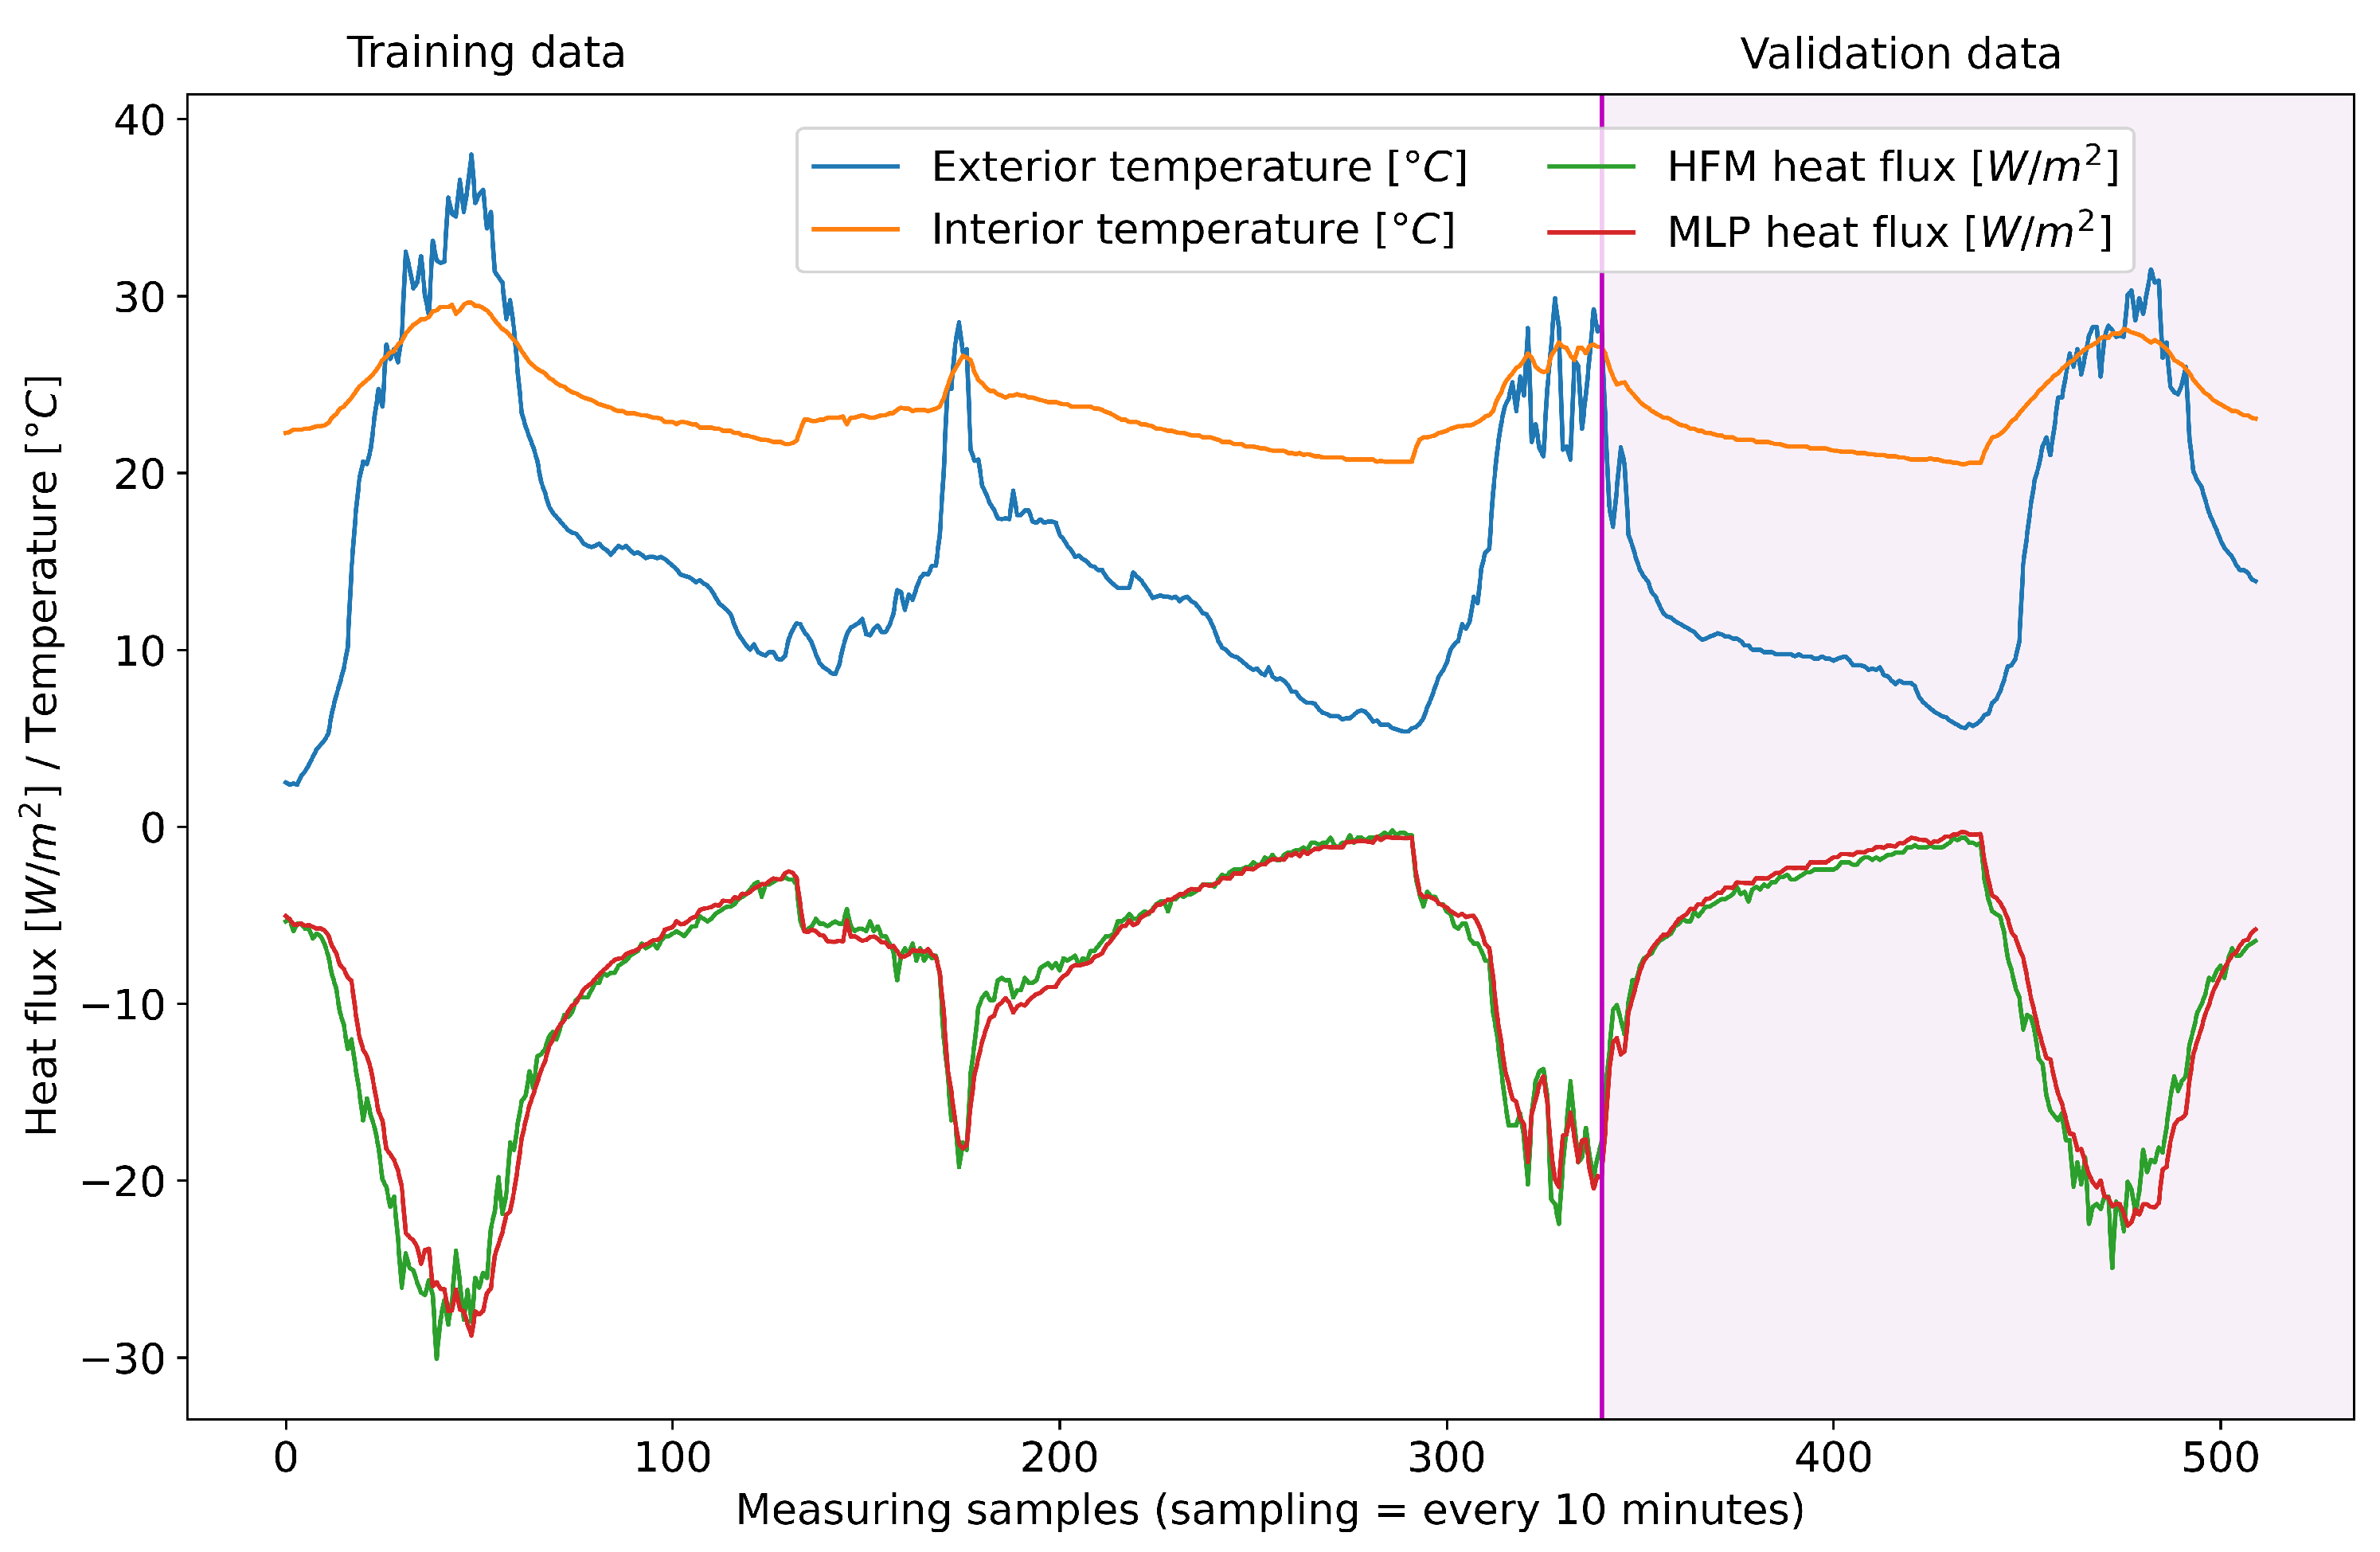
Figure 6.
Heat flux prediction based on ANN training on 2/3 of measurement data.
Table 2 shows that the best prediction is achieved for the ANN trained on 1/2 of the total data points with a relative difference between the measured U-value and the predicted U-value of 0.78%, with the RMSE, MSE and MAE: 1.195, 1.428 and 0.826, respectively. For the case where the ANN is trained on 2/3 of the total data points, it can be seen that a worse result is achieved in terms of U-value, even though the ANN model is trained on the larger amount of data points. For the case where the ANN is trained on 1/4 of the total data points, the worst prediction is achieved, but even in this case the prediction is remarkable considering that the ANN is trained only on 128 data points.
Table 2.
ANN prediction parameters and comparison of predicted and measured U-value.
4. Conclusions
This paper has shown promising results for the application of the MLP method on the heat flux rates measurement results in order to decrease the time needed to carry out the measurement when one heat flux sensor must be used. If the method shown in this paper is used on the collected dataset, then the procedure allows for the movement of the heat flux sensor to another measurement location, but only after satisfactory heat flux prediction is achieved. Because of that, two measurements can be carried out simultaneously. This research has focused only on one dataset; the analysis was done on a different number of training data points to show the feasibility of the MLP method. To analyze the method’s accuracy, potential risks, and advantages, more field and laboratory tests should be carried out. Furthermore, the definition of satisfactory level of prediction precision should be carried out in future research.
Author Contributions
S.G., B.M., M.G. and M.B. contributed equally. All authors have read and agreed to the published version of the manuscript.
Funding
This research received no external funding.
Acknowledgments
One of the authors (Sanjin Gumbarević) would like to acknowledge the Croatian Science Foundation and European Social Fund for the support under the project ESF DOK-01-2018.
Conflicts of Interest
The authors declare no conflict of interest.
References
- Building Performance Institute Europe. State of the Building Stock; Technical Report; Building Performance Institute Europe (BPIE): Brussles, Belgium, 2017. [Google Scholar]
- International Organization for Standardization. ISO 9869-1:2014. Thermal insulation — Building elements — In-Situ Measurement of Thermal Resistance and Thermal Transmittance — Part 1: Heat Flow Meter Method; International Organization for Standardization (ISO): Geneva, Switzerland, 2014. [Google Scholar]
- Gaši, M.; Milovanović, B.; Gumbarević, S. Heat flux results (d137b). ZENODO 2020. Published Data. [Google Scholar] [CrossRef]
- Gaši, M.; Milovanović, B.; Gumbarević, S. Comparison of Infrared Thermography and Heat Flux Method for Dynamic Thermal Transmittance Determination. Buildings 2019, 9, 132. [Google Scholar] [CrossRef]
- Gumbarević, S. MLP_ECSA7 — Code repository. 2020. Available online: https://github.com/sanjin94/MLP_ECSA7 (accessed on 22 October 2020.).
- Chollet, F.; Katariya, Y.; Rangaswamaiah, G.; Ghosh, S.; Benoy, K.; de Marmiesse, G.; Park, H.; Nandan, A.; Nain, A. K.; Paul, S.; et al. Keras. 2015. Available online: https://github.com/keras-team/keras (accessed on 22 October 2020.).
- Abadi, M.; Agarwal, A.; Barham, P.; Brevdo, E.; Chen, Z.; Citro, C.; Greg, S.; Corrado, G.S.; Davis, A.; Dean, J.; et al. TensorFlow: Large-Scale Machine Learning on Heterogeneous Distributed Systems. arXiv 2016, arXiv:1603.04467. [Google Scholar]
- Kingma, D.P.; Adam, J. Adam: A Method for Stochastic Optimization. arXiv 2014, arXiv:1412.6980. [Google Scholar]


Publisher’s Note: MDPI stays neutral with regard to jurisdictional claims in published maps and institutional affiliations. |
© 2020 by the authors. Licensee MDPI, Basel, Switzerland. This article is an open access article distributed under the terms and conditions of the Creative Commons Attribution (CC BY) license (https://creativecommons.org/licenses/by/4.0/).