Proceeding Paper

A Data Cleaning Approach for a Structural Health Monitoring System in a 75 MW Electric Arc Ferronickel Furnace †

by
Jaiber Camacho-Olarte
1,
Julián Esteban Salomón Torres
2,
Daniel A. Garavito Jimenez
2,
Jersson X. Leon Medina
3,
Ricardo C. Gomez Vargas
1,
Diego A. Velandia Cardenas
1,
Camilo Gutierrez-Osorio
2,
Bernardo Rueda
4,
Whilmar Vargas
4,
Diego Alexander Tibaduiza Burgos
1,*,
Cesar Augusto Pedraza Bonilla
2,
Jorge Sofrony Esmeral
3 and
Felipe Restrepo-Calle
2
1
Departamento de Ingeniería Eléctrica y Electrónica, Universidad Nacional de Colombia, Cra 45 No. 26-85, Universidad Nacional de Colombia, Cra 45 No. 26-85, Bogotá 111321, Colombia
2
Departamento de Ingeniería de Sistemas e Industrial, Universidad Nacional de Colombia, Cra 45 No. 26-85, Bogotá 111321, Colombia
3
Departamento de Ingeniería Mecánica y Mecatrónica, Universidad Nacional de Colombia, Cra 45 No. 26-85, Bogotá 111321, Colombia
4
Cerro Matoso S.A.Montelíbano, Cordoba, 234001, Colombia
*
Author to whom correspondence should be addressed.
Presented at the 7th International Electronic Conference on Sensors and Applications, 15–30 November 2020; Available online: https://ecsa-7.sciforum.net/.
Eng. Proc. 2020, 2(1), 21; https://doi.org/10.3390/ecsa-7-08245
Published: 14 November 2020
(This article belongs to the Proceedings of 7th International Electronic Conference on Sensors and Applications)

Abstract

:
Within a model of scientific and technical cooperation between the smelting company Cerro Matoso S.A. (CMSA) and the Universidad Nacional de Colombia (UNAL), a project was developed in order to take advantage of the data that were obtained from a sensor network in a ferronickel electric arc furnace at CMSA to improve the structural health monitoring process. Through this sensor network, online data are obtained on the temperature measurement along the refractory lining of the electric furnace, as well as heat fluxes and chemical characterization of the minerals on each stage of the process. These data are stored in a local database, which stores several years of historical data with valuable information for control and analysis purposes. These data reflect the behavior of the industrial process and can be used in the development of machine learning models to predict some of the electric arc furnace operation parameters, and thus improve the decision-making process. Currently, most of the data are analyzed by the experts of the structural control department, but, due to the large amount of data, the development of analytical tools is necessary to support their work. This paper proposes a data cleaning approach for improving data quality by creating a set of rules and filters based on both expert judgment and best practices in data quality. A statistical analysis was also carried out in order to detect variables with anomalies and outliers, which do not reflect real operation parameters and belong to anomalous data that should not be considered for modelling. With the proposed process, the quality of the data was improved and abnormal data were eliminated in order to consolidate a clean data set for later use in the development of machine learning models. This work contributes on understanding data cleansing rules that must be considered in order to reflect the real behavior of the electric furnace operation for further analysis and modeling tasks.

1. Introduction

Data cleaning (also known as data cleansing) is one of the main challenges in the area of data analysis, and failing to do so can result in inaccurate analyses and poor decision making. In recent years, there has been an increased interest from both industry and academia in data cleansing issues [1]. Data collected in systems for Structural Health Monitoring (SHM) in industry is not an exception. In a joint effort between the company Cerro Matoso S.A. (CMSA) and the Universidad Nacional de Colombia (UNAL), this paper reports the lessons learned from the process of cleaning historical data from the operation of a 75 MW ferronickel smelting electric arc furnace at CMSA. This process was carried out in order to improve the structural health monitoring process of the furnace.
As part of the ferronickel smelting monitoring and control process, CMSA has a sensor network that is designed to collect data from a distributed control system. These data are mainly used for monitoring the ferronickel production process, where the main component is the 75 MW electric arc furnace. Data are constantly stored to provide historical backup of the process. Besides using these data to monitor the furnace status, they can be used to develop data-based computational models while also using machine learning techniques, like predicting models for some variables to ease decision making during the operation, or creating an early alarm system in order to achieve a safer and more efficient operation, among others. Because the data required for the development of this type of computational models require high quality, it is necessary to carry out a data cleaning process, which aims to eliminate anomalies and outliers that do not reflect the reality of the process. This aspect is very important, because outliers can negatively influence the models results, misleading the decision making process [2]. According to Tang [3], 30% of a company’s data can be dirty. Therefore, it is necessary to perform systematic data cleaning processes to ensure the quality of the datasets.
Recent research proposes methodologies and workflows in order to clean and repair data sets based on different approaches, such as: statistical analysis [1], algorithms for time series [4,5], integrity constraints [6], neuronal networks [7], and machine learning models [8,9,10]. Furthermore, a data cleansing process does not only need sophisticated methods, but it also requires having a context and incorporating expert knowledge that generates rules that are focused on the nature of the data [11]. Experts can help to answer the three questions that were proposed by [1] to find errors in the data and possible outliers: what to detect, how to detect, and where to detect.
In this context, this paper presents a process for cleaning the historical dataset containing four years of electric arc furnace operation. The proposed workflow combines rules that are based on statistical methods with rules based on expert judgment. The entire process was carried out while using Python and its data management libraries, such as Pandas and Numpy. The initial dataset had 175,297 records of 1180 variables each, stored in a 2.38 GB CSV (Comma Separated Values) file. After the cleaning process, it was reduced to 841 variables and the same amount of records, which were stored in a 1.28 GB CSV file. This work contributes to facilitating data cleaning processes in this type of SHM systems in the industry.

2. Materials and Methods

Figure 1 shows a block diagram illustrating the stages of the ferronickel extraction process from the point of view of the data generated. After leaving the mine, the material is stored (first block on the left) and the chemical characteristics or the mineral are obtained, which is of great importance given that the behavior of the furnace varies with the ore’s chemical composition. The next stage is the initial drying of the material, and then it is passed through a calciner where the material’s temperature is raised up to approximately 700 ° C. There is a sensor network in the calciner for monitoring the temperatures. Data from the chemical composition of the calcine are obtained, as well as the amounts of material to feed the electric arc furnace. Afterwards comes the electric arc furnace stage, where a large number of variables are involved. Variables can be divided into input, operation, and output. The input variables include calcine chemical composition, calcine temperatures, water flows for cooling, and water temperatures. The operating variables of the furnace include power, voltages, currents, electrode impedance, and positioning. Finally, the output variables include metal and slag chemical composition and temperatures, refractory lining (furnace walls) temperatures, and water and heat flows of the furnace cooling system.

2.1. Dataset

Although the distributed control systems at CMSA stores hundreds of variables per minute, the time intervals that might represent significant changes in the state of the furnace, according to experts judgment, is 15 min. Therefore, we built a dataset of historical data with a 15-minute frequency. After consolidating several files, we built a dataset in a CSV file with 1180 variables and 175,297 rows. Its original size was 2.38 GB. It covers the historical data of 1180 variables (also known as TAGs) in a time window of four years, since the 30th September of 2015 to 30th September of 2019.
Through an exploratory data analysis, it was identified that some TAGs presented data quality problems. Some of the categorical variables had reports for failures in the data acquisition process, some others having lots of missing values most of the time, some numerical values were out of a reasonable boundary according to their type, among others.

2.2. Data Cleaning Process

In the initial dataset exploration, redundant information was found because several TAGs were duplicated. For this reason, a comparative analysis was carried out in order to determine whether it was the same information and proceed to eliminate duplicate variables. Additionally, to have a dataset whose values make sense, together with experts from the CMSA technical team, the furnace operating conditions were recognized and problems that may appear in the data were identified, generating, in this way, the following considerations for the data understanding:
  • When observing values outside the operational range, a general premise of data quality is determined, which establishes that those data should not be taken into account.
  • There is only one categorical variable, which represents the furnace’s operating mode: manual or automatic. Thus, the other variables must be numerical.
  • The existence of negative values in the temperature data should not be considered, since the ferronickel smelting process is carried out at high temperatures, and nowhere there are values below 0 ° C. Hence, a negative temperature can be seen as an instrumentation failure. Similarly, peaks of positive values that are above the normal operating range can also be considered in the same way (outliers) and should be discarded.
  • When sensors fail and provide erroneous data, false alarms occur for that reason. Hence, some variables have been manually manipulated within the data, remaining at a fixed value during some time, while the damaged sensor is repaired.
  • Due to the heat transfer process present in the furnace, especially in the refrigeration system, it is not possible to have large temperature variations in short periods of time. Therefore, data with high variability correspond to possible faults in the instrumentation, and they do not represent the real behavior of the furnace.
  • In order to know the normal behavior of the data, together with experts, time windows were defined where the furnace had a stable operation. This permitted us to select small subsets of data, where it was possible to extract the normal behaviour of the variables.
Taking this starting point, Figure 2 shows the proposed workflow for the data cleaning process. It includes tasks aimed at detecting data problems, cleaning, and also reducing the dataset size. The proposed workflow combines rules based on univariate statistical analyses with rules based on expert judgment. This approach, supported by the experts and their knowledge about the operation of the furnace, facilitated the understanding of unexpected observations to make decisions. The workflow can be explained as follows.
  • Remove duplicates: the first rule consists of removing duplicated variables (see Figure 3a).
  • Empty and null values: ehen a variable (TAG) presents more than 98% of missing values, it means that the data collected is from a short period of time compared to the total. Thus, these TAGs should be discarded (see Figure 3b).
  • Unique values:TAGs that remain at the same value throughout the time do not provide any useful information. Hence, all of the variables that present a single value in the 175,297 records should be eliminated (see Figure 3c).
  • Strings: given that there are non-numeric values in the dataset, all the strings found are extracted to identify with the experts their relevance. It is decided to encode them with numerical values and, in some cases, to remove them and reuse the Empty and null values rule (see Figure 3d).
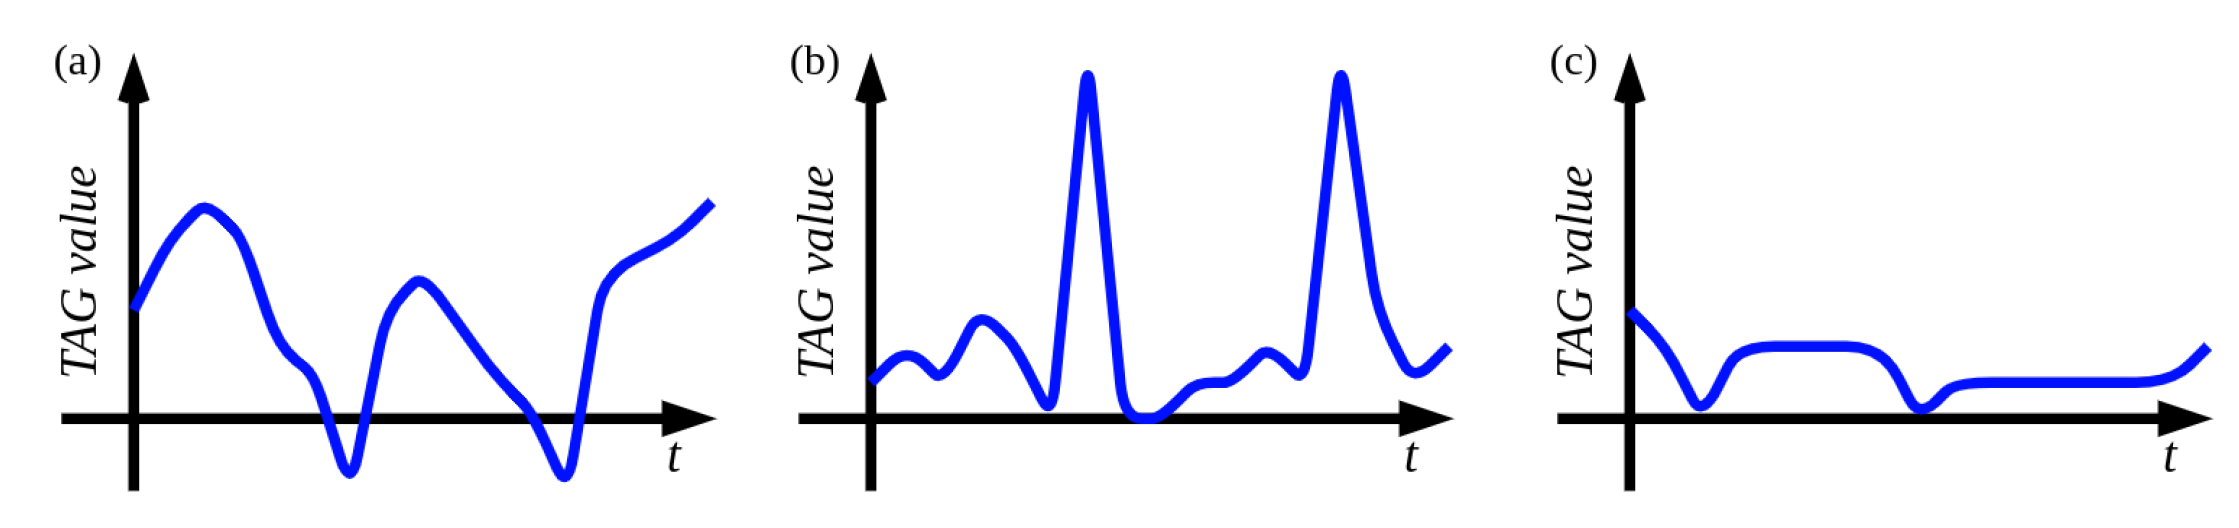
  • Negative temperatures: the normal operating ranges of temperatures in the furnace do not include values below zero and, for this reason, the TAGs that present this problem are removed (Figure 4a).
  • High variance: for extreme values occurring between normal operating values of the TAGs, it is applied a univariate rule for quality measurement, which is made based on percentage variations. The procedure to find these values is:
    (a)
    Calculation of percentage variations, as follows:
    Δ % = x t x t 1 x t 1
    where x t is the observation at an instant t and x t 1 is the previous one.
    (b)
    Calculation of interquartile ranges: I Q R = ( Q 3 Q 1 ) .
    (c)
    From the interquartile range, a factor of 5 × I Q R is defined as a threshold.
    (d)
    TAGs having more than 10% of data above the defined threshold are eliminated (Figure 4b).
  • Zero variance: through the percentage variations, it is also possible to identify those values that remain constant over time. This occurs when the percentage variation is zero. The criterion consists on removing the TAG if it has more than 50% of the data without variance (Figure 4c).
Finally, the dataset values were originally stored while using a precision of 64 bits. According to the experts, the sensors do not measure with that precision; therefore, it was reduced to a precision of 32 bits, without any loss and producing a smaller dataset in size.

3. Results and Discussion

The data cleaning process was carried out while using Python and its data management libraries (Pandas and Numpy). Results can be summarized, as follows:
  • Remove duplicates: 80 duplicated TAGs were identified and eliminated, reducing the total amount of TAGs to 1104: 945 with decimal numbers, six of integer data, and 153 with categorical values. Table 1 shows TAGs types and their corresponding variable counts.
  • Empty and null values: applying this rule, two TAGs were identified with more than 98% of the empty data, they were eliminated and a dataset with 1102 TAGs was obtained.
  • Unique values: using this rule, 60 TAGs were found, which were variables that remain unchanged over time and, for this reason, were eliminated, leaving a total of 1042 TAGs.
  • Strings: extracting all of the string data, 13 common strings were found. Most of them (11) were due to failures in the data acquisition. Thus, they were replaced by nulls. The remaining valid strings were found in only one TAG, representing the manual or automatic furnace operation. In this case, string modes were replaced by bool values “1” and “0”. After this, the rule Empty and null values was applied once again, resulting in another five TAGs being eliminated. Finally, a dataset with a total of 1037 TAGs was obtained, with a numeric dataset exclusively.
  • Negative temperatures: finding the temperatures that present negative values, 74 TAGs were eliminated, for which a characterization was also carried out to know their location in the furnace. As indicated in Table 2, upper zones of the furnace presented more erroneous values than the lower ones. A dataset with 963 TAGs was obtained after applying this rule.
  • High variance: identifying the variables that present abrupt changes in the data in at least 10%, 97 TAGs are identified and eliminated finishing with a dataset with 866 TAGs.
  • Zero variance: through the percentage variations, 22 TAGs are found, which remain at the same value for more than half of the time window. They were also removed.
After applying the cleaning proposed workflow, a dataset with 844 TAGs and a size of 1.8 GB was obtained. It only contains numerical data with a 64-bit precision. Finally, changing the precision to a 32-bit variable, the final dataset was stored in a 1.28 GB CSV file.

4. Conclusions

We presented a data cleaning approach for an 75 MW electric arc furnace getting rid of redundant information, irrelevant data and outliers, and lightening the dataset. The importance of expert judgment was evidenced to the decision making through the whole process. For the final dataset with 844 of the initial 1180 TAGs, it can be seen that approximately 28% of the information presents abnormalities; thus, it was very important to carry out the data cleaning process. This leads us to improving the quality of the data, thus making subsequent processes, such as modeling using machine learning techniques, feasible. Having an adequate representation in terms of the size of a variable saves storage space and allows better use of memory when data processing is carried out. For this particular case, a 29% reduction in the size of the final file was achieved, by changing the representation of variables from 64-bit to 32-bit. Involving CMSA experts in the data cleaning process allowed for the generation of a set of rules that lead to the detection of outliers and data that do not represent the furnace real behavior.

Funding

This work has been funded by the Colombian Ministry of Science through the grant number 786, “Convocatoria para el registro de proyectos que aspiran a obtener beneficios tributarios por inversión en CTeI”.

Conflicts of Interest

The authors declare no conflict of interest.

References

  1. Chu, X.; Ilyas, I.F.; Krishnan, S.; Wang, J. Data Cleaning: Overview and Emerging Challenges. In Proceedings of the 2016 International Conference on Management of Data (SIGMOD ’16), San Francisco, CA, USA, 26 June–1 July 2016; Association for Computing Machinery: New York, NY, USA, 2016; pp. 2201–2206. [Google Scholar] [CrossRef]
  2. Pearson, R.K. Data cleaning for dynamic modeling and control. In Proceedings of the 1999 European Control Conference (ECC), Karlsruhe, Germany, 31 August–3 September 1999; pp. 2584–2589. [Google Scholar] [CrossRef]
  3. Tang, N. Big RDF data cleaning. In Proceedings of the 2015 31st IEEE International Conference on Data Engineering Workshops, Seoul, Korea, 13–17 April 2015; pp. 77–79. [Google Scholar] [CrossRef]
  4. Wang, X.; Wang, C. Time Series Data Cleaning with Regular and Irregular Time Intervals. arXiv 2020, arXiv:2004.08284. [Google Scholar]
  5. Wang, X.; Wang, C. Time Series Data Cleaning: A Survey. IEEE Access 2020, 8, 1866–1881. [Google Scholar] [CrossRef]
  6. Hu, K.; Li, L.; Hu, C.; Xie, J.; Lu, Z. A dynamic path data cleaning algorithm based on constraints for RFID data cleaning. In Proceedings of the 2014 11th International Conference on Fuzzy Systems and Knowledge Discovery (FSKD), Xiamen, China, 19–21 August 2014; pp. 537–541. [Google Scholar] [CrossRef]
  7. Lin, J.; Sheng, G.; Yan, Y.; Zhang, Q.; Jiang, X. Online Monitoring Data Cleaning of Transformer Considering Time Series Correlation. In Proceedings of the 2018 IEEE/PES Transmission and Distribution Conference and Exposition (T&D), Denver, CO, USA, 16–19 April 2018; pp. 1–9. [Google Scholar] [CrossRef]
  8. Dai, J.; Song, H.; Sheng, G.; Jiang, X. Cleaning Method for Status Monitoring Data of Power Equipment Based on Stacked Denoising Autoencoders. IEEE Access 2017, 5, 22863–22870. [Google Scholar] [CrossRef]
  9. Ge, C.; Gao, Y.; Miao, X.; Yao, B.; Wang, H. A Hybrid Data Cleaning Framework Using Markov Logic Networks. IEEE Trans. Knowl. Data Eng. 2020. [Google Scholar] [CrossRef]
  10. Lv, Z.; Deng, W.; Zhang, Z.; Guo, N.; Yan, G. A Data Fusion and Data Cleaning System for Smart Grids Big Data. In Proceedings of the 2019 IEEE Intl Conf on Parallel & Distributed Processing with Applications (ISPA/BDCloud/SocialCom/SustainCom), Xiamen, China, 16–18 December 2019; pp. 802–807. [Google Scholar] [CrossRef]
  11. Alipour-Langouri, M.; Zheng, Z.; Chiang, F.; Golab, L.; Szlichta, J. Contextual Data Cleaning. In Proceedings of the IEEE 34th Int Conf Data Engineering Workshops (ICDEW), Paris, France, 16–20 April 2018; pp. 21–24. [Google Scholar] [CrossRef]
Figure 1. Processes in the ferronickel refinery at Cerro Matoso S.A. (CMSA) from the data perspective.
Engproc 02 00021 g001
Figure 2. Data cleansing process workflow.
Engproc 02 00021 g002
Figure 3. Data cleansing process rules: (a) refers to Remove duplicates, (b) empty and null values rules, (c) unique values, and (b) Strings rules.
Engproc 02 00021 g003
Figure 4. Data cleansing process rules: (a) refers to negative temperature cases, (b) TAGs with high variance, and (c) TAGs that remain in same value for long time periods.
Engproc 02 00021 g004
Table 1. Types and quantity of TAGs.
Tag TypeFrequencyTag TypeFrequency
Temperature801Voltage6
Heat flux220Position6
Concentration61Impedance4
Weight43Pressure3
Power11Flow3
Current11Vibration2
Operation9
Table 2. Removed temperature TAGs.
LocationInitial TAGsRemoved TAGs
Refractory lining 118015
Refractory lining 214418
Bottom lining261
Inferior sidewall83
Superior sidewall167
Refractory roof3030
Publisher’s Note: MDPI stays neutral with regard to jurisdictional claims in published maps and institutional affiliations.

