Abstract
Coarse Grain Spectral Analysis (CGSA) can explain the possible multiscaling nature of the thousands of low-amplitude peaks observed in the power spectra of some pulsating stars. Space-based observations allowed for the scientific community to find this kind of structure thanks to their long-duration, high-photometric precision and duty cycle compared to observations from the ground. Although these time series are far from perfect (outliers, trends, gaps, etc.), we used our own data preprocessing method, known as the 2K+1 stage interpolation method, to improve the background noise up to a factor 14, avoiding spurious effects. We applied both techniques, the 2K+1 stage method and the CGSA analysis, to shed some light on a real problem regarding stellar seismology: finding the physical nature of the low-amplitude signature for multiperiodic stellar pulsators.
1. Introduction: Harmonic or Fractal Time Series?
The observed flux in a classical multiperiodic pulsating star time series can be considered as the contribution of several harmonic terms i,
characterized by their frequency , amplitude , and phase ; and noise (N). Once space-based telescopes allowed for long-duration, high-precision and duty-cycle time series to be obtained, the number of detected low-amplitude harmonics explosively increased [1]. The debate of their nature not only includes a physical origin but also a cascade error due to a flawed analysis [2]. One of these cases may be the presence of a self-affine signal, ,
where is the scale factor, and H is the so-called Hausdorff exponent, characterizing long-term correlations and the type of self-affinity in a time series. This term has to be taken as a statistical meaning, so that the scaling relationship holds when one performs appropriate measures on mean values over pairs of points at the same distance or over equal-length subseries or windows. It also includes white noise.
Using the Coarse Grain Spectral Analysis (CGSA), we can separate the harmonic from the fractal contribution and calculate their percentage on the time series [3]. Nevertheless, a constant cadence is required, without gaps, which cannot be achieved in real, raw observations.
2. Methodology: Fractal Analysis of a Gaped Time Series
To study their power spectra, we subtracted the pulsations with an improved method based on iterative sine wave fitting [4] called the 2K+1 stage method [5,6]. We used the subtracted signal,
where is the root mean square of the residuals to stop the iterative process and finish each stage [5]. This alarm avoids a cascade error since its value should always be positive. The first 2K interpolation stages filled the gaps with the information subtracted for the previous stage, but started the frequency analysis from the beginning, avoiding spurious peaks due to minimum differences (see Figure 1). The last stage considers all datapoints for the frequency analysis. Three stages allow an improvement up to a factor 14 of the background noise for real, high-duty-cycle light curves (≈0.9) [7]. More stages are needed for lower cases. Figure 1 shows the improvement in the detection of simulated time series with ≈1400 typical oscillations with different expected duty cycles.

Figure 1.
Number of detected peaks at each stage for our interpolation method. Each line is a simulated time series with ≈1400 typical oscillations from high (0.95, red) to low (0.68, purple) duty cycles. From [6].
At the final stage, we were able to properly study a higher number of lower-amplitude harmonics with lower . The CGSA should increase if we subtracted a legitimate harmonic [8]. However, this should decrease if we found a fractal contribution, since a new sinusoid would be added instead of subtracted.
We calculated the CGSA after the subtraction of all peaks with consecutive lower level to observe if the contribution of the remaining is harmonic, especially for the lowest (), which corresponds to the low-amplitude signature for this kind of pulsating star [9].
3. Results: Applying the Method to a Real Pulsating Star
We analysed a real star observed with the TESS space telescope for approximately one year (see Figure 2). Around 65% of the remaining signal becomes fractal before low-amplitude peaks are subtracted. Nevertheless, the CGSA does not decrease for those low-amplitude subtracted signal. Therefore, no fractal signature is detected down to noise. Repeating this analysis for more multiperiodic stars observed by TESS will allow for us to characterize these variations and ascertain their nature [6].
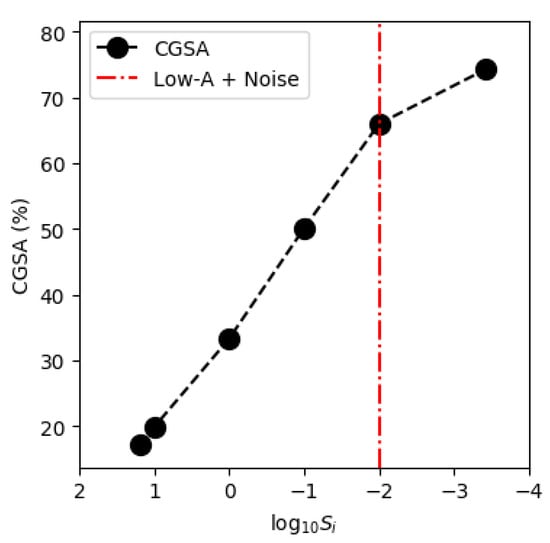
Figure 2.
CGSA for the remaining signature after subtracting all peaks with signals higher than (black). The red dashed–dotted line points to the remaining signature of low-amplitude peaks and noise after removing intermediate-amplitude variations.
Author Contributions
Conceptualization, S.B.F., J.P.-G., J.C.S.; methodology, S.B.F., J.P.-G.; investigation, all authors; original draft preparation, S.B.F.; review and editing, all authors. All authors have read and agreed to the published version of the manuscript.
Funding
S.B.F. and J.C.S. received financial support from the Spanish State Research Agency (AEI) Projects No. PID2019-107061GB-C64: “Contribution of the UGR to the PLATO2.0 space mission. Phases C/D-1”. J.P.-G. and M.L.-M. acknowledge funding support from Spanish public funds for research under project ESP2017-87676-C5-5-R. A.G.H. acknowledges funding support from ‘European Regional Development Fund/Junta de Andalucía-Consejería de Economía y Conocimiento’ under project E-FQM-041-UGR18 by Universidad de Granada.
Acknowledgments
The authors wish to thank TESS team whose efforts made these results possible. Funding for the TESS mission is provided by the NASA Explorer Program. S.B.F. also thanks the resources received from the PLATO project collaboration with Centro de Astrobiología (PID2019-107061GB-C61). J.P.-G. and M.L.-M. acknowledge financial support from the State Agency for Research of the Spanish MCIU through the “Center of Excellence Severo Ochoa” award to the Instituto de Astrofísica de Andalucía (SEV-2017-0709).
Conflicts of Interest
The authors declare no conflict of interest.
Abbreviations
The following abbreviations are used in this manuscript:
| CGSA | Coarse Grain Spectral Analysis |
| TESS | Transiting Exoplanet Survey Satellite |
References
- Poretti, E.; Michel, E.; Garrido, R.; Lefèvre, L.; Mantegazza, L.; Rainer, M.; Rodríguez, E.; Uytterhoeven, K.; Amado, P.J.; Martín-Ruiz, S.; et al. HD 50844: A new look at δ Scuti stars from CoRoT space photometry. Astron. Astrophys. 2009, 506, 85–93. [Google Scholar] [CrossRef]
- Pascual-Granado, J.; Garrido, R.; Suárez, J.C. Limits in the application of harmonic analysis to pulsating stars. Astron. Astrophys. 2015, 581, A89. [Google Scholar] [CrossRef]
- Yamamoto, Y.; Hughson, R.L. Extracting fractal components from time series. Phys. D Nonlinear Phenom. 1993, 68, 250. [Google Scholar] [CrossRef]
- Ponman, T. The analysis of periodicities in irregularly sampled data. Mon. Not. R. Astron. Soc. 1981, 196, 583–596. [Google Scholar] [CrossRef]
- Barceló Forteza, S.; Michel, E.; Roca Cortés, T.; García, R.A. Evidence of amplitude modulation due to resonant mode coupling in the δ Scuti star KIC 5892969. Astron. Astrophys. 2015, 579, A133. [Google Scholar] [CrossRef]
- Barceló Forteza, S.; Pascual-Granado, J.; Suárez, J.C.; García Hernández, A.; Lares-Martiz, M. Unveiling rotation through fractal analysis of the grass for delta Scuti stars. 2022; in preparation. [Google Scholar]
- Barceló Forteza, S.; Moya, A.; Barrado, D.; Solano, E.; Martín-Ruiz, S.; Suárez, J.C.; García Hernández, A. Unveiling the power spectra of δ Scuti stars with TESS. The temperature, gravity, and frequency scaling relation. Astron. Astrophys. 2020, 638, A59. [Google Scholar] [CrossRef]
- de Franciscis, S.; Pascual-Granado, J.; Suárez, J.C.; Hernández, A.G.; Garrido, R.; Lares-Martiz, M.; Rodón, J.R. A fractal analysis application of the pre-whitening technique to δ Scuti stars time series. Mon. Not. R. Astron. Soc. 2019, 487, 4457–4463. [Google Scholar] [CrossRef]
- Barceló Forteza, S.; Roca Cortés, T.; García Hernández, A.; García, R.A. Evidence of chaotic modes in the analysis of four δ Scuti stars. Astron. Astrophys. 2017, 601, A57. [Google Scholar] [CrossRef]


Publisher’s Note: MDPI stays neutral with regard to jurisdictional claims in published maps and institutional affiliations. |
© 2022 by the authors. Licensee MDPI, Basel, Switzerland. This article is an open access article distributed under the terms and conditions of the Creative Commons Attribution (CC BY) license (https://creativecommons.org/licenses/by/4.0/).