1. Introduction
The abrupt changes in the weather conditions and climate change are inducing more and more flash floods, which are sudden increments in the water level in a basin due to a sudden change in the weather conditions, among other variables, such as soil conditions. A great effort in the risk assessment has been performed, aiming to evaluate the risk of flooding for certain scenarios in different basins. The risk assessment identifies those areas of a basin that are susceptible to flooding to define efficient management policies [
1,
2], to design a new infrastructure that avoids the flooding [
3] or to design complementary infrastructures to mitigate the effects of these flash floods [
4].
Nevertheless, the early and online detection of flash floods has not yet gathered the focus of the research community [
5]. Such a tool would allow public safety experts to make decisions in advance in the event of a flash flood, reducing as much as possible its consequences. Solving this latter application, that is, aiding the public safety experts in the flash flood detection, needs the use of data not only from the basin’s geomorphological and hydrological information, but also information concerning the current scenario—for example, the water level of the rivers at certain points, the amount of rain in the last relevant period—together with weather forecast information.
In this research, a prototype for the online detection of flash floods is proposed. To do so, information from the sensory systems deployed on the basin is queried, as well as the weather forecast system, to obtain a clear picture of the basin’s current state. These time series are used to estimate the height of water at any point in the basin. The water’s height can be superimposed on a map, providing information about what geographical points in the basin are in danger of a sudden flood.
Features are extracted from the above-mentioned time series, and case-based reasoning (CBR), such as the intelligent paradigm, finds similarities among the retrieved and selected cases from the case base. The outcome of the CBR is the above-mentioned map containing the height of the water for every single point in the basin. Together with a web application, a novel online flash flood tool can guide public safety teams in their decision-making.
The structure of this research is as follows.
Section 2 discusses the related work section concerning flash flood risk assessment.
Section 3 describes the prototype that has been developed.
Section 4 shows the results obtained for a real basin in Spain. Finally, the conclusions from this research are drawn.
2. Related Work
Risk assessment aims to identify basin’s susceptible to flooding areas; it is a widely used term in the flood detection literature. A risk assessment measurement uses, among other possibilities, Machine Learning (ML) and artificial intelligence methods and techniques; however, the majority of the research proposed off-line numerical approaches [
6]; the off-line characteristics come from the computation requirements for the simulations.
When talking about ML, either unsupervised and supervised learning have been applied. With respect to unsupervised learning, the main developed idea is to design or select a set of risk indexes or features by means of clustering the instances from the available GIS (Global Information System) points—which introduces a risk label per group—then, the risk label of the most suitable group labels every new GIS point instance. For example, the study in [
7] proposes merging the improved analytic hierarchy process, which hybridizes the iterative self-organizing data analysis and the Maximum Likelihood (ISO-Maximum) clustering algorithm. With these methods, a risk index that reflects its geomorphical and geographical characteristic labels every possible position.
Moreover, supervised learning methods, such as decision trees or support vector machines, have also been used for risk assessment. In [
8], flood susceptibility mapping of GIS points in the Kelantan basin (Malaysia) was addressed using rule-based decision trees and the combination of frequency ration and logistic regression statistical methods. Up to 10 features called conditional factors were calculated in the first stage devoted to feature selection from GIS and remote sensing data. Afterwards, ML and the statistical methods computed a risk value for each position in a basin map. This scheme has been also used in different studies, such as in [
9], where random forest and boosted regression trees were compared.
Neural networks have also been reported for risk assessment [
10,
11]. As before, a set of features were extracted from GIS positions to train and test the neural model. Each GIS position is evaluated when deploying the model, computing the corresponding set of features and calculating the risk assessment using the trained neural model for the basin. Support vector machines were proposed instead of neural networks using a rather similar procedure reported in [
12].
Furthermore, the study in [
13] used multicriteria decision making in the evaluation of the risk assessment. This research proposed analytical hierarchy process to generate the decision-making process and assign a risk label to each GIS position. A similar study was reported in [
14] for the assessment in the Mashhad Plain basin, Iran.
Additionally, the Dempster–Shafer-based evidential belief function has been proposed for the assessment and spatial prediction of flood-susceptible areas [
15]. A set of features is extracted from each GIS location and these features are used as inputs to the Dempster–Shafer method. Interestingly, this probabilistic-based reasoning method overtook other methods used in the literature, such as logistic regression and frequency ratio. A similar conclusion is presented in [
9], where a comparison between the Dempster–Shafer of two different decision trees was performed- In this latter case, the features and the method varies from the former studio, but the conclusions are similar.
These studies show that perhaps ML is not the most interesting technique for this type of problem because of the difficulties to obtain enough valid and representative data from all the basin, so training the model could lead to generalized models. Furthermore, the evidence that the Dempster–Shafer theory could compete with the ML methods suggests that what is needed is an artificial intelligence technique that can represent the knowledge from the experts, extrapolating this knowledge to the different positions in the basin.
It is worth recalling that all of these approaches are focused on off-line risk assessment. Nonetheless, if we also consider the case of on-line information, not only GIS information is needed but also the sensory data and the weather forecasts could be needed in order to assess a certain scenario. With all these premises, this research proposes to use an alternative that has never been used in this context.
3. A Flash Flood Detection System: Using CBR as Reasoning Paradigm
The main idea is to develop a web application to assist public safety experts in their decision-making process. This web application requests basic information about the corresponding basin; then, it queries a CBR web service for a sequence of maps representing the mm of water in the area, with one map per prediction horizon. The CBR, on the other hand, performs the first three stages in this type of system (retrieve, recall, and reuse) to merge the maps from the most relevant cases considering a similarity measurement between the stored cases and the current scenario or status of the basin. For the purpose of this research, the retain stage will not be implemented as is explained when discussing the case representation.
This study analyses the behavior of hydrological basins, each basin including one or more locations where the prediction would be requested. A requested prediction would predict the state of the basin (in millimeters of water level) for up to six prediction horizons. A prediction horizon is a time step that is a function of the dynamics of the concrete basin; for instance, for some quick response basins, this time could be in minutes, while for more steady basins, this period could be 1 hour.
The following subsections provide details on the different parts of the system.
Section 3.1 deals with the web interface;
Section 3.2 explain how a case, representing a basin state, is stored. Finally, the different CBR stages are detailed in
Section 3.3.
3.1. Exploiting the CBR Tool
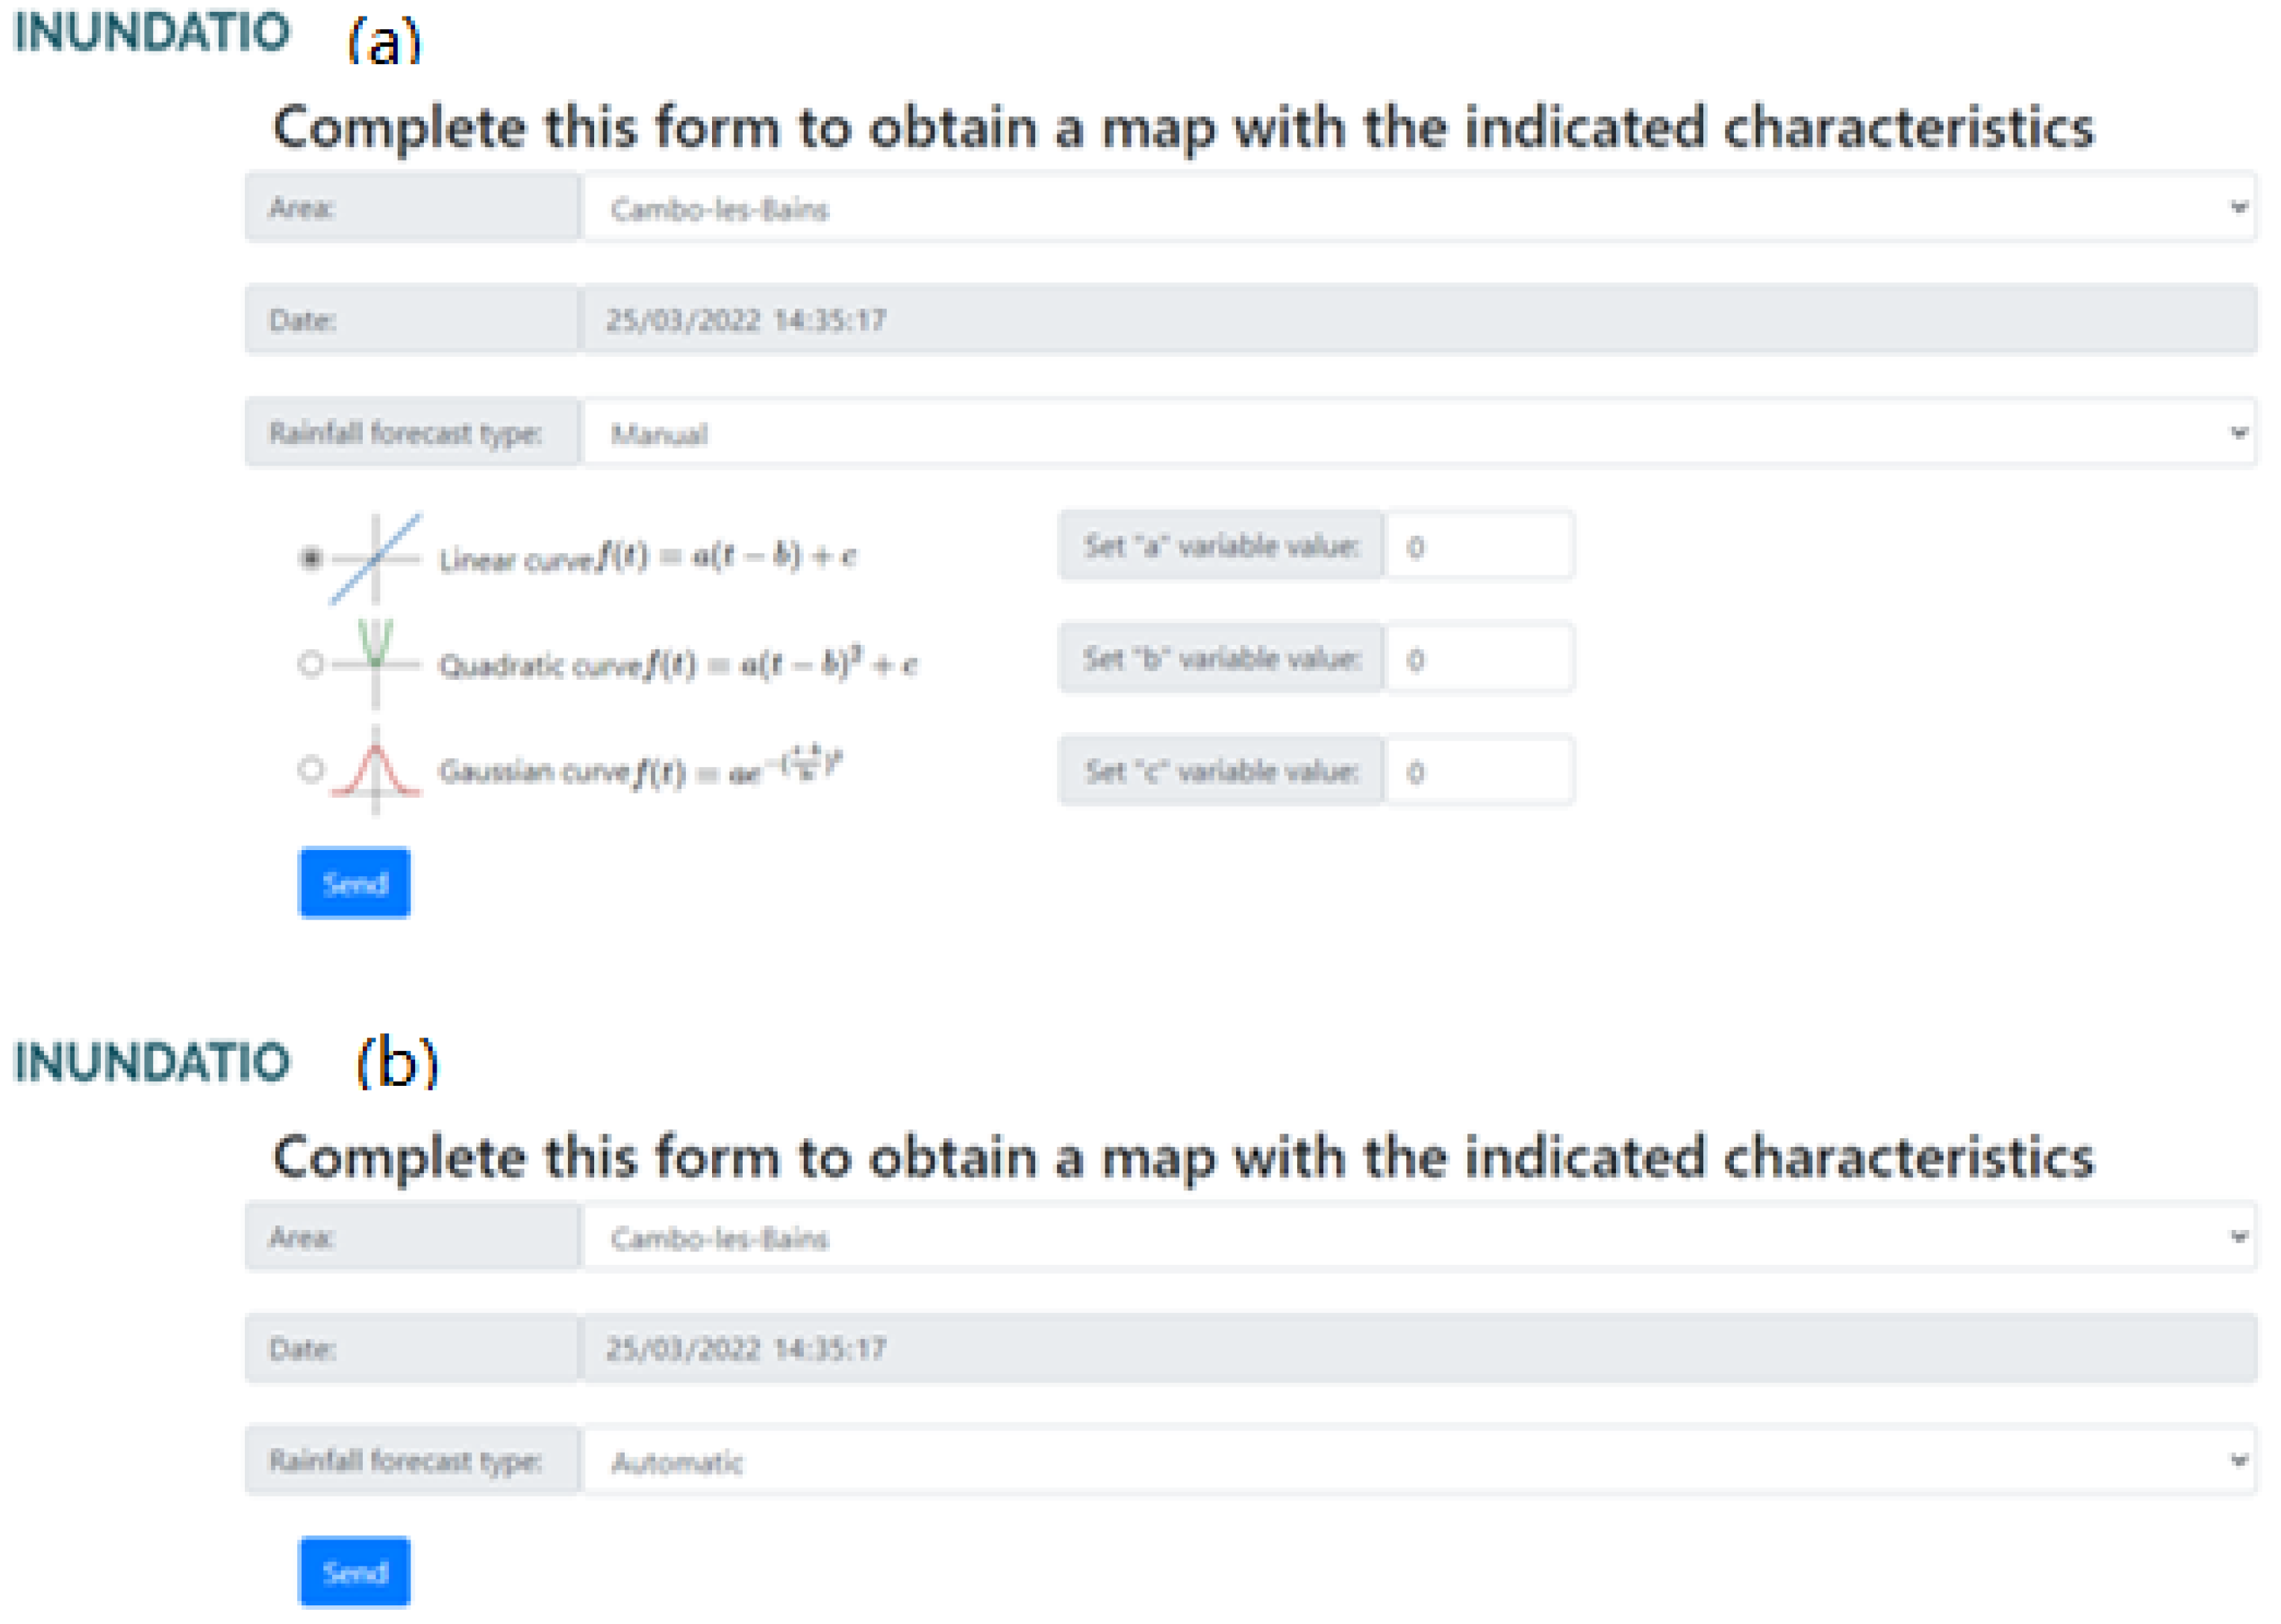
Figure 1 shows the interface of the web application that has been developed for the INUNDATIO project; this interface is where the expert interacts with the system. Firstly, the user must introduce the basin and location, then the weather forecast. Then, by clicking on the button, the CBR service is requested and a sequence of maps will be delivered and shown. The tool visualizes the map of the mm of water as a layer on top of an open-layers map from the corresponding basin.
There are two main options in this interface: automatic weather forecast—requesting the values to the designated forecast service—and manual forecasting. In this latter case, the user chooses between a linear, a quadratic, or Gaussian forecast by setting the function’s parameters. This realistic forecast allows for evaluating the basin behavior in case of extreme events.
3.2. Case Representation of the Basin State
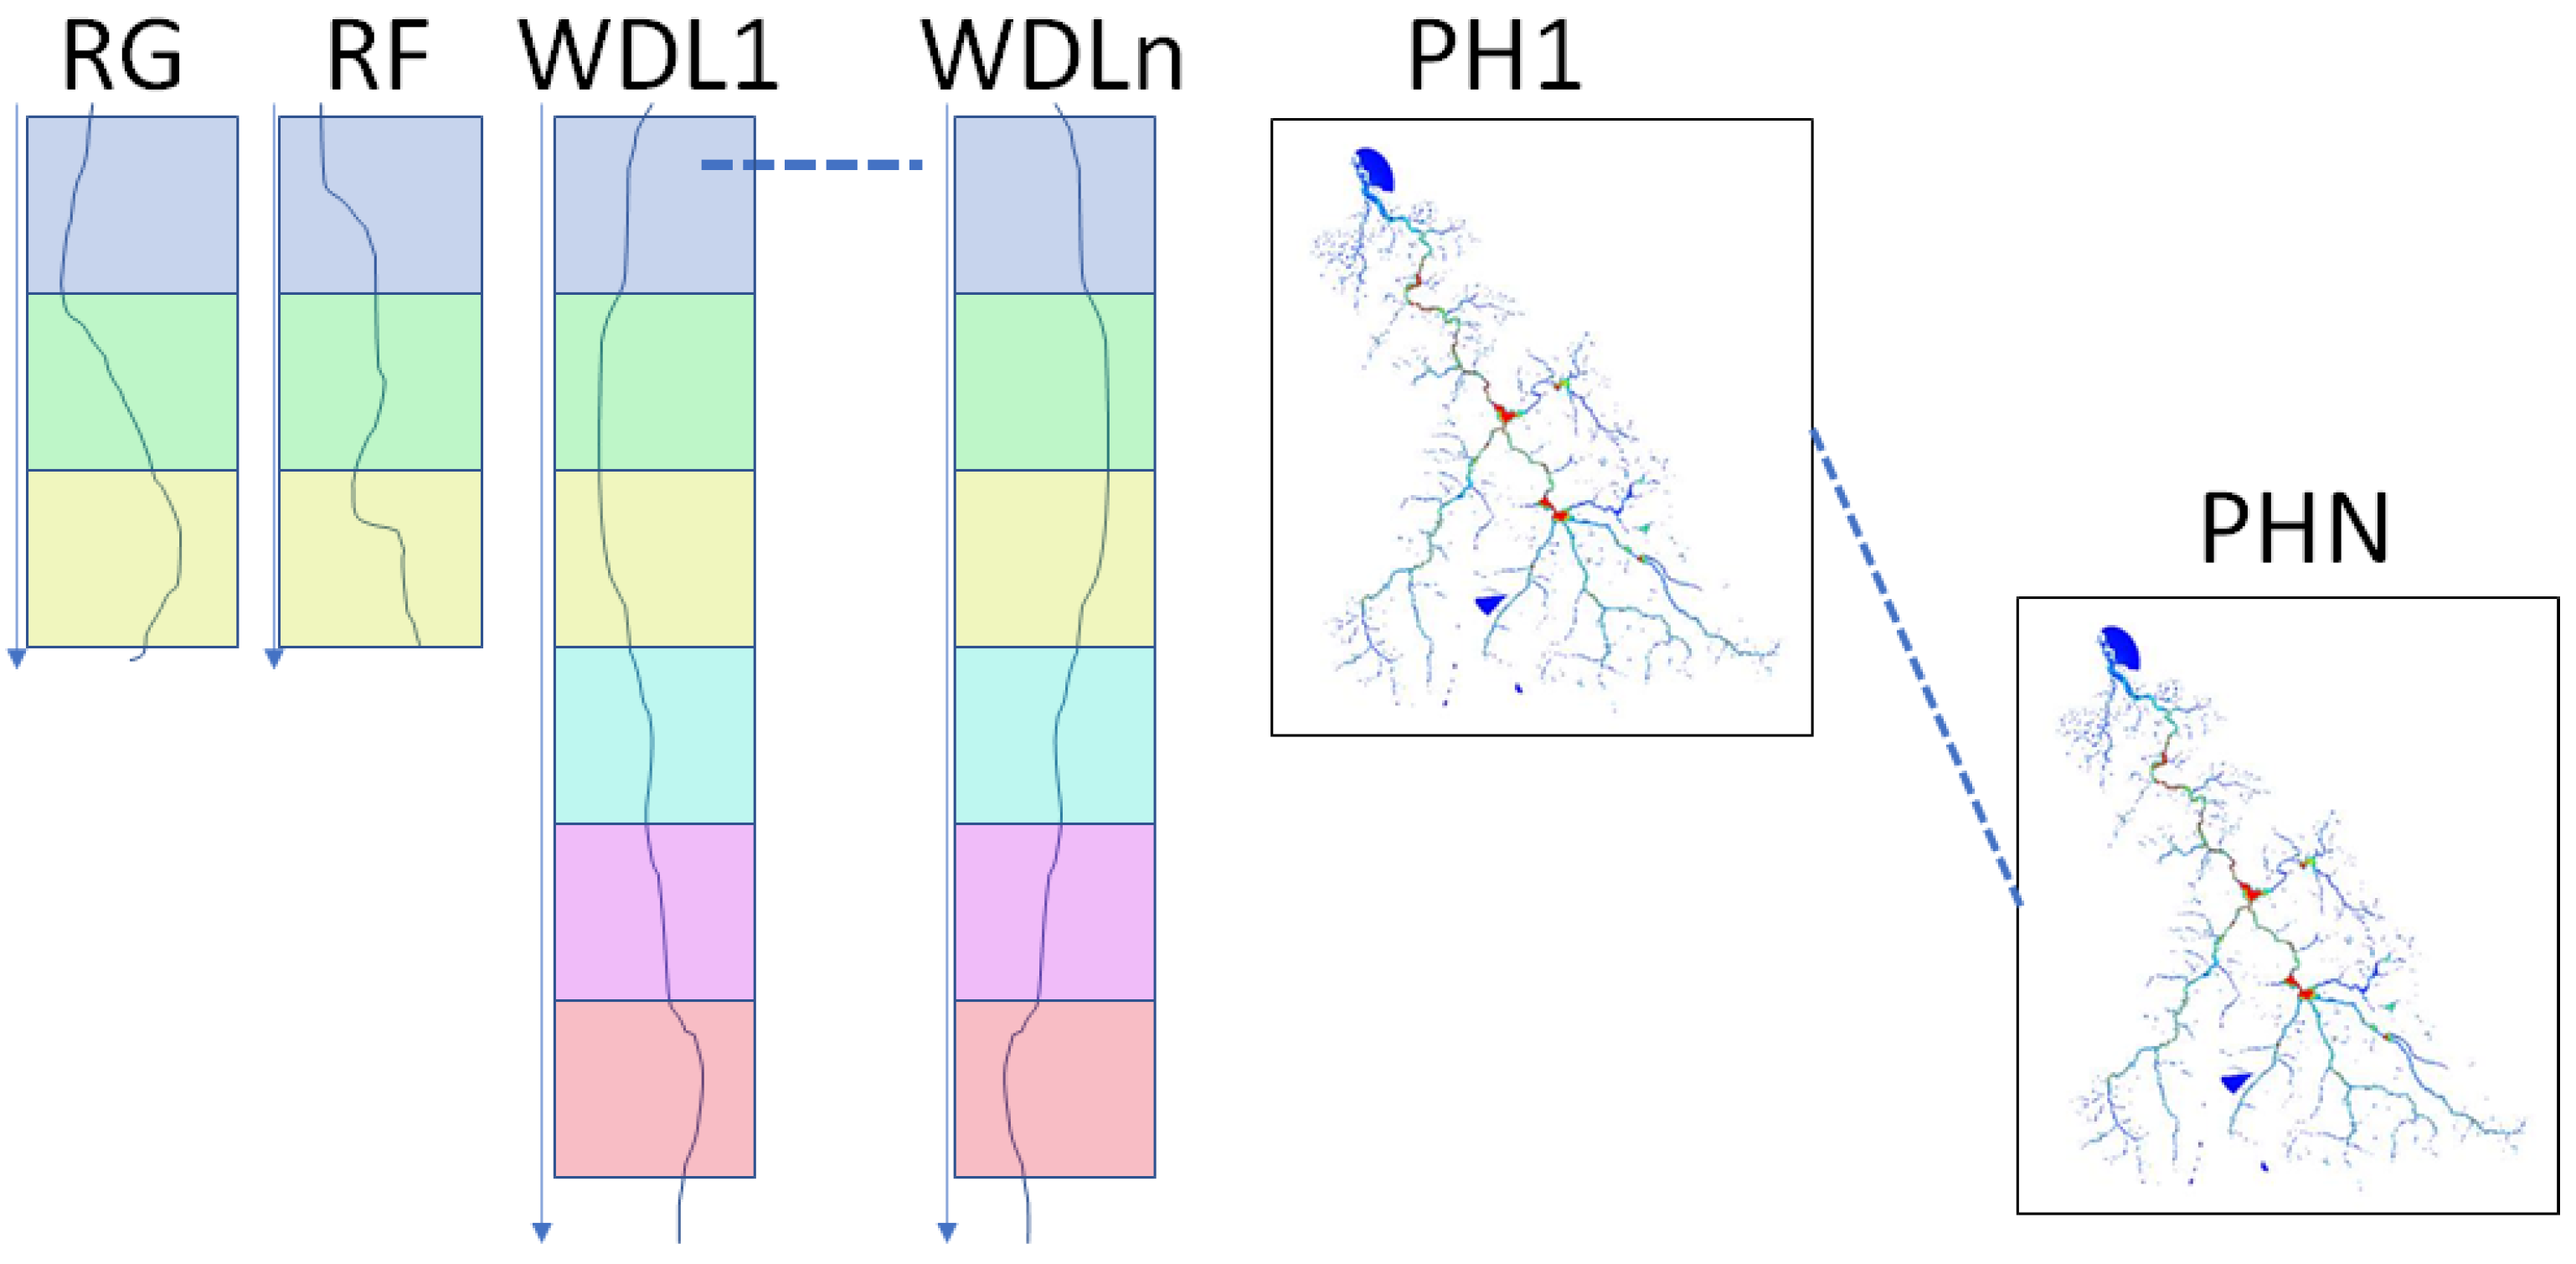
As mentioned before, a case in the case base represents the state of a certain basin. The state of the basin is defined by a set of variables; each of them is a time series. According to the hydrodynamic experts, these time series can be represented using a window of values; the length of each window varies with the variable and the specific basin as a function of its dynamics: faster basins require smaller windows and vice versa. Moreover, each window is split into intervals, and the average of the values of the variable is computed for each interval. Then, each time series is represented as a sequence of aggregated values.
Furthermore, each basin includes information such as its list of deployed sensors and sensor types, and whether the values from a sensor type should be aggregated or not. For instance, the Rain Gauges (RG) are usually aggregated among all the rain gauges in the basin, whereas the Water Discharge Levels (WDL) are usually considered individually.
Figure 2 shows the variables and the number of intervals that are considered in this study. Additionally, each case also stores maps of the basin with the millimeters of water at any point for a set of prediction horizons, as also shown in the Figure.
It is worth mentioning that these maps and information are gathered from the results of the simulations of the basin using the hydrological models. For sure, there are well-defined hydrological models of the basins; however, running a simulation takes too much time and the outcomes are not expected to be available in such a small period of time to be useful for an online request from public safety experts. Hence, that is the reason why the whole CBR is designed: mimicking the performance of the hydrological models for the prediction of a basin’s behavior.
3.3. CBR Stages
A case includes maps with the mm of water for each prediction horizon. This means that, in the case of requiring the CBR to retain cases, these flood maps must be gathered for each prediction horizon so the CBR system could store them within the case. Nevertheless, this information is not available for the system: there is no method to recollect the mm of water for each point in a basin; therefore, the retain phase of the CBR can not be completed and the CBR would only rely on the information extracted from simulations. How to use ideas such as concept drift to include extra information in the case base is left for future research.
Hence, only three stages are to be defined: retrieve, reuse, and revise. For the retrieval phase, simple queries were performed to retrieve the cases for the current location and basin. This might not be efficient in terms of computation; however, the scheme allows us to define different distance measurements without the need of designing complex queries.
The reuse stage is the one that performs the calculation of the distances between the retrieved cases from the case database and the current scenario. For this research, the square root of the weighted sum of the differences between the values for the variables describing the current scenario and a case is used as the distance measurement. Single criteria sorting using the distance measurement, together with a maximum number of neighbors, define the selection of the most relevant cases. Moreover, it is expected that more distance measurements can be defined, such as using the Sobol’ [
16] indexes or introducing not only single criteria but multi-criteria sorting—for instance, using the Pareto non-dominance concept.
Finally, the revise stage generates the outcome of each case. To do so, the distance between each relevant case and the current scenario is used as a weight to calculate the weighted map among the maps from each relevant case (see Equation (
1)). The idea is that the smaller the distance, the higher the weight should be; therefore, each reused case is assigned with the product of the distances of the remaining cases; this value is then scaled in [0.0, 1.0]. Using these weights, and for each prediction horizon, the CBR calculates a weighted map as the agreement among the cases.
4. Experimentation and Discussion
The INUNDATIO project focuses on two basins: Venero Claro and Nive; however, this study has only been analyzed with the Venero Claro basin, in Spain. The Venero Claro represents a small torrential hydrographical basin in Sierra de Gredos, Ávila. The Cabrera creek is a torrential-rain current and a tributary to the Alberche river belonging to the Tajo basin. It refers to a series of small creeks on the northern side of Sierra del Valle; its vegetation is 45% Pinus Pinaster, but also includes Pinus Sylvestris and Alnus Glutinosa. The behavior of this basin is a very active fluvial(torrential hydrodynamics) with relatively short dynamic time periods, between 15 min to 45 min.
During the implementation of the INUNDATIO project, a set of sensors was deployed in the basin to develop the hydrodynamic models; these models, unfortunately, will not be available during the project. As a consequence, for testing this CBR, the research team produced a realistic case base.
To generate the realistic case base, two main criteria have been defined in agreement with the experts: soil saturation and weather forecast; these criteria were a sort of look-up table to set the initial conditions and the evolutionary rules of the generated cases. Up to three different possible soil saturation states were considered: non-saturated soil, mid-saturated soil, and highly saturated soil. Furthermore, three possible forecasts were proposed: scarce rain forecast, soft rain forecast, and heavy rain forecast. The evolution of the sensors’ measurements and the rain forecast sequences were standardized for each pair of soil saturation and weather forecast. With these assumptions, a realistic case was generated by randomly biasing the standardized sensors functions and the rain forecast. Finally, the maps of the basin for each of the prediction horizons containing the millimeters of water were generated; these maps were carefully chosen to represent plausible states of the basin given the basin variables and rain forecast.
To evaluate this prototype of the CBR, different queries were performed by manually setting the rain forecast. The outcome of the tool must be such that the maps resemble the variances in mm of water in the basin. Because the tool automatically queries the online databases for the basin sensory information, tests with different basin initial conditions were not available.
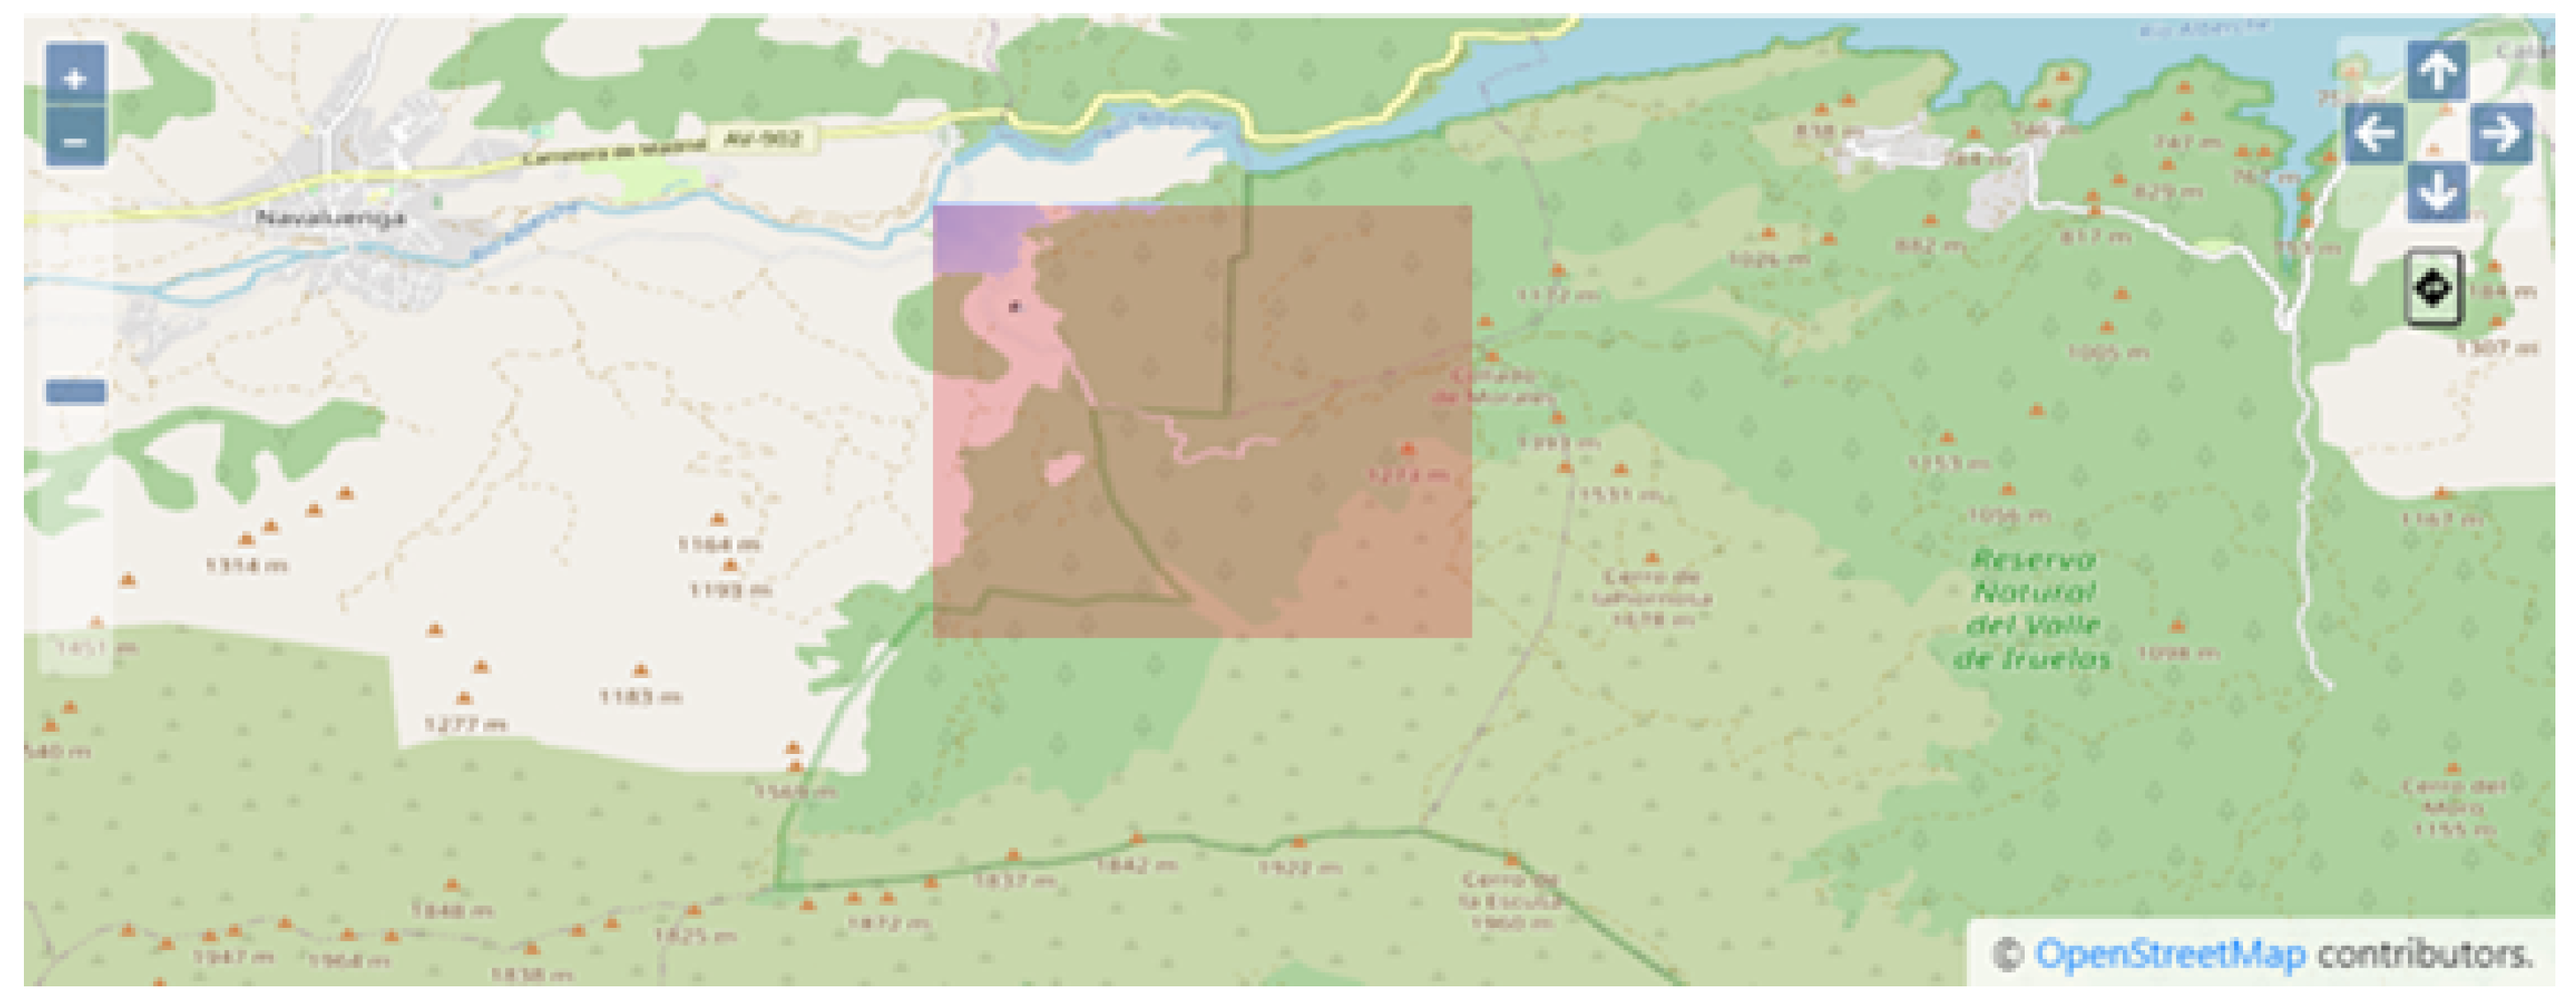
The performance of the CBR is briefly outlined in
Figure 3 and
Figure 4. The former figure depicts the web interface, showing the CBR output map overlapped with the basin map. The user can easily zoom in and out as well as pan over the map. This outcome comes from a scenario where the basin was suffering strong rain and then it stopped raining; the area in the upper-left corner of the studied basin of Venero Claro is completely flooded; this area is a low height plain.
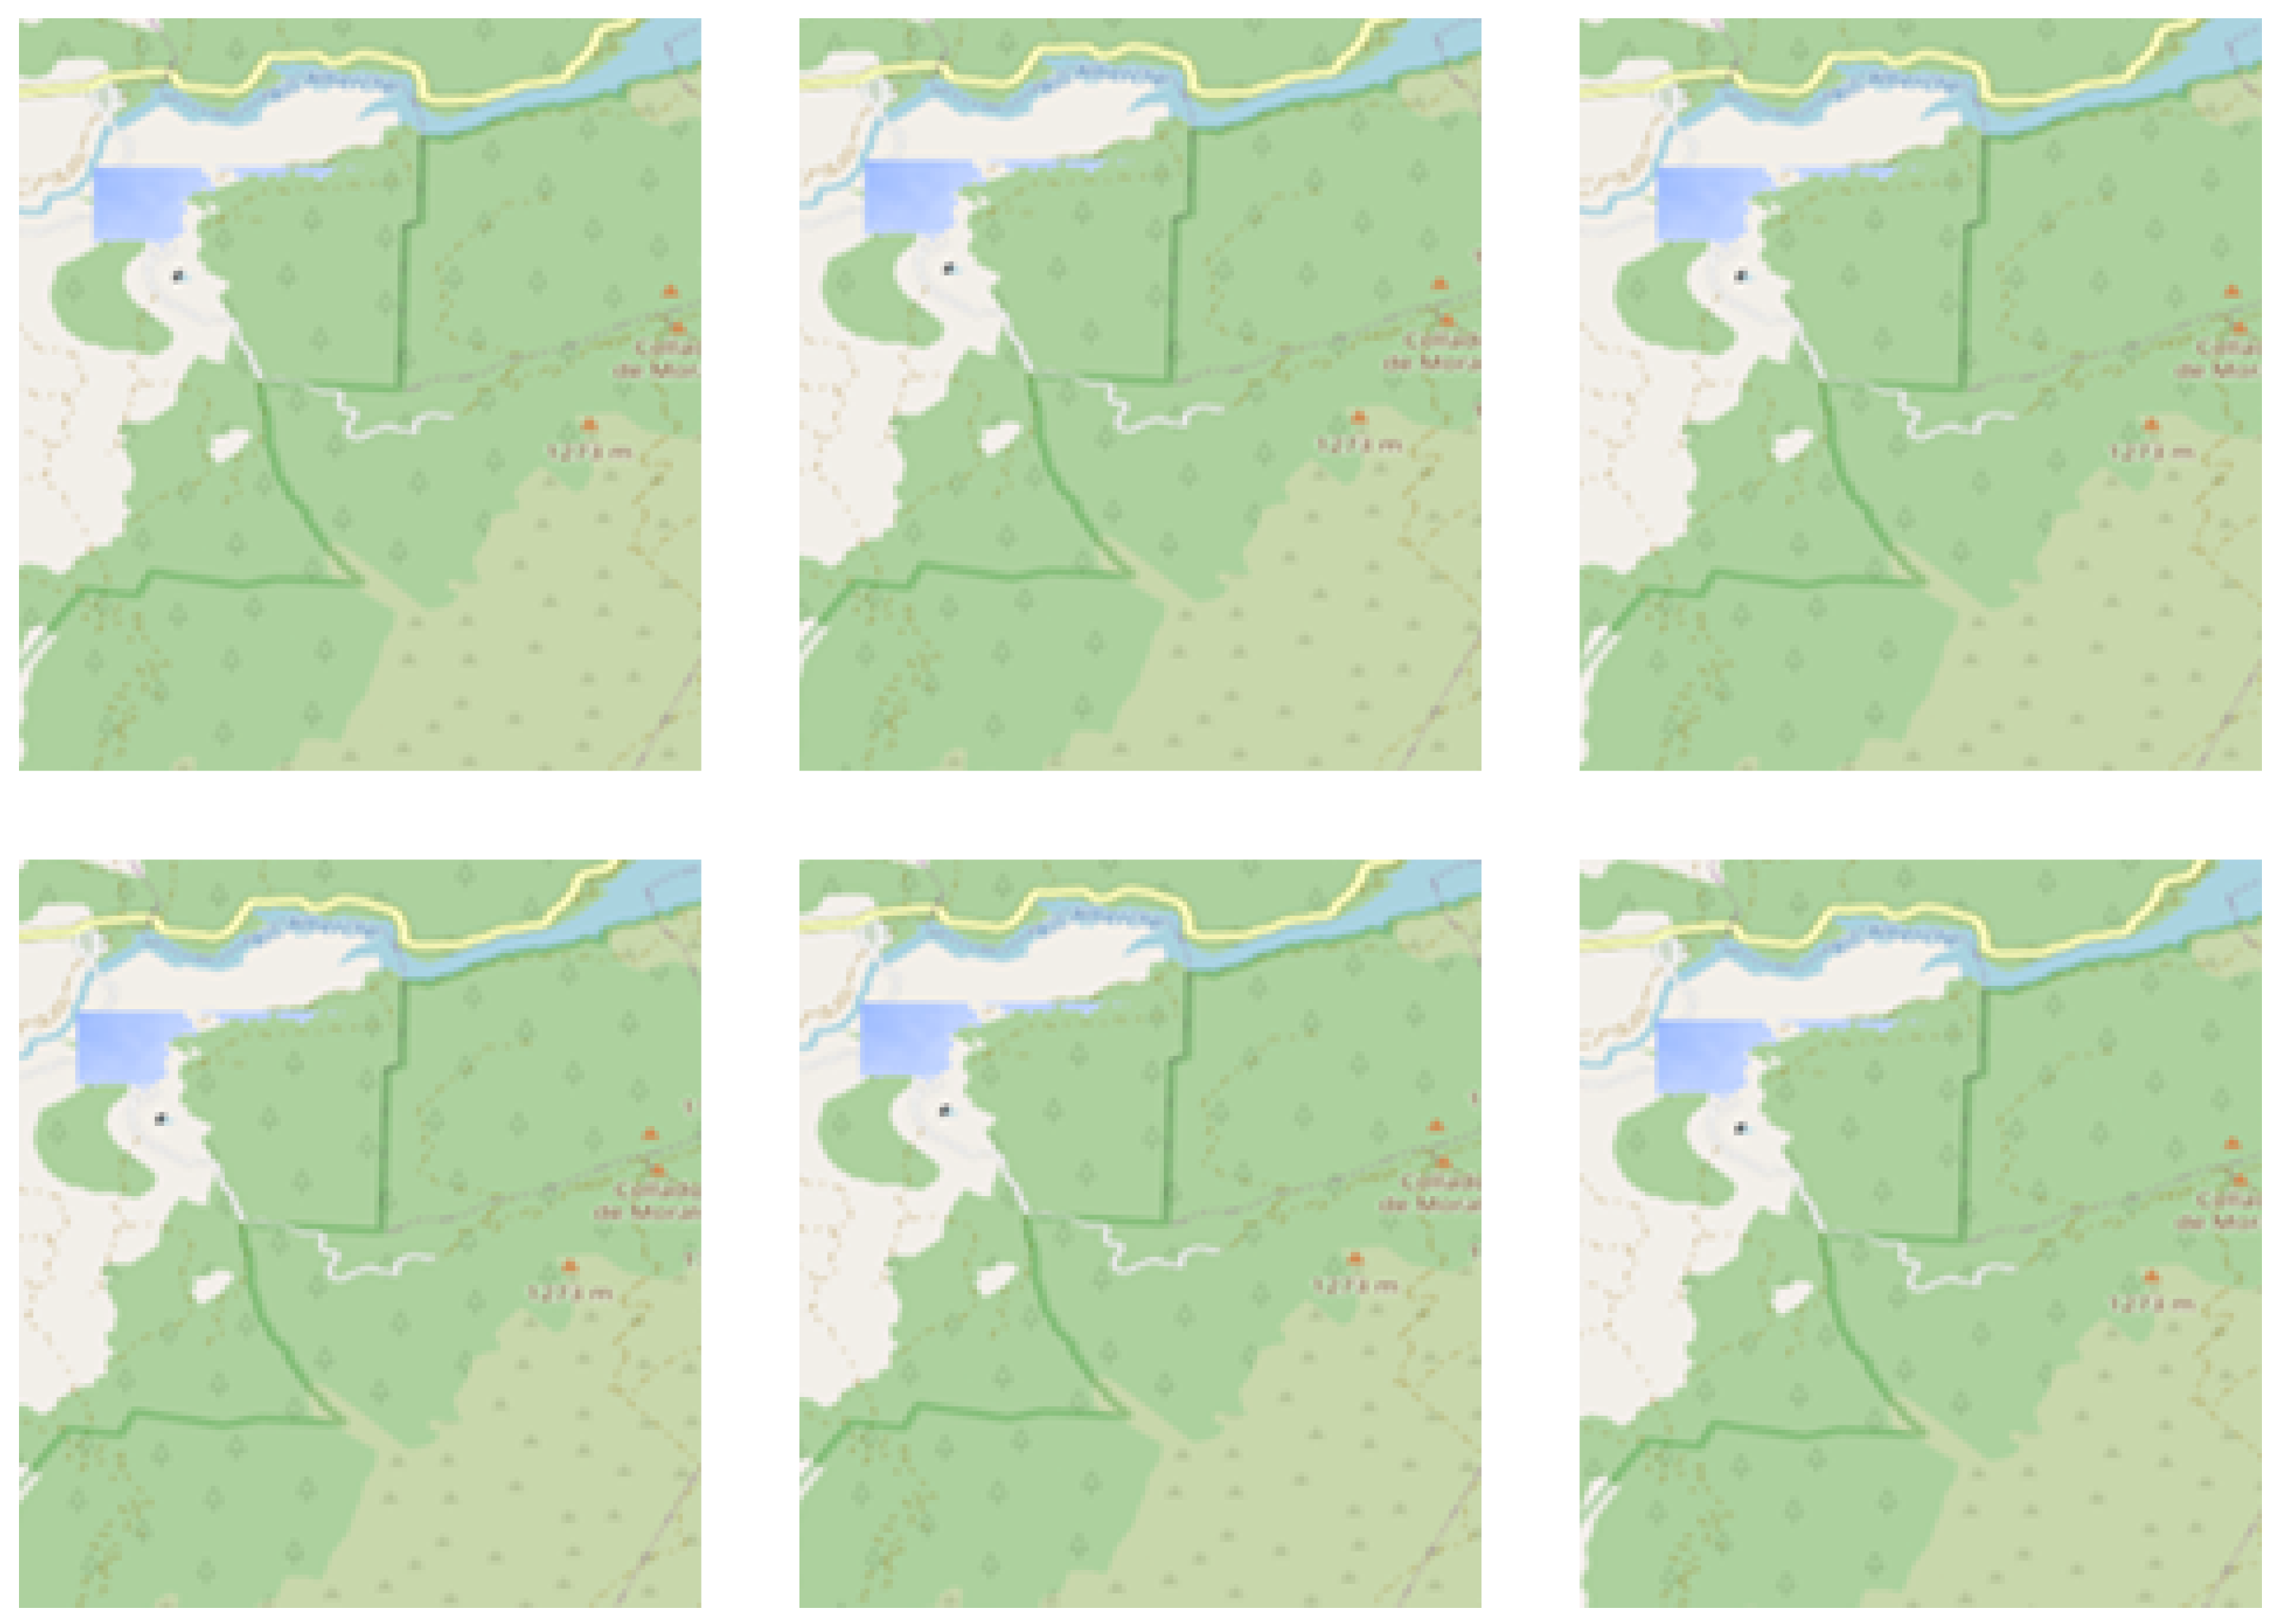
In
Figure 4, the maps for each of the 6 prediction horizons are included, limiting the view to the surroundings of the basin’s flooded area. As mentioned, the outcome is generated for a transition from heavy rain to a dry period. Consequently, the expectation is that the basin stabilizes and starts draining water. This is actually what the outcome shows, although due to the zoom that is necessary to notice the draining, it is almost unnoticeable.
5. Conclusions
In this research, a web application that uses a case-based reasoning intelligent service has been proposed for the prediction of the behavior of the basins; the goal is to assist the safety experts when flash floods are more possible according to the basin state. This proposal covers different types of basins, from those with fast responses to those with a slower dynamic.
Results only include the evolution of the Venero Claro basin in Spain and were obtained using realistic data and cases. This is because the data from the different basins—that is, the relevant cases, the sources of information, and forecasts—are still in development; therefore, work is still pending and, hopefully, a complete test could be available by the end of this year. Nevertheless, the CBR has shown its capacity to predict what the experts expect from a given set of initial conditions, merging the information from the most relevant stored cases.
In future work, the implementation of different extensions, such as multi-criteria sorting using Pareto dominance or the availability of different distance measurements, will be addressed.


