Proceeding Paper

A Multivariate Approach for Spatiotemporal Mobile Data Traffic Prediction †

by
Bethelhem S. Shawel
1,2,*,
Endale Mare
3,
Tsegamlak T. Debella
1,4,
Sofie Pollin
2 and
Dereje H. Woldegebreal
1
1
School of Electrical and Computer Engineering, Addis Ababa Institute of Technology, Addis Ababa University, Addis Ababa 386, Ethiopia
2
Department of Electrical Engineering, KU Leuven, 3001 Leuven, Belgium
3
Ethio Telecom, Addis Ababa 1047, Ethiopia
4
ENSISA, Institute for Research in Informatics, Mathematics, Automation and Signal, Université de Haute Alsace, 68093 Mulhouse, France
*
Author to whom correspondence should be addressed.
Presented at the 8th International Conference on Time Series and Forecasting, Gran Canaria, Spain, 27–30 June 2022.
Eng. Proc. 2022, 18(1), 10; https://doi.org/10.3390/engproc2022018010
Published: 21 June 2022
(This article belongs to the Proceedings of The 8th International Conference on Time Series and Forecasting)

Abstract

:
Widespread deployment of spectrally efficient mobile networks, advancements in mobile devices, and proliferation of attractive applications has led to an exponential increase in mobile data traffic. Mobile Network Operators (MNOs) benefit from the associated revenue generation while putting efforts to meet customers’ expectations of delivered services. Having a clear knowledge of the traffic demand is critical for network dimensioning, optimization, resource allocation, market planning, and the like. As the traffic demand, among others, is a function of customers’ behavior and settlement patterns, land use, and time of the day, capturing traffic characteristics in both temporal and spatial dimensions is needed. Moreover, other parameters, such as the number of users and data throughput, inherently contain traffic-related information, necessitating a multivariate approach for understanding the traffic demand. Realizing the multidimensional and multivariate nature of the mobile data traffic, in this paper, we propose a multivariate and hybrid Convolutional Neural Network and Long Short-Term Memory network (CNN-LSTM) data traffic prediction model. The model is built on mobile traffic data collected from a Network Operator for Long-Term Evolution (LTE) network. The results confirm that the proposed model outperforms its univariate counterparts in Root Mean Square Error (RMSE) and Mean Absolute Percentage Error (MAPE) by 58% and 50%, respectively. Moreover, the model is further compared with CNN-only univariate and multivariate models, which it also outperforms. The comparisons substantiate the achievable improvements because of the hybrid and multivariate nature of the prediction algorithm.

1. Introduction

The global need for mobile data traffic is increasing for a variety of reasons, including the continuous growth of smarter mobile phones, emergence of machine-to-machine connections, and the availability of appealing and data-intensive applications [1]. Constant optimization, capacity enhancement, and efficient utilization of scarce resources are approaches by Mobile Network Operators (MNOs) to maintain service quality and avoid capacity crunch because of this ever-growing data demand. Moreover, network densification, traffic offloading, spectral efficiency improvement, and using more radio spectrum are techniques to improve the poor quality of service (QoS) that rises due to capacity crunch [2]. MNOs select the appropriate method based on their customer demand and financial capability. Current and future data traffic demand knowledge is one critical input for the design and implementation of the above-mentioned approaches.
Time-series prediction methods play a vital role to forecast future demands for several real-world applications, including mobile data traffic demand. Data prediction models are broadly grouped as conventional and computational intelligence models [3]. Autoregressive Integrated Moving Average (ARIMA) and its extensions such as Seasonal ARIMA (SARIMA) are conventional methods. Computational intelligence techniques, on the other hand, include machine learning and deep learning-based models such as Long Term Short Memory (LSTM) and Convolutional Neural Network (CNN) networks. The time-series prediction method can be deveoped based on univariate or multivariate variables (or features). In the univariate case, there is one observation (a dependent feature, which in our case is data traffic) available for different time instants, while in the multivariate case there are multiple observations observed over different time instants. Multivariate time series prediction becomes popular in many real-world applications such as energy, finance, and weather and smoothens model building by increasing the model’s performance [4].
Several researchers used machine learning methods, such as deep learning and data clustering, and multivariate approaches to model the dynamics of mobile data traffic in temporal and spatiotemporal domains. Based on data collected from an operator’s network, ref. [3] proposed LSTM and Gated Recurrent Unit (GRU) to capture the dynamics in mobile data traffic. By comparing with Adaptive Neuro-Fuzzy Inference System (ANFIS) and Artificial Neural Network (ANN), the authors demonstrated the performance gain by using the proposed model. Similar to [3], ref. [5] also applied LSTM and Recurrent Neural Network (RNN) to predict data traffic demand of a 4G network run by an operator. In both papers, the prediction is done on a per-base-station basis and in temporal dimension only.
To separately estimate the linear and non-linear part of mobile data traffic, ref. [6] proposed a hybrid model using Double SARIMA (DSARIMA) and LSTM in which the DSARIMA handles the linear part whereas the LSTM predicts the nonlinear part of data traffic. To capture correlation among temporal traffic data taken from different bases stations that are spatially separated, K-Means clustering is used to group the base stations having similar data traffic. The result shows that the hybrid model outperforms the DSARIMA and LSTM-only models. A similar clustering-based approach was also used in [7] to assess the effectiveness of different time series prediction models for efficient deployment of base stations.
A multivariate and LSTM-based prediction approach is proposed in [8] to collect scheduling information of users. The multivariate features considered are: number of resource blocks, transport block size, and modulation and coding schemes. The results show the effectiveness of the LSTM network in capturing temporal variation for multivariate input features. Though for different applications, refs. [9,10,11] demonstrated the capability of multivariate and hybrid CNN-LSTM model to predict residential energy consumption and forecasting particulate matter, respectively. Univariate models are used as a benchmark for comparison and the results confirm that multivariate features greatly improve the model performance.
In summary, in a bid to improve prediction accuracy, from the survey we understood the need to incorporate multiple variables, data clustering, and blend LSTM and CNN to capture traffic dynamics in spatiotemporal dimensions. In this work, a hybrid CNN-LSTM mobile data traffic-prediction model that takes multiple traffic-related variables is proposed. A total of 4 months of Long-Term Evolution (LTE) network data traffic that is collected from the network operator is used to build and validate the model. To the best of our knowledge, there is no prior work that applies a hybrid CNN-LSTM model for such types of neural networks. Understandably, the multivariate features are technology- and application-dependent. Hence, we used our experience and availability of data to determine the features.
The remainder of the paper is organized as follows. The characteristics of mobile data traffic and associated data preprocessing are described in Section 2, followed by the discussions of mobile data traffic prediction approaches in Section 3. Section 4 contains the results and discussion, while the conclusion of the paper is presented in Section 5.

2. Analysis of Mobile Data Traffic

2.1. Mobile Data Traffic Characteristics

Mobile data traffic exhibits different properties in both time and spatial domains. Trend and seasonality are used to demonstrate the temporal properties of time-series data. The trend shows a long-term increase or decrease in the data, whereas seasonality is a repeating pattern with a fixed period such as daily, weekly and yearly. Figure 1 illustrates sample downlink data traffic, measured in Gigabytes, from two LTE radio base stations, called eNodeBs, measurement taken for a duration of 9 days. We observe that, even if the average daily traffic differs for different days, there is a daily seasonality observed in the data.

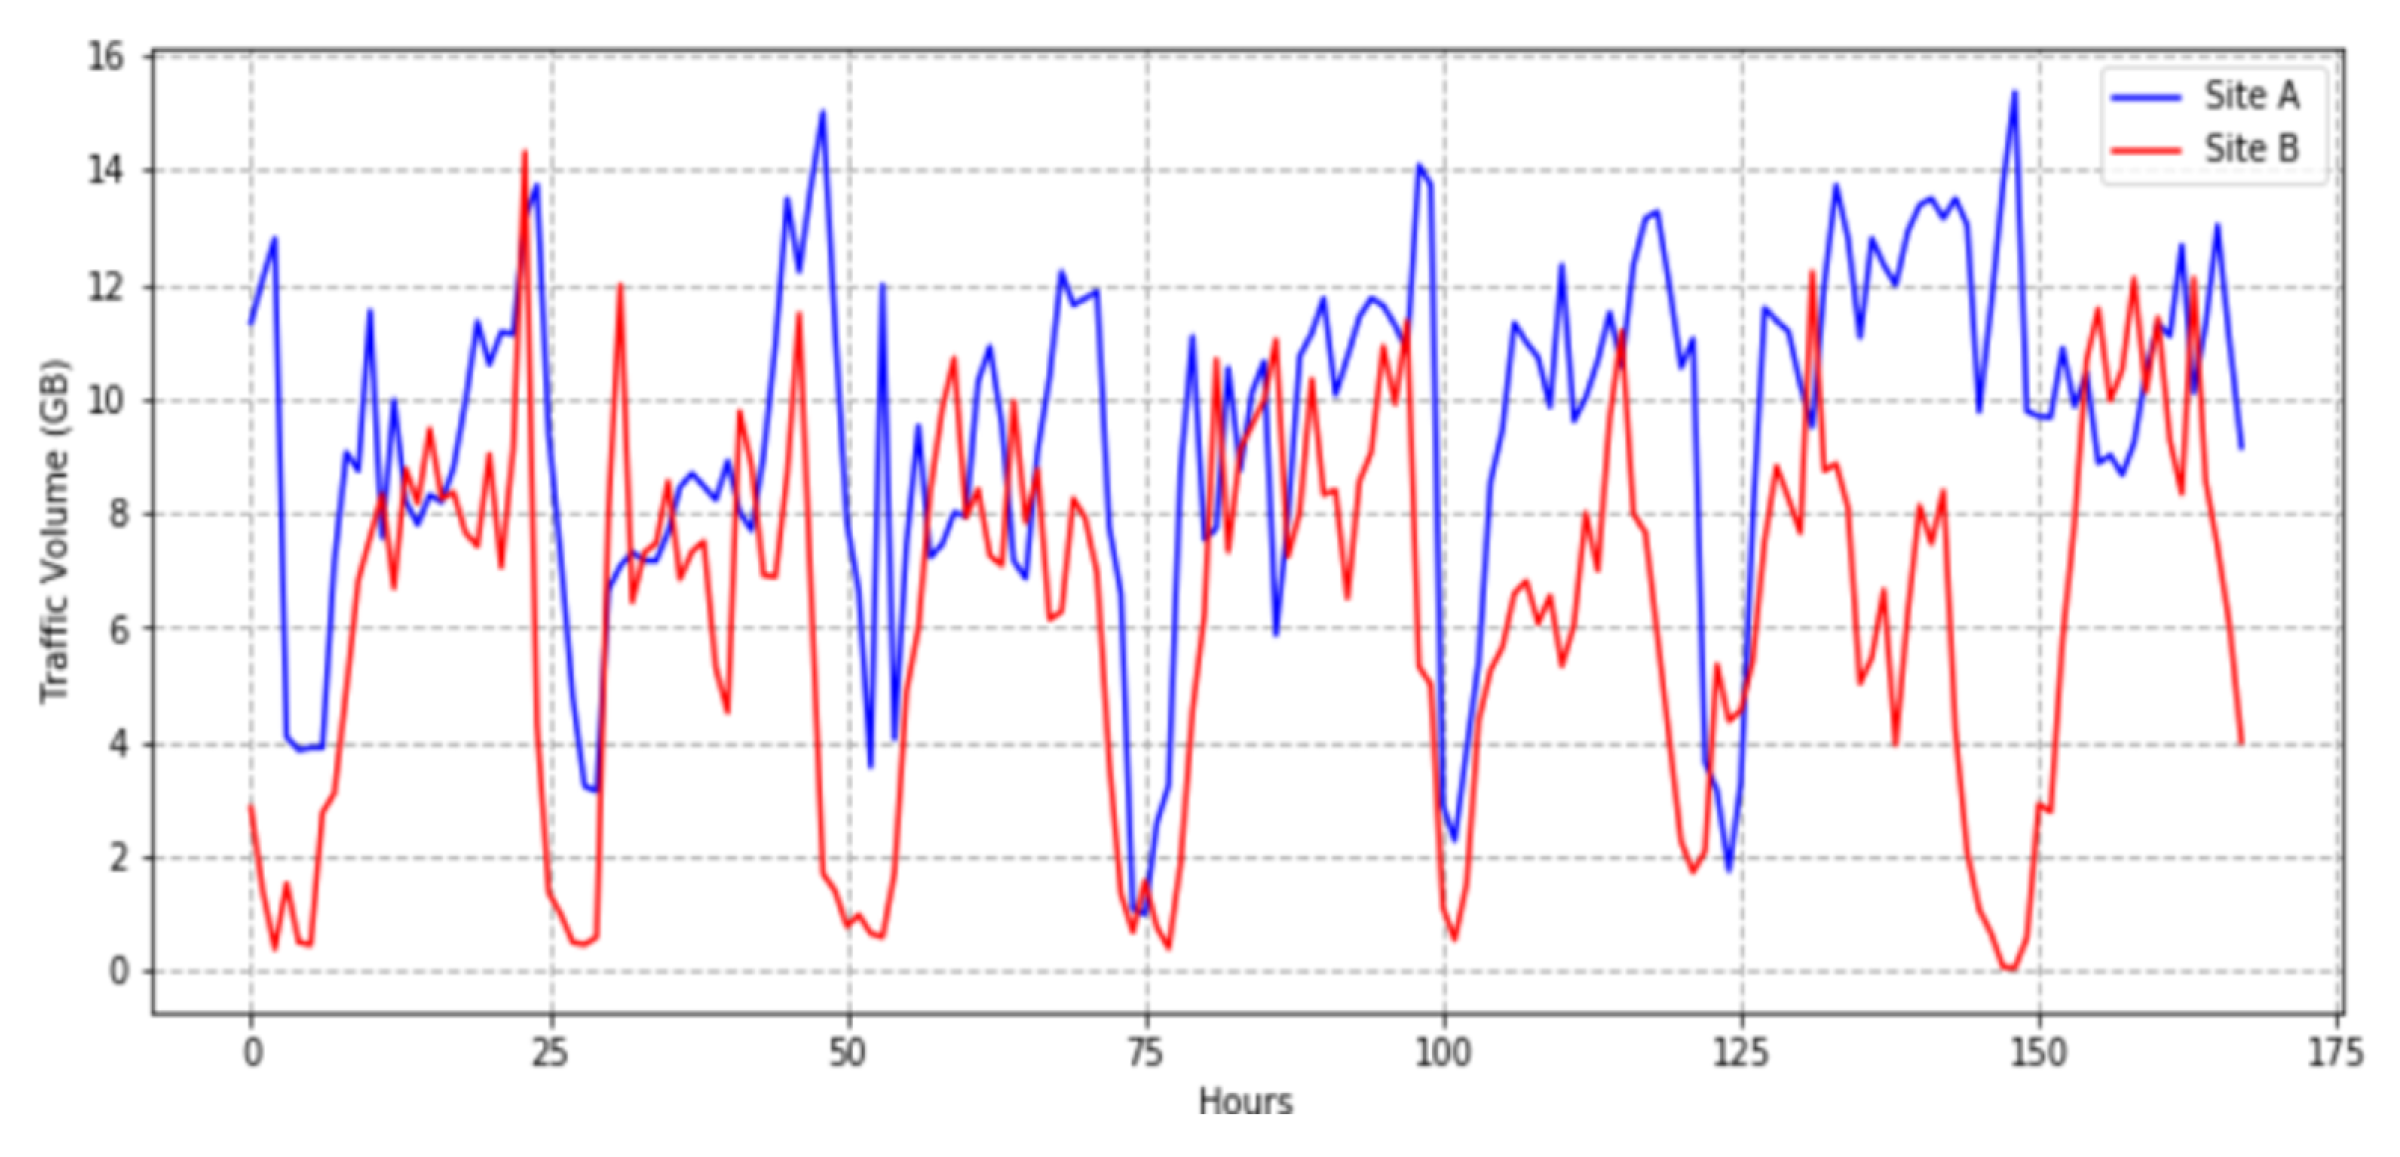
2.2. Data Traffic in Spatial Dimension

We observe from Figure 1 a variation in data traffic demand at the two locations, motivating the need for additional investigation of the traffic pattern in the spatial dimension. Since mobile users constantly move within a given cellular network, the traffic pattern across neighboring base stations are correlated or complemented, such that developing in both the spatial and temporal dimensions would provide better information for telecom operators [12]. Spatiotemporal data traffic prediction incorporates different user behavior such as mobility and network behavior, such as the number of handovers in the network [13].
For spatial analysis, a grid-based or cluster-based approach can be used. In the former approach, a given service area is partitioned into (usually) uniform grids, and eNodeBs that fall into one cell of a grid are considered as one unit. However, because of the non-uniform distribution of eNodeBs, it is difficult to formulate models for large areas with fine-granularity grids.
The clustering approach is another option to incorporate all eNodeBs. In this approach, eNodeBs with similar traffic load patterns are grouped together and those eNodeBs within the same cluster have similar characteristics. The eNodeBs can be clustered based on either geographical location, also called spatial clustering, or on temporal behavior [6,7]. The assumption in spatial clustering is that neighboring eNodeBs exhibit similar temporal properties. In temporal-based clustering, the clustering is done based on temporal behavior irrespective of geographical location [6]. Considering more than one eNodB in time series clustering incorporates the spatial information of the data traffic. After clustering the base stations, the data traffic prediction model is developed per cluster level. In this paper, we have applied the temporal-based clustering approach.

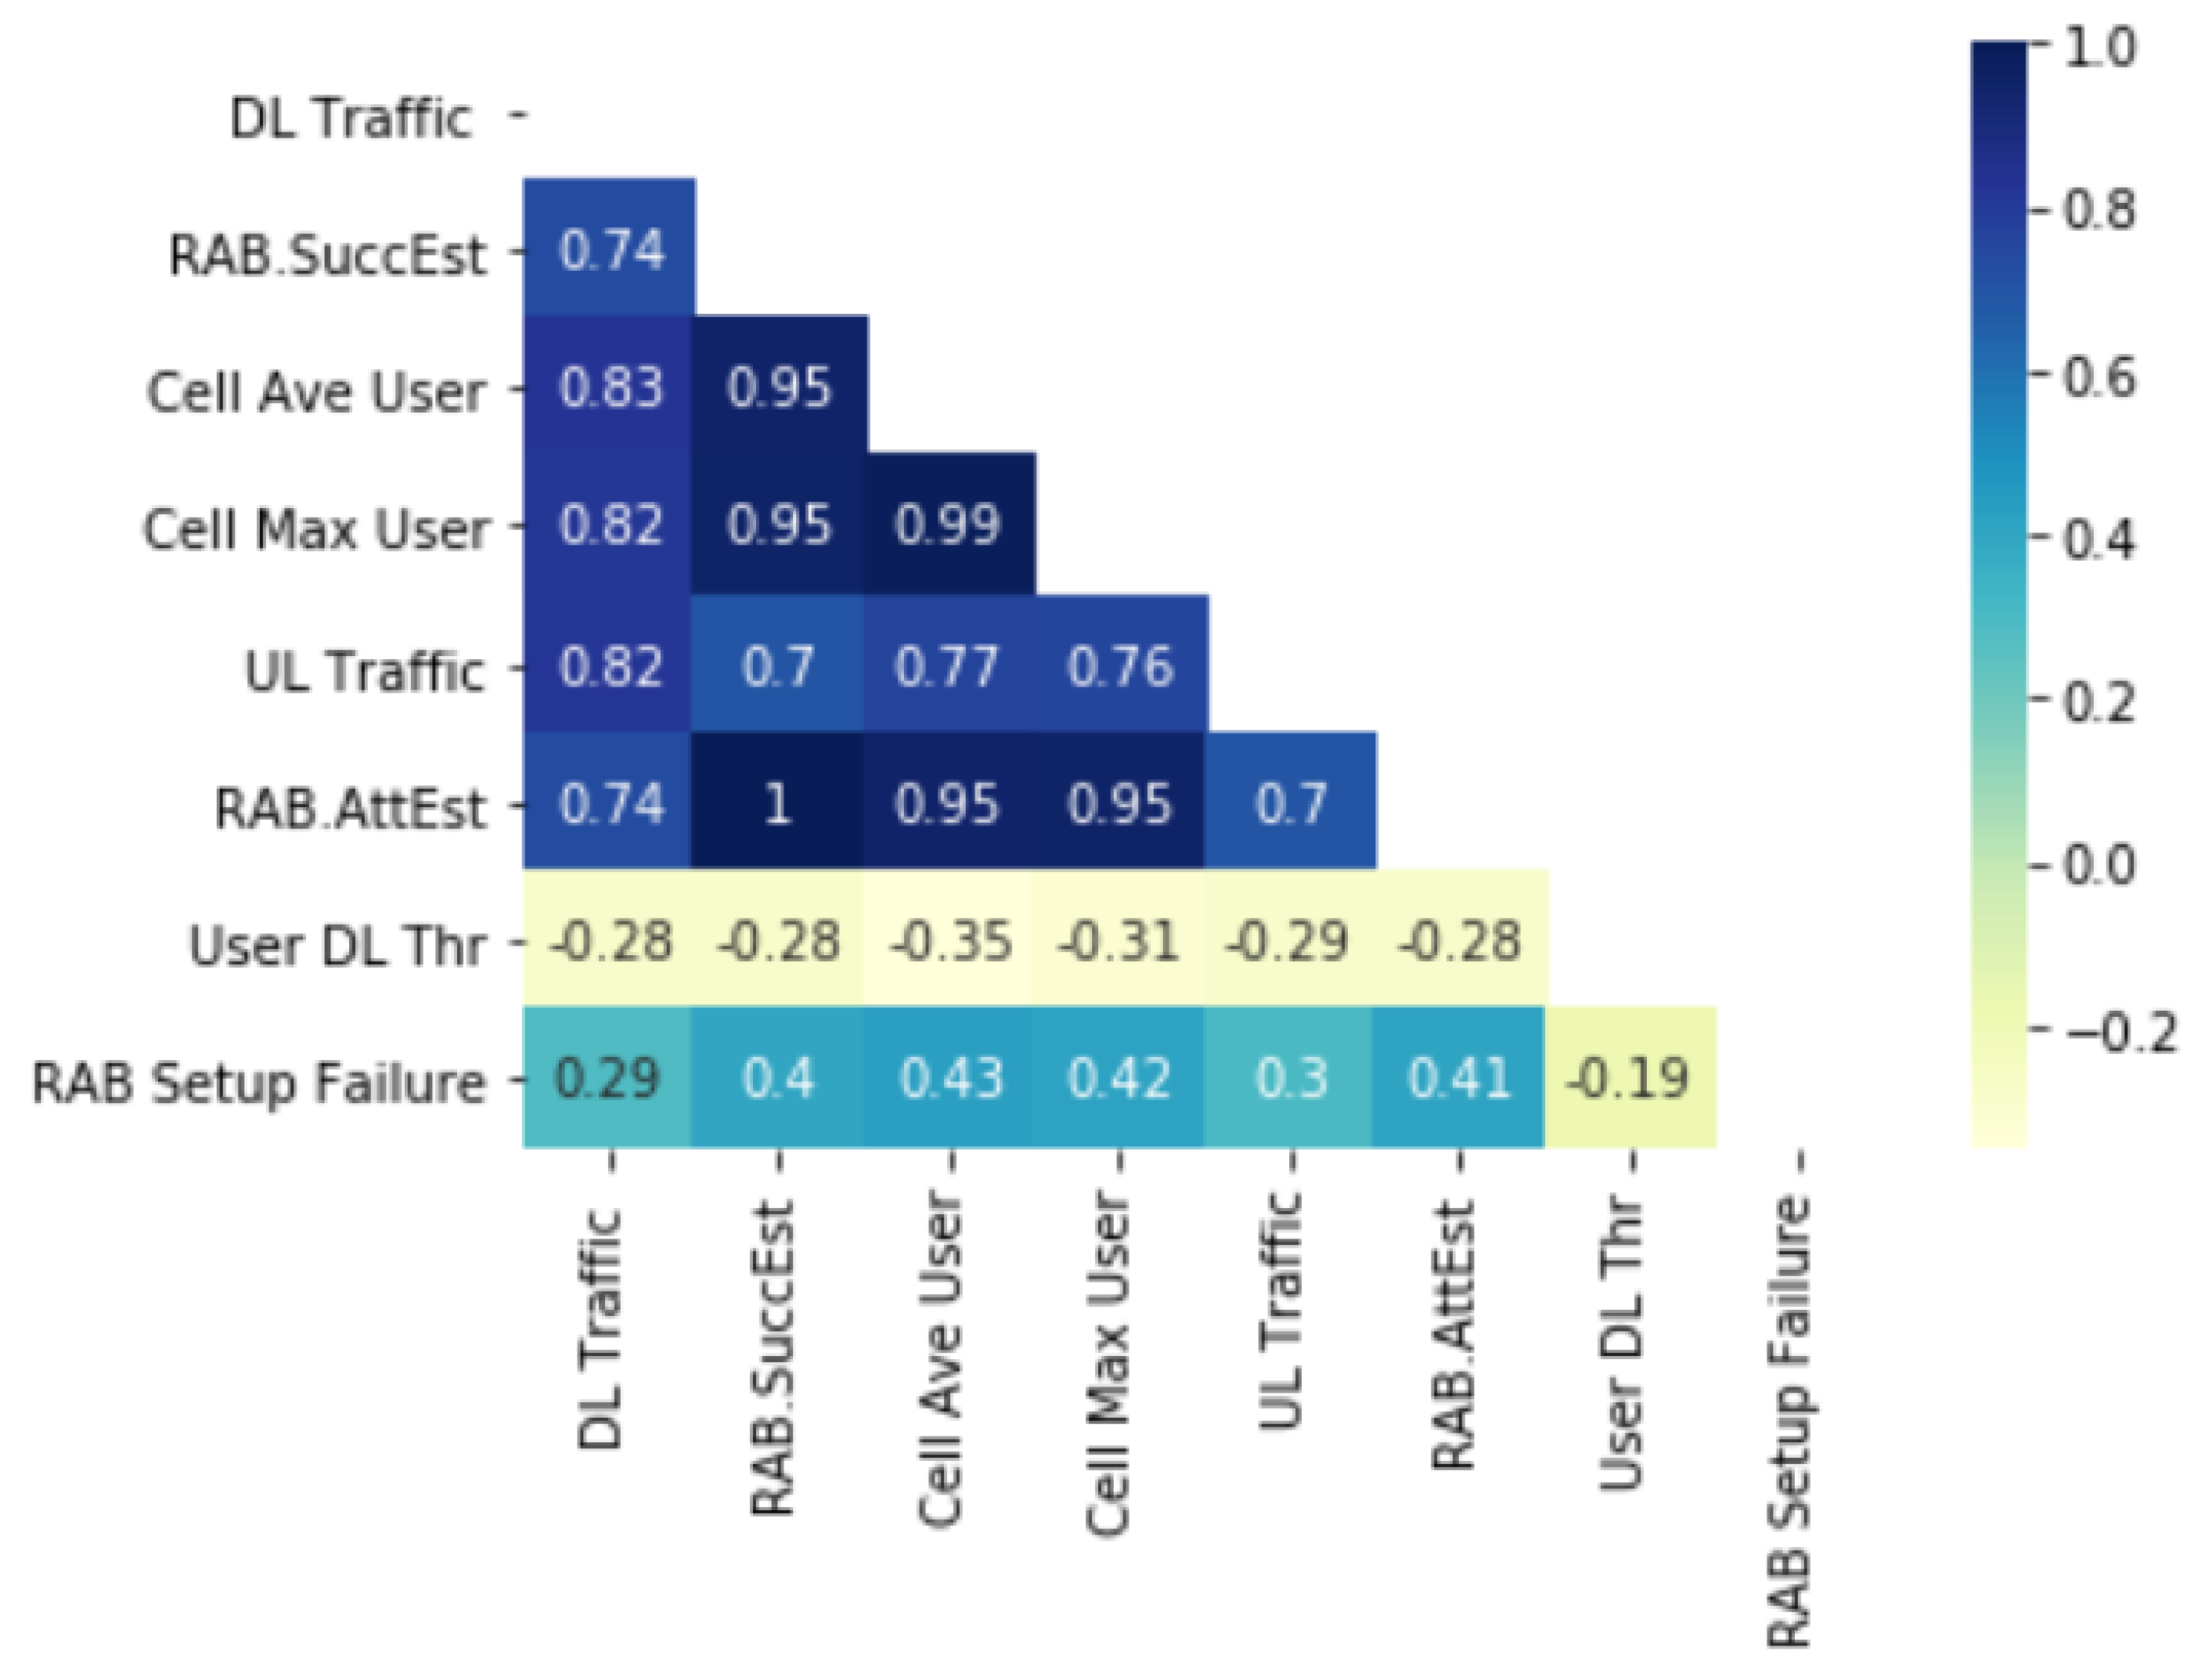
2.3. Multivariate Features Selection

The data used in this paper is collected from an operator’s LTE network for 4 months from October 2020 to January 2021 in an hourly granularity. The multivariate dataset incorporates eight features: download downlink (DL) traffic, which is the traffic to be predicted; DL throughput; average and maximum number of users in a cell; number of attempted, successful, and setup failure Radio Access Bearers (RABs); uplink (UL) data traffic; and location information of the eNodeBs.
Pearson’s-based correlation analysis is applied to select features and the result of the correlation analysis is illustrated in Figure 2. A correlation threshold value of 0.5 and above is used to select features. Moreover, for features whose correlation coefficient values are closer, e.g., cell average user of 0.83 value and cell maximum user of 0.82, only one is considered. Among the multivariate features DL traffic, a number of successful RABs, cell average user, and UL traffic are selected as they are highly correlated with downlink data traffic.

2.4. Data Preparation for CNN-LSTM Model

In data preparation, missing values in the multivariate dataset are imputed with the Kalman filter, preserving the strong seasonality and trend of the data traffic. The features in the dataset are scaled with a standard scaler so all data points fall within a certain range. Since some machine learning algorithms that use distance metrics are affected by the span of the value found in the dataset, feature scaling is critical for improving model performance. Furthermore, the time series prediction problem is framed as supervised learning makes it suitable to train and test deep learning models.

2.5. Time Series-Based Clustering

Clustering a dynamic dataset differs from static data since the former changes over time. Different approaches such as Hierarchical Clustering, K-Means Clustering, and Fuzzy C Means Clustering are used for time series data clustering. Each method has its advantages and disadvantages. Among those methods, K-Means Clustering is used in several works for fast convergence even for a large number of datasets [14]. In this work, K-Means clustering is used to group the eNodeBs according to the daily data traffic volume and four distinct clusters are obtained based on K-Means clustering for the dataset.

3. Mobile Data Traffic Prediction Methods

Deep learning models such as LSTM, GRU, and CNN are becoming popular in dealing with sequential or time-series data such as text, speech, and often images [15]. The basics of LSTM and CNN networks that are used to develop the proposed model are revised in the following subsections.

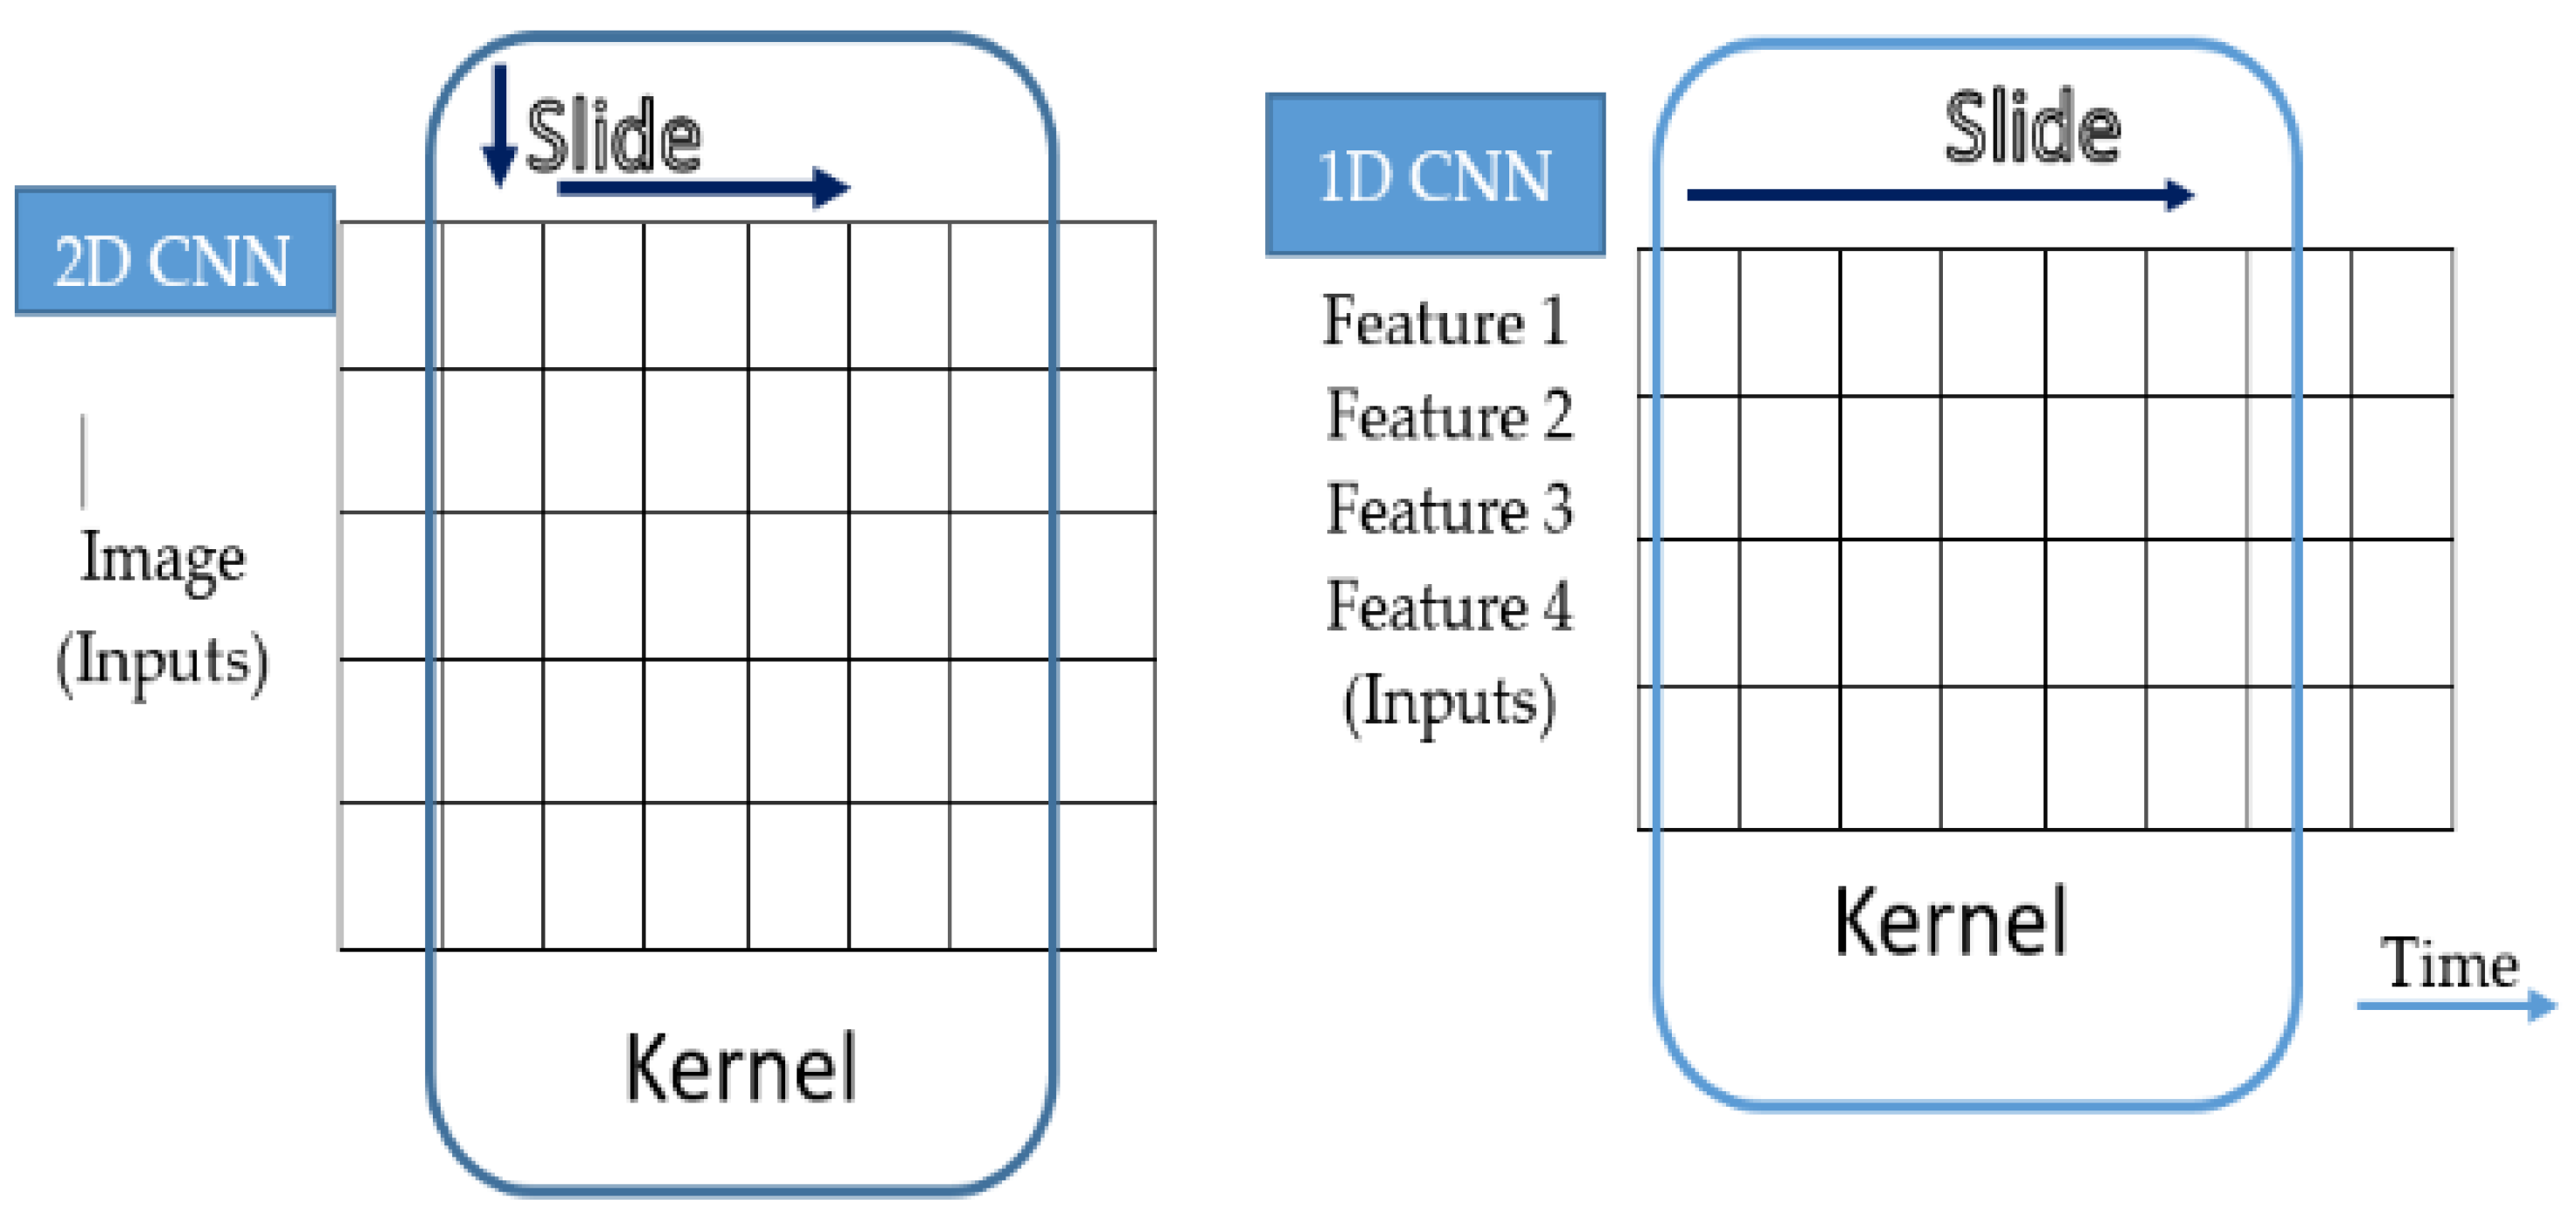
3.1. One Dimensional CNN Model

CNN models are typically employed to analyze spatial or multidimensional data. However, one-dimensional CNN (1D CNN) can also be used to analyze texts and time-series data [16]; 1D CNN can extract salient and representative features of time-series data by performing 1D convolution operations using multiple filters [17]. Figure 3 shows the difference between 1D CNN and 2D CNN. The kernel (filter) in 2D moves in both directions while it moves only in one direction for 1D CNN. The input for 2D CNN is an image, while multivariate time series features can be inputs for 1D CNN.

3.2. LSTM Model

RNN is designed for handling sequential data by feeding the output of the previous layer as an input to the next layer, allowing the network to capture the dependency of sequential data [19]. LSTM is a type of RNN network that was modeled to solve short-term dependency problems as well as exploding and vanishing gradient problems. LSTM network has three gates (Forget gate  f t , Input gate i t and Output gate o t ) that decide which information to add or remove from the cell state, and the Cell state, C t , memory stores the desired information. The mathematical expression for the LSTM network at time t, is described as follows:
f t = σ ( W f · X t + U f · h t 1 + b f )
i t = σ ( W i · X t + U i · h t 1 + b i )
S t = tanh ( W c · X t + U c · h t 1 + b c )
C t = i t S t + f t S t 1
o t = σ ( W o · X t + U o · h t 1 + V o · C t + b o )
h t = o t tanh ( C t )
where tanh ( · ) and σ are activation functions while i t , f t , and o t represent input gate, the forget gate, and the output gate values at time t, whereas b i , b f , b c , and b o are bias vectors for the input gate, forget gate, cell state, and output gate, respectively. X t is the input vector to the memory cell at time t while the parameters W f , W i , W c , W o , U f , U i , U c , U o , and V o are weight matrices for gates and cell state.

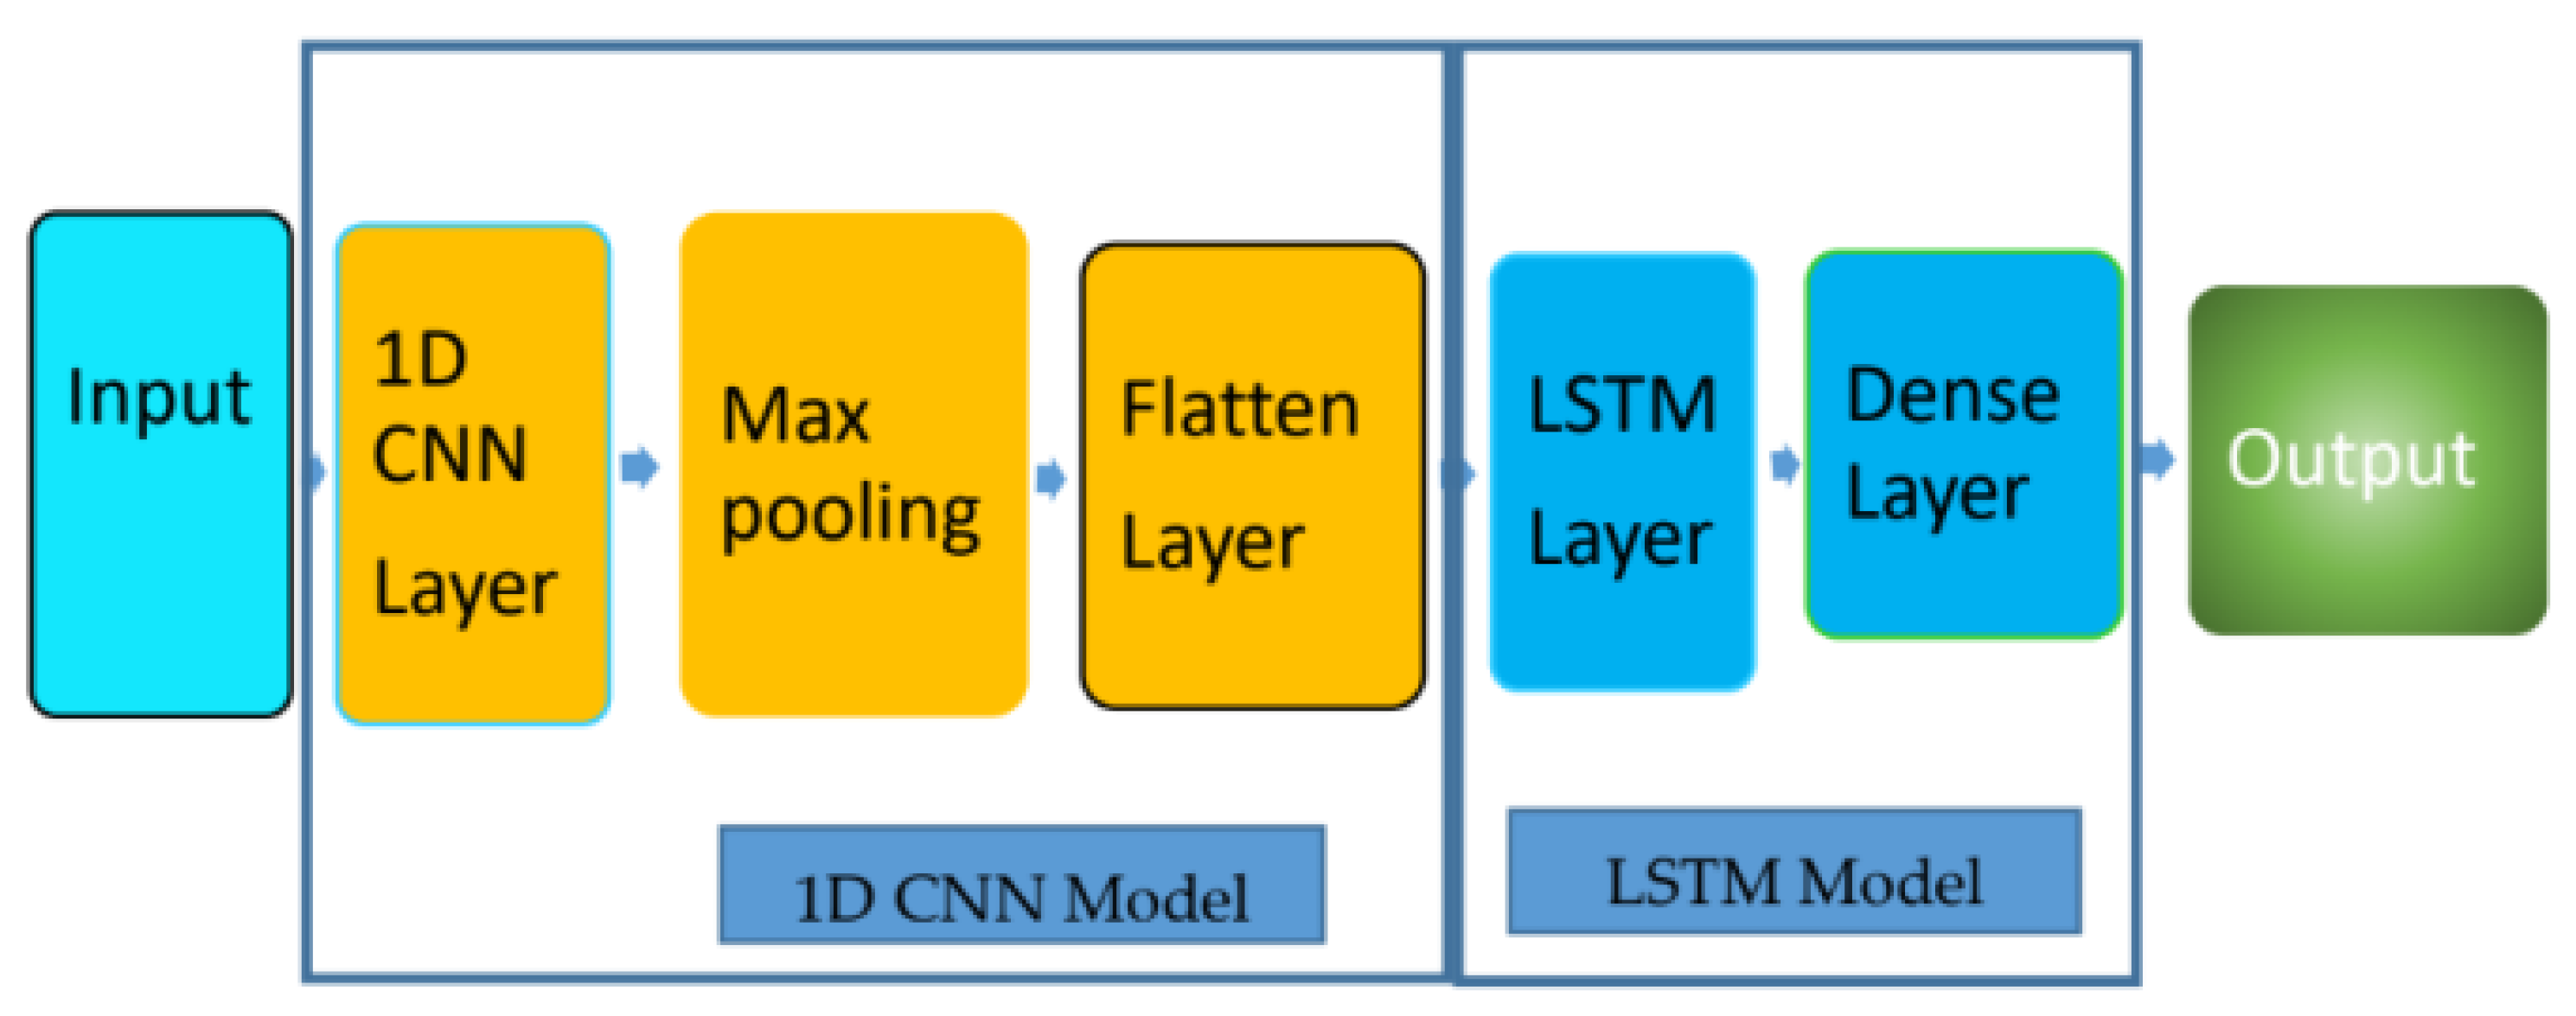
3.3. Proposed CNN-LSTM Model

The CNN model is well known for its ability to automatically learn and extract features from raw sequence or time-series data. It is possible to combine this capability of the CNN model with the LSTM model. The LSTM network captures long-term and short-term dependency of temporal features more efficiently. The CNN model accepts input data sequences and extracts important feature information, whereas the LSTM model connected in tandem interprets and provides an output [20]. This combination of CNN and LSTM models is called a CNN-LSTM model. The general approach followed in this paper is illustrated in Figure 4.
Common performance evaluation metrics for regression models are Root Mean Square Error (RMSE) and Mean Absolute Percentage Error (MAPE). In this work, RMSE and MAPE are used as evaluation metrics, and the formula for those metrics are:
R M S E = 1 n i = 1 n ( y i y ^ i ) 2
M A P E = 1 n i = 1 n | y i y ^ i y i |
where y ^ i and y i corresponds to the actual and predicted values and n is the number of predicted instances.

4. Experimental Results and Discussion
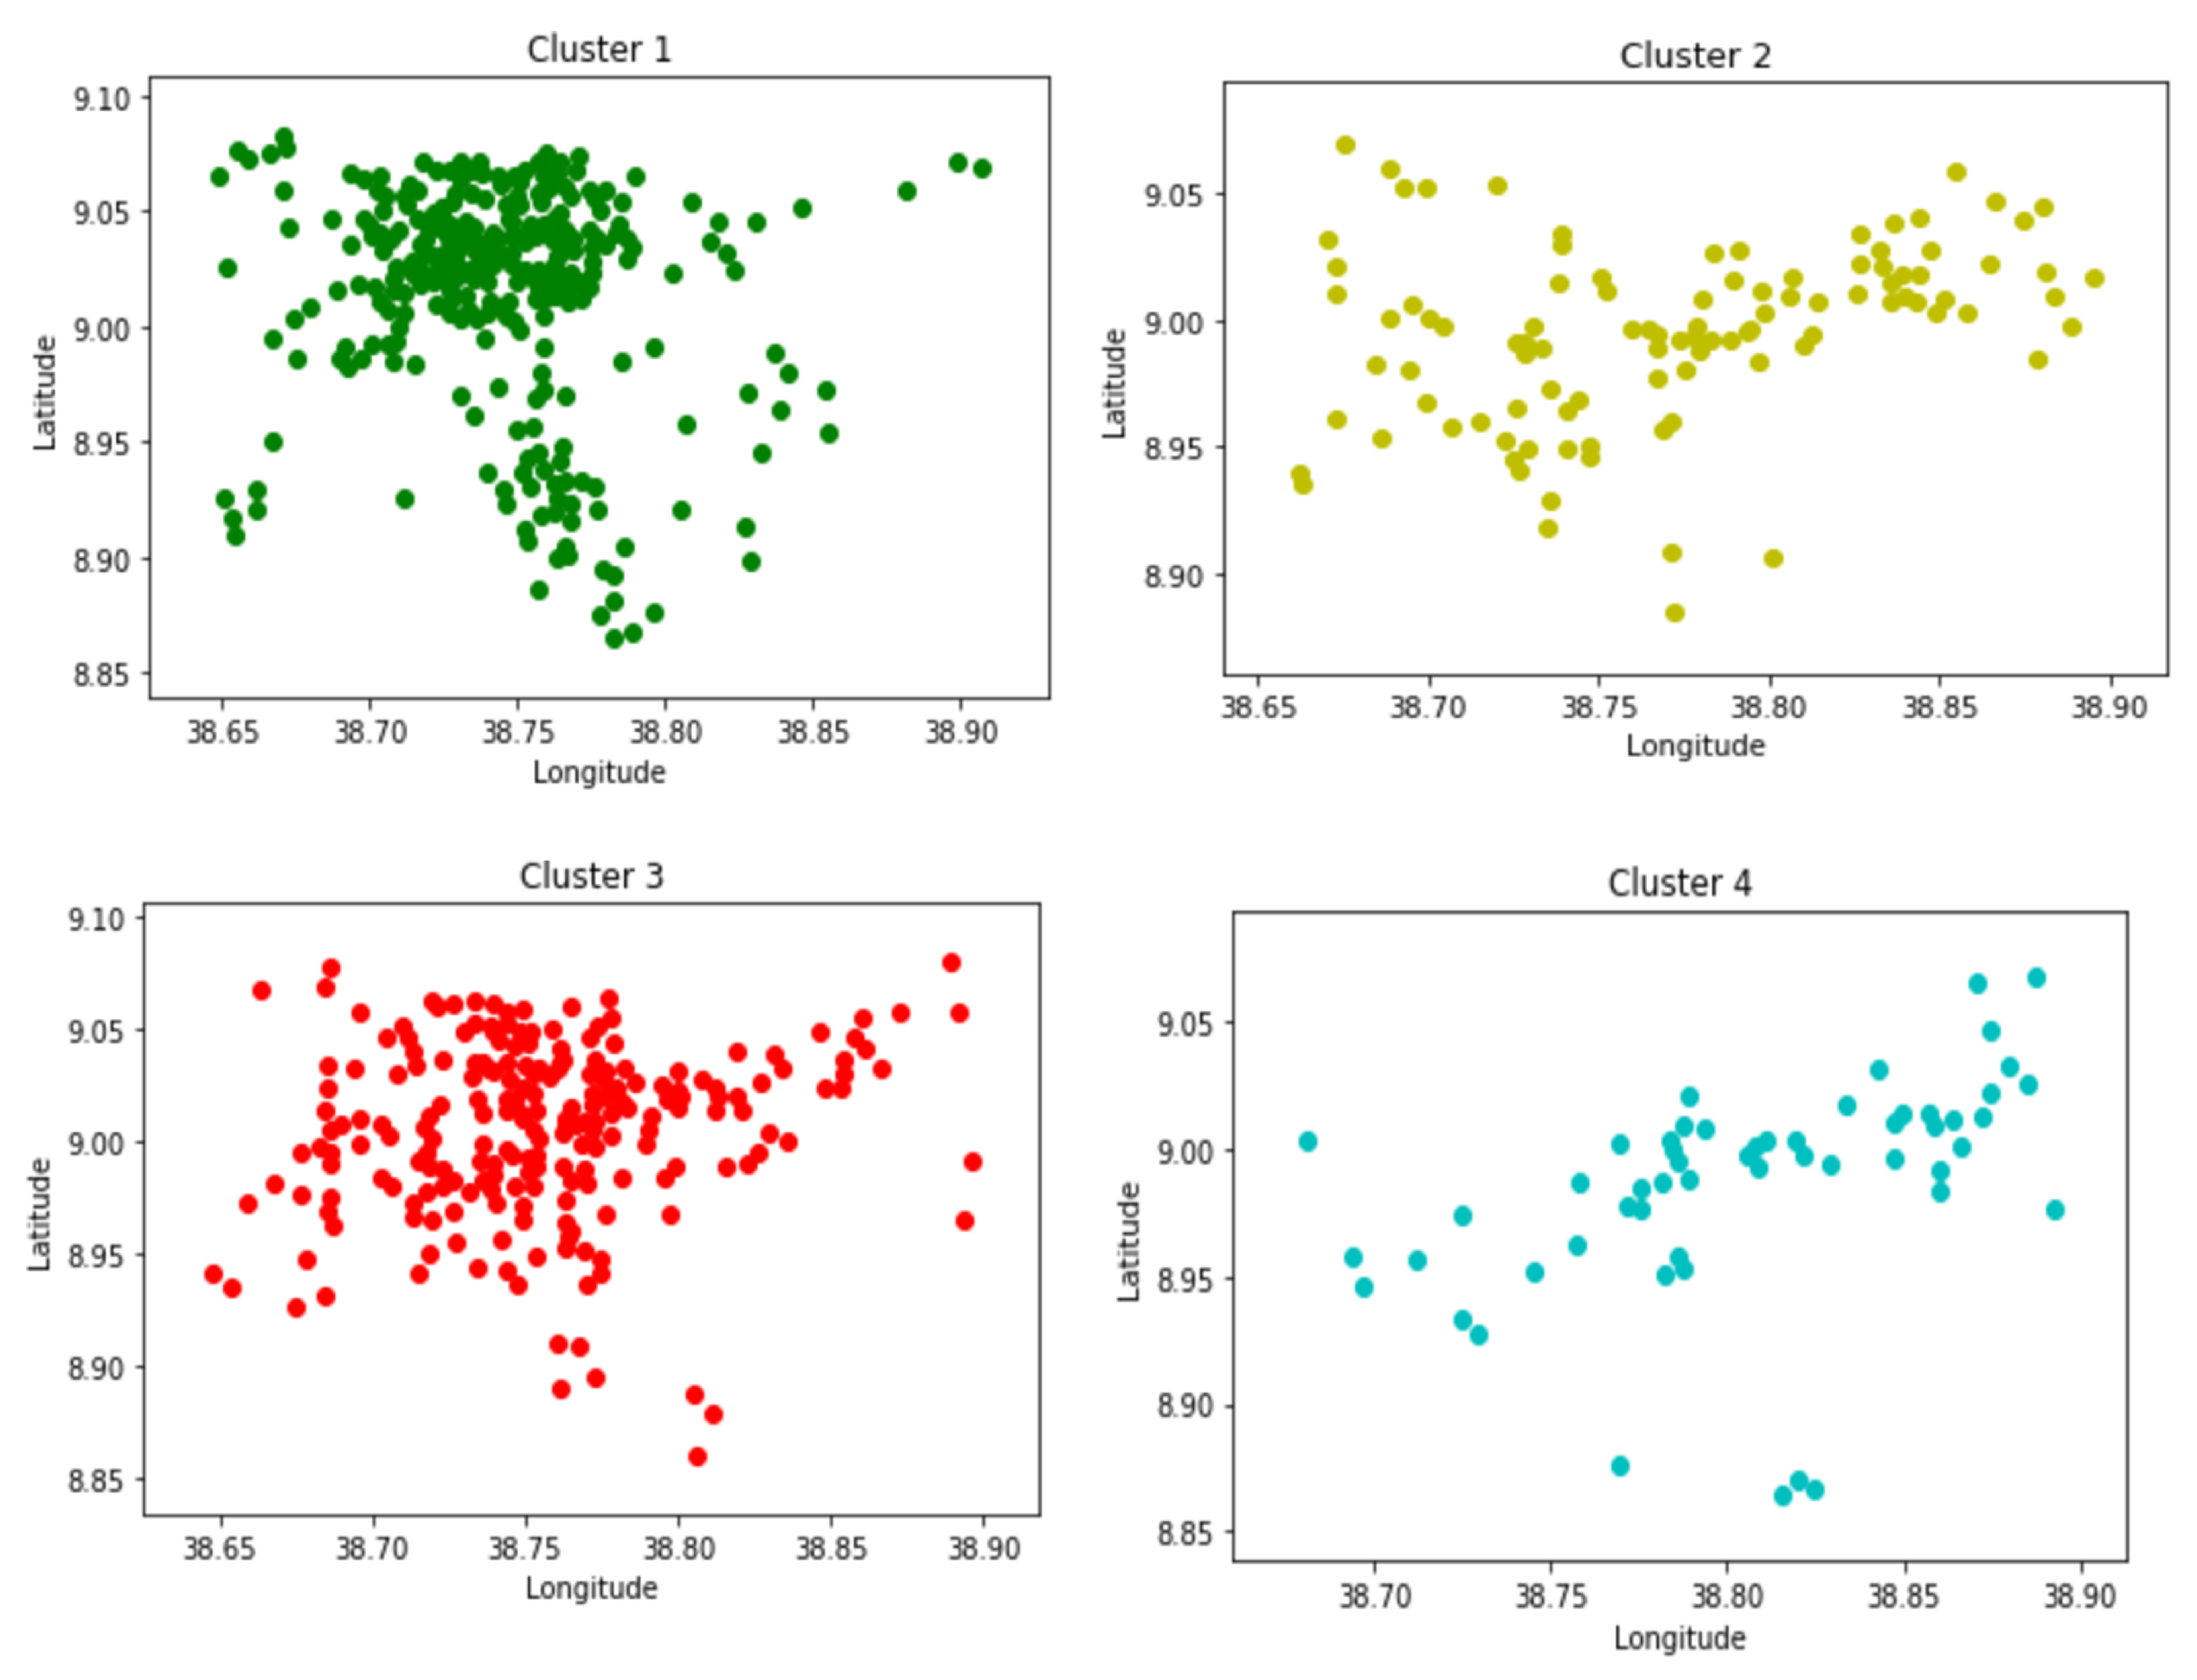
4.1. Clustering

Among different clustering methods, in this work K-Means clustering is selected. Elbow method and silhouette score are used to determine the optimal number of clusters in K-Means clustering and to evaluate the goodness of a clustering technique, respectively. For our data, the optimal number of clusters is selected to be four and the sites are grouped into four clusters, as shown in Figure 5. We note how sites from various geographical areas are grouped into the same cluster because of similarities in their traffic patterns. Moreover, some base stations found in the same locations are grouped into different clusters.

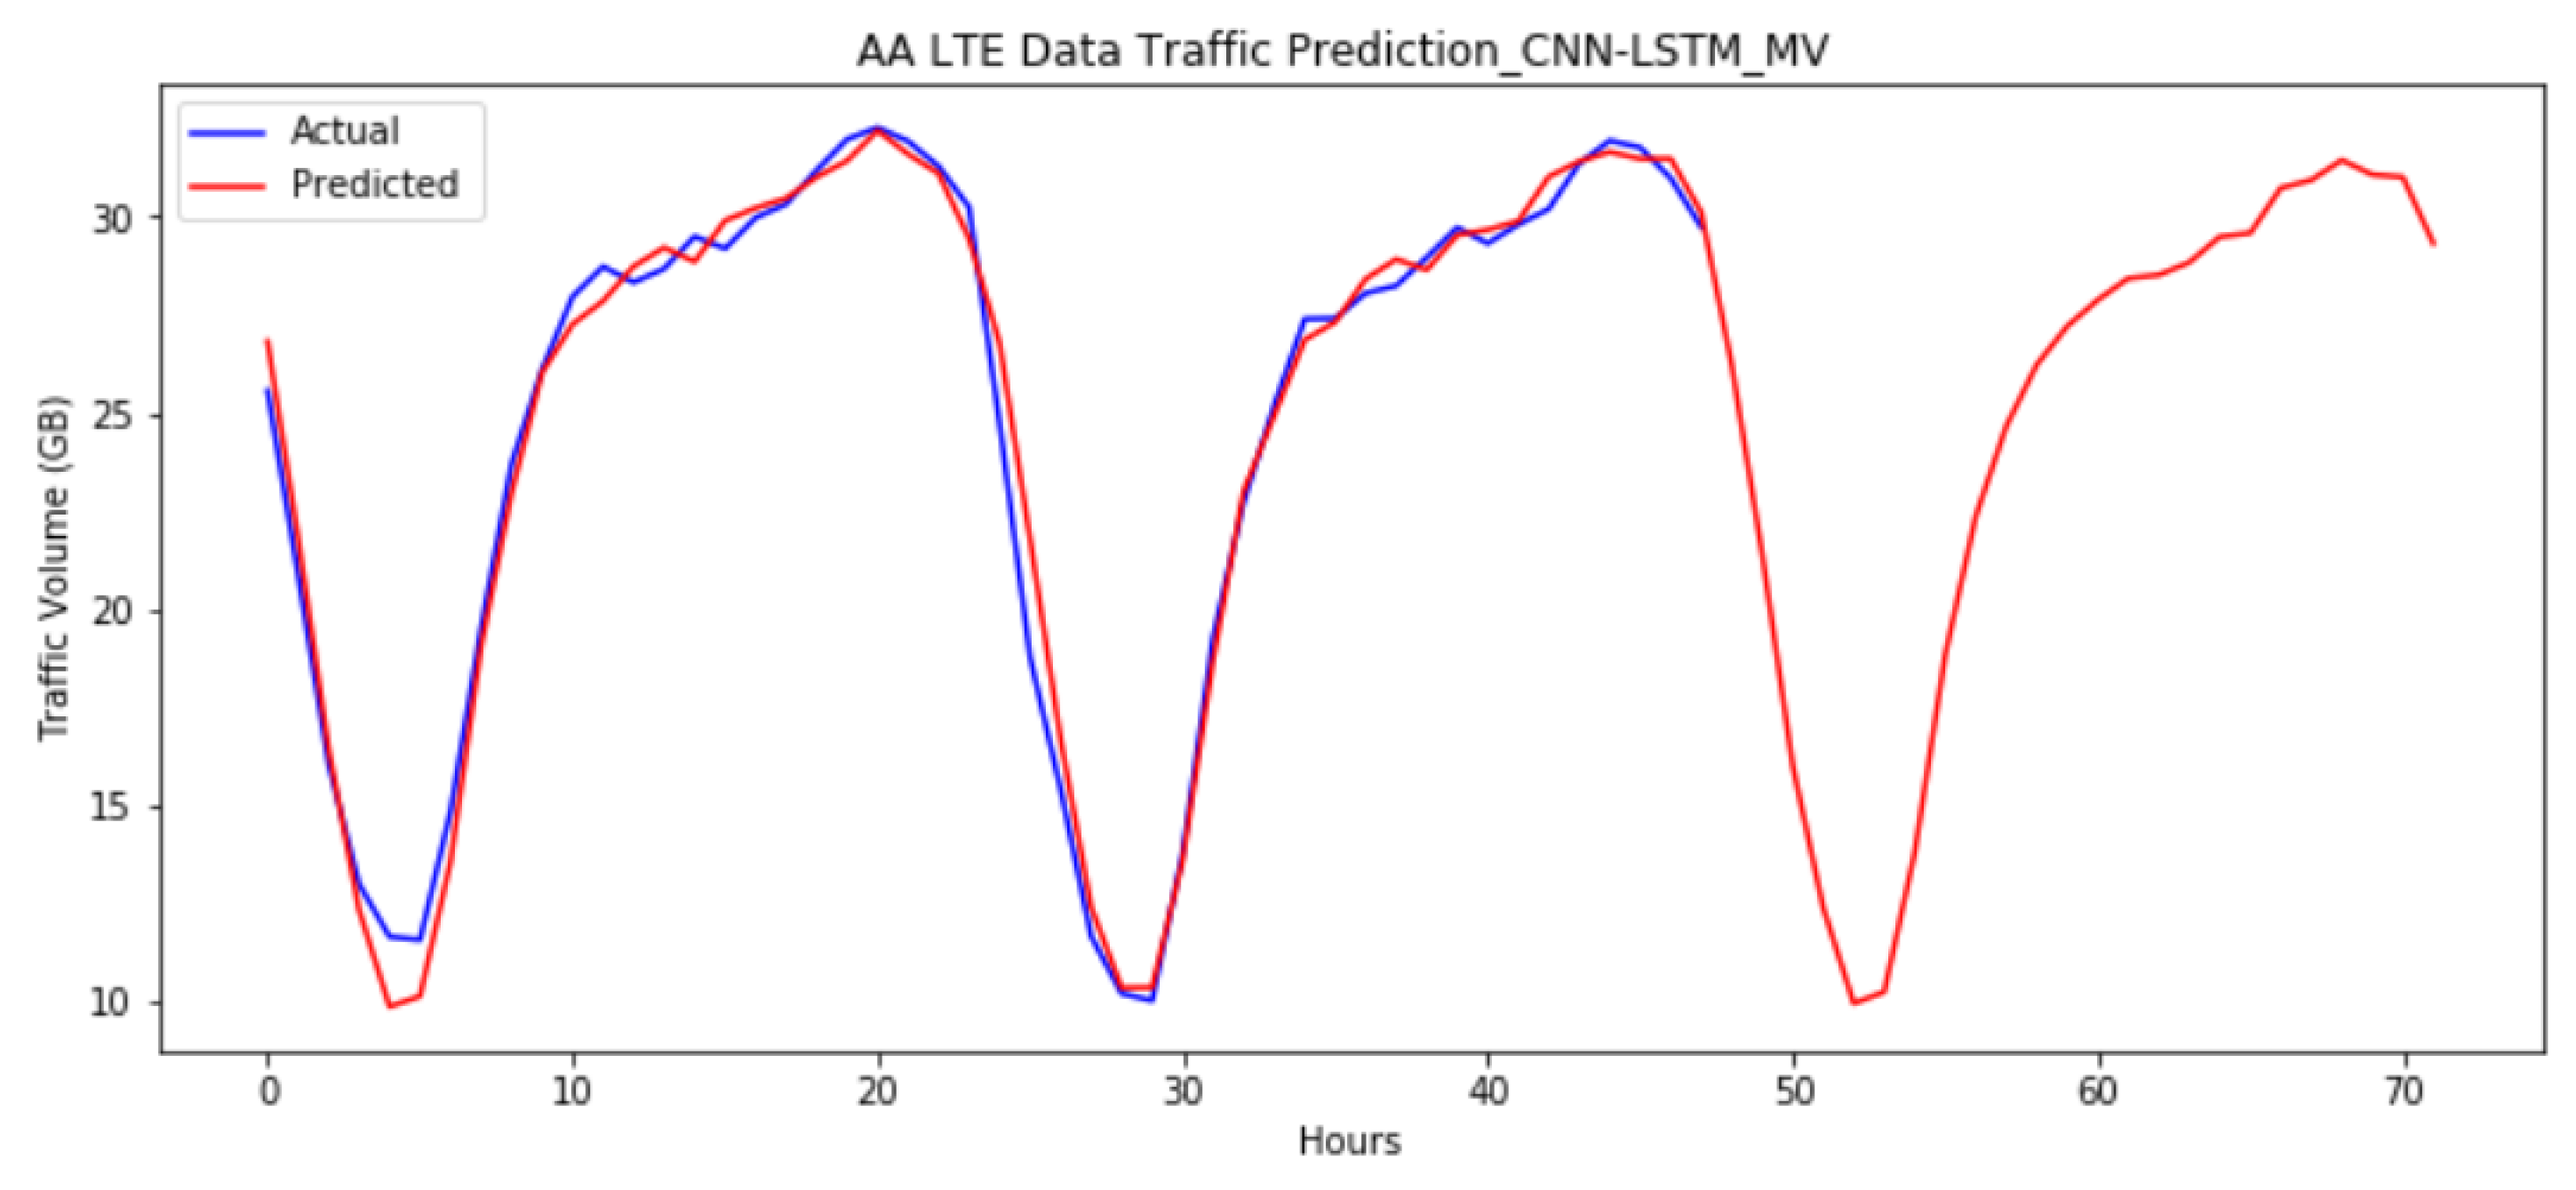
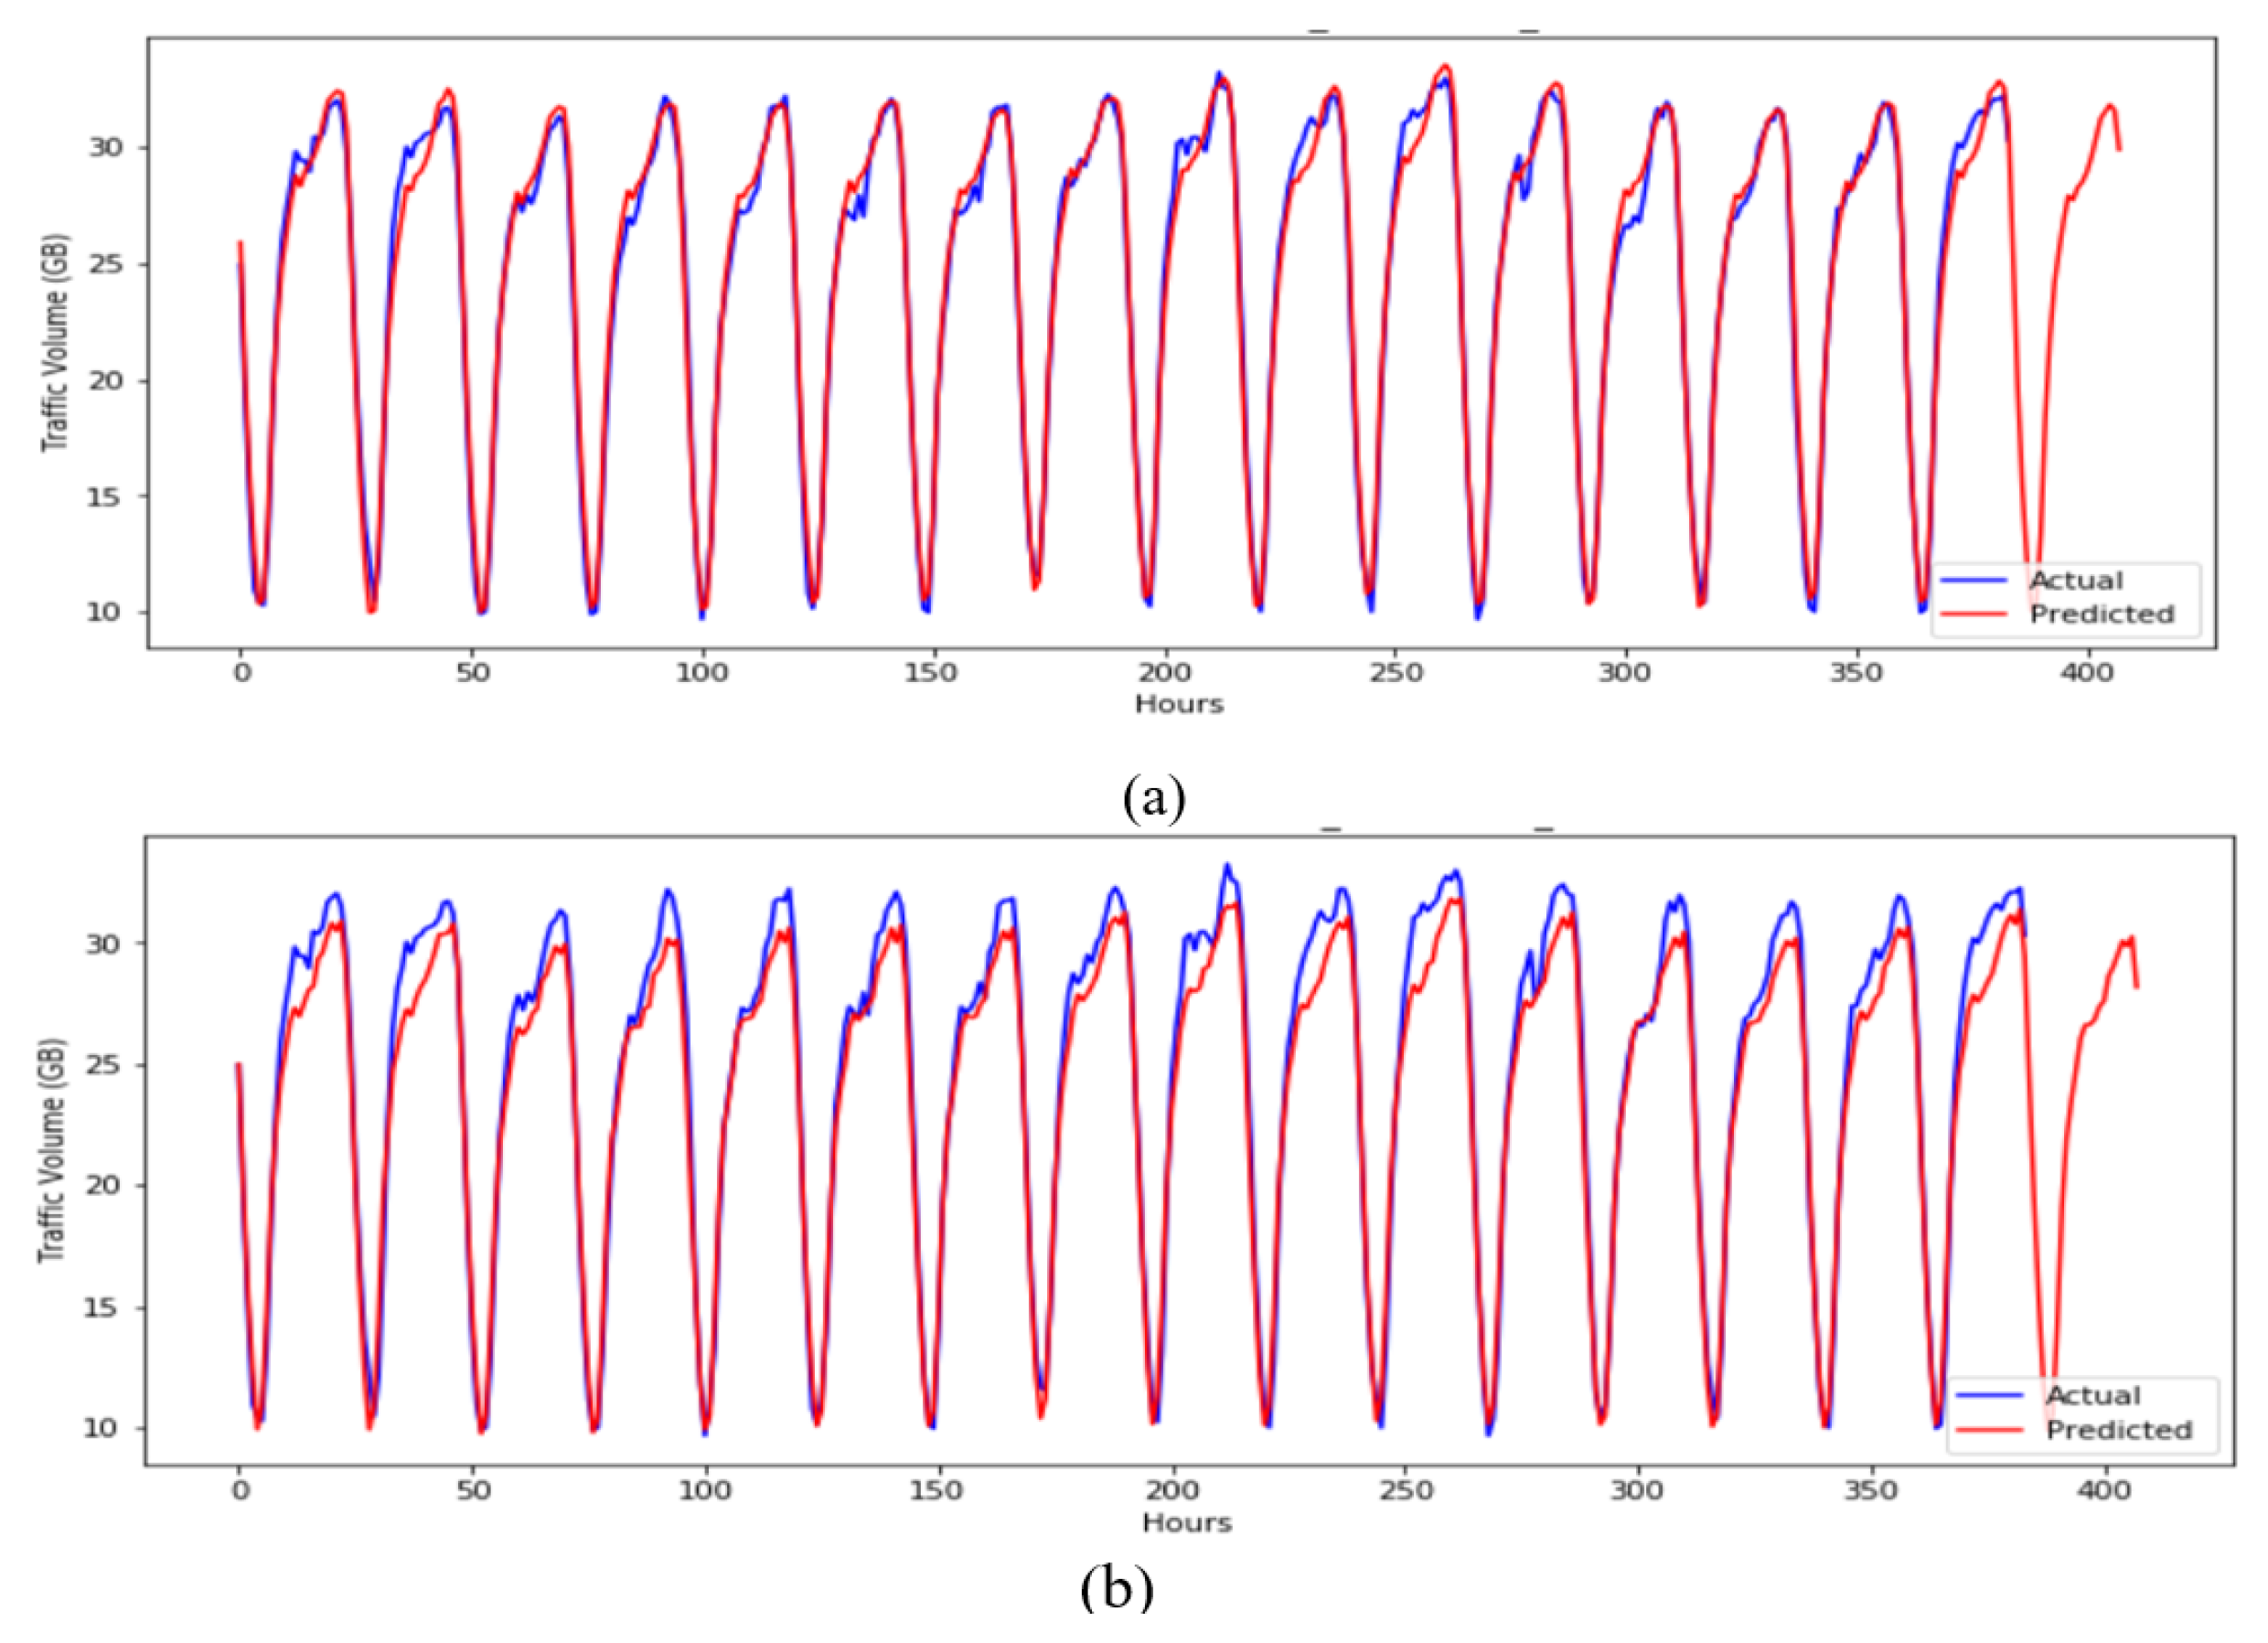
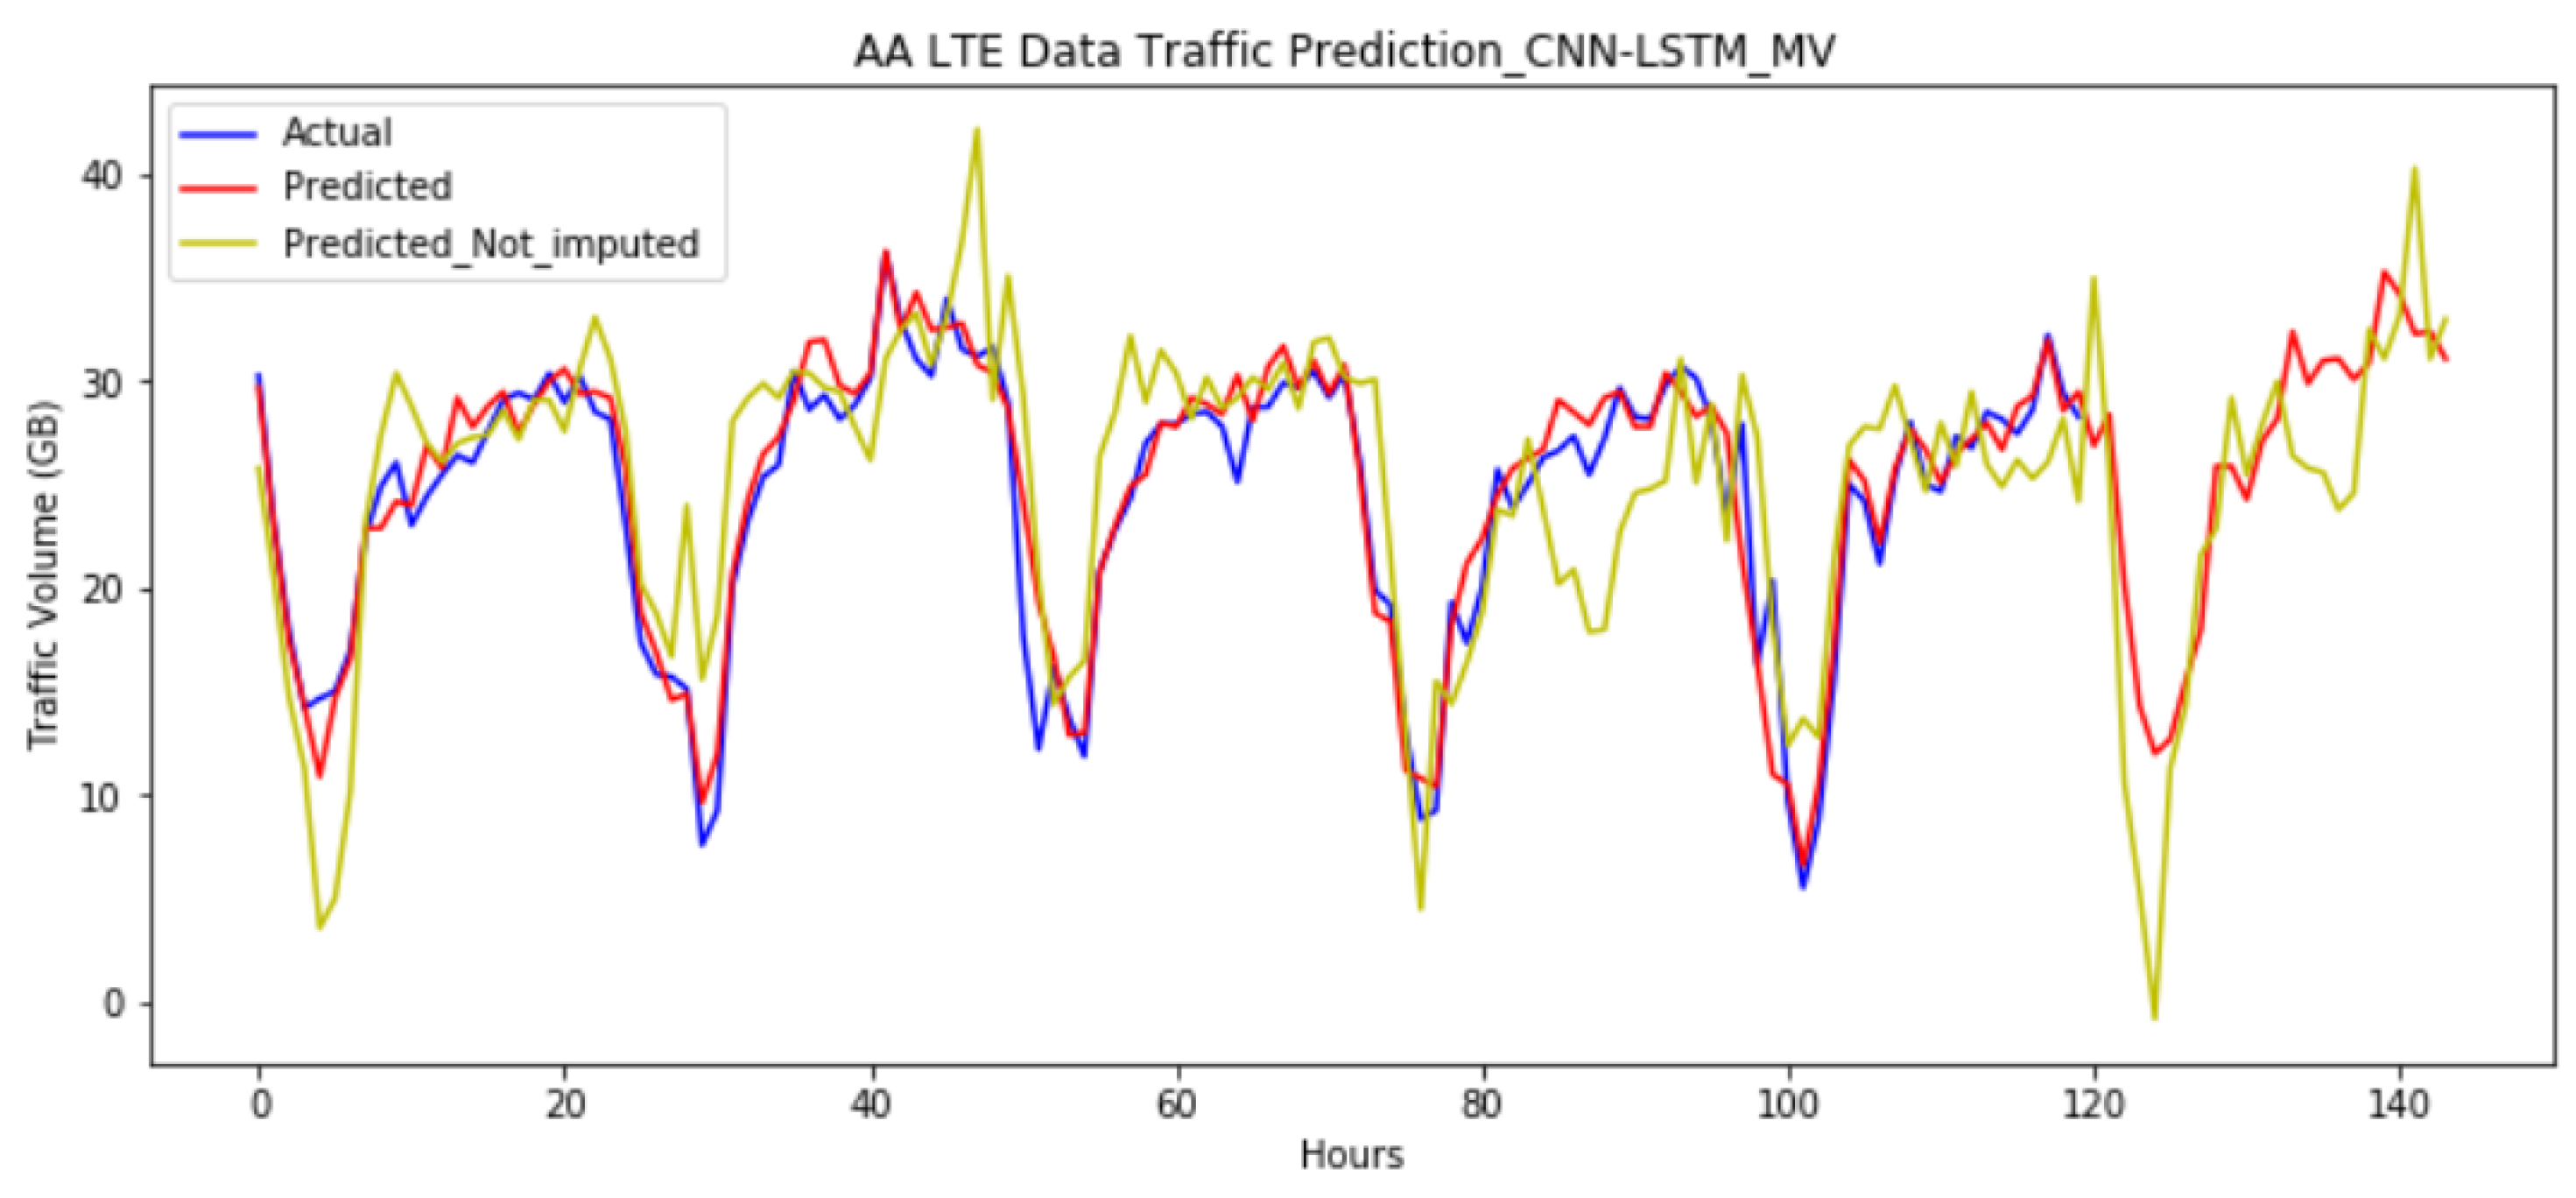
4.2. Per Cluster Time-Series Predictions

Figure 6 shows the actual and predicted values of mobile data traffic, using multi-variate features in Figure 6a, and univariate feature Figure 6b. In both cases, the predicted data traffic has a similar pattern, in terms of daily seasonality, when compared with the actual data traffic. Comparing predicted results in (a) and (b), we note that including multiple features in a multivariate manner helps to capture the irregularities and edges that occur during peak hours. The improved result with multivariate features also demonstrates the ability of the deep learning model, CNN-LSTM, to extract salient information from complex data required for prediction. Table 1 depicts a comparison in terms of RMSE and MAPE.
The proposed model performance is compared with the CNN-only model with univariate and multivariate features models as also summarized in Table 1. The result confirms the performance improvements because of the hybrid CNN-LSTM model as well as the consideration of multivariate features.
Furthermore, the impact of filling the missing values and input time steps are analyzed. The results in Figure 7 and Table 2 show the model performance with and without imputing the missing values in the datasets. The model output shows that, while the model captures traffic variation for the imputed dataset well, not filling in the missing values degrades the prediction result.
The effect of the input time steps while developing a prediction model is investigated with two input time steps of 24 h and 168 h. Figure 8 and Table 3 illustrate the data traffic prediction for the CNN-LSTM model using 168 h input time steps compared to the actual data traffic, and it captures the data traffic variation well, including for irregular shapes and sharp edges at both ends. However, this modest performance improvement comes at the expense of computational time. The model with 168 input time steps took more time to train the model.

5. Conclusions

Due to the increasing demand for mobile data traffic, the cellular network capacity is changing continuously and predictive models become inevitable in capturing the dynamics of mobile data traffic. In this paper, a deep learning-based model, CNN-LSTM, is proposed for mobile data traffic prediction using multivariate features. The hybrid CNN-LSTM networks leverage the power of the CNN model to extract salient features in the complex and nonlinear dataset as well as an LSTM to capture long–short dependency for time series data. The study shows the prediction capability of the CNN-LSTM model for mobile data traffic demand along with multivariate input features as compared to univariate features.
Future studies could include investigating the impact of other variants of clustering methods on model performance improvement. Furthermore, incorporating more specific multivariate features such as the amount of spectrum used and RAB attributes such as maximum source data, traffic type, and maximum bit rate might increase model performance and further improve the prediction accuracy.

Author Contributions

Conceptualization, B.S.S., E.M. and D.H.W.; methodology, B.S.S., E.M. and D.H.W.; software, B.S.S., E.M. and T.T.D.; validation, B.S.S. and T.T.D.; formal analysis, B.S.S., E.M. and D.H.W.; investigation, B.S.S. and E.M.; resources, E.M. and D.H.W.; data curation, E.M.; writing—original draft preparation, B.S.S. and E.M.; writing—review and editing, E.M. and D.H.W.; visualization, B.S.S. and E.M.; supervision, D.H.W. and S.P. All authors have read and agreed to the published version of the manuscript.

Funding

This research received no external funding.

Data Availability Statement

Restrictions apply to the availability of these data. Data was obtained from Ethio Telecom (a Mobile Network Operator) and are available from the corresponding author with the permission of Ethio Telecom.

Conflicts of Interest

The authors declare no conflict of interest.

References

  1. Shi, W. Almost One Zettabyte of Mobile Data Traffic in 2022—Cisco. Telecoms.com, 20 February 2019. Available online: https://telecoms.com/495666/almost-one-zettabyte-of-mobile-data-traffic-in-2022-cisco/ (accessed on 3 October 2020).
  2. GSMA. Data Demand Explained. June 2015. Available online: https://www.gsma.com/spectrum/wp-content/uploads/2015/06/GSMA-Data-Demand-Explained-June-2015.pdf (accessed on 6 August 2021).
  3. Do, Q.H.; Doan, T.T.H.; Nguyen, T.V.A.; Duong, N.T.; Linh, V.V. Prediction of Data Traffic in Telecom Networks based on Deep Neural Networks. J. Comput. Sci. 2020, 16, 1268–1277. [Google Scholar] [CrossRef]
  4. Bhanja, S.; Das, A. Deep Neural Network for Multivariate Time-Series Forecasting. In Proceedings of the 2nd International Conference on Frontiers in Computing and Systems, Singapore, 29 September–1 October 2021; pp. 267–277. [Google Scholar]
  5. Dalgkitsis, A.; Louta, M.; Karetsos, G.T. Traffic forecasting in cellular networks using the LSTM RNN. In Proceedings of the 22nd Pan-Hellenic Conference on Informatics, New York, NY, USA, 29 November–1 December 2018; pp. 28–33. [Google Scholar]
  6. Shawel, B.S.; Debella, T.T.; Tesfaye, G.; Tefera, Y.Y.; Woldegebreal, D.H. Hybrid Prediction Model for Mobile Data Traffic: A Cluster-Level Approach. In Proceedings of the International Joint Conference on Neural Networks (IJCNN), Glasgow, UK, 19–24 July 2020; pp. 1–8. [Google Scholar]
  7. Mahdy, B.; Abbas, H.; Hassanein, H.; Noureldin, A.; Abouzeid, H. A Clustering-Driven Approach to Predict the Traffic Load of Mobile Networks for the Analysis of Base Stations Deployment. J. Sens. Actuator Netw. 2020, 9, 53. [Google Scholar] [CrossRef]
  8. Trinh, H.D.; Giupponi, L.; Dini, P. Mobile Traffic Prediction from Raw Data Using LSTM Networks. In Proceedings of the IEEE 29th Annual International Symposium on Personal, In-Door and Mobile Radio Communications (PIMRC), Bologna, Italy, 9–12 September 2018; pp. 1827–1832. [Google Scholar]
  9. Kim, T.Y.; Cho, S.B. Predicting residential energy consumption using CNN-LSTM neural networks. Energy 2019, 182, 72–81. [Google Scholar] [CrossRef]
  10. Li, T.; Hua, M.; Wu, X. A Hybrid CNN-LSTM Model for Forecasting Particulate Matter (PM2.5). IEEE Access 2020, 8, 26933–26940. [Google Scholar] [CrossRef]
  11. Mohammed, B.; Krishnaswamy, N.; Kiran, M. Multivariate Time-Series Prediction for Traffic in Large WAN Topology. In Proceedings of the ACM/IEEE Symposium on Architectures for Networking and Communications Systems (ANCS), Cambridge, UK, 24–25 September 2019; pp. 1–4. [Google Scholar]
  12. Zhang, J.; Zheng, Y.; Qi, D.; Li, R.; Yi, X. DNN-based prediction model for spatio-temporal data. In Proceedings of the SIGSPACIAL ’16: Proceedings of the 24th ACM SIGSPATIAL International Conference on Advances in Geographic Information Systems, Burlingame, CA, USA, 31 October–3 November 2016; pp. 1–4. [Google Scholar]
  13. Wang, X.; Zhou, Z.; Yang, Z.; Liu, Y.; Peng, C. Spatio-temporal analysis and prediction of cellular traffic in metropolis. In Proceedings of the IEEE 25th International Conference on Network Protocols (ICNP), Toronto, ON, Canada, 10–13 October 2017; pp. 1–10. [Google Scholar]
  14. Aghabozorgi, S.; Seyed Shirkhorshidi, A.; Ying Wah, T. Time-series clustering: A decade review. Inf. Syst. 2015, 53, 16–38. [Google Scholar] [CrossRef]
  15. Rajagukguk, R.; Ardiansyah Ramadhan, R.A.; Lee, H.J. A Review on Deep Learning Models for Forecasting Time Series Data of Solar Irradiance and Photovoltaic Power. Energies 2020, 13, 6623. [Google Scholar] [CrossRef]
  16. Terefe, T.; Devanne, M.; Weber, J.; Hailemariam, D.; Forestier, G. Time Series Averaging Using MultiTasking Autoencoder. In Proceedings of the IEEE 32nd International Conference on Tools with Artificial Intelligence (ICTAI), Baltimore, MD, USA, 9–11 November 2020; pp. 1065–1072. [Google Scholar]
  17. Xu, G.; Ren, T.; Chen, Y.; Che, W. A One-Dimensional CNN-LSTM Model for Epileptic Seizure Recognition Using EEG Signal Analysis. Front. Neurosci. 2020, 14, 1253. [Google Scholar] [CrossRef] [PubMed]
  18. Mare, E. Mobile Data Traffic Prediction Using Multivariate Time Series Data: The Case of LTE Network in Addis Ababa. Master’s Thesis, Addis Ababa University, Addis Ababa, Ethiopia, 2021. [Google Scholar]
  19. Cecaj, A.; Lippi, M.; Mamei, M.; Zambonelli, F. Comparing Deep Learning and Statistical Methods in Forecasting Crowd Distribution from Aggregated Mobile Phone Data. Appl. Sci. 2020, 10, 6580. [Google Scholar] [CrossRef]
  20. Brownlee, J. Deep Learning for Time Series Forecasting: Predict the Future with MLPs, CNNs and LSTMs in Python; Machine Learning Mastery: Vermont, Australia, 2018. [Google Scholar]
Figure 1. Data traffic pattern for sample LTE sites located at A and B.
Engproc 18 00010 g001
Figure 2. Feature correlation results.
Engproc 18 00010 g002
Figure 3. 2D and 1D CNN model input type and kernel slide direction [18].
Engproc 18 00010 g003
Figure 4. Proposed CNN-LSTM Hybrid Model.
Engproc 18 00010 g004
Figure 5. 4G eNodeBs geographical distribution in each cluster.
Engproc 18 00010 g005
Figure 6. Mobile data traffic prediction with CNN-LSTM model (a) multivariate features (b) univariate feature.
Engproc 18 00010 g006
Figure 7. Model prediction for with and without imputation of missing value.
Engproc 18 00010 g007
Figure 8. CNN-LSTM model prediction output for 168 input time steps.
Engproc 18 00010 g008
Table 1. Model performance comparison.
FeaturesRMSEMAPE
Proposed CNN-LSTM Model, Multivariate0.812.97
Proposed CNN-LSTM Model, Univariate1.284.48
CNN Model Multivariate1.344.44
CNN Model Univariate1.536.20
Table 2. Effect of filling missing value.
CNN-LSTMRMSEMAPE
With missing values imputation2.016.88
Without missing values imputation4.5619.01
Table 3. Model performance comparison for 24 and 168 input time steps.
Input Time StepRMSEMAPE
24 h0.812.97
168 h0.782.69
Publisher’s Note: MDPI stays neutral with regard to jurisdictional claims in published maps and institutional affiliations.

