Abstract
Global modernization efforts focus on increasing aviation system capacity and efficiency, while maintaining high levels of safety. To accomplish these objectives, new analysis methods are required that consider Air Traffic Management (ATM) system operations at both the flight level and the airspace level. With the expansion of ADS-B technology, open-source flight tracking data has become more readily available to enable larger-scale analyses of aircraft operations. Specifically, anomaly detection has been identified as being paramount. However, previous analyses of airspace-level operational states have not considered the observation of transitional (transitioning between two distinct airspace-level operational patterns) or anomalous operational states. Therefore, a method is proposed in which the time-series trajectory data of all aircraft operating within a terminal airspace during a specified time period is aggregated to generate a representation of the airspace-level operational states such that a recursive DBSCAN procedure to characterize airspace-level operational states as either nominal, transitional, or anomalous as well as to identify the distinct nominal operational patterns. This method is demonstrated on one year of ADS-B trajectory data for aircraft arriving at San Francisco International Airport (KSFO). Overall, visual inspection of results indicate the method’s promise in assisting ATM system operators, decision-makers, and planners in designing the implementation of new operational concepts.
1. Introduction and Background
Air Traffic Management (ATM) systems are tasked with managing the operations of some of the world’s most complex system-of-systems as they are responsible for the operations of all aircraft. The ATM services operate interdependently to ensure the safe and efficient operation of all aircraft within an airspace. For instance, Air Traffic Flow Management (ATFM) focuses more on the broader systems (airspace-level) approach to managing air traffic and supports Air Traffic Control (ATC), an Air Traffic Service (ATS) that provides flight-level instructions, in achieving the most efficient utilization of airspace/airport capacity, considering imposed safety constraints. Hence, ATM systems undoubtedly impact operations at both the flight level and the airspace level. In this context, the flight level refers to the operations of a single flight within an airspace, whereas the airspace level refers to the operations of multiple flights within an airspace.
The vast complexity of ATM systems and flight- and airspace-level interactions will continue to increase as air traffic volume increases and Advanced Air Mobility (AAM) concepts are introduced in the airspace. Though, existing ATM systems continue to be limited by outdated technologies and operational procedures [1]. Hence, global ATM system modernization efforts, such as the Federal Aviation Administration’s (FAA’s) Next Generation Air Transportation System (NextGen) [2] portfolio in the U.S. and the Single European Sky ATM Research (SESAR) [3] program in Europe, are underway with the primary objectives of increasing system capacity and efficiency, while maintaining high levels of safety through introduction of new technologies and implementation of new operational concepts. A principal objective of the modernization efforts is the implementation of Trajectory Based Operations (TBO), which is intended to enable strategic planning, management, and optimization of trajectories operating within and across various airspace by leveraging time-based management, information exchange between air and ground systems, and an aircraft’s ability to fly precise paths in time and space [4]. TBO is expected to enable collaborative decisions that consider the entire airspace system, providing routes optimized at both the flight level and the airspace level. To provide the basis for successful introduction of the TBO concept, it is of paramount importance to develop methods to assess a flight’s trajectory in the context of the other flights’ trajectories (flight-level analysis). Further, the envisioned TBO is anticipated to result in a less structured airspace due to more flexible trajectory planning, which further underscores the importance of analysis of airspace-level operations.
With the expansion of ADS-B technology, open-source flight tracking data has become more readily available to enable larger-scale analyses of ATM system operations [1]. The trajectory information available in ADS-B messages is the core information that is used by ATM systems as a basis for activities such as distributing flight information to relevant airlines and ATC units, facilitating timely coordination between sectors and units, correlating flight data with tracks, monitoring the adherence of an aircraft to its assigned route, and detecting and resolving conflicts. Considering the advances in modern machine learning techniques, the use of various data-driven methods to gain insights from ADS-B trajectory has been an active area of research. Specifically, anomaly detection has been identified as an important task in improving the capacity, efficiency, and safety of ATM systems, as evidenced by the recent literature on this topic [5]. The existing anomaly detection methods presented in the aviation literature detect flight-level anomalies in either the spatial or energy dimension of aircraft trajectories. Motivated by the limited number of approaches that simultaneously consider both spatial and energy metrics, Corrado et al. [6] introduce the concepts of spatial anomalies and energy anomalies detected at the flight level in ADS-B trajectory data. While detecting anomalies at the flight level provides crucial knowledge to ATM system operators and decision-makers as well as flight crews, it is important to put into context that each individual flight operation is a product of the operations of the larger airspace system, i.e., the individual flight trajectories are not independent. It is not feasible to improve the capacity, efficiency, and safety of ATM systems without analyzing operations, such as performing anomaly detection, at the airspace level.
Unlike an analysis at the flight level, where there exists time-series trajectory data associated with each flight that may be directly analyzed, an analysis of airspace-level operations requires that some time interval be specified over which to aggregate the flight-level operational data, or time-series trajectory data, of all flights operating within the airspace. The aggregation of the time-series trajectory data of all flights operating within an airspace during a specified time interval comprises what may be referred to as an airspace-level operational state, or, simply, operational state. However, the aviation literature related to the airspace-level analysis of operational states is limited.
Mangortey et al. [7] present a method to cluster daily operations at an airport, where metrics such as the number of diversions, Ground Stops, departure delays, etc., are leveraged, to characterize terminal airspace “operational states” as belonging to a specific category on a daily basis. However, the metrics used are not an aggregation of all flights’ trajectories’ time-series metrics. Rather, these metrics are more-so an aggregation of flight metadata, hence, the placement of “operational states” in quotations. Enriquez [8] presents a method to identify temporally persistent flows in the terminal airspace using spectral clustering methods. For each time period in a set of time intervals, a spectral clustering procedure is leveraged to cluster trajectories and identify air traffic flows, where a “nominal line” is computed for each air traffic flow as the point-wise median of all trajectories assigned to the air traffic flow [8]. Air traffic flows that are persistent in time are able to be identified via a clustering of the nominal lines [8]. However, the nominal lines do not represent an aggregation of the operations of all flights operating within an airspace during a specified time interval. Rather, nominal lines represent a flow-level aggregation of multiple flights’ operations. Murça [1] applies a hierarchical clustering algorithm to a set of “flow vectors”, which are the columns of a “flow matrix”, where the columns of the flow matrix indicate which air traffic flows are active during specified time intervals, where the specified time intervals are the rows of the flow matrix. A hierarchical clustering algorithm is applied to reveal primary operational patterns in metroplex terminal airspace systems [1]. An operational pattern may be considered as a set of operational states that conform to a combination of air traffic flows, or an airspace configuration, that is observed regularly. However, Murça [1] does not consider time intervals in which an operational state, or flow vector, does not align with an operational pattern. Further, unique to the specification of a time interval for analysis is that within that time interval there may have occurred a transition between two distinct operational patterns. Therefore, to perform analysis, specifically anomaly detection, at the airspace level, requires the characterization of operational states as either: nominal (conforming to a distinct operational pattern), transitional, or anomalous. Additionally, it is valuable to not only characterize an operational state as nominal, but also identify the operational pattern to which it belongs. For instance, identification of distinct operational patterns may enable aggregate noise analysis at airports [9]. Thus, considering the previous observations, the following research objective is proposed for this work:
Research Objective: Demonstrate the characterization of terminal airspace operational states as either nominal, transitional, or anomalous and identify distinct operational patterns.
Due to the terminal airspace operations’ significance in overall ATM system performance as well as their focus in the aviation literature, this work similarly focuses on the terminal airspace operations. Specifically, arriving aircraft within the terminal airspace experience the highest incident rate; thus, the arriving aircraft trajectories during specified time intervals are considered. Specifically, disturbances in spatial operations of aircraft at the airspace level, or lack of conformance to nominal operations, within the terminal airspace may be realized as delays (efficiency losses) or potential reduction in safety margins.
2. Method
To perform the characterization of operational states, including the identification of operational patterns, requires an adequate representation of operational states. Moreover, a procedure by which to characterize the operational states as either nominal, transitional, or anomalous and identify the operational patterns is required. Therefore, the proposed representation of operational states is discussed as well as the proposed procedure to characterize the operational states and identify the operational patterns.
2.1. Operational State Representation
Previous airspace-level analysis efforts tend to rely on the air traffic flow identification task to generate a representation of air traffic flows. For instance, Murça [1] represents the operational states as the flow vectors in the flow matrix, which requires prior air traffic flow identification to have been performed across all trajectories in all time intervals. Then, an air traffic flow is considered to be “active” within a specified time interval if at least one trajectory is associated with that flow. Thus, there is a loss of information related to the distribution of trajectories within the airspace as the trajectories that compose the air traffic flow may be very “tight” or “spread out”. Moreover, information related to the distribution of trajectories across air traffic flows is lost. Further, spatial anomalies are neglected in this case as well as go-arounds, which are an important aviation event [10]. Therefore, a representation of the operational states that does not rely on identification of air traffic flows is advantageous.
It is noted that the coordinate pairs representing the spatial metrics of each trajectories are two-dimensional (2D), whether they are represented as longitude/latitude coordinates or Cartesian coordinates resulting from a projection of the longitude/latitude coordinates. Thus, it is possible to consider the trajectory’s spatial metrics coordinate pairs as points on a 2D grid. For each trajectory, it is possible to “fill” the spaces on the 2D grid that the trajectory passes through. Expressed mathematically, the 2D grid may be considered to be a 2D matrix of zeros, where the “filling” of a grid space, if a trajectory passes through it, may be represented by inserting a 1 into the matrix entry corresponding to the grid space. This matrix may be referred to as a trajectory matrix. Figure 1 displays this concept for a simple grid and sample trajectories (in the slightly darker gray, with 1’s present and the red line pass through), entering the airspace and arriving at the airport location, which is at the center of the matrix in this example. It is possible to create trajectory matrices for each arriving aircraft trajectory within the terminal airspace. Further, it is possible to then sum the trajectory matrices for all flights operating within a specified time interval. This matrix may be referred to as the airspace matrix, displayed in Figure 1. The airspace matrix enables the information for all flights operating within an airspace during a specified time interval to have some representation in the aggregation as well as providing more of an indication of the distribution of trajectories within the airspace as opposed to the basic air traffic flow representation of the aggregation of flights. However, the number of flights arriving at an airport varies throughout the day. Therefore, some time intervals would experience higher maximum values for airspace matrix entries. This could result in the identification of operational patterns being skewed towards identifying groupings of time intervals with a similar number of flights. Thus, a normalization step is proposed in which the airspace matrix entries are divided by the total number of trajectory matrices that are summed to generate the airspace matrix. This normalization effectively provides a measure of the density of trajectories within an airspace during a specified time interval. This normalized matrix may be referred to as an airspace density matrix, displayed in Figure 1.
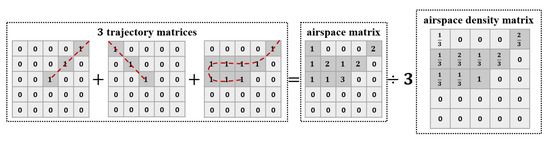
Figure 1.
Computation of the airspace density matrix.
2.2. Operational State Characterization
Once the operational states have been represented by the airspace density matrices, a procedure to perform the operational state characterization and operational pattern identification is required. In previous work, what may broadly be considered to be operational states have been analyzed leveraging clustering algorithms. For instance, Mangortey et al. [7] leverage and compare the performance of various clustering algorithms, including k-Means. Enriquez [8] applies a spectral clustering method. Additionally, Murça [1] applies a hierarchical clustering algorithm. Therefore, in the context of characterizing operational states as either nominal, transitional, or anomalous, the implementation of a clustering algorithm may similarly be appropriate. However, it is important to select a clustering algorithm that provides the capability to detect outliers, such as the DBSCAN (Density-Based Spatial Clustering of Applications with Noise) [11] algorithm.
Therefore, it is proposed to leverage DBSCAN to characterize the operational states. The clusters identified by DBSCAN may be considered to be the nominal operational states, corresponding to operational patterns, such that application of DBSCAN simultaneously identifies operational patterns. An assumption is made that a robust application of DBSCAN would identify the operational states of those time intervals that are experiencing a transition from one operational pattern to another as being an outlier. Therefore, by comparing the operational pattern (cluster) assigned to the operational states corresponding to time intervals directly before and after an operational state that has been detected as being an outlier, it is possible to determine if the time interval has been detected as being an outlier due to having an operational state that may be characterized as being transitional. All other identified outliers may be characterized as anomalies. Though, once these transitional operational states have been discovered, it is preferable to remove them from consideration of being either nominal or outlying such that characterization and identification results are not skewed. Thus, it is proposed that a recursive DBSCAN approach be taken to characterize operational states and identify operational patterns in which the recursion stops when no more transitional operational states are characterized.
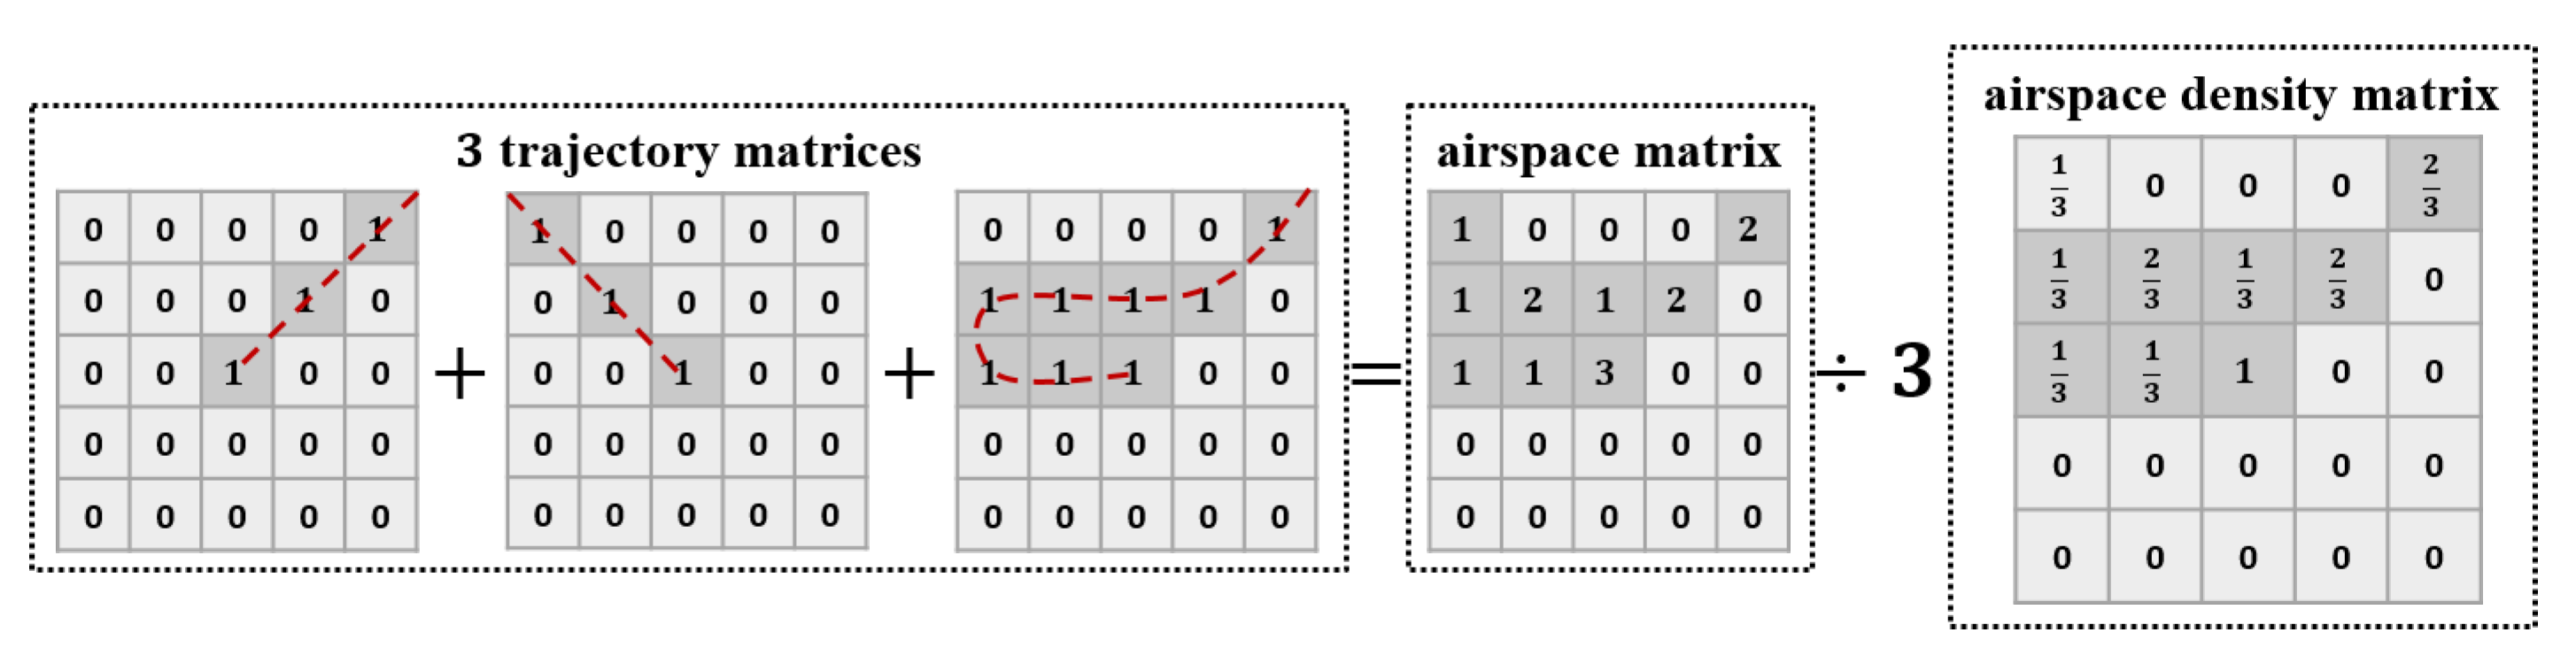
However, it is noted that the airspace density matrices are 2D (the set of airspace density matrices is 3D), whereas DBSCAN requires a 2D feature vector matrix as an input. Thus, the airspace density matrices should be flattened, i.e., stack the rows and/or columns of the matrix into a one-dimensional (1D) vector. This results in a vector of length , where each element in the vector may be considered to be a feature to be considered in the DBSCAN clustering. Therefore, depending on the size of N, there may be a very large number of features to consider. There are a few potential issues that may arise with a large number of features. For instance, there may be an issue with the increase in computation time of the DBSCAN clustering algorithm itself. Therefore, it is advantageous to reduce the dimensionality of the feature vectors. While there exist numerous dimensionality reduction techniques, the Uniform Manifold Approximation and Projection (UMAP) [12] technique is selected due to its ability to preserve some non-linear data relationships and its reduced computation time compared to other non-linear dimensionality reduction techniques. The overall methodology proposed in this work is described in Figure 2.
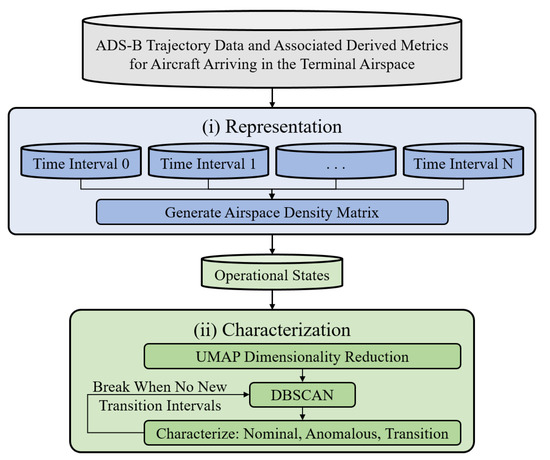
Figure 2.
Methodology.
3. Implementation and Results
A review of the data leveraged and the generation of operational state representations is presented. Subsequently, the implementation of the recursive DBSCAN operational state characterization and operational pattern identification procedure is presented and results are discussed.
3.1. Operational State Representation
ADS-B trajectory data is extracted from the OpenSky Network’s [13] historical database for arriving aircraft at a specified airport. Data is extracted, cleaned, and processed using the same procedure described in [6,14,15] for all aircraft arriving within the San Francisco International Airport (KSFO) terminal airspace in 2019. One hour was selected as length of the time intervals to consider due to the tendency of some airspace-level metrics to be computed on an hourly basis. For instance, the FAA’s ASPM database contains flight metadata information, such as the number of scheduled arrivals, percentage of on-time arrivals, average arrival delay time, etc., on an hourly basis. Therefore, the data set containing all trajectories available was split into hourly data sets containing all trajectories observed during the hour, resulting in 8760 time intervals to consider. However, most airports do not operate 24 h per day. Hence, within the set of 8760 h, some hourly data sets do not contain any trajectories. Approximately 5% of the hourly data sets contain no trajectories. Therefore, these hourly data sets are discarded, leaving 8283 time intervals in which the corresponding data set contains at least 1 trajectory. However, it is asserted that a single trajectory record does not contain sufficient information to perform an airspace-level assessment, as no aggregation of multiple flight-level operations occurs.
Further, it is important to consider the potential outcomes of generating an airspace density matrix for an hour in which a relatively small number of aircraft arrive at an airport. For instance, considering a relatively small number of arriving aircraft trajectories, it is difficult to discern the distribution of the trajectories as the sample size is so small. Further, the impact of spatially anomalous trajectories on the representation of the terminal airspace operational states may be much more pronounced if only a few trajectories are considered. Finally, in the context of ATM system modernization efforts to increase capacity, the operational states of time intervals in which a larger number of aircraft arrive are more relevant than those with fewer arrivals. Therefore, a threshold is set below which time intervals are discarded if the hourly data set does not contain at least this many trajectories. While this threshold may be variable depending upon the configuration of and operations within a specific terminal airspace, for the KSFO terminal airspace this threshold is set at 15. After discarding all hourly data sets that did not contain at least 15 trajectories, 5861 data sets remained for analysis, and airspace density matrices with a grid size of were generated.
3.2. Operational State Characterization
The UMAP dimensionality reduction technique was implemented leveraging the umap [16] Python library such that two components were returned, i.e., the dimension of the feature vectors was reduced from 2500 to 2. Subsequently, the UMAP components were normalized leveraging the sklearn [17] Python library’s z-normalization capability. Then, the recursive DBSCAN procedure was implemented leveraging the sklearn Python library’s DBSCAN module. The DBSCAN minimum cluster size parameter was set at 2% of the total number of time intervals. The value of 2% of the total number of time intervals was selected considering that the official SFO west plan is said to be observed 98–95% of the time, which would leave, potentially, 2% of the time that the official SFO south east plan may occur (https://www.flysfo.com/community/noise/sfo-flight-patterns-and-operations, accessed on 15 November 2021). Therefore, setting a value of the minimum cluster size parameter greater than 2% of the total number of time intervals may result in operational states corresponding to operational patterns associated with the official SFO south east plan being identified as being outlying by the DBSCAN algorithm.
There exists a monotonic relationship between the fraction of outliers identified and the DBSCAN radius parameter for a fixed value of minimum cluster size. Therefore, the value of was varied until the fraction of outliers identified was between 0.01 (1%) and 0.02 (2%) for each recursion in the procedure. The fraction of outliers identified was specified as between 0.01 and 0.02 due to the property of the outlying operational states being characterized as anomalous in the last recursion. Anomalies are, inherently, rare events. Thus, it is desirable to detect only a small portion of a data set as anomalies, especially when there is no ground truth or prior work related to airspace-level anomalous operational states. A goal in detecting anomalous operational states is to narrow down the set of time intervals that SMEs, operators, planners, and decision-makers should place the most emphasis on understanding due to their abnormal characteristics. Accordingly, it is desirable to begin with a smaller set. Recall that the operational patterns are considered as the groups of operational states assigned to clusters by DBSCAN.
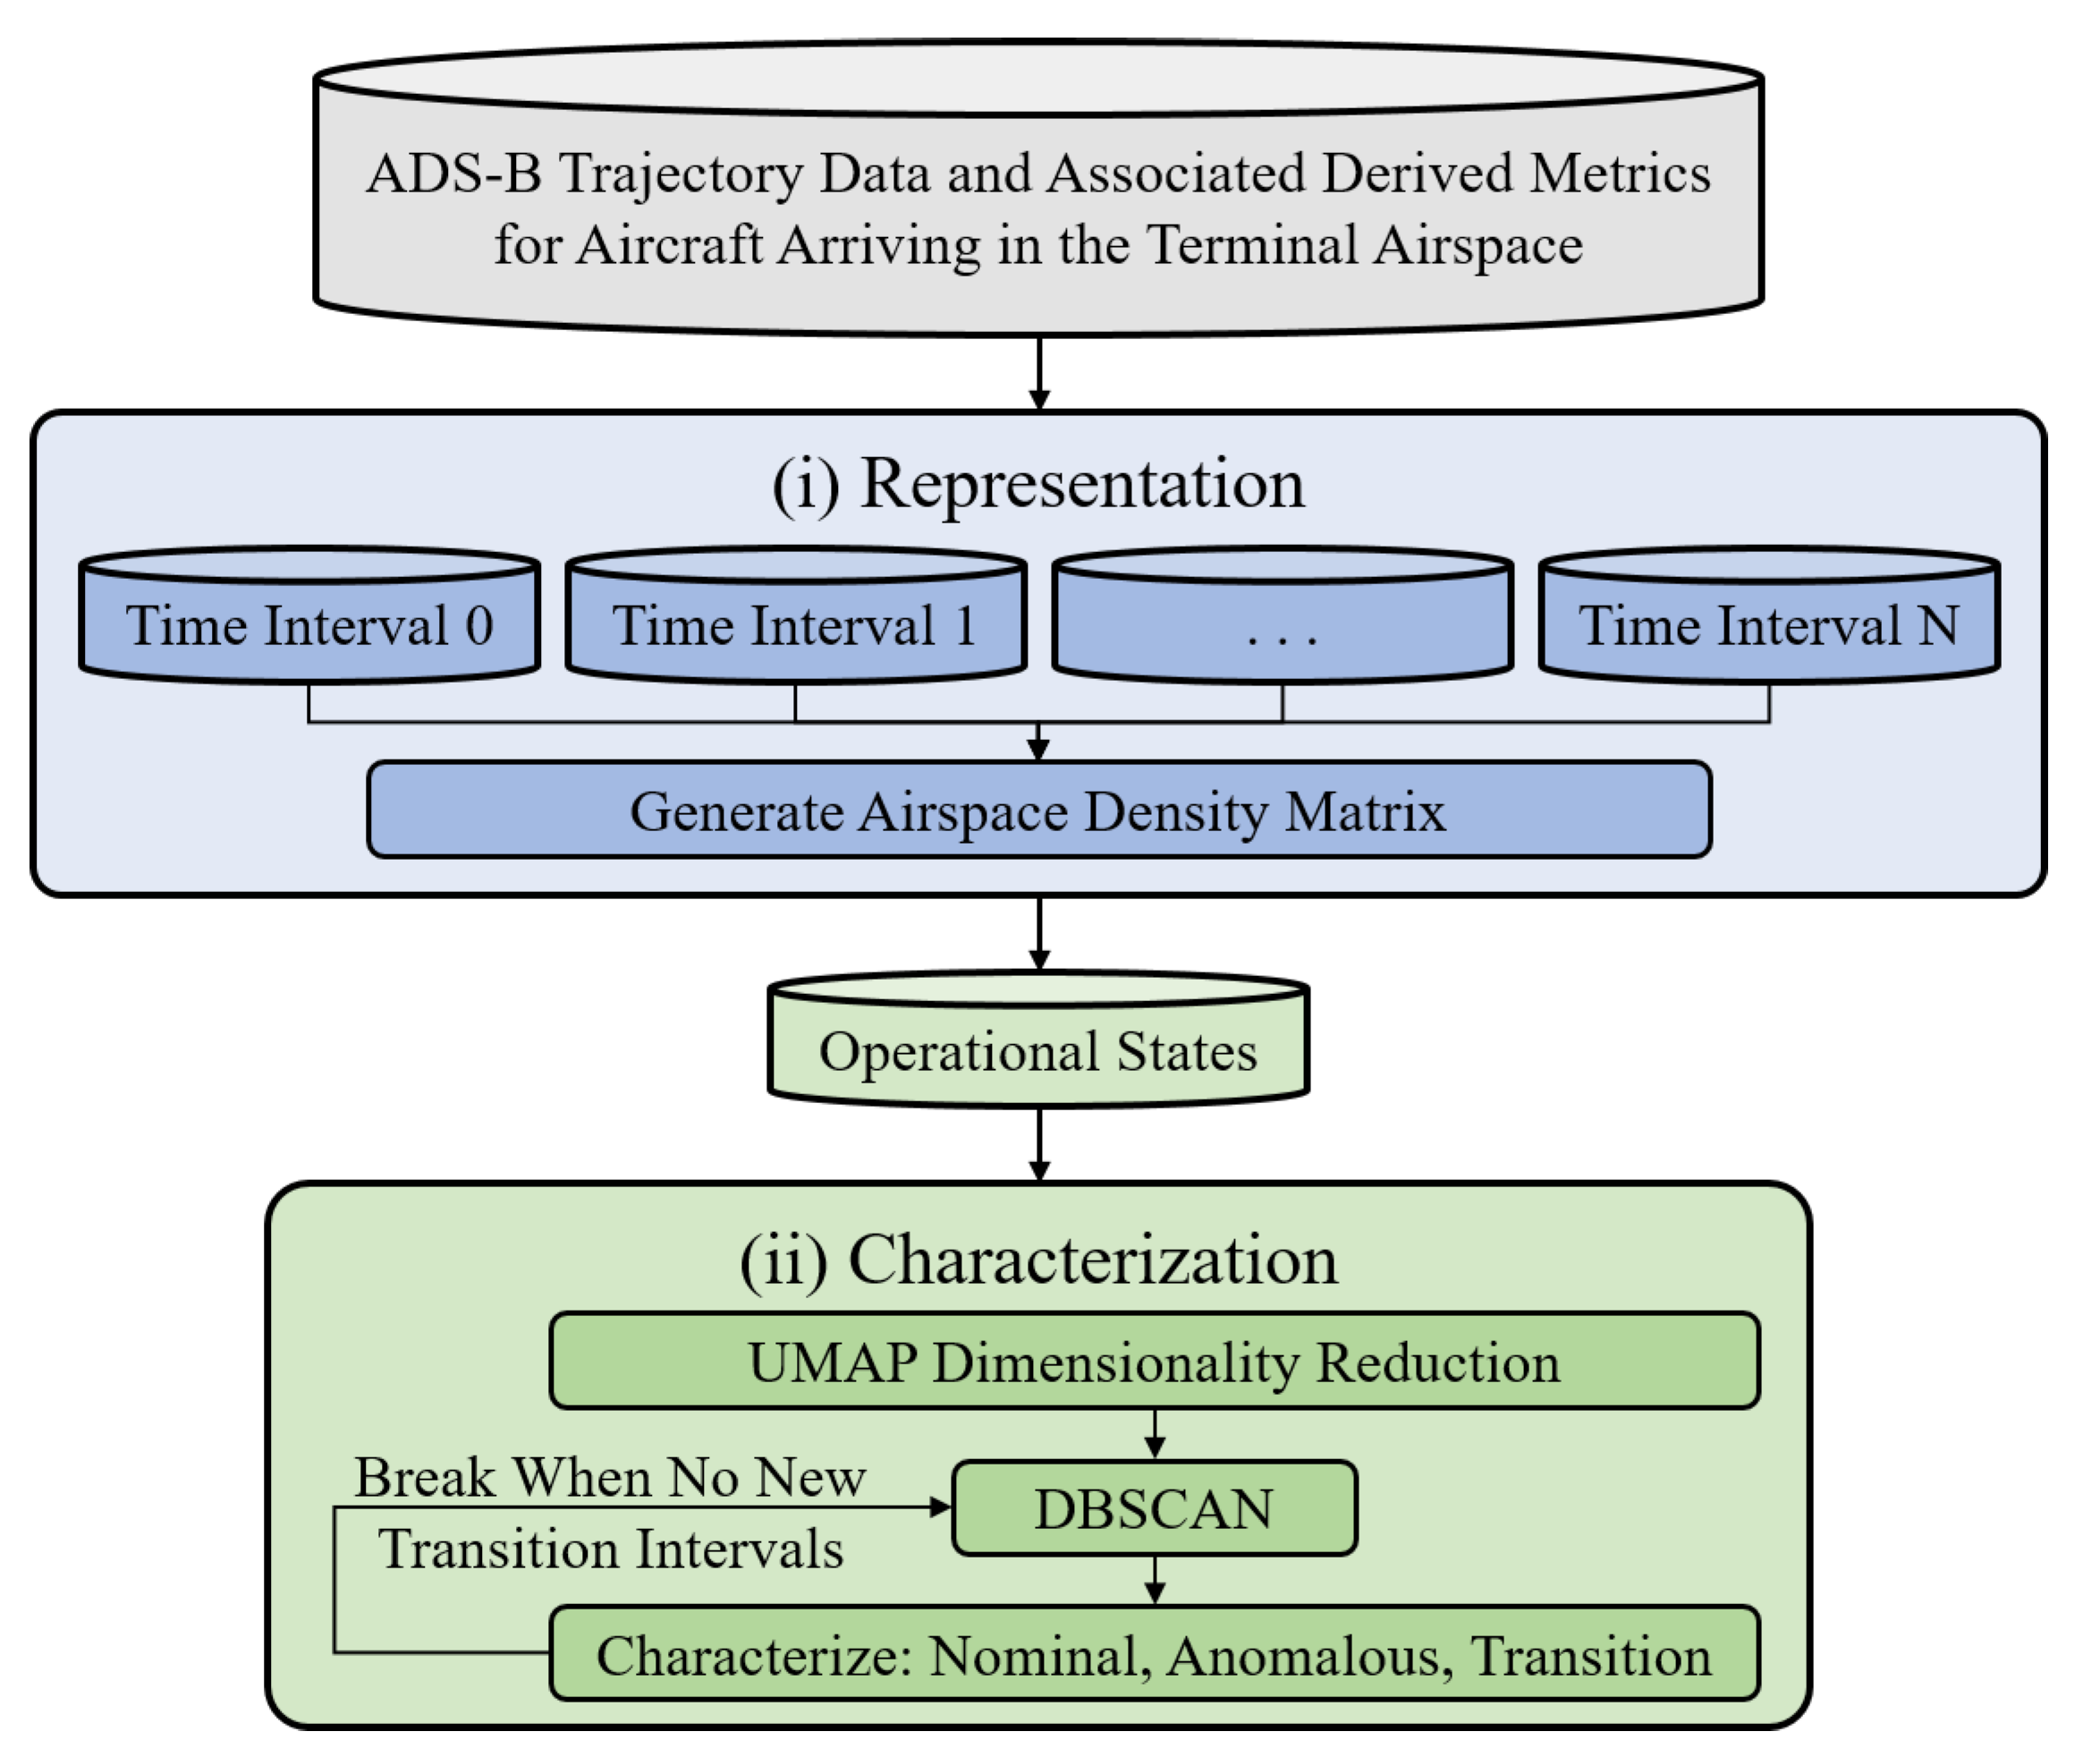
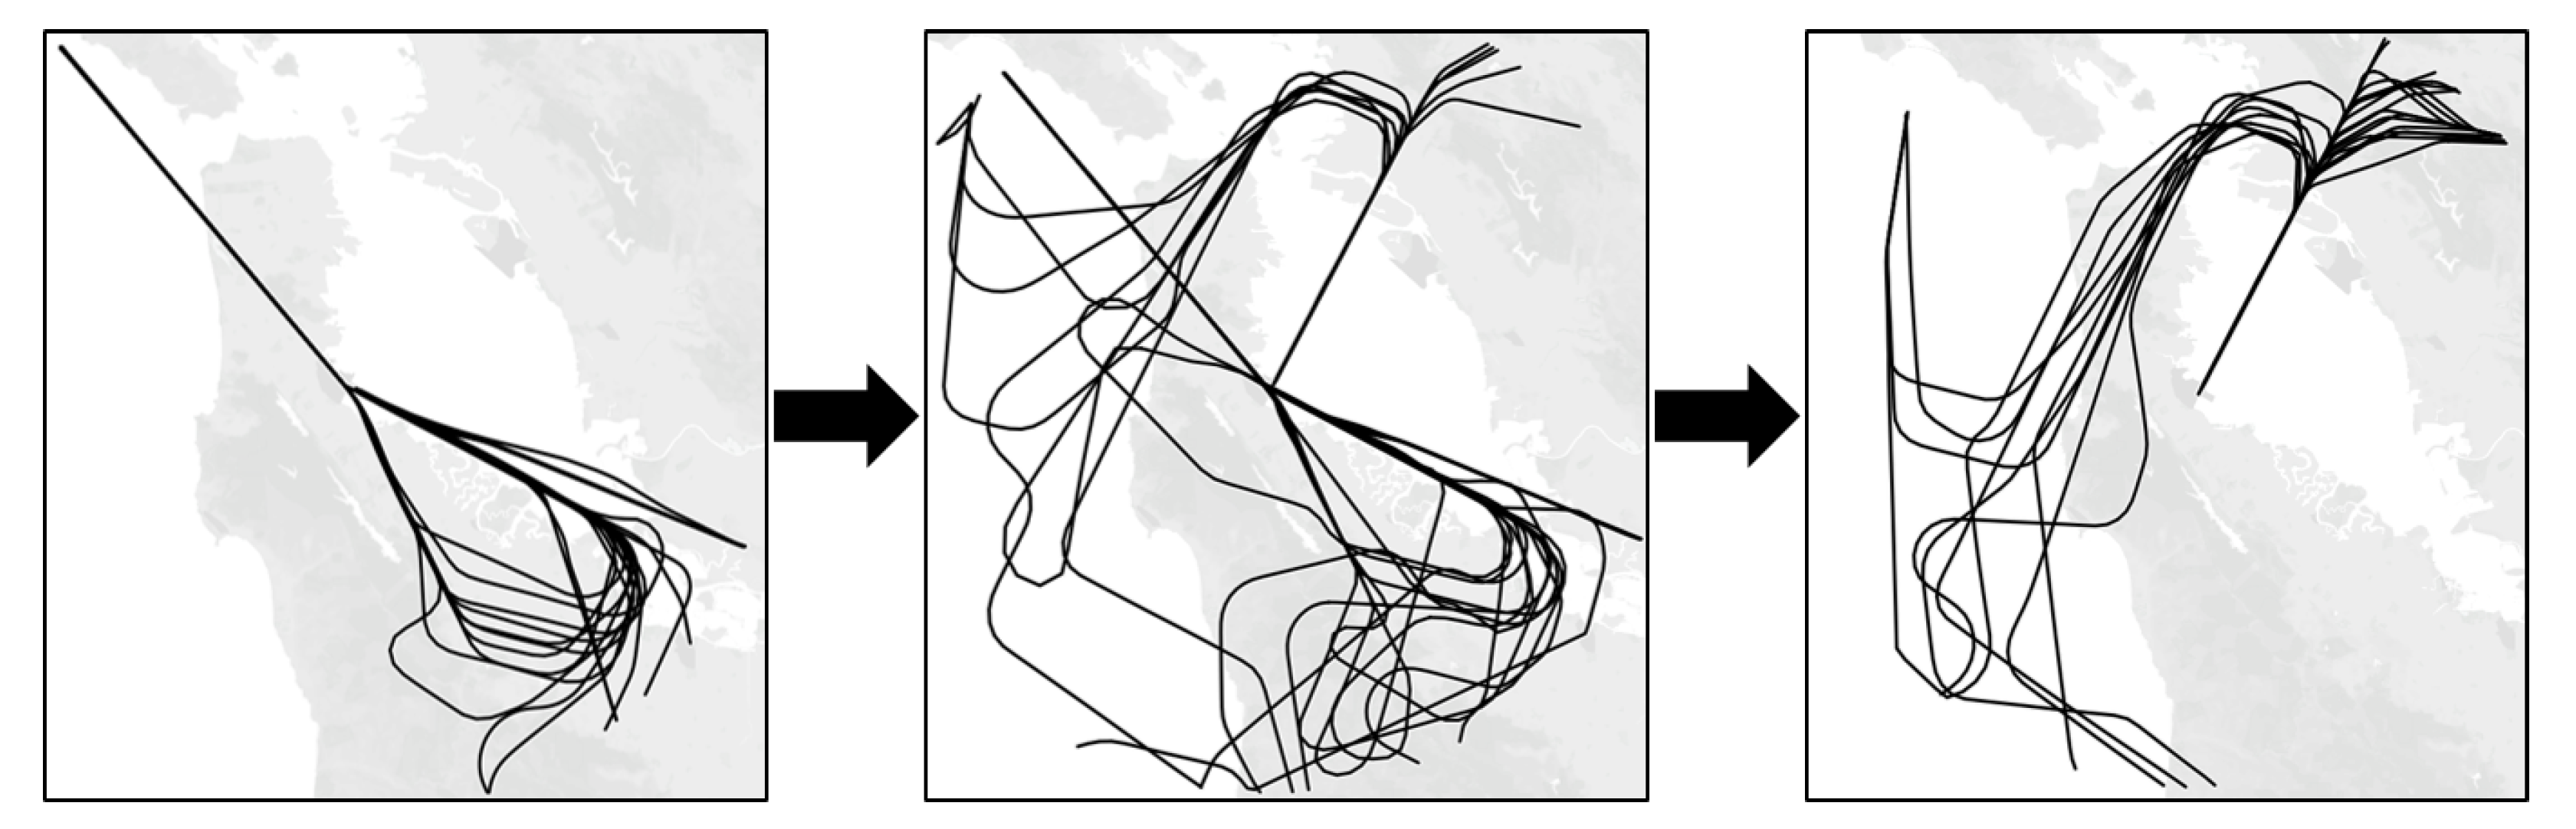
Three clusters were identified by the recursive DBSCAN procedure, considered to be the nominal operational patterns. Distribution of the operational states among the different characterizations, where the nominal characterization is split into the three operational patterns identified, is displayed in Table 1. Further, the air traffic flow centroids of the trajectories associated with the three nominal operational patterns are displayed in Figure 3.

Table 1.
Operational state characterization including specific operational pattern identified if the operational state is nominal.
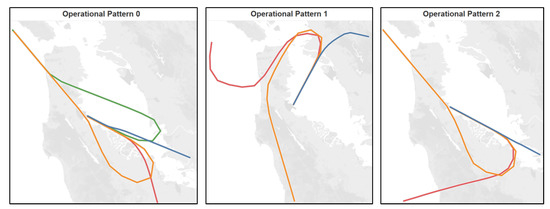
Figure 3.
Air traffic flow centroids of the trajectories associated with the three nominal operational patterns.
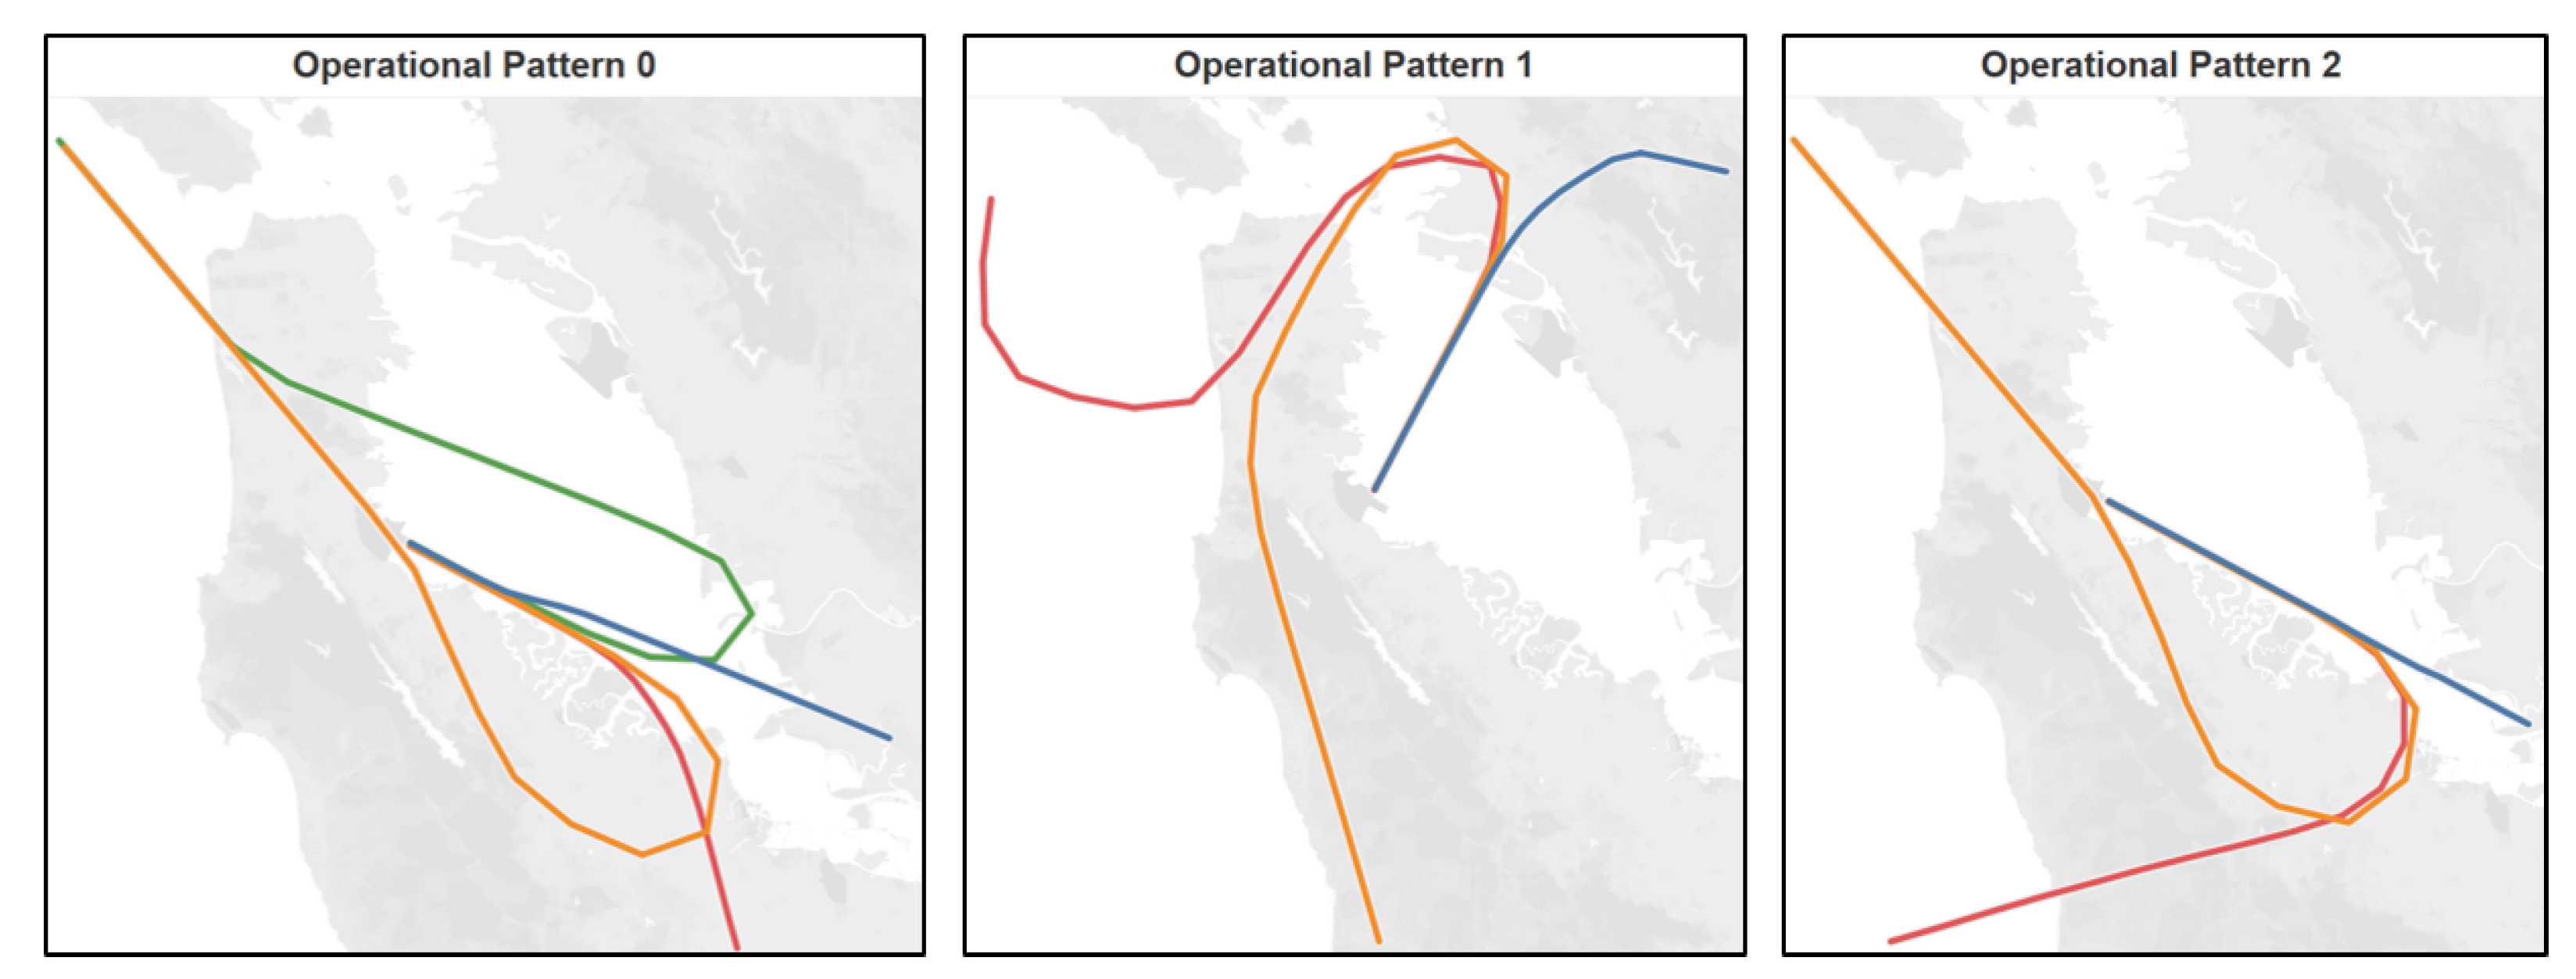
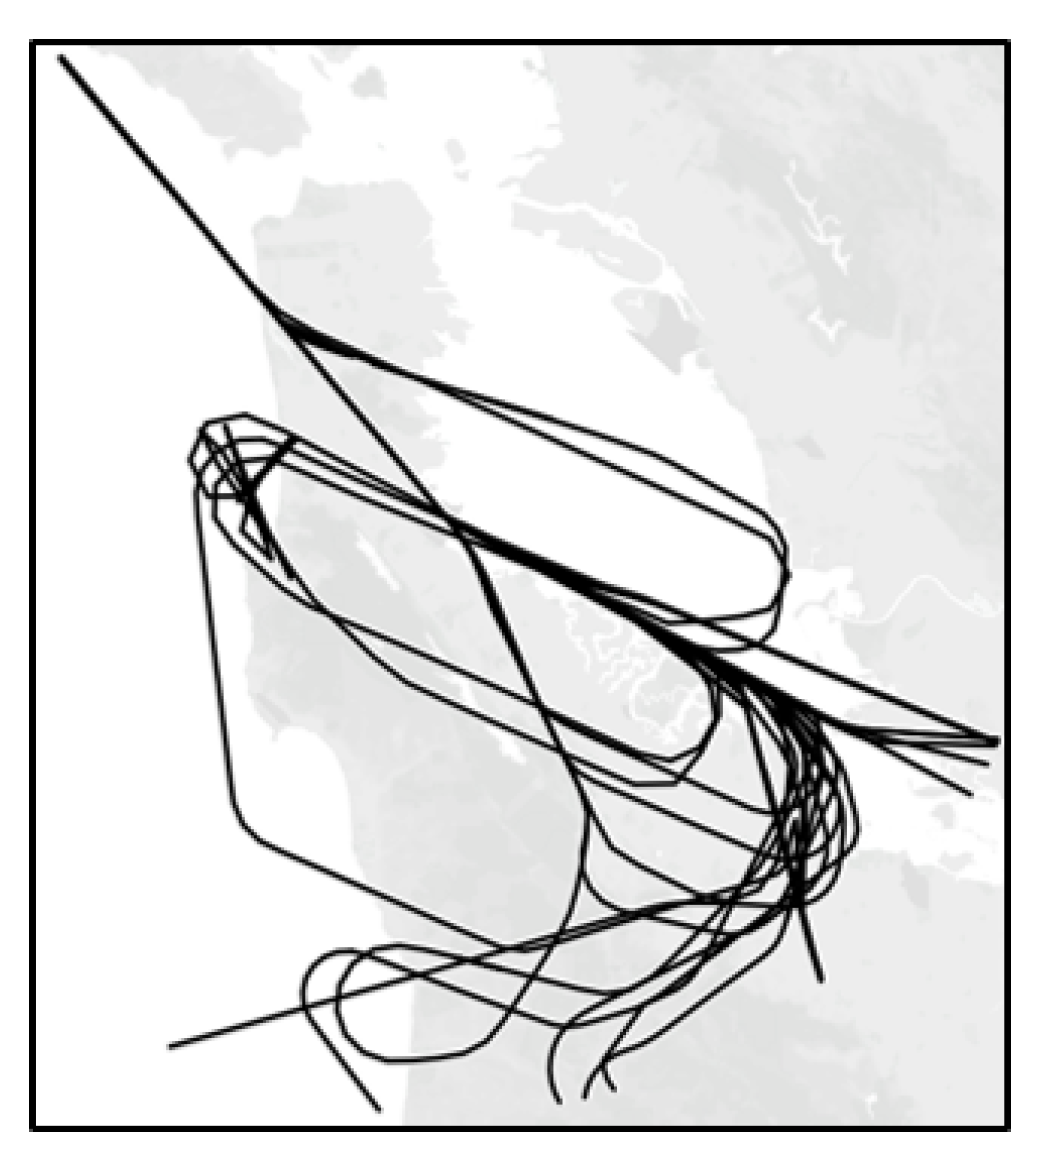
It is evident the identified clusters corresponding to the operational patterns presented in Figure 3 are distinct. Additionally, these operational patterns align with those official SFO operational plans, where operational pattern 0 and operational pattern 2 generally align with the official SFO west plan, while operational pattern 1 generally aligns with the official SFO south east plan. Further, Figure 4 displays the plot of the trajectories associated with an operational state that has been characterized as transitional, as well as the operational states directly before and after this transitional operational state. This transition is from operational pattern 0 to operational pattern 1. It is evident the operational state is characterized as being transitional due to the observation of trajectories that align with air traffic flow centroids that are prominent in operational pattern 0 as well as operational pattern 1. Through visual inspection, it appears the recursive DBSCAN procedure to characterize operational states is successful in characterizing transitional operational states as such. Finally, Figure 5 displays a plot of the trajectories associated with an operational state characterized as being anomalous. It is evident the corresponding time interval contains multiple trajectories that do not align with air traffic flows within the terminal airspace and are potentially experiencing either a go-around or holding pattern. It is noted that one trajectory alone experiencing a go-around or holding pattern should not necessarily result in an operational state being characterized as anomalous. However, in Figure 5 it appears there may have been more than one or two trajectories that experienced go-around or holding patterns; thus, resulting in the operational state being detected as anomalous. The recursive DBSCAN procedure to characterize operational states may be said to be successful in characterizing operational states as anomalous in the cases in which multiple trajectory paths within the terminal airspace during the specified time interval appear to be abnormal.
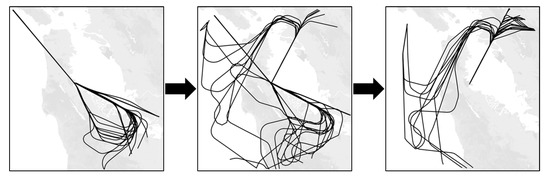
Figure 4.
Transition between operational pattern 0 and operational pattern 1.
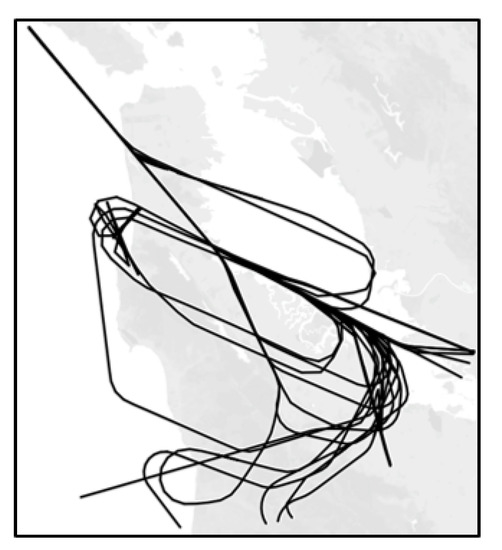
Figure 5.
Example of anomalous operational state.
4. Conclusions
In the context of the implementation of new operational concepts as a result of the global ATM system modernization efforts, airspace-level analysis is identified as being an important step. Specifically, the characterization of terminal airspace operational states was identified as being of paramount importance, including the identification of terminal airspace operational patterns. Considering the sparsity of the existing aviation literature related to airspace-level analysis, this work aimed to demonstrate a novel methodology to characterize terminal airspace operational states as either nominal (belonging to an operational pattern), transitional, or anomalous and identify the distinct operational patterns.
The proposed method first generates a representation of the operational state of the terminal airspace during a specified time interval considering the objective of aggregating the time-series trajectory data for all aircraft operating within the terminal airspace during the specified time interval. The proposed method involves a representation and characterization step and was demonstrated on a full year of ADS-B trajectory data for aircraft arriving at KSFO, where the full-year data set was split into hourly time interval data sets for which to generate the airspace density matrix operational state representation for each. Then, a recursive DBSCAN procedure is applied, in which operational states are characterized as being either nominal (belonging to an operational pattern), transitional, or anomalous. If an operational state is characterized as being transitional, it is removed from the data set, where the recursion proceeds until no new transitional operational states are characterized. Visual inspection of results indicate that the proposed method shows promise in characterizing nominal, transitional, and anomalous operational states, as well as identifying distinct operational patterns, which has the potential to assist ATM system operators, planners, and decision-makers in the implementation of new operational concepts.
Author Contributions
Conceptualization, S.J.C. and T.G.P.; methodology, S.J.C. and T.G.P.; software, S.J.C.; validation, S.J.C. and T.G.P.; formal analysis, S.J.C.; investigation, S.J.C.; resources, S.J.C. and T.G.P.; data curation, S.J.C.; writing—original draft preparation, S.J.C.; writing—review and editing, T.G.P.; visualization, S.J.C.; supervision, T.G.P. and D.N.M.; project administration, T.G.P. and D.N.M. All authors have read and agreed to the published version of the manuscript.
Funding
This research received no external funding.
Conflicts of Interest
The authors declare no conflict of interest.
References
- Condé Rocha Murça, M. Data-Driven Modeling of Air Traffic Flows for Advanced Air Traffic Management. Ph.D. Thesis, Massachusetts Institute of Technology, Cambridge, MA, USA, 2018. [Google Scholar]
- Federal Aviation Administration. Modernization of the U.S. Airspace. 2020. Available online: https://www.faa.gov/nextgen/ (accessed on 15 November 2021).
- Single European Sky (SES). Single European Sky. 2020. Available online: https://www.sesarju.ed/background-ses (accessed on 15 November 2021).
- Federal Aviation Administration. Vision for Trajectory Based Operations, Version 2.0; Federal Aviation Administration: Washington, DC, USA, 2017. [Google Scholar]
- Basora, L.; Xavier Olive, T.D. Recent Advances in Anomaly Detection Methods Applied to Aviation. Aerospace 2019, 6, 117. [Google Scholar] [CrossRef] [Green Version]
- Corrado, S.J.; Puranik, T.G.; Fischer, O.P.; Mavris, D.N. A clustering-based quantitative analysis of the interdependent relationship between spatial and energy anomalies in ADS-B trajectory data. Transp. Res. Part C Emerg. Technol. 2021, 131, 103331. [Google Scholar] [CrossRef]
- Mangortey, E.; Puranik, T.G.; Pinon, O.J.; Mavris, D.N. Classification, Analysis, and Prediction of the Daily Operations of Airports Using Machine Learning. In Proceedings of the AIAA SciTech 2020 SciTech Forum, Orlando, FL, USA, 6–10 January 2020. [Google Scholar]
- Enriquez, M. Identifying Temporally Persistent Flows in the Terminal Airspace via Spectral Clustering. In Proceedings of the Air Traffic Management R&D Seminar, Chicago, IL, USA, 10–13 June 2013; pp. 1–8. [Google Scholar]
- Behere, A.; Bhanpato, J.; Puranik, T.G.; Kirby, M.; Mavris, D.N. Data-driven approach to environmental impact assessment of real-world operations. In Proceedings of the AIAA Scitech 2021 Forum, Virtual Event, 11–15 & 19–21 January 2021; p. 0008. [Google Scholar]
- Kumar, S.G.; Corrado, S.J.; Puranik, T.G.; Mavris, D.N. Classification and Analysis of Go-Arounds in Commercial Aviation Using ADS-B Data. Aerospace 2021, 8, 291. [Google Scholar] [CrossRef]
- Ester, M.; Kriegel, H.P.; Sander, J.; Xu, X. A Density-Based Algorithm for Discovering Clusters in Large Spatial Databases with Noise. In Proceedings of the Second International Conference on Knowledge Discovery and Data Mining, Portland, OR, USA, 2–4 August 1996; AAAI Press: Palo Alto, CA, USA, 1996; pp. 226–231. [Google Scholar]
- McInnes, L.; Healy, J.; Melville, J. UMAP: Uniform Manifold Approximation and Projection for Dimension Reduction. arXiv 2020, arXiv:1802.03426. [Google Scholar]
- Schäfer, M.; Strohmeier, M.; Lenders, V.; Martinovic, I.; Wilhelm, M. Bringing Up OpenSky: A Large-scale ADS-B Sensor Network for Research. In Proceedings of the 13th IEEE/ACM International Symposium on Information Processing in Sensor Networks (IPNS), Berlin, Germany, 15–17 April 2014; pp. 38–94. [Google Scholar]
- Corrado, S.; Puranik, T.; Pinon, O.; Mavris, D. Trajectory Clustering within the Terminal Airspace Utilizing a Weighted Distance Function. In Proceedings of the 8th OpenSky Symposium 2020, Online, 12–13 November 2020; pp. 1–10. [Google Scholar] [CrossRef]
- Corrado, S.; Puranik, T.; Pinon-Fischer, O.; Mavris, D.; Rose, R.; Williams, J.; Heidary, R. Deep Autoencoder for Anomaly Detection in Terminal Airspace Operations. In Proceedings of the AIAA Aviation 2021, Virtual Event, 2–6 August 2021. [Google Scholar]
- McInnes, L.; Healy, J.; Saul, N.; Grossberger, L. UMAP: Uniform Manifold Approximation and Projection. J. Open Source Softw. 2018, 3, 861. [Google Scholar] [CrossRef]
- Pedregosa, F.; Varoquaux, G.; Gramfort, A.; Michel, V.; Thirion, B.; Grisel, O.; Blondel, M.; Prettenhofer, P.; Weiss, R.; Dubourg, V.; et al. Scikit-learn: Machine Learning in Python. J. Mach. Learn. Res. 2011, 12, 2825–2830. [Google Scholar]
Publisher’s Note: MDPI stays neutral with regard to jurisdictional claims in published maps and institutional affiliations. |
© 2021 by the authors. Licensee MDPI, Basel, Switzerland. This article is an open access article distributed under the terms and conditions of the Creative Commons Attribution (CC BY) license (https://creativecommons.org/licenses/by/4.0/).