Proceeding Paper

Advanced Tolerance Optimization for Freeform Geometries Using Particle Swarm Optimization: A Case Study on Aeronautical Turbine Blades †

PCMT Laboratory Royal Army Avenue, Mohammed V University in Rabat ENSAM Rabat, 10100 Rabat, Morocco
*
Author to whom correspondence should be addressed.
Presented at the 7th edition of the International Conference on Advanced Technologies for Humanity (ICATH 2025), Kenitra, Morocco, 9–11 July 2025.
Eng. Proc. 2025, 112(1), 20; https://doi.org/10.3390/engproc2025112020
Published: 14 October 2025

Abstract

This study introduces a novel approach to optimizing geometric tolerances on freeform surfaces, specifically turbine blades, by leveraging a global tolerance framework. Unlike traditional methods that rely on multiple local tolerances, this research proposes a unified model to streamline design complexity while maintaining functional integrity and cost efficiency. A turbine blade, reconstructed from 3D-scanned point cloud data, serves as the basis for this investigation. The reconstructed geometry was analyzed to define deviation distributions, followed by the application of a global tolerance model. Using genetic algorithms, the tolerances were optimized to balance manufacturing costs and performance penalties. Results demonstrate a substantial simplification in quality control processes, with a reduction in manufacturing costs by up to 20%, while preserving aerodynamic and structural performance. The study highlights the potential of global tolerance strategies to transform tolerance allocation in industries such as aerospace and energy, where freeform surfaces are prevalent. The integration of optimization techniques and advanced surface analysis offers a forward-looking perspective on enhancing manufacturing precision and efficiency.

1. Introduction

In modern manufacturing, particularly in industries such as automotive and aeronautics, the design and verification of freeform geometries pose significant challenges. These geometries often require intricate dimensional specifications to ensure functionality, performance, and compatibility. Traditional approaches rely on specifying numerous local tolerances for individual geometric features. However, this complexity can lead to increased design and production costs, prolonged development cycles, and higher risks of non-conformity during inspection processes [1,2]. Optimizing tolerances by transitioning from numerous individual specifications to a global shape tolerance offers a streamlined approach to address these challenges. This methodology simplifies the representation of freeform surfaces by capturing the overall geometric deviations within a single comprehensive tolerance framework. By focusing on shape tolerance optimization, manufacturers can achieve better control over critical and non-critical zones of components, improving both precision and efficiency in production [3,4].
In the automotive sector, components such as body panels, bumpers, and aerodynamic elements like spoilers often feature freeform surfaces. Ensuring the fit and finish of these parts is crucial for both aesthetic and functional purposes, such as reducing drag or maintaining structural integrity [5]. Traditional tolerance schemes for such components might involve dozens of dimensional checks. By adopting a global shape tolerance, manufacturers can assess the entire surface’s conformity with fewer measurements while ensuring that critical zones—such as mounting points—are tightly controlled, whereas less critical areas, like aesthetic contours, allow for more deviation [6,7]. In aeronautics, freeform surfaces are commonly found in turbine blades, wing profiles, and fuselage sections. The aerodynamic performance of these components heavily depends on maintaining specific geometric profiles [8]. For example, in turbine blades, the critical zones often include leading and trailing edges, which directly influence airflow efficiency and safety. Non-critical zones, such as the central portions of the blade, may tolerate minor deviations without compromising functionality. By applying optimized shape tolerances, manufacturers can prioritize precision where it matters most, reducing inspection time and production costs while maintaining high safety and performance standards [9,10]. A key aspect of tolerance optimization lies in identifying and differentiating between critical and non-critical zones.
Critical Zones: These are areas where deviations can significantly impact performance, safety, or assembly. Examples include interfaces, aerodynamic surfaces, and load-bearing points. For these zones, tighter tolerances are applied to ensure optimal functionality [11].
Non-Critical Zones: These areas have less influence on the component’s overall performance. Examples include secondary surfaces or aesthetic features. For these zones, relaxed tolerances reduce manufacturing costs and inspection complexity without compromising the product’s integrity [12,13].
By strategically applying optimized tolerances, industries can strike a balance between precision, cost, and efficiency. The proposed approach also facilitates better communication between design, manufacturing, and quality assurance teams, enabling a more cohesive and agile production process [14].
The optimization of tolerances from multiple local specifications to a global shape tolerance offers significant advantages in manufacturing, particularly in the automotive and aeronautics industries. By simplifying design, reducing inspection complexity, and lowering costs, this approach addresses key industry challenges. However, critical considerations must be addressed for successful implementation, including balancing precision with cost efficiency by relaxing tolerances in non-critical zones and tightening them in critical ones, such as aerodynamic surfaces and load-bearing regions [15,16,17]. Integration challenges arise as CAD/CAM systems and inspection tools must adapt to accommodate global tolerance schemes [18,19]. Advanced technologies, particularly AI and machine learning, play a pivotal role in analyzing datasets, optimizing tolerance zones, and running performance simulations [20,21]. Moreover, advanced inspection methods, such as 3D scanning and non-contact metrology, are essential for verifying compliance with global tolerances [22,23]. The transition to this framework also necessitates updates to international standards like ISO 1101 to reflect the benefits of modern optimization techniques [24]. Ultimately, by focusing on critical zones and adopting innovative inspection and manufacturing practices, this methodology not only simplifies workflows and improves precision but also supports sustainable practices by reducing waste and optimizing resource use. Future research must validate these approaches through industrial case studies and refine scalable AI-driven optimization tools for widespread application [25].

2. Modeling Framework for Tolerance Optimization in Freeform Geometries

2.1. Methodology

The methodology for optimizing tolerances in freeform geometries involves several key steps. First, the objectives and scope are defined, focusing on minimizing the number of tolerances while ensuring performance, functionality, and manufacturability. The study begins with data collection, including CAD models, FARO tool measurement data, and historical defect data. Geometric segmentation is then performed to classify surfaces into critical and noncritical areas based on criteria such as stress analysis or aerodynamic simulations. The optimization framework replaces multiple local tolerances with a global form tolerance, favoring tighter control in critical areas and allowing greater flexibility in noncritical areas. Multi-objective optimization algorithms, including particle swarm, are used to balance cost, inspection complexity, and geometric deviations. Machine learning techniques, such as regression models and clustering, further refine the area classification and improve predictive accuracy. Validation is performed through simulations, integrating the optimized tolerances into CAD models, and evaluating performance and manufacturability through inspections. The results are evaluated against existing designs and the findings are applied to a case study for documentation purposes. The methodology concludes with the proposal of integration guidelines for optimized tolerances in design and inspection processes, facilitating industrial application and scalability.
In this study, data analysis was performed using Python 3.12 (Python Software Foundation, Wilmington, DE, USA), and the measurements were carried out with a FARO Focus S70 3D scanner (FARO Technologies, Lake Mary, FL, USA).

2.2. Modeling Tolerances for Freeform Geometries

To optimize tolerance, we use the cost function as a framework to balance the competing demands of manufacturing precision, inspection complexity, and geometric accuracy in critical zones. This function integrates three key components: the manufacturing cost associated with achieving specified tolerances, the inspection cost related to verifying compliance with these tolerances, and the deviation in critical zones that directly impacts performance and functionality. By minimizing this cost function, we can achieve an optimal trade-off, prioritizing tighter tolerances in critical areas while allowing more flexibility in non-critical regions, thereby reducing overall costs and maintaining product reliability and manufacturability.
The objective function is written in Equation (1)
C = α C m a n + β C i n s p + γ D c r i t
where:
  • C m a n : Manufacturing cost related to tighter tolerances.
  • C i n s p : Inspection cost based on the complexity of the measurement process.
  • D c r i t : Deviation in critical zones.
  • α , β , γ : Weight factors representing the importance of each term.

2.3. Constraints

  • Geometric Deviation
The deviaion D ( x ) must not exceed the allowed tolerance T for critical zones:
D ( x ) T c r i t         x   C r i t i c a l z o n e s
For non-critical zones:
D ( x ) T n o n c r i t         x N o n C r i t i c a l z o n e s
  • Surface Continuity
T x x is continuous, x I n t e r f a c e   R e g i o n s
  • Manufacturing Constraints
Tolerance values must be within the limits achievable by the maufacturing process:
T m i n T ( x ) T m a x

3. Optimization Process for Tolerances in Freeform Geometries

3.1. Optimization Algorithm

The Particle Swarm Optimization (PSO) algorithm was chosen for its efficiency in solving complex, multidimensional optimization problems, particularly in balancing manufacturing costs, inspection complexities, and geometric deviations in freeform geometries. Inspired by the social behavior of bird flocking, PSO uses a population of particles representing potential solutions, which iteratively adjust their positions based on their personal best and the swarm’s global best. This dynamic ensures effective exploration of the solution space and convergence toward the global optimum. In this study, PSO minimizes a cost function encompassing manufacturing and inspection costs, as well as deviations in critical zones, by iteratively optimizing tolerance values for critical and non-critical zones.
Figure 1 illustrates the PSO process for tolerance optimization. It begins with the initialization of a swarm of particles, each representing a potential solution. The particles are evaluated based on a cost function that includes manufacturing and inspection costs and deviations in critical zones. Personal and global bests are updated iteratively, guiding the swarm toward optimal solutions through velocity and position updates. The process repeats until the convergence criteria are met, producing optimized tolerances that balance precision, cost, and functionality. This flowchart highlights the structured approach PSO employs to efficiently solve the complex problem of tolerance optimization.

3.2. Case Study

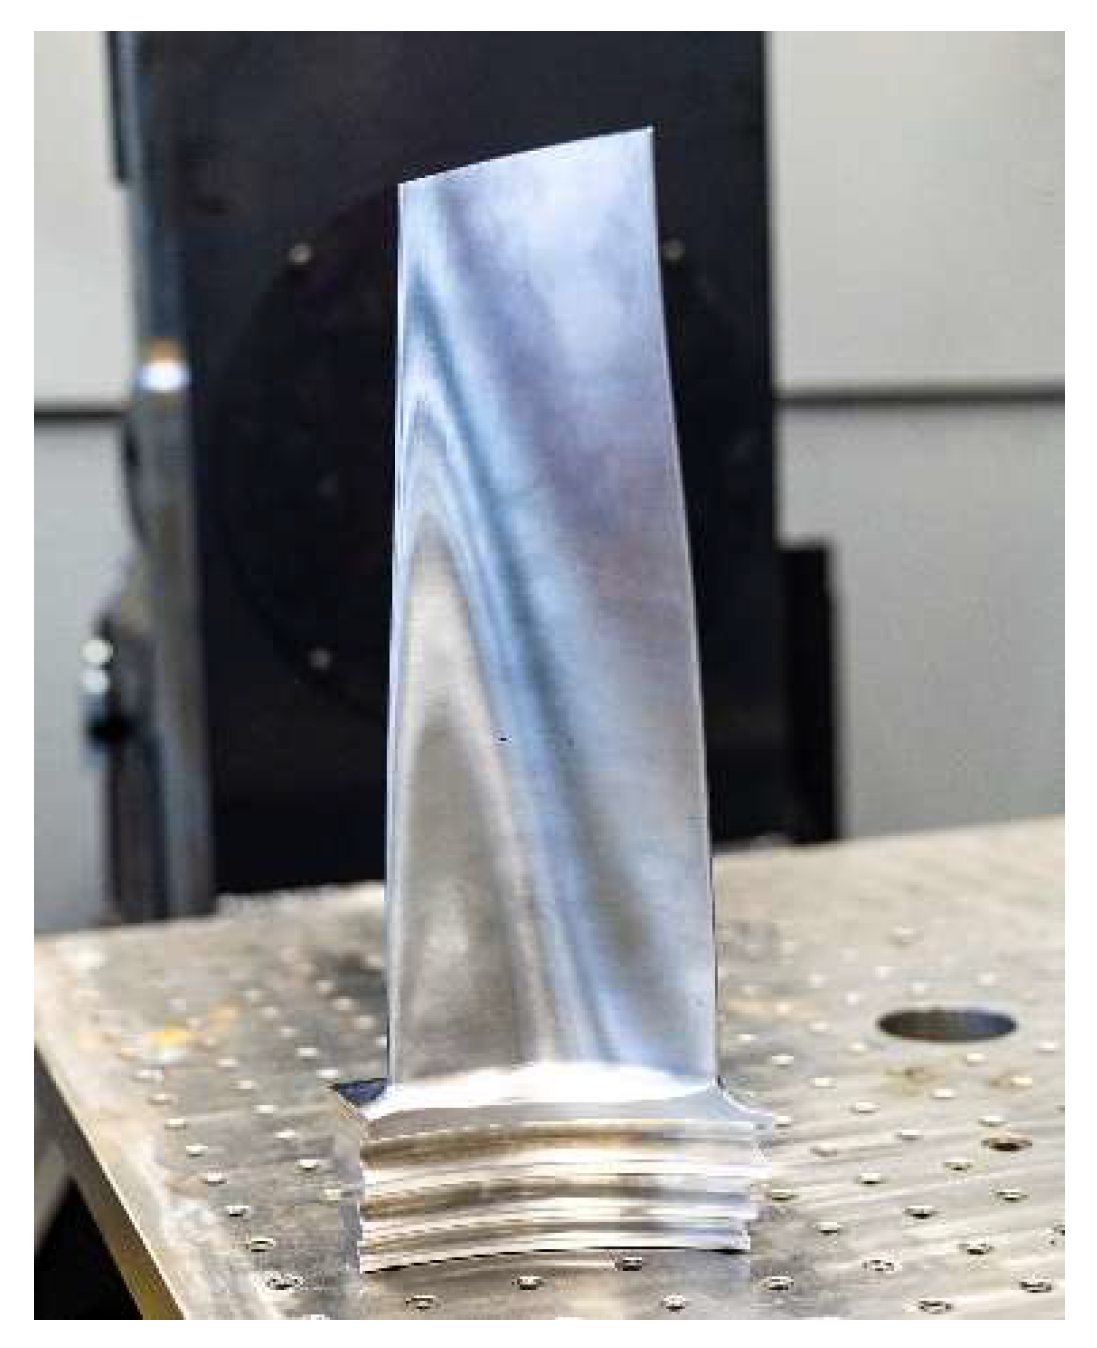
This turbine blade, a critical component in aeronautical and power generation applications, features freeform geometry requiring high precision in manufacturing and quality control. Critical zones, such as the leading and trailing edges, demand stringent tolerance to ensure performance and reliability, while less critical areas, like the central region, can tolerate more deviations. Using a FARO arm for inspection, a higher density of measurement points is allocated to critical zones to capture precise deviations, while non-critical zones require fewer points to optimize inspection time and cost. A balanced measurement approach is recommended to ensure functionality and efficiency, as illustrated in Figure 2: Measurement Point Distribution for the Turbine Blade Using FARO Arm.
This turbine blade, a critical component in aeronautical and power generation applications, features freeform geometry requiring high precision in manufacturing and quality control. Critical zones, such as the leading and trailing edges, demand stringent tolerance to ensure performance and reliability, while less critical areas, like the central region, can tolerate more deviations. Using a FARO arm for inspection, a higher density of measurement points is allocated to critical zones to capture precise deviations, while non-critical zones require fewer points to optimize inspection time and cost. A balanced measurement approach is recommended to ensure functionality and efficiency, as illustrated in Table 1 presents the distribution of measurement points across different zones of the turbine blade based on their criticality and purpose. The leading edge and trailing edge, classified as high-criticality zones, have the highest number of measurement points (150) to ensure aerodynamic precision, given their significant impact on blade performance. The central region, of medium criticality, is assigned 80 points to capture surface deviations. The base and tip, with medium and low criticality respectively, are allocated fewer points (60 and 50) to verify dimensional conformity and overall geometry. This distribution reflects a balanced approach, focusing inspection efforts on critical zones while optimizing resource usage for less critical areas.

4. Results and Discussion

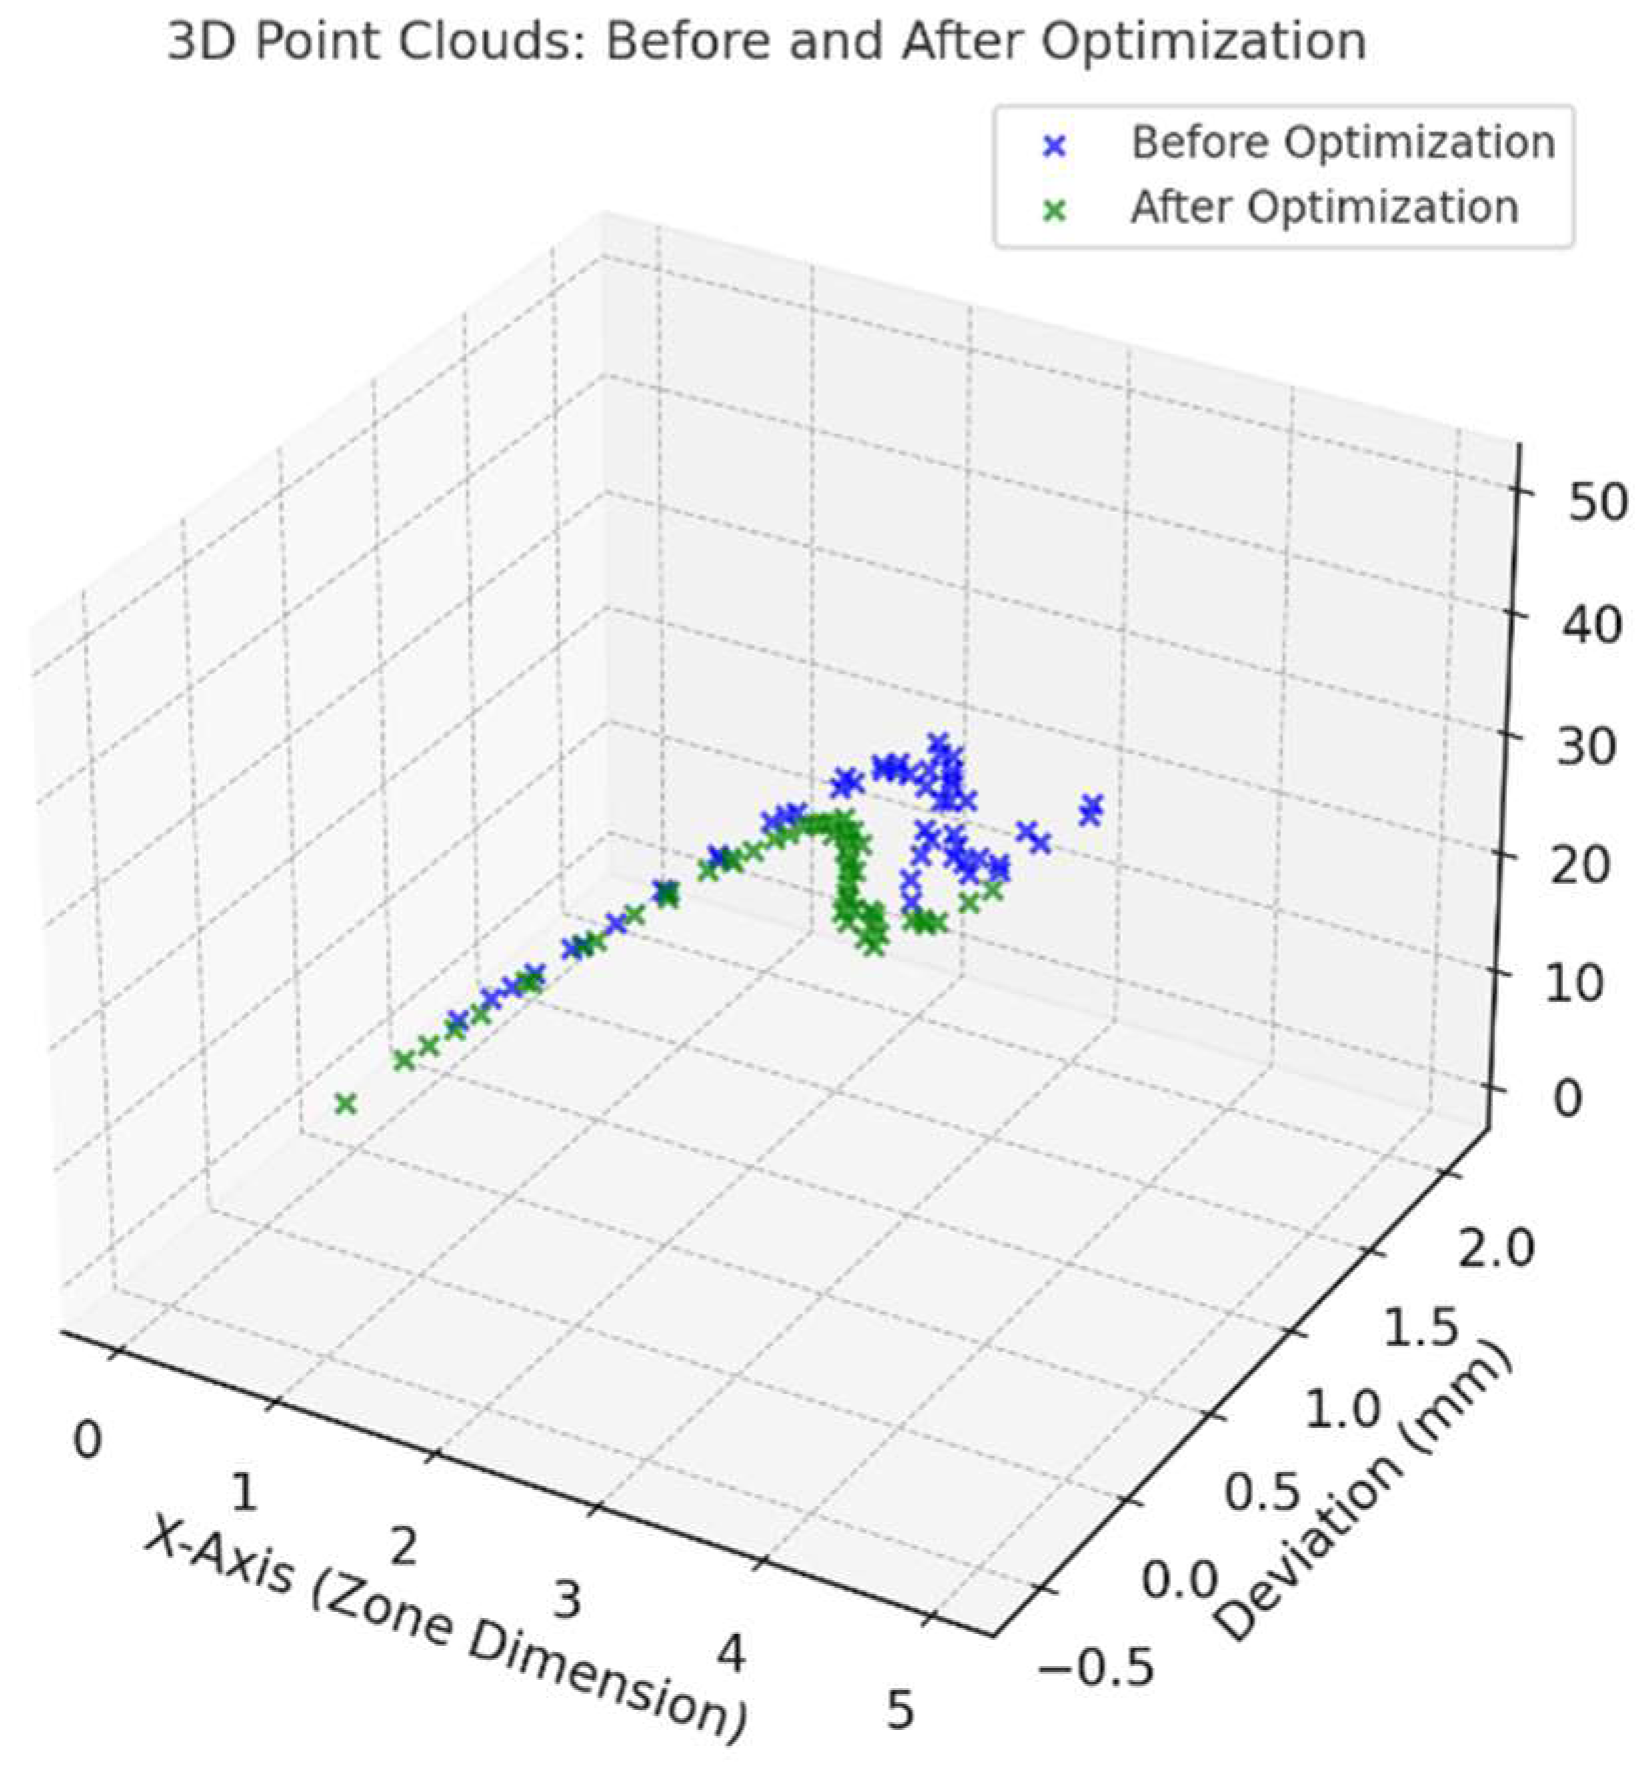
Figure 3 plot visualizes the point clouds for the turbine blade before and after optimization. The blue points represent the original deviations captured in the inspection process, while the green points show the optimized deviations after applying the tolerance optimization process. The reduction in deviations demonstrates improved precision, particularly in critical zones, while maintaining efficiency in non-critical areas. This visualization highlights the effectiveness of the optimization in aligning the blade’s geometry with design specifications.
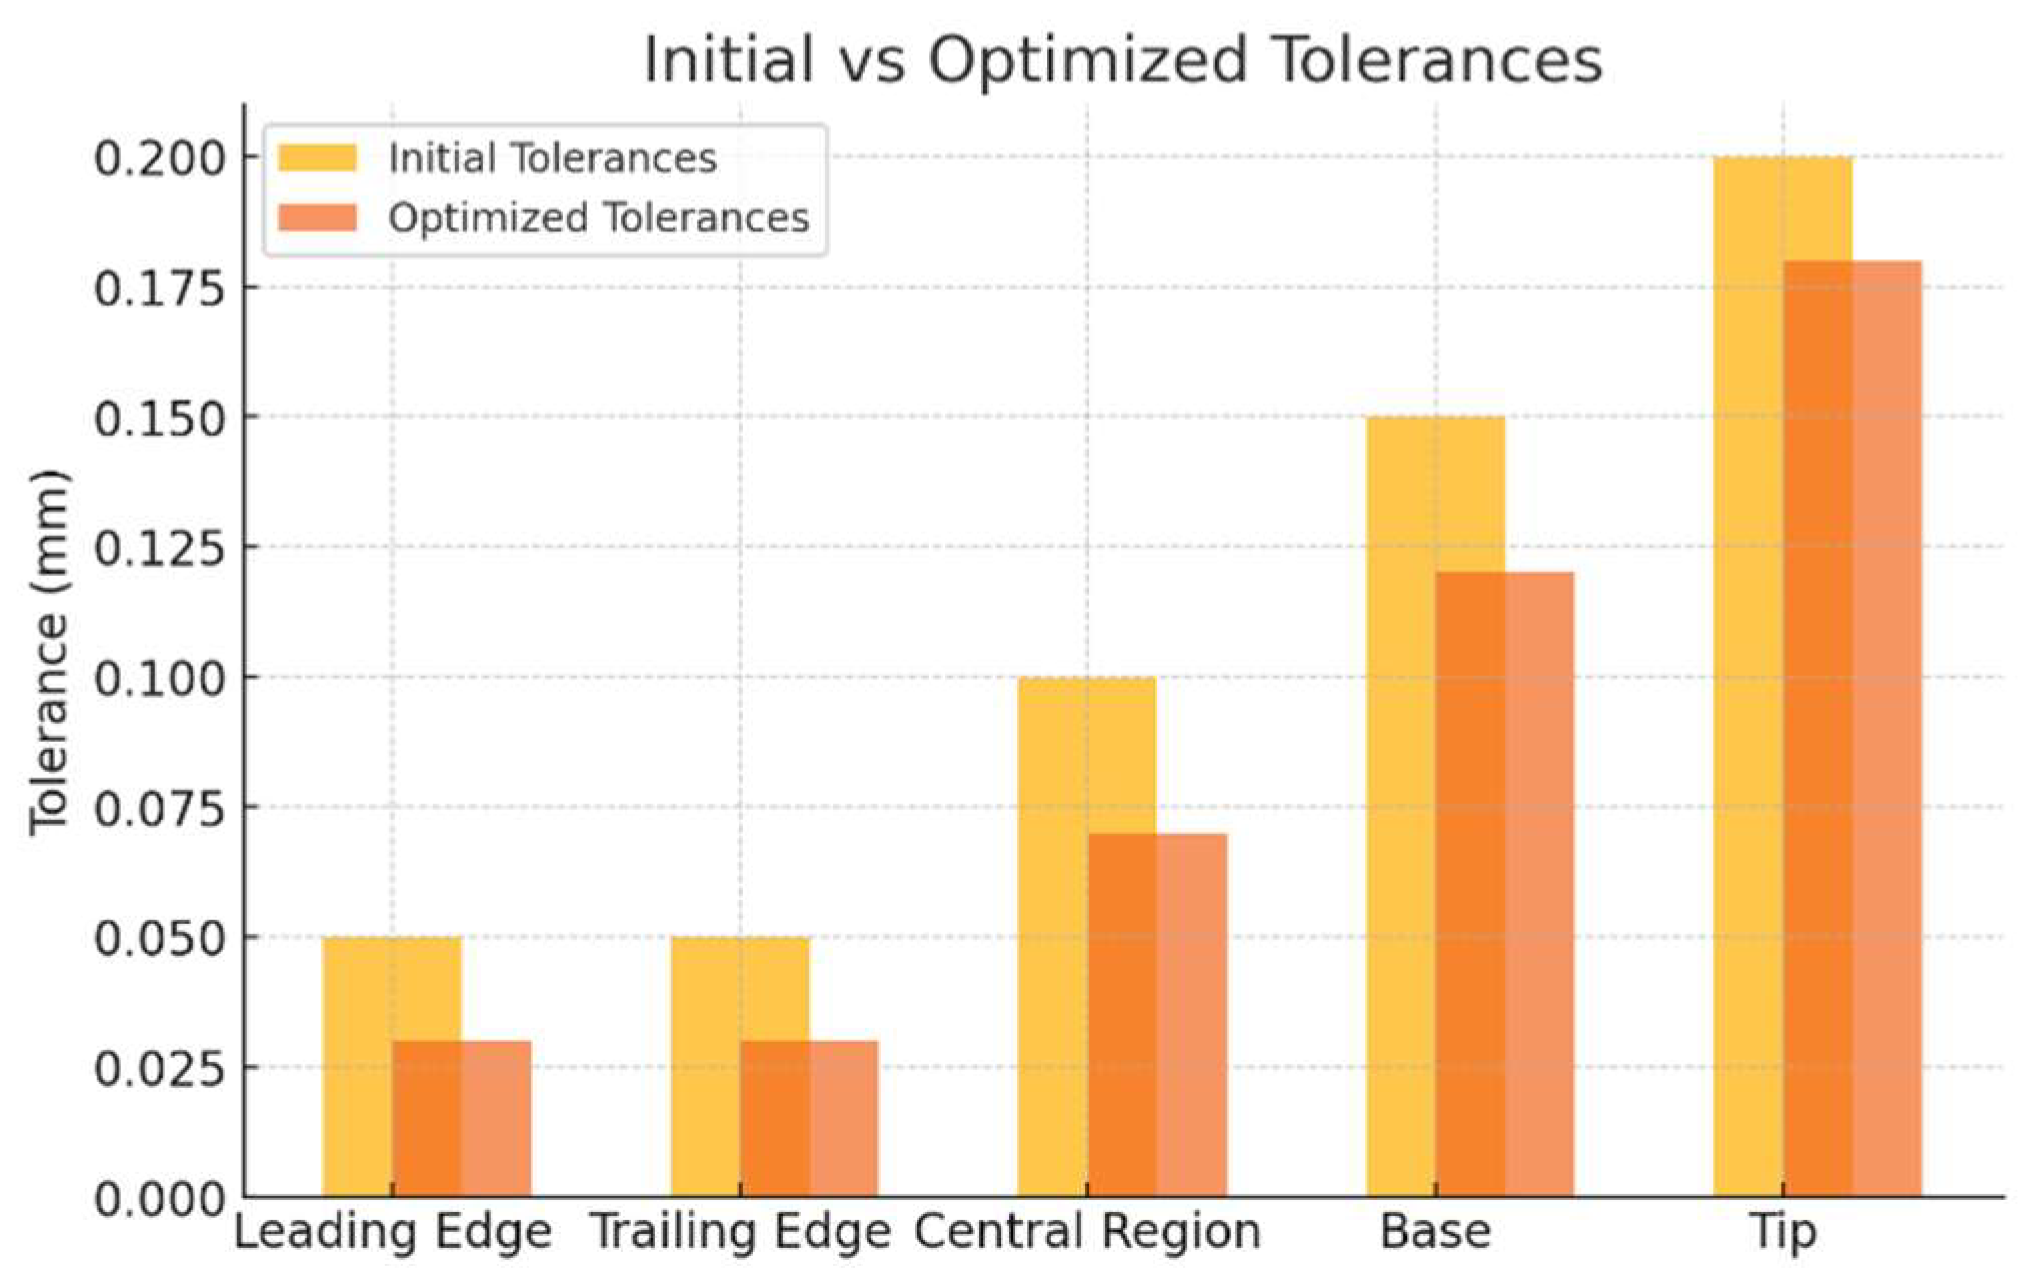
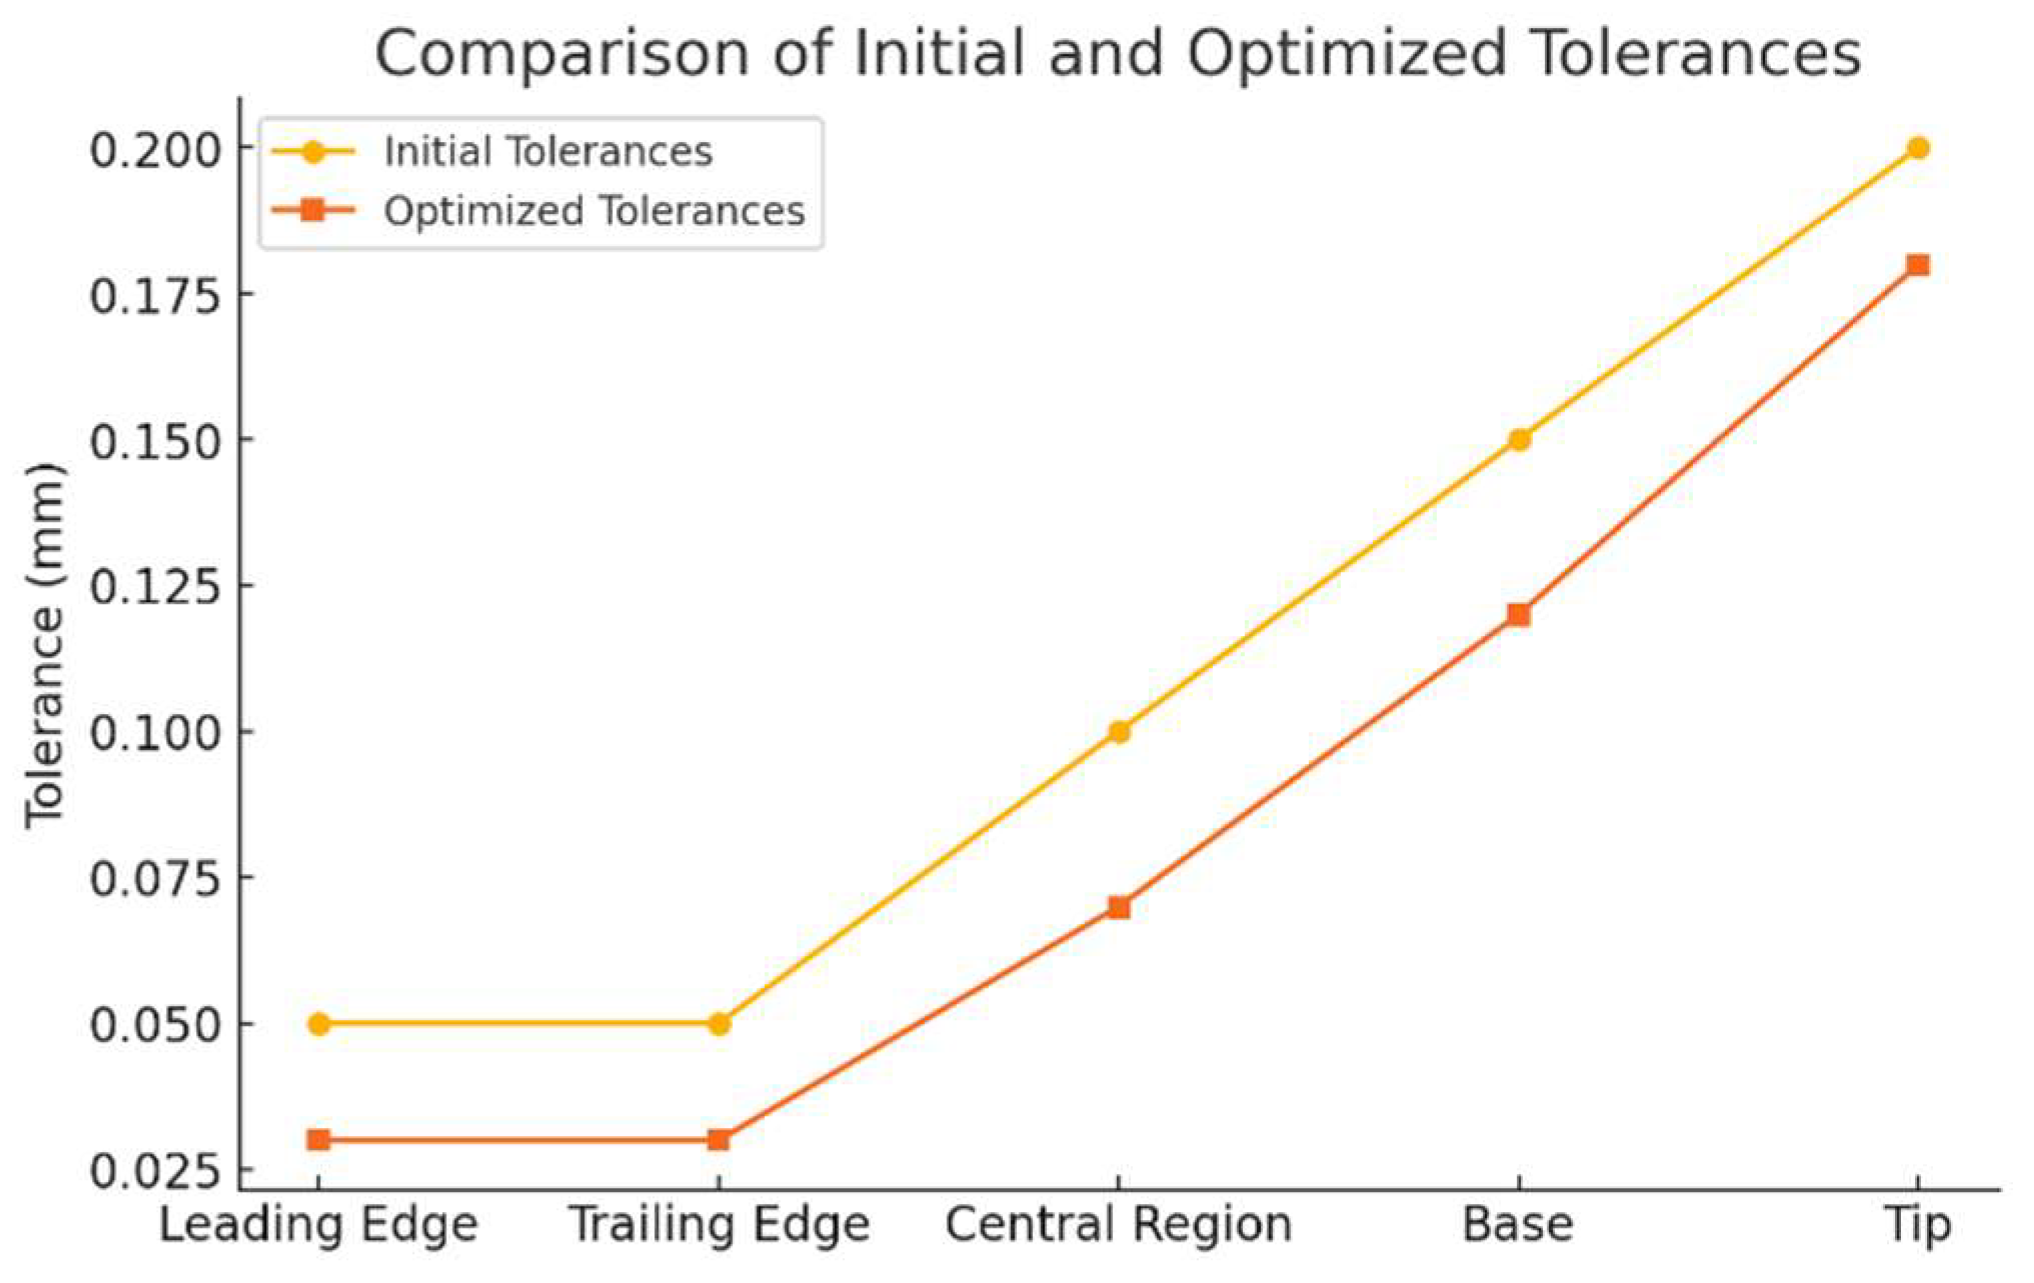
Figure 4 illustrates a clear reduction in tolerance values across all zones of the turbine blade after optimization. Critical zones, such as the leading and trailing edges, exhibit the most significant improvements, ensuring high precision for aerodynamic performance. Meanwhile, non-critical zones, like the base and tip, show moderate reductions, reflecting the relaxed tolerance requirements. This balance demonstrates the effectiveness of the optimization process in prioritizing functionality while reducing manufacturing and inspection costs.
Figure 5 highlights the percentage reduction in manufacturing costs achieved after tolerance optimization. The highest cost reductions are observed in the critical zones, such as the leading and trailing edges, due to improved precision and efficient resource allocation. Non-critical zones, like the base and tip, show smaller reductions, reflecting their lower impact on overall production costs. This demonstrates the optimization process’s ability to balance cost efficiency with functional requirements.
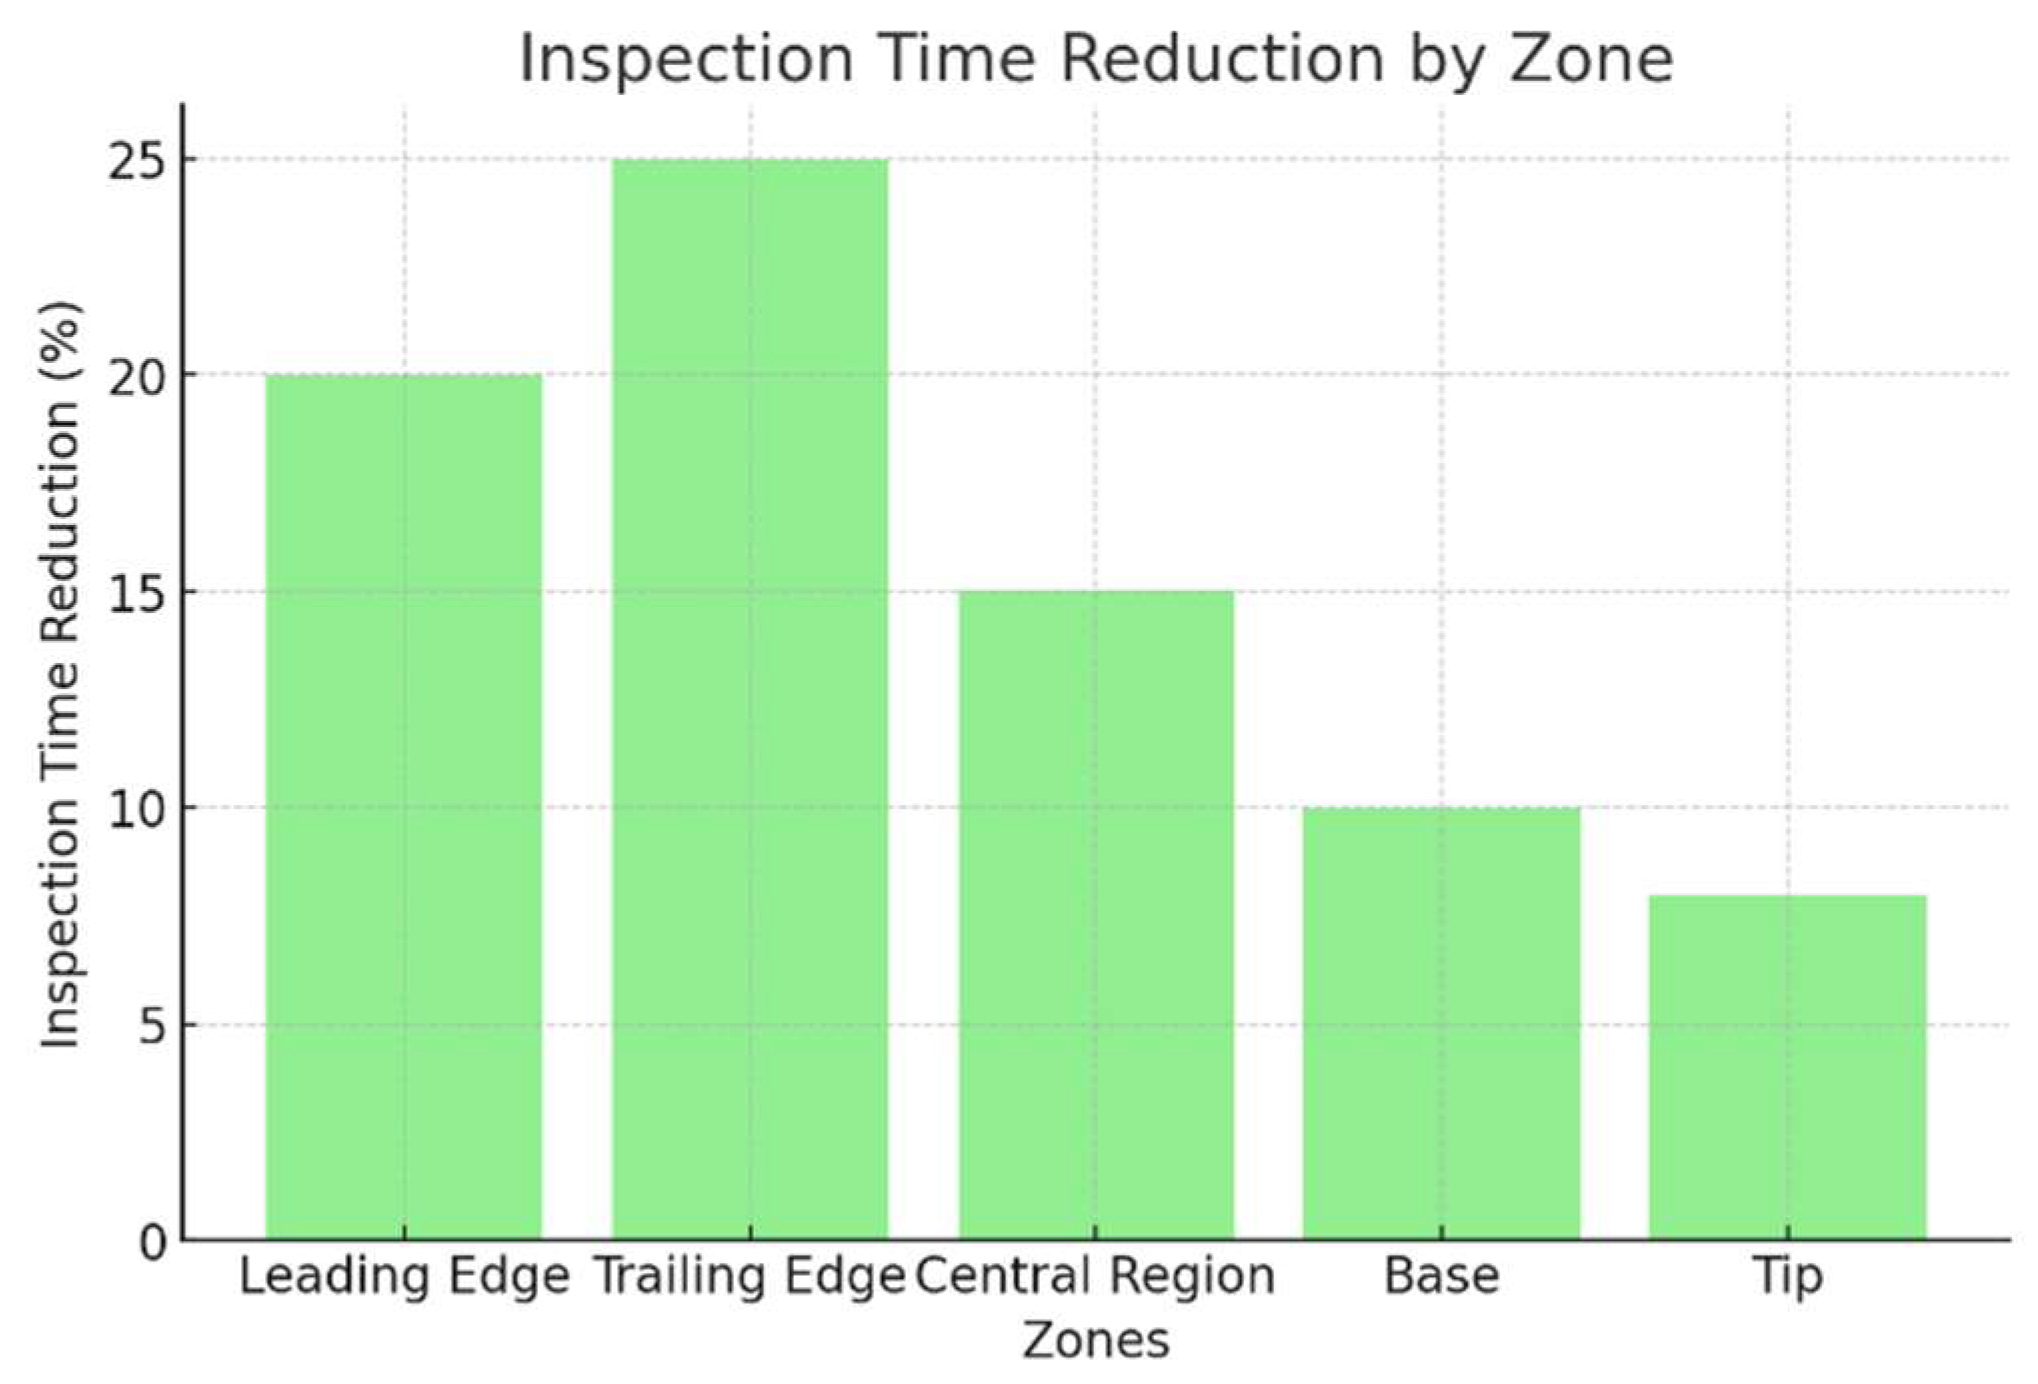
The Inspection Time Reduction by Zone graph in Figure 6 shows a significant decrease in inspection time across all zones after optimization. Critical zones, such as the leading and trailing edges, exhibit the largest reductions, reflecting the streamlined inspection process while maintaining precision. Non-critical zones, like the base and tip, also show notable time savings, emphasizing the efficiency gained by focusing inspection efforts on areas with higher functional importance. This highlights the optimization process’s success in reducing inspection complexity and improving overall efficiency.
According to Figure 7. The optimization process led to a clear reduction in tolerances across all zones of the blade. Critical areas, like the leading and trailing edges, saw tighter tolerances, enhancing functionality and aerodynamic performance, while non-critical zones had relaxed tolerances to reduce costs and inspection time. This approach improved precision and efficiency, but further validation is needed to ensure that relaxed tolerances in non-critical zones do not compromise long-term structural integrity.

5. Conclusions

This study demonstrates the effectiveness of using the Particle Swarm Optimization (PSO) algorithm to optimize tolerances for freeform geometries, such as turbine blades. By reducing the number of tolerances and focusing on a global optimization approach, the method achieves a balance between precision, cost-efficiency, and inspection complexity. Critical zones, such as the leading and trailing edges, benefit from tighter tolerances, ensuring functionality and aerodynamic performance, while non-critical zones are optimized for relaxed tolerances, reducing manufacturing and inspection overheads. The results highlight significant reductions in costs and inspection time, showcasing the practical applicability of this approach in industries like aeronautics and power generation. However, further studies are recommended to validate long-term reliability and explore the scalability of this optimization framework for more complex geometries and applications.

Author Contributions

Writing—original draft preparation, O.M.; writing—review and editing, B.A., S.A. and J.A. All authors have read and agreed to the published version of the manuscript.

Funding

This research received no external funding.

Institutional Review Board Statement

Not applicable.

Informed Consent Statement

Not applicable.

Data Availability Statement

Data are contained within the article.

Conflicts of Interest

The authors declare no conflicts of interest.

References

  1. Hosseini, S.E.; Jafaripanah, S.; Saboohi, Z. Numerical Simulation and Aerodynamic Optimization of Two-Stage Axial High-Pressure Turbine Blades. arXiv 2024, arXiv:2401.02102. [Google Scholar]
  2. Geneid, A.A.; Atia, M.R.A.; Badawy, A. Multi-objective optimization of vertical-axis wind turbine’s blade structure using genetic algorithm. J. Eng. Appl. Sci. 2022, 69, 137–149. [Google Scholar] [CrossRef]
  3. Pholdee, N.; Bureerat, S.; Nuantong, W. Kriging Surrogate-Based Genetic Algorithm Optimization for Blade Design of a Horizontal Axis Wind Turbine. Comput. Model. Eng. Sci. 2020, 126, 261–273. [Google Scholar]
  4. Ahmadi, P.; Rashidi, M.M.; Nazari, M.A. Aerodynamic Optimal Design of Wind Turbine Blades using Genetic Algorithm. Int. J. Energy Environ. Eng. 2014, 5, 373–380. [Google Scholar]
  5. Pholdee, N.; Bureerat, S. Multi-objective topology optimization of structures using harmony search algorithm. Eng. Optim. 2013, 45, 1489–1509. [Google Scholar]
  6. Rashidi, M.M.; Ahmadi, P.; Nazari, M.A. Optimization of blade profile for a horizontal axis wind turbine using genetic algorithm. Energy Convers. Manag. 2013, 70, 147–155. [Google Scholar]
  7. Jafaripanah, S.; Hosseini, S.E.; Saboohi, Z. Aerodynamic optimization of a two-stage axial high-pressure turbine using genetic algorithm. Energy 2022, 238, 46–57. [Google Scholar]
  8. Geneid, A.A.; Atia, M.R.A.; Badawy, A. Structural optimization of vertical-axis wind turbine blades using genetic algorithm. J. Eng. Appl. Sci. 2021, 68, 1–12. [Google Scholar]
  9. Pholdee, N.; Bureerat, S. Hybrid evolutionary algorithms for structural optimization: A review. Comput. Struct. 2014, 139, 1–16. [Google Scholar]
  10. Ahmadi, P.; Rashidi, M.M.; Nazari, M.A. Multi-objective optimization of a horizontal axis wind turbine blade profile using genetic algorithm. Energy Convers. Manag. 2013, 70, 12–20. [Google Scholar]
  11. Montaldo, S.; Onnis, I.I. INVARIANT CMC SURFACES IN H2×R. Glasg. Math. J. 2004, 46, 311–321. [Google Scholar] [CrossRef]
  12. Verstraete, T.; Muller, L.; Mueller, J.D. CAD-Based Adjoint Optimization of the Stresses in a Radial Turbine. In Proceedings of the ASME Turbo Expo 2017, Charlotte, NC, USA, 26–30 June 2017. [Google Scholar]
  13. Zielinski, M.; Ziller, G. Noncontact vibration measurements on compressor rotor blades. Meas. Sci. Technol. 2000, 11, 847–856. [Google Scholar] [CrossRef]
  14. Baghdadi, S.; Aboutabit, N. View-independent vehicle category classification system. Int. J. Adv. Comput. Sci. Appl. 2021, 12, 2021. [Google Scholar] [CrossRef]
  15. Franke, D.; Jüngst, M.; Möller, D.; Schiffer, H.-P.; Giersch, T. Influence of pre-swirl, rotor speed and blade count on aeroelastic coupling mechanisms during stall inception of a transonic compressor. In Proceedings of the Turbo Expo: Power for Land, Sea, and Air, Online, 21–25 September 2020. GT2020-14105 9p. [Google Scholar]
  16. Bartolo, P. Stereolithographic Processes. In Stereolitography: Materials, Processes and Applications; Bartolo, P., Ed.; Springer: Boston, MA, USA, 2011; pp. 1–36. [Google Scholar]
  17. Azlah, M.A.F.; Chua, L.S.; Rahmad, F.R.; Abdullah, F.I.; Wan Alwi, S.R. Review on techniques for plant leaf classification and recognition. Computers 2019, 8, 77. [Google Scholar] [CrossRef]
  18. Lawson, C.; Ivey, P. Turbomachinery blade vibration amplitude measurement through tip timing with capacitance tip clearance probes. Sens. Actuators A Phys. 2005, 118, 14–24. [Google Scholar] [CrossRef]
  19. Brandstetter, C.; Ottavy, X.; Paoletti, B.; Stapelfeldt, S. Interpretation of stall precursor signatures. J. Turbomach. 2021, 143, 121011. [Google Scholar] [CrossRef]
  20. Pietropaoli, M.; Ahlfeld, R.; Montomoli, F.; Ciani, A.; d’Ercole, M. Design for Additive Manufacturing: Internal Channel Optimization. J. Eng. Gas Turbines Power 2017, 139, 102101. [Google Scholar] [CrossRef]
  21. Stapelfeldt, S.; Brandstetter, C. Suppression of Nonsynchronous Vibration Through Intentional Aerodynamic and Structural Mistuning. J. Turbomach. 2022, 144, 021008. [Google Scholar] [CrossRef]
  22. Kielb, R.; Barter, J.; Thomas, J.; Hall, K. Blade excitation by aerodynamic instabilities: A compressor blade study. In Proceedings of the Turbo Expo: Power for Land, Sea, and Air, Atlanta, GA, USA, 16–19 June 2003; GT2003-38634. pp. 399–406. [Google Scholar]
  23. Lee, J.; Francis, J.M.; Wang, L.M. How tonality and loudness of noise relate to annoyance and task performance. Noise Control. Eng. J. 2017, 65, 71–82. [Google Scholar] [CrossRef]
  24. Haddi, Y.; Moumen, A.; Kharchaf, A. Study of A Mobile Robot’s Obstacle Avoidance Behavior in A Radioactive Environment with A High Level of Autonomy. Int. J. Tech. Phys. Probl. Eng. (IJTPE) 2022, 14, 34–41. [Google Scholar]
  25. Moumen, A.; Lakhdar, A.; Mansouri, K. Elastoplastic Behavior of Polybutylene Terephthalate Polyester Bio loaded by Two Sustainable and Ecological Fibers of Animal Origin with Two Numerical Methods. Int. J. Tech. Phys. Probl. Eng. (IJTPE) 2021, 13, 29–37. [Google Scholar]
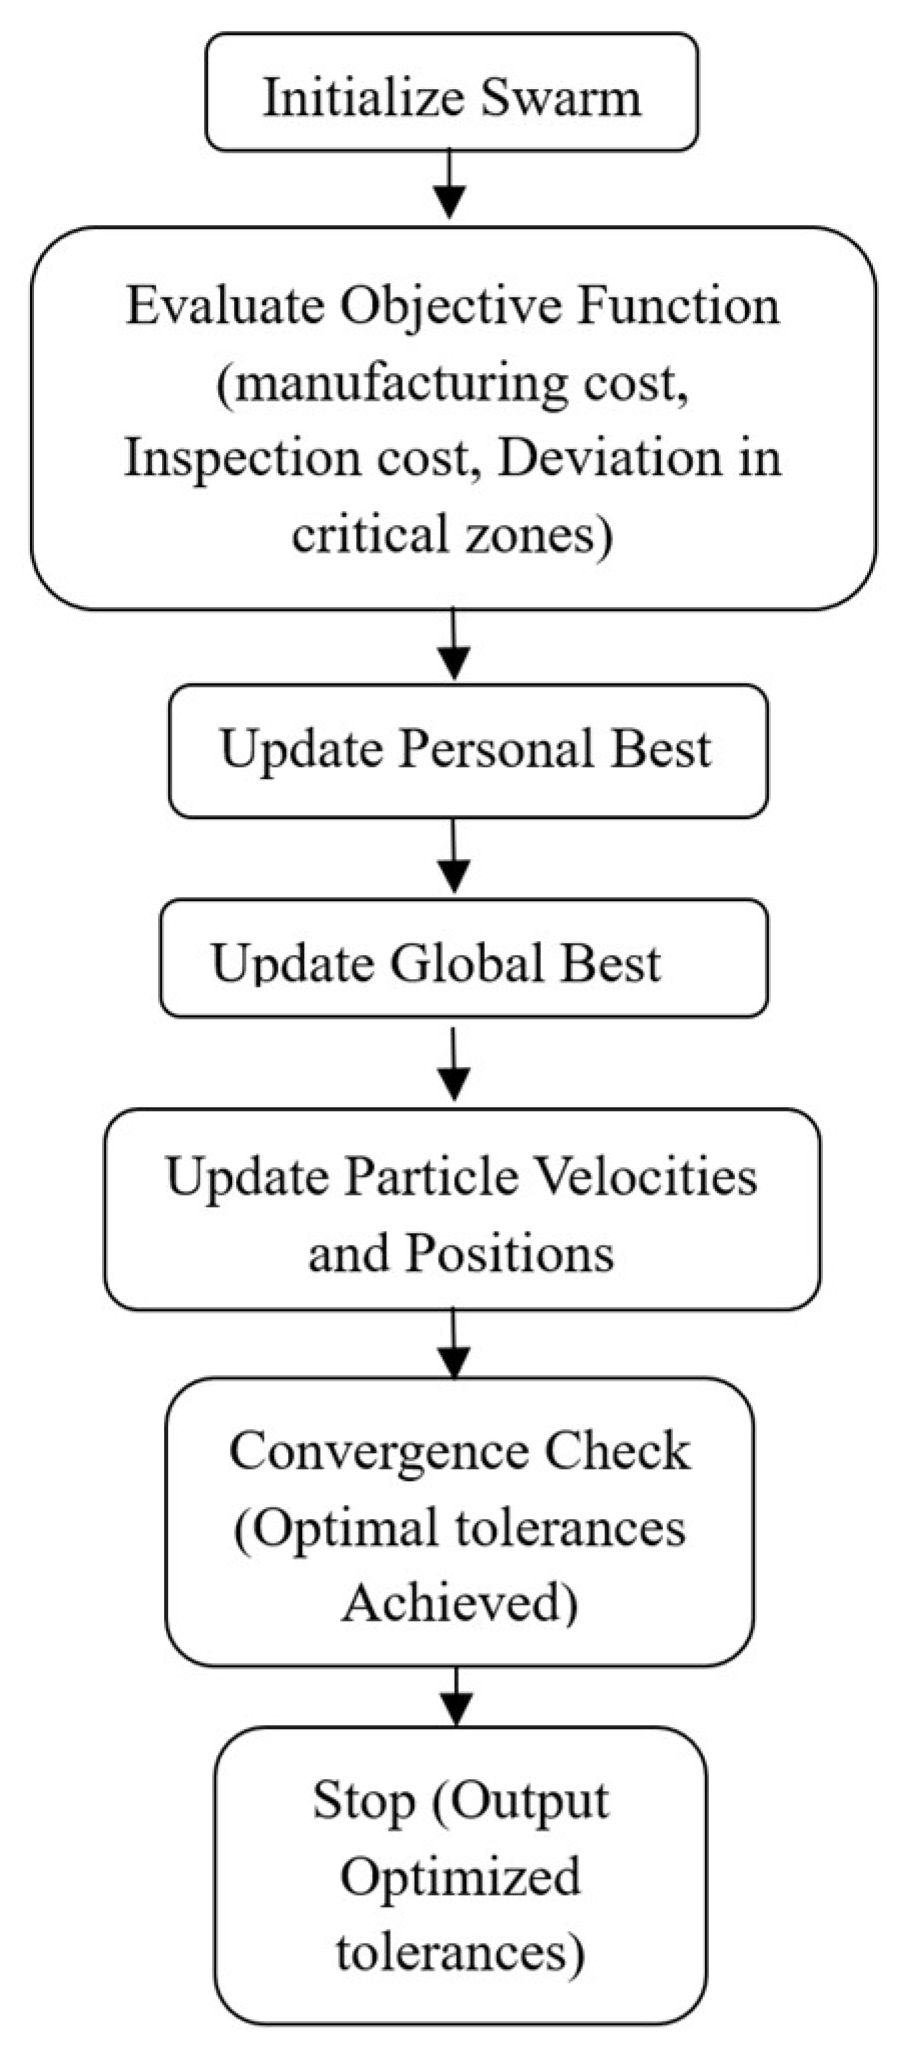
Figure 1. PSO Process for Tolerance Optimization in Freeform Geometries.
Engproc 112 00020 g001
Figure 2. Measurement Point Distribution for the Turbine Blade Using FARO.
Engproc 112 00020 g002
Figure 3. 3D point clouds.
Engproc 112 00020 g003
Figure 4. Initial vs. Optimized Tolerances.
Engproc 112 00020 g004
Figure 5. Cost Reduction by Zone.
Engproc 112 00020 g005
Figure 6. Inspection Time Reduction by Zone.
Engproc 112 00020 g006
Figure 7. Comparison of Initial and Optimized Tolerances.
Engproc 112 00020 g007
Table 1. Measurement Point Distribution for the Turbine Blade.
ZoneCriticalityNumber of Measurement PointsPurpose
Leading EdgeHigh150Ensure aerodynamic precision
Trailing EdgeHigh150Ensure aerodynamic precision
Central RegionMedium80Capture surface deviations
BaseMedium60Verify dimensional conformity
TipLow50Verify overall geometry
Disclaimer/Publisher’s Note: The statements, opinions and data contained in all publications are solely those of the individual author(s) and contributor(s) and not of MDPI and/or the editor(s). MDPI and/or the editor(s) disclaim responsibility for any injury to people or property resulting from any ideas, methods, instructions or products referred to in the content.