Abstract
In the conditions of modern production, the choice of a rational technological process is crucial for the competitiveness and efficiency of enterprises. Traditional decision-making methods are often accompanied by subjectivity and insufficient precision, which determines the need for the implementation of modern information technologies. This paper addresses the selection of an optimal technological process through the application of a developed web-based software application. The software application integrates an algorithm in which a multi-criteria decision-making (MCDM) method—FUCOM (Full Consistency Method)—is implemented, which allows the evaluation and comparison of alternative technological processes according to criteria such as price, time to produce, accuracy, roughness, shape deviation, etc. To confirm the effectiveness of the application, real production data is used, and the results show a significant reduction in time and subjectivity in decision-making. The developed application can be successfully implemented in enterprises of different industries, contributing to the increase in the efficiency of production processes and the optimization of resources.
1. Introduction
In recent years, the optimization and pursuit of innovative and more accessible solutions to engineering problems through software programs, applications, and adaptive tools supporting various industries have been the subject of numerous developments and research [1,2,3].
Modern manufacturing faces constant challenges related to the selection of appropriate technological processes to ensure high productivity, minimal costs, and sustainable development. The complexity of production systems and the increasing number of criteria to be considered necessitate the search for more efficient and precise decision-making tools. In this context, the role of IT and software solutions capable of managing complexity and optimizing technological process selection is growing. Users of these applications expect quick performance, intuitive interfaces, and seamless operation on both desktop and mobile devices. To meet these requirements, it is necessary to use established technologies that ensure both efficiency in development and sustainability as the system grows.
The evolution of Industry 4.0 elevates the digitalization of manufacturing—including digital twins, IIoT, and cloud CAPP systems—to a major factor of competitiveness. As a leading industrial manufacturing sector, mechanical engineering is increasingly applying MCDM methods for evaluation and choices when faced with challenges related to the selection of technologies, materials, manufacturing processes, machines, and tools [4,5,6,7,8,9]. Researchers on the topic [10,11] consider multi-criteria decision-making (MCDM) methods as a tool for optimizing operations such as turning, milling, drilling, etc.
To reduce subjectivity in selection and decision-making in engineering manufacturing, researchers integrate MCDM methods (AHP, TOPSIS, etc.) directly into these platforms [12]. FUCOM stands out as a particularly effective method due to its minimal number of comparisons and built-in consistency check [13]. Until now, there has been no web-based solution that can both integrate FUCOM in the selection of a rational technological process to allow fast input of measured data and statistical control and function equally well on desktop and mobile devices.
This paper presents the development of a web-based software application designed to support the selection of a rational technological process. The application provides an intuitive and user-friendly interface integrating a rational process selection methodology with an implemented algorithm [14] using the MCDM method—FUCOM. This paper provides the theoretical foundations of the applied methods used to develop the web-based software, the features of the developed application, and a demonstration of its practical applicability in real manufacturing conditions.
2. Description of the Developed Web-Based Application for Rational Process Selection
2.1. Application Architecture
The foundation of the developed web application is a well-structured modular architecture based on the principles of layered separation and the use of modern technologies. The system is built in such a way that each major component—user interface, back-end logic, database, and support services—is isolated, well defined, and easy to maintain [15].
The architecture of the developed web application for selecting a rational technological process is shown in Figure 1; each part of the system has a clearly defined role, and the communication between them is well structured.
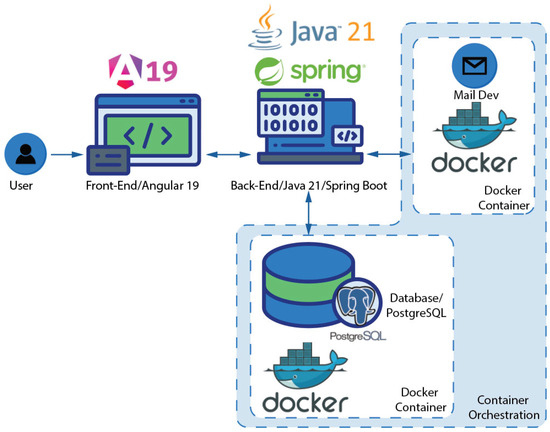
Figure 1.
Application architecture.
The application has been developed using four core technologies:
- Java Spring Boot—for building the back-end and REST API;
- PostgreSQL—as a relational database for data storage and processing;
- Angular—for creating a dynamic and interactive user interface;
- Docker—for containerization and simplified deployment of the entire system.
This combination of technologies provides a solid foundation for the development of modern web-based systems that are sustainable over the long term and easy to maintain, test, and deploy across various environments, including local machines, cloud platforms, and production servers.
The use of Spring Boot enables the rapid development of REST services and efficient database integration through Spring Data JPA [16]. PostgreSQL, meanwhile, is a reliable and productive choice for a database that offers a wide range of functionality, including transactions, indexing, stored procedures, and strong support for JSON data types. Angular provides a modern approach to front-end development, featuring modularity, a component-based structure, and easy state management. Docker makes it easy to build and run your application in different environments through isolated containers, resulting in better compatibility and deployment stability [17].
The architecture presented in Figure 1 illustrates how the main system components—the user interface (Angular), server-side logic (Java Spring Boot), database (PostgreSQL), and email service (MailDev) communicate with each other within an environment managed through Docker containers [18].
2.1.1. User
The user interacts with the application through a web browser. All requests (e.g., login, registration, data access) are sent to the server side of the system via the Angular application, which is responsible for displaying the interface and providing feedback to the user.
2.1.2. Front-End
Angular version 19 [19] is used for implementing the front-end. It is responsible for
- Data visualization;
- Collecting and validating user input;
- Communicating with the back-end via REST API.
The Angular application sends requests to the Spring Boot server and receives data in response, which it then renders for the user.
2.1.3. Back-End
The server-side logic is implemented using Java 21 and Spring Boot [20]. This component is responsible for
- Handling requests from the Angular application;
- Processing business logic;
- Accessing and writing to the PostgreSQL database;
- Sending emails via MailDev;
- Securing resources through robust authentication using JWT [21].
The Spring Boot application runs inside a Docker container and communicates with the other services over an internal Docker network.
2.1.4. Database
PostgreSQL [22] is used as the relational database for storing structured information. It supports
- Relationships between tables (foreign keys);
- Transactions;
- Indexing and query optimization;
- Data types such as JSON for storing flexible data structures.
The database runs in a separate Docker container and communicates directly with the Spring Boot server.
2.1.5. MailDev
MailDev is a container-based email server simulation service that allows
- Sending test emails from the application;
- Visualization of the emails via a web interface;
- Preventing real sending in a test environment.
This is especially useful during development and debugging of email-related functionalities (e.g., user registration or password recovery).
2.1.6. Docker and Containerization
All components of the architecture (Angular, Spring Boot, PostgreSQL, and MailDev) are separated into individual Docker containers [23]. The entire system is managed through Docker Compose—each container starts with a specific configuration and includes
- Network settings;
- Environment variables;
- Data volumes for persistent storage;
- Service dependencies (e.g., the back-end waits for the database to start).
Internal communication between containers is handled via DNS names—for example, the back-end communicates with the database (PostgreSQL), mail service (MailDev), and front-end.
The architecture created follows some of the best practices for a modern web application.
2.2. Application Interface
The purpose of the user interface is to provide clear, intuitive, and efficient interaction between users and the system for rational process selection. A good interface allows quick access to information, enables the input of required parameters, and provides visually understandable results for comparison and analysis.
Several key aspects are considered when designing the user interface:
- Easy access to key functions—users can quickly navigate to different modules of the application.
- Consistent design—uniform buttons, color schemes, and navigation elements are used to ensure intuitive orientation.
- Responsive design—the web application is optimized for various screen resolutions and devices, enabling access from desktops, tablets, and smartphones.
- Ease of future expansion—the interface structure allows for the seamless integration of new functionalities during future development phases.
2.2.1. Home Page
The home page of the web application (Figure 2) is designed to provide orientation to the user as well as quick access to the main features of the web application. It is structured in a way that aims to both provide summary information about the system and guide the user to specific actions, panels, and modules. At the top of the application is the main navigation menu. In the upper right corner of the home page are the Login (pos. 1) and Register (pos. 2) buttons that provide quick and easy access for logging in or creating a new user account (Figure 3). In the central “Hero” area is located the main concept of the application—“Rational technological process selection”. Below this leading section is a short block of text focused on selecting the most effective technology for the user’s specific needs. The link “Get in touch” is added as pos. 3, which allows direct communication with the development team or access to additional information.
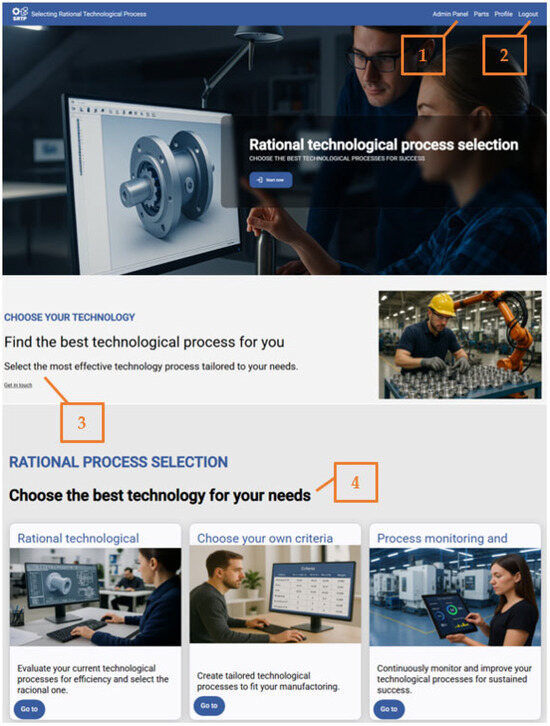
Figure 2.
Home page of application.
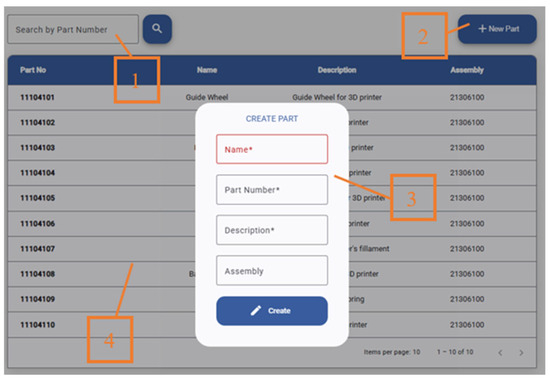
Figure 3.
Page “Part”.
In the next area, “Choose the best technology for your needs” (pos. 4), which presents the main functionalities and modules of the application, is presented through several interactive cards. These cards demonstrate various aspects of process selection, customization, and optimization, helping users quickly and intuitively navigate toward the most suitable solution for their requirements.
With the Home Page structure described, a solid foundation is built for further interactions with the application.
2.2.2. Parts Page
The “Parts” page represents a functional screen within the web application for selecting a rational technological process (Figure 3). In the upper-left corner of the page is a search field (pos. 1), which allows users to quickly locate a specific part by its number. This significantly improves navigation, especially when the list of components is long and the user needs to identify a particular item efficiently.
At the top right is the “New Part” button (pos. 2), which allows adding new parts to the database. When a new part is entered, a dialog interface—“pop-up” window—appears, in which the name, number, and description of the part are entered, as well as which assembly it is part of (where applicable). Centrally located on the page is a detailed table containing a list of parts that are presented with their identification numbers, names, a brief description, and belonging to specific assemblies (pos. 4). This table provides a clear and structured overview of the information and allows easy comparison and quick orientation of the user in the available parts. Also, the table has the ability to scroll through and manage the number of parts displayed, which improves convenience when working with larger amounts of information.
With clearly arranged and user-friendly elements for searching, adding, and organizing information, the “Parts” page provides the speed and functionality needed to effectively manage components in the process of selecting a rational technological process.
2.2.3. Page “Part Dashboard”
Figure 4 shows the main menu in each part, through which the different modules in the application are managed. At the top of it (pos. 1) is a field for previewing the selected 3D model (in this case, the part—Guide wheel for 3D printer). This allows the user to easily and visually identify the selected component. Immediately below it is the name, number, and description of the part. The navigation panel contains the following main function buttons:
- Dashboard (pos. 2) provides an overview of the most important information and the main indicators of the system operation. Here, the user can view the selected rational technological process and the more important information about parameters that are essential for the part.
- Technological processes (pos. 3) takes the user to a module that presents the different alternative technological processes for the production of the particular part, as well as allows the possibility of adding new technological processes.
- Criteria (pos. 4) provides access to the input and management of the specific criteria according to which the evaluation and selection of the technological process is carried out.
- Quality Control (pos. 5) offers a quality control module in which users can input information from part measurements, set parameters, monitor metrics, and manage quality, stability, and capability aspects of selected technological processes.

Figure 4.
Menu of the “Part” page.
Figure 4.
Menu of the “Part” page.

2.2.4. Technological Processes
The “Technological processes” tab (Figure 5) displays a work area of the application designed for a detailed review of the technological processes. On this page, the different alternative technological processes for the production of the given part are entered. For this purpose, a drop-down menu for selecting a specific technological process (e.g., “TP №1”) is located, as well as an “Add new” button that allows adding a new technological process. Below these is a table that contains detailed information about the individual operations, machines, tools, and time for each operation of the selected process (Figure 5).
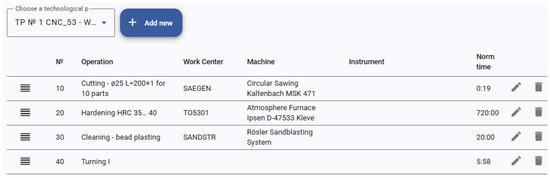
Figure 5.
Tab “Technological processes” of page “Part”.
The columns in the table can be changed by the user, for example, by adding new columns or removing existing ones, i.e., it can be adapted to the needs of the specific production. Each operation is clearly numbered and contains cells with specific information about the parameters and specifications listed so far. With a drag movement of the mouse (if working on a PC) or a swipe of the finger in a touch display, operations can be swapped.
Additionally, below the table are buttons to add a new operation, “New Operation”, or to copy an existing technological process or operation, “Copy”. Also, the operations can be edited or deleted entirely. These functions significantly speed up the process of editing and creating new technological processes.
2.2.5. Criteria
The next button on the menu is “Criteria”, which provides a clear and structured evaluation of the technological processes according to various predefined criteria (Figure 6). The main part of the window is occupied by a table, in which the specific criteria, manually set by the user, are presented in rows. Some of the criteria can be automatically entered if measured values of dimensions or parameters that participate as criteria are available, such as size accuracy, roughness, shape deviation, etc.
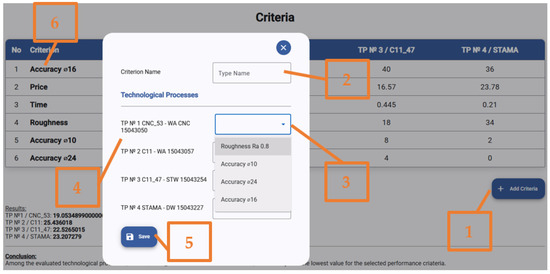
Figure 6.
Defining the criteria of the part.
By clicking “Add criteria” (pos. 1), a “Pop-up” window is displayed for entering and associating criteria to the different technological processes. At the top of the window is the “Criterion Name” (pos. 2), where the user can manually enter or select the name of the criterion to be used for process evaluation (e.g., accuracy, time for production, cost, etc.). Below are listed the technological processes under examination (pos.3), each with a specific designation to a corresponding value that can be assigned via a drop-down menu or text box, depending on the type of criterion. If there are already existing measurements for the technological processes, they can be automatically selected as criteria for them (pos. 4).
The purpose of this window is to allow customization of the system—the user can add new criteria or edit existing ones. This contributes to a more flexible and objective assessment, tailored to the specific needs and priorities of the manufacturing process.
At the bottom of the window is the “Save” button (pos. 5), which saves the changes and closes the dialog box. The intuitive and neat design makes the user’s work easier and ensures correct filling in of the necessary data for further comparison between the alternative technological processes.
In the table (pos. 6), each cell contains numerical values corresponding to the performance of the respective process according to the specific criteria, which allows quick and easy comparison and analysis by the user.
On this page, it is also possible to set the importance of each of the criteria by dragging the mouse (if working on PC) or by swiping a finger on a touch display. The criterion that is most important is placed in first place, and the one that has the lowest weight is placed last. The MCDM method—FUCOM—is calculated in the back-end of the application.
2.2.6. Quality Control
The “Quality Control” tab (Figure 7) provides detailed analysis and monitoring of the quality and stability of the selected rational technological process. In the upper section are fields for selection of a specific technological process (pos. 1) and criterion (pos. 2), according to which the monitoring of the technological process is carried out. If measurement results need to be added for a given criterion (involved in the monitoring of the technological process), the “Add Measurement” button (pos. 3) allows easy insertion of new measurement results. Additionally, for the convenience of the users, there is an “Edit” button (pos. 3) to correct the measured data if a value correction is needed.
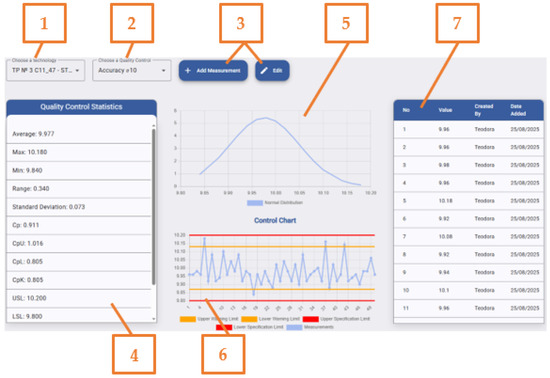
Figure 7.
Quality control of each technological process.
In the “Quality Control Statistics” table (pos. 4), are presented key statistical quality parameters such as average value, maximum and minimum value, standard deviation, and process indices such as Cp, CpU, CpL, and especially the important index of process capability, CpK. These indices allow the user to assess the reliability and capability of the production process.
The control chart displays the warning limits and control limits clearly, making it easy to identify deviations in the quality of the measured values. By clicking on any of the limits in the control chart legend, they can be activated or deactivated, thereby modifying the information provided in graphical form.
The table (pos. 7) in Figure 7 presents a chronological list of measurements, showing the values of the measured data, dates of adding/measuring, “Date Added”, and the user who performed the measurements. This provides traceability and transparency in data analysis.
Organized in this way, the presented interface provides a complete and user-friendly environment for monitoring and quality control, providing the necessary information to make timely decisions and process improvements.
3. Application Validation in Real Manufacturing Conditions
3.1. Selection of the Case Study Object
To validate the developed web-based application for the selection of a rational technological process and to verify its applicability and efficiency, real production data provided by “CERATIZIT Bulgaria AG” are used.
The object of the experimental studies is a cylindrical part that serves as a guide wheel for a 3D printer (Figure 8). Its main purpose is to provide precise guiding and minimize wear or scratching between the contact surfaces.
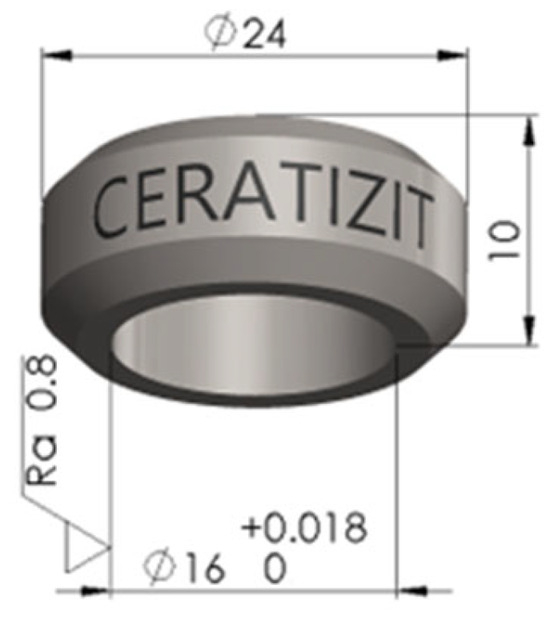
Figure 8.
Guide wheel for 3D printer.
The part has clearly defined geometric dimensions and requirements for accuracy and roughness that are essential for reliable and precise 3D printer operation. The main criteria for selecting this part are
- The production program of the part provides a sufficient statistical volume of data, which is of utmost importance for the correct conclusion of the evaluation of the different technological processes.
- Availability of dimensional accuracy and roughness requirements, which allows for comparing the results of different technological processes, in the development of which precision is one of the main factors. The specified dimensions and their tolerance ranges, as well as the roughness, allow the use of different measuring instruments without requiring expensive or specialized laboratory facilities. In this way, quality control and evaluation methods remain within the limits of generally accepted manufacturing practices.
- Due to its relatively simple but functional construction, the workpiece allows for the easy application of different technological processes, making it suitable for validating the developed software application.
- The production of this part with different technological solutions provides an opportunity to compare the final cost of the part, the machining time, and the quality parameters.
In the process of pre-planning the experimental studies and in close cooperation with the technologists and engineers from “CERATIZIT Bulgaria AG”, six main criteria are developed for the evaluation of each technological process. These criteria reflect the most important aspects of the production and quality of the produced part, “Guide wheel”.
- Inner diameter accuracy ⌀16+0.018;
- Outer diameter accuracy ⌀24 ± 0.2 mm, according to ISO 2768—m [24];
- Length accuracy 10 ± 0.2 mm, according to ISO 2768—m;
- Roughness of machined surface with required value Ra 0.8;
- Cost per part;
- Production time.
All technological processes are evaluated according to the same criteria to ensure a consistent comparison and to avoid inconsistencies caused by different analysis methods. In this way, results become directly comparable, and conclusions are drawn as to which process is rational for specific production needs. This not only provides a realistic assessment of the capabilities of each process but also makes it easier to select the optimal solution depending on predefined production or customer requirements.
Within the framework of the experiment, with the help of the technologists and engineers from “CERATIZIT Bulgaria AG”, four different technological processes are developed, each covering a set of different operations, machines, tools, and materials, all of them being alternative to each other and ensuring the production of quality-approved parts.
For each of the four alternatives, 50 parts are produced to provide a sufficient database for process analysis. To validate the application, the data from the four process flows are entered, and after evaluation, the rational one among them is selected according to the set criteria.
Due to the large set of data generated from the developed four technological processes and the limited text size of this paper to present the information input in the presented application, this paper shows the information input for only one of the four technological processes. In Figure 9, the introduced technology for the technological process, “TP №1 CNC_53”, is shown.
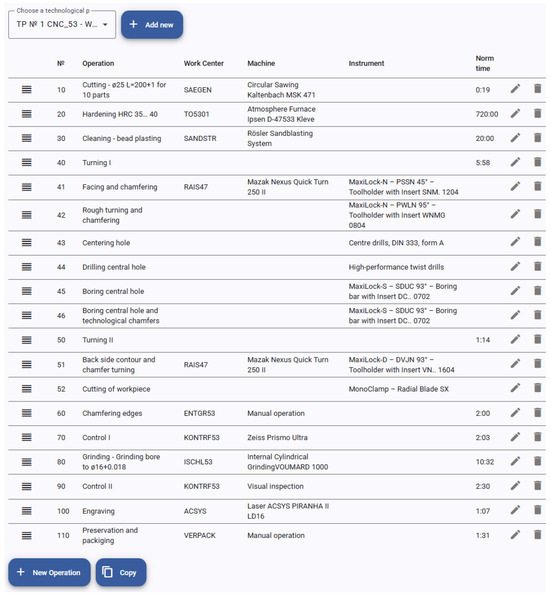
Figure 9.
Technology of “TP№1 CNC_53”.
The measurements of the finished parts are carried out using the following measuring equipment:
- Digital surface roughness tester—SRT 6210 for measuring the surface roughness (Ra) of the machined surfaces, with measuring range—Ra: 0.005 ÷ 16.00 µm;
- Mitutoyo caliper—graduation: 0.02 mm and range: 0–100 mm;
- ETOPOO digital micrometer for internal diameters—graduation: ±0.002 mm and range: 5–30 mm.
The results of the measured data are entered into the developed web application using the page shown in Figure 7. The normalization of these results to a common number that summarizes the obtained dimension for the corresponding technological process is performed in the back-end of the application automatically. The data is normalized as a percentage of values falling between the warning limits. This is why the warning limits have to be manually entered by the user.
Figure 10 illustrates the selection of the criteria by which the technological processes are evaluated; by sliding the criterion and changing its position in the list, its weight is changed. For each of the four technological processes developed, the time to produce one part and its cost are entered. The remaining data that are input in the table are based on the measured responsible dimensions for the part and the roughness. To make the results of the listed criteria comparable, the values obtained from the measurement of the dimensions and roughness of the fifty parts for each of the four technological processes are normalized. Using the MCDM method—FUCOM, which is implemented in the back-end of the application—the weights of the criteria are automatically calculated.
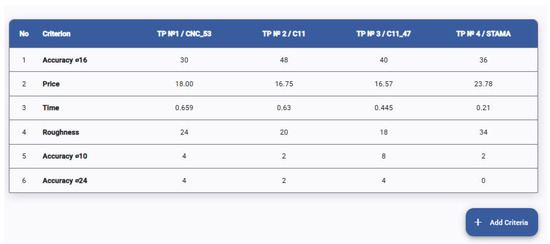
Figure 10.
Defining the criteria for selecting a rational technological process.
3.2. Results of Measurements
After entering the measured values from the real manufactured parts into the web-based application, analysis is performed using the application functionalities. Each of the four processes is evaluated against the selected criteria. The dashboard of the application displays the evaluation of the technological processes in tabular form, as well as the rationale among them (Figure 11).
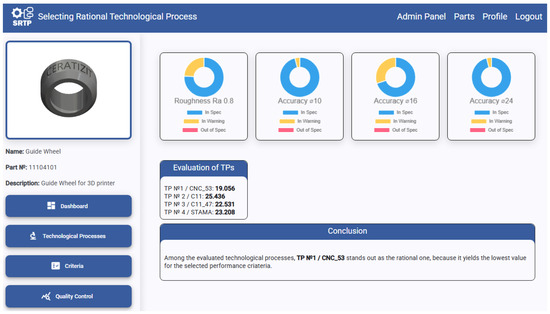
Figure 11.
Result for the selected rational technological process.
The overall complex evaluation obtained by the methodology for selection of a rational technological process shows the following ranking of the considered technological processes: TP №1 < TP №3 < TP №2 < TP №4. The methodology selects the technological process with the lowest score as rational. The combinations of weights introduced can be multiple depending on individual customer needs and production capabilities. Only one of the possible combinations is shown in this paper, since the main objective of this research is the validation and demonstration of the functionality of the developed web-based application in real production conditions.
Figure 12 shows a visualization of the measured values of the parameters used as criteria by a control chart and a normal distribution chart. The control chart allows monitoring the stability of the process by tracking the results against the established control and warning limits. The normal distribution chart demonstrates the density distribution of the measurements around the mean value; it also tracks parameters such as Cp and CpK (capability indices, Cp—capability index and CpK centring capability index), whose values determine the capability of the process relative to the specific parameter being measured.
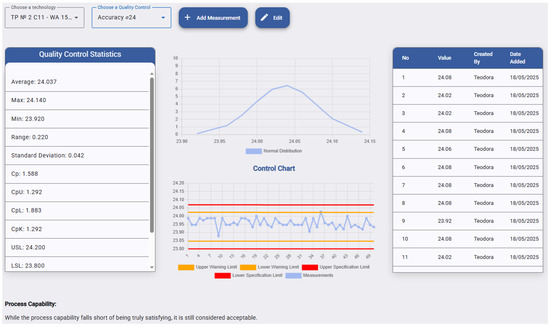
Figure 12.
Results of statistical analysis of one of the quality parameters.
These tools make it easy to quickly diagnose problems, such as deviations or trends, that can affect the quality of production. In addition, the web application enables the tracking and visualization of measured values and statistical indices for all introduced technological processes and all their quality parameters, contributing to a complete analysis and informed technological decision-making.
The combined use of statistical indices, control charts, and automated processing of results in the application ensures objectivity and traceability of the analysis. This allows the engineering team to make informed decisions based on quantitative evidence rather than subjective judgment.
4. Conclusions
The developed web-based application for selection of a rational technological process proves its efficiency, applicability, and practical value in a real production environment. Through its intuitive interface, structured architecture, and built-in methodology, the application greatly assists engineering professionals in making technology decisions. Validation in real production data provided by “CERATIZIT Bulgaria AG” shows that the application can be successfully integrated into industrial production workflow and serve as a tool to support the technologists and engineers.
The application allows the input of multiple technological processes and comparison of their characteristics according to selected criteria (accuracy, time for manufacturing, cost, etc.), as well as visualization of quality control data through statistical indices and control charts. The system is built with flexibility so that it can be extended and adapted to different industrial scenarios. Future versions of the application are planned to include extended functionality such as
- Enhanced user roles and access control, allowing differentiation between various positions within the working environment;
- Capability to store and display detailed design and technological information for each product;
- Tracking of all stages of the product’s lifecycle—from the conceptual design phase to full-scale production implementation;
- Option to generate and print reports based on the analyzed data.
The development of the application in this direction will turn it not only into a tool or application of selection but also into a complete digital platform for technological planning and management of the production process. This aligns with modern trends in industrial digitalization and smart manufacturing—Industry 4.0.
Author Contributions
Conceptualization, T.A. and T.P.; methodology, T.P. and T.A.; software, P.G. and T.P.; validation, T.A., T.P., and P.G.; formal analysis, T.P.; investigation, T.A., P.G., and T.P.; resources, T.A. and T.P.; data curation, T.A.; writing—original draft preparation, T.P.; writing—review and editing, T.A.; visualization, T.P.; supervision, T.A.; project administration, T.P.; funding acquisition, T.P. All authors have read and agreed to the published version of the manuscript.
Funding
This research is supported by the Bulgarian Ministry of Education and Science under the National Program—NP “Young scientists and postdoctoral students—2”.
Institutional Review Board Statement
Not applicable.
Informed Consent Statement
Not applicable.
Data Availability Statement
No new data were created or analyzed in this study.
Acknowledgments
The approbation of the web-based software application, the production of the parts, and the design of their technological processes were realized with the help and assistance of the company “CERATIZIT Bulgaria” AG.
Conflicts of Interest
The authors declare no conflicts of interest.
Abbreviations
The following abbreviations are used in this manuscript:
| IIoT | Industrial Internet of Things |
| CAPP | Computer-aided process planning |
| FUCOM | Full Consistency Method |
| MCDM | Multi-criteria decision-making |
| IT | Information technology |
| REST API | Representational State Transfer Application Programming Interface |
| SQL | Structured Query Language |
| JPA | Java Persistence API |
| JWT | JSON web token |
| JSON | JavaScript Object Notation |
| DNS | Domain Name System |
References
- Zhukov, A.; Bobrova, E.; Popov, I.; Arega, D.B. System analysis of technological processes. Int. J. Comput. Civ. Struct. Eng. 2021, 17, 73–82. [Google Scholar] [CrossRef]
- Tsoneva, Z.; Stoianova, A. Study Feature of Intersecting Elements of the Cylinder Pipe Network. Possibilities for Application of Computer Programs. East. Acad. J. 2016, 1, 89–98. [Google Scholar]
- Tsoneva, Z.; Tachev, M.; Bankova, A.; Parushev, P.; Tenev, S.; Mehmedov, I.; Deneva, P. Descriptive Geometry and Computer Modelling in Support of Planning the Restoration of the Roof Covering of the “Dormition of the Mother of God” Cathedral in Varna. Eng. Proc. 2024, 70, 52. [Google Scholar] [CrossRef]
- Emovon, I.; Oghenenyerovwho, O.S. Application of MCDM Method in Material Selection for Optimal Design: A Review. Results Mater. 2020, 7, 100115. [Google Scholar] [CrossRef]
- Jamwal, A.; Agrawal, R.; Sharma, M.; Kumar, V. Review on Multi-Criteria Decision Analysis in Sustainable Manufacturing Decision Making. Int. J. Sustain. Eng. 2020, 14, 202–225. [Google Scholar] [CrossRef]
- Patel, S.K. A Decision Analysis Model for Gear Material Selection Using MCDM Techniques. Int. J. Sci. Res. Eng. Manag. 2024, 8, 1–5. [Google Scholar] [CrossRef]
- Chatterjee, S.; Chakraborty, S. Material Selection of a Mechanical Component Based on Criteria Relationship Evaluation and MCDM Approach. Mater. Today Proc. 2021, 44, 1621–1626. [Google Scholar] [CrossRef]
- Chakraborty, S.; Jana, T.K.; Paul, S. On the Application of Multi-Criteria Decision Making Technique for Multi-Response Optimization of Metal Cutting Process. Intell. Decis. Technol. 2019, 13, 101–115. [Google Scholar] [CrossRef]
- Chakraborty, S.; Chakraborty, S. A Scoping Review on the Applications of MCDM Techniques for Parametric Optimization of Machining Processes. Arch. Comput. Methods Eng. 2022, 29, 4165–4186. [Google Scholar] [CrossRef]
- Trung, D.D. Multi-Criteria Decision Making under the MARCOS Method and the Weighting Methods: Applied to Milling, Grinding and Turning Processes. Manuf. Rev. 2022, 9, 3. [Google Scholar] [CrossRef]
- Hagag, A.M.; Yousef, L.S.; Abdelmaguid, T.F. Multi-Criteria Decision-Making for Machine Selection in Manufacturing and Construction: Recent Trends. Mathematics 2023, 11, 631. [Google Scholar] [CrossRef]
- Alqoud, A.; Milisavljevic-Syed, J.; Salonitis, K. Multi-Criteria Decision Making in Evaluating Digital Retrofitting Solutions: Utilising AHP and TOPSIS. Procedia CIRP 2025, 132, 184–190. [Google Scholar] [CrossRef]
- Pamučar, D.; Stević, Ž.; Sremac, S. A New Model for Determining Weight Coefficients of Criteria in MCDM Models: Full Consistency Method (FUCOM). Symmetry 2018, 10, 393. [Google Scholar] [CrossRef]
- Peneva, T. Development of an Algorithm for Application for Automated Selection of a Rational Technological Process. Mater. Res. Proc. 2024, 46, 322–329. [Google Scholar] [CrossRef]
- Moreb, M. Design and Implementation of Software Engineering for Modern Web Applications; Advances in Systems Analysis, Software Engineering, and High Performance Computing; IGI Global Scientific Publishing: Hershey, PA, USA, 2024. [Google Scholar] [CrossRef]
- Dhalla, H.K. A Performance Comparison of RESTful Applications Implemented in Spring Boot Java and MS.NET Core. J. Phys. Conf. Ser. 2021, 1933, 012041. [Google Scholar] [CrossRef]
- Rufino, J.; Alam, M.; Ferreira, J.; Rehman, A.; Tsang, K.F. Orchestration of Containerized Microservices for IIoT Using Docker. In Proceedings of the 2017 IEEE International Conference on Industrial Technology (ICIT), Toronto, ON, Canada, 22–25 March 2017; pp. 1532–1536. [Google Scholar] [CrossRef]
- Jaramillo, D.; Nguyen, D.V.; Smart, R. Leveraging microservices architecture by using Docker technology. In Proceedings of the SoutheastCon, Norfolk, VA, USA, 30 March–3 April 2016; pp. 1–5. [Google Scholar] [CrossRef]
- Piastou, M. Comprehensive Performance and Scalability Assessment of Front-End Frameworks: React, Angular, and Vue.js. World J. Adv. Eng. Technol. Sci. 2023, 9, 366–376. [Google Scholar] [CrossRef]
- Wyciślik, Ł.; Latusik, Ł.; Kamińska, A.M. A Comparative Assessment of JVM Frameworks to Develop Microservices. Appl. Sci. 2023, 13, 1343. [Google Scholar] [CrossRef]
- Nardone, M.; Scarioni, C. JSON Web Token (JWT) Authentication. In Pro Spring Security; Apress: Berkeley, CA, USA, 2024. [Google Scholar] [CrossRef]
- Salunke, S.V.; Ouda, A. A Performance Benchmark for the PostgreSQL and MySQL Databases. Future Internet 2024, 16, 382. [Google Scholar] [CrossRef]
- Choudhary, A. Learning Advanced Docker Concepts. In When Docker Meets Java; Apress: Berkeley, CA, USA, 2025. [Google Scholar] [CrossRef]
- ISO 2768-1; General Tolerances—Part 1: Tolerances for Linear and Angular Dimensions Without Individual Tolerance Indications. ISO: Geneva, Switzerland, 1989.


Disclaimer/Publisher’s Note: The statements, opinions and data contained in all publications are solely those of the individual author(s) and contributor(s) and not of MDPI and/or the editor(s). MDPI and/or the editor(s) disclaim responsibility for any injury to people or property resulting from any ideas, methods, instructions or products referred to in the content. |
© 2025 by the authors. Licensee MDPI, Basel, Switzerland. This article is an open access article distributed under the terms and conditions of the Creative Commons Attribution (CC BY) license (https://creativecommons.org/licenses/by/4.0/).