Abstract
A novel model of the electrical demand of a power system capable of representing the hourly power load and its dependence on temperature is presented. The application of the model to the Colombian system is described with an evaluation of the error obtained. For the simulation of the optimal operation of systems with high renewable energy participation, a model such as the one presented is of vital importance in order to take into account the dependence of demand on meteorological variables. It is also necessary for the simulation of the expected effects of climate change on electricity demand.
1. Introduction
1.1. The Rise of Renewable Energy and the Need for Advanced Modeling
The recent decade has been marked by a change in the global electricity generation mix, with a high rate of incorporation of wind and solar energy. These energies have been described as Non-Conventional Renewable Energies (NCREs), to distinguish them from hydroelectric and biomass energy, or as Variable Renewable Energies (VREs), emphasizing their short-term variability.
A successful case of large-scale VRE incorporation is Uruguay [1,2], which has demonstrated that it is possible to reach high levels of incorporation. In 2023, VREs represented more than 40% of this country’s total electricity production. In Uruguay’s National Interconnected System (NIS), the importance of having good models that represent the correlations between hydroelectric, solar, and wind resources and their demand has emerged. It is also essential that these models adequately represent the temporal dependence of variables, which is what makes the system operable. The set of wind and solar generators employed show variations in terms of the duration of their use.The wind does not change instantaneously in an entire region, nor does a cloud instantly block the radiation for all solar plants. In addition, these variations over time are perfectly predictable through simply observing meteorological information.
To efficiently operate systems with high VRE incorporation, it is crucial to have stochastic models that adequately represent the spatial correlations, such as those between different variables, and temporal correlations, such as those between past and present variables. It is also crucial that these models are flexible enough to allow the assimilation of forecast information.
1.2. Energy Transition in Colombia
Currently, a similar energy transition is underway in Colombia [3], shifting from a system reliant on hydroelectric and fossil fuels to one where over 60% of the total capacity will come from NCRE. Figure 1 shows the plans for the Transición Energética Justa (Just Energy Transition) proposed by the Ministry of Mines and Energy.
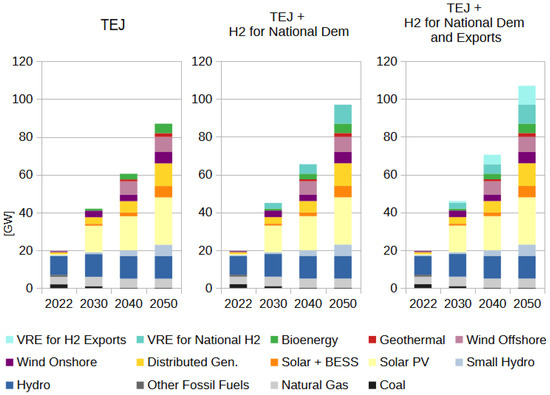
Figure 1.
Energy transition plan of Colombia.
In 2022, Colombia’s installed power capacity was entirely based on fossil fuels (black and shades of gray) and hydroelectric power (shades of blue), with solar power (shades of yellow) and wind power (shades of purple) gradually added. This transition aims to reduce CO2 emissions, decrease dependence on fossil fuels, and lower energy production costs while ensuring a just transition for communities and maintaining environmental responsibility.
1.3. Modeling and Simulation for Energy Planning
The Electrical Energy Systems Simulation (SimSEE) platform was developed at the Institute of Electrical Engineering of the Faculty of Engineering of the Universidad de la República of Uruguay [4]. SimSEE is open source and is the tool used by Uruguay’s Electric Market Administration (ADME), which is responsible for the energy dispatch of the NIS and the subsequent commercial settlement of the wholesale electricity market.
The same models are used to plan the long-term expansion of investments in power generation through simulations of future trends spanning decades, showing different scenarios of the evolution of energy demand and hypotheses on the costs of different technologies.In order for the design of these plans to be consistent with real operations, it is necessary for the planning models to take into account the same correlations between resources and the same restrictions on operation as those of the models used to program and execute the operation of the NIS. These long-term models are also used to analyze the consequences of different future scenarios of climate change for the electric sector [5]. For these analyses, it is necessary to identify and model the dependence of the system demand on temperature.
This work focuses on developing a new type of demand model for SimSEE, based on a Neural Network (NN) trained to capture the dependence of the demand on the type of day (working day, holiday, semi-holiday) and on the temperature, with sufficient parameters to be able to capture weekly and daily consumption cycles.
Since customs and practices are changing, the construction of the demand model should be based on data from recent years to ensure accuracy and reliability.
2. Literature Review
There is an extensive body of literature regarding demand modeling techniques for the long, medium, and short term.
For the short term, in [6,7,8,9], the authors develop different techniques with a focus on short-term forecasting. Ref. [6] is based on Machine Learning, ref. [7] shows the application of a modified Sparrow search algorithm, ref. [8] is a good example of spatiotemporal correlation modeling with a virtual power plant, and ref. [9] shows a technique based on time series decomposition. The work in [10] presents a model for daily demand forecasting based on the GRU-SSA technique.
In [11], a multi-resolution model is presented. The work in [12] presents an interesting methodology for obtaining a probabilistic model applying a de-noising technique. In [13], an interpretable machine learning model is presented.
For the medium–long term, refs. [14,15,16] are good examples. The first is based on LSTM-MLP, the second on classical LEAP applied for China’s energy sectors, and the third describes application in the Iraq energy sector.
For future power systems with high levels of VRE integration, models like those presented in [17,18,19] are good examples, showing the good performance of the models in demand-side management.
The work in [20] is a good example of the application of Kolmogorov–Arnold Networks for demand forecasting.
Some of these models attempt to capture spatiotemporal disaggregation down to the user level, while others attempt to capture this at the aggregate market level [21,22].
Finally, the study in [23] shows an unusual approach using a Grey Model for energy import forecasting.
3. Methodology
3.1. Proposed Model
Figure 2 shows the structure of the Artificial Neural Network (ANN) proposed, which will be referred to as TANNAT (Traveler Artificial Neural Network Around Time). The inputs into the ANN are the type of day (0: working day; 1: semi-holiday; 2: holiday), the temperature, and an array of time-signaling inputs. The time-signaling inputs are a series of powers, sines, and cosines of the time. In [24], similar time-signaling inputs are used to estimate the day-ahead energy demand.
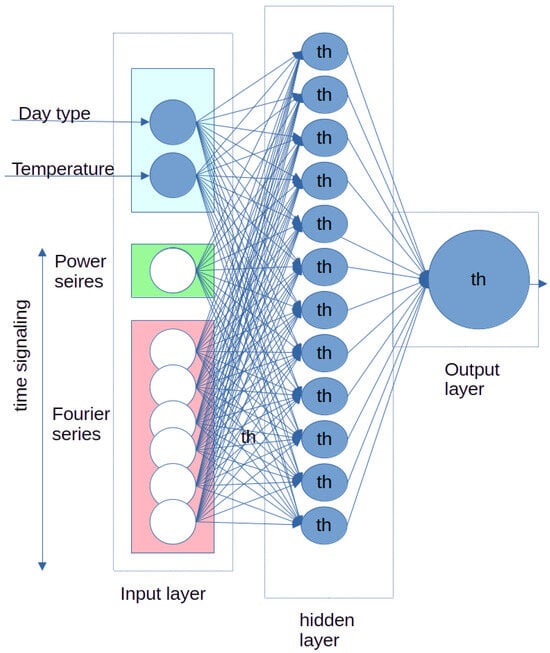
Figure 2.
TANNAT network structure for each of the regions.
3.2. Application of the Model to Colombia
As an example of the application, demand models for SimSEE of Colombia were created considering the historical information of the hourly demand for the year 2023 and the corresponding surface temperature series obtained from the ERA5 [25] reanalysis simulations for the same period. The demand of the Colombian NIS was subdivided into the five regions shown in Table 1, geographically distributed as shown in Figure 3.

Table 1.
Colombian regions.
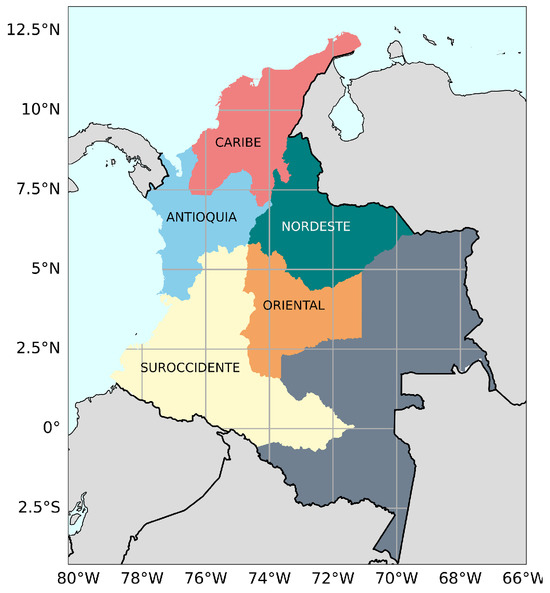
Figure 3.
Geographical distribution of the electricity demand regions of Colombia. Different colors indicate different electricity demand regions, while gray corresponds to areas not integrated into the NIS.
For each region in the table, the main city, the geographic location, and the minimum, average, and maximum of the hourly demand and temperature recorded during the year 2023 are shown.
For each of the five regions, the network was trained with the hourly series of day type, power, and temperature corresponding to the year 2023. The training was also carried out without the temperature in order to obtain a measure of the reduction in the model’s error by incorporating the temperature information as input.
4. Results
4.1. Main Results
Table 2 shows the MAE for the hourly power estimation as a percentage of the mean demand of each region. The rows beginning with “WT” show the results for the model with the hourly temperature as input while the rows beginning with “WOT” are the results for the model without the hourly temperature as input. The TANNAT model was built with a hidden layer of 12 neurons using hyperbolic tangent activation, followed by an output layer with a single neuron using hyperbolic tangent activation. As time-signaling inputs, the cosine and sine series representing the first weekly and the five first daily harmonics in the Fourier series were used.
Table 2.
Error measures of the trained model.
Figure 4 shows an example of the graphical interface of the training application. It shows the data in green, and the model output affecting the temperature input in −3 °C and +3 °C in blue and red, respectively. The days with thicker lines correspond to testing data days, which were not used for training.
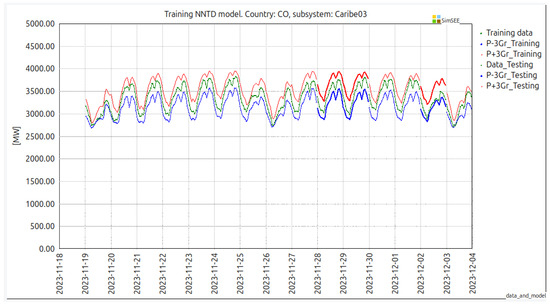
Figure 4.
Example of model output accuracy versus training and test data with a ± 3 °C variation in temperature input. Red and blue lines correspond to upwards and downwards perturbation on temperature while green lines correspond to ground truth data. Thin lines correspond to training data while bold lines correspond to testing data.
Figure 5a–e show the results of the models with and without temperature (WT) as input for the five regions. The figures show the conditional value at risk of 20% (CVaR) of the absolute error as a percentage of the expected demand value for each hour of the day. As can be seen, the sensitivity to temperature in each region is different. The Caribe region has the highest sensitivity (Figure 5a), while the Oriente region has practically no dependence on temperature (Figure 5e). The Antioquia, Suroccidente, and Nordeste regions have moderate sensitivity during daylight hours.
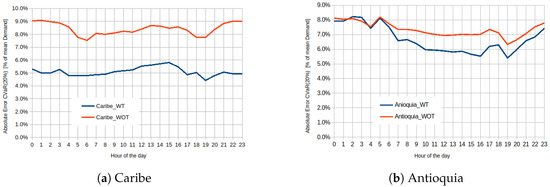
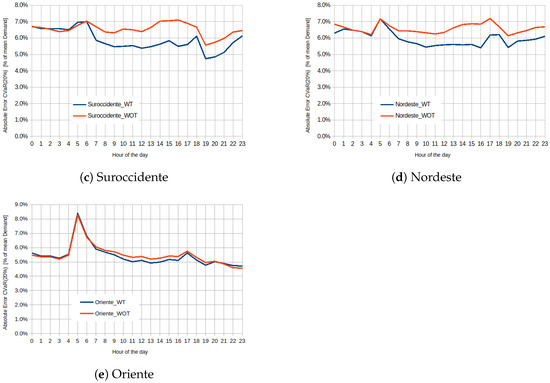
Figure 5.
MAE CVaR (20%) WT and WOT model.
4.2. Demand Profile
Figure 6a,b show records of temperature and demand in terms of the daily minimum, average, and maximum for the Caribe and Oriente regions, which have the highest and lowest demand dependencies on temperature according to the proposed model.
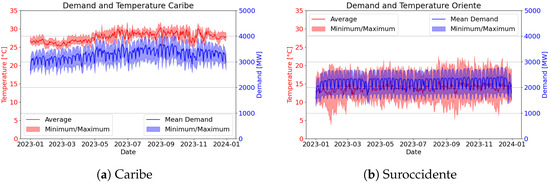
Figure 6.
Demand and temperature records for the year 2023.
Caribe is mainly a warm region with a demand profile associated with tourism and services, and the demand clearly follows the temperature patterns here.
In contrast, Oriente has a mild climate, classified as subtropical highland. Bogotá, the region’s main city and the country’s capital, has a demand primarily driven by industry and services.
For these reasons, differences between regional demand sensitivities to temperature were expected, given the significant variations in energy uses and temperature profiles.
4.3. Alternative Model Contrast: Evaluation of the Impact of Past Inputs
Studies such as [1] have suggested a strong influence of the previous day’s temperature in the day-ahead electricity demand based on the thermal inertia of buildings.
On that basis, an alternative to the model presented was suggested to contrast with the main model developed for evaluation, where the same Neural Network structure would also use the past 24 hours of the input signals to produce the demand forecast for the next hour. That is, for each input, instead of a single value, the network is to be fed with a 24 h long vector.
Table 3 presents the error results obtained with this model. To obtain these results, the model was trained with the same datasets as for the models presented in the previous sections.
Table 3.
Error measures of the trained alternative model.
The results indicate an improvement in the forecast performance. However, in this instance, where the focus is on long-term demand prediction, in which temperature is a synthetic value produced by random number generators based on reanalysis data and long-term climate trends, the actual information gain from using a 1-hour input or a 24-hour vector is difficult to evaluate.
Thus, this model seems more suitable for short-term forecasts, with which precise temperature predictions are available.
4.4. Execution Time
The training of the ANN of each region takes, on average, 4 min using a computer with an Intel Core 7 150U processor with 12 cores (Intel: Santa Clara, CA, USA).
Running a year-long hourly simulation takes less than 10 s, with the same specifications.
5. Conclusions and Future Work
5.1. Accuracy of the Model
According to the results presented here, the developed model has a good ability to represent the regional demands of Colombia and its dependence on temperature, in terms of predicting both daily energy and hourly power. The ability to improve the estimation of hourly power and its effect on temperature is considered of vital importance in order to improve forecasts of the rotating reserve and the reserve assigned to the automatic generation control for monitoring the power balance, in combination with wind and solar generation forecasts.
5.2. Ease of Use
The model presented here is generic enough to adapt to different demand profiles, as it showed good performance in adapting to different demand profiles such as those of Caribe and Oriente.
The model is also generic enough to be fed with either long-term climate trends or short-term weather forecasts.
This is a shallow network model that can be trained in minutes and can run a forecast in seconds for any region using an average computer available on the market.
5.3. Future Works
As a possible improvement to the model, we propose feeding back the estimation errors, online, day by day, so that the model adapts to changes in the demand’s behavior. This is the strategy used in [21], reporting a different type of model, for the operation of Uruguay’s system.
The content of this article is entirely the responsibility of its authors and does not necessarily reflect the position of the institutions of which they are part of.
Author Contributions
Conceptualization, R.C.; methodology, V.C. and R.C.; software, M.S.; validation, M.S., G.F. and J.A.C.; formal analysis, R.C. and G.F.; investigation, R.C.; resources, G.A.J.E.; data curation, J.A.C.; writing—original draft preparation, J.A.C.; writing—review and editing, G.F.; visualization, G.F.; supervision, G.A.J.E.; project administration, R.C.; funding acquisition, R.C. All authors have read and agreed to the published version of the manuscript.
Funding
This research received no external funding.
Data Availability Statement
Raw data available at https://sourceforge.net/projects/simsee/files/Modelo_Colombia/.
Conflicts of Interest
The authors declare no conflicts of interest.
References
- Cornalino, E.; Soubes, P.; Palacio, J.F.; Alvarez, M.C.; Coppes, E.; Casaravilla, G.; Chaer, R. Handling the intermittence of wind and solar energy resources, from planning to operation. Uruguays success. In Proceedings of the 36th USAEE/IAEE North American Conference, Washington, DC, USA, 23–26 September 2018; pp. 1–5. Available online: https://iie.fing.edu.uy/publicaciones/2018/CSPACCC18 (accessed on 1 March 2025).
- Casaravilla, G.; Chaer, R. Energy transition of Uruguay. IAEE Energy Forum 2021, 11–14. Available online: https://iie.fing.edu.uy//publicaciones/2021/CC21 (accessed on 1 March 2025).
- Escenarios Nacionales Transición Energética Justa; Ministerio de Minas y Energía: Bogotá, Colombia, 2024. Available online: https://www.minenergia.gov.co/documents/12383/Escenarios-TEJ-2024.pdf (accessed on 1 March 2025).
- SimSEE. IIE-FING-UdeLaR. 2022. Available online: https://simsee.org (accessed on 1 March 2025).
- Caporale, X.; Camacho, V.; Casaravilla, G.; Chaer, R. Evaluación Técnico-Económica del Impacto del Cambio Climático en la Cuenca Del Río de la Plata en la Generación Eléctrica (Spanish); World Bank Group: Washington, DC, USA, 2023. [Google Scholar]
- Yousaf, H.; Munir, K.; Hassan, A.; Haris, M.; Bokhari, S.A.S.; Ullah, K. Time Series and Machine Learning Methods for Short-Term Load Forecasting in Modern Power Systems. In Proceedings of the 2024 International Conference on Electrical, Communication and Computer Engineering (ICECCE), Kuala Lumpur, Malaysia, 30–31 October 2024; pp. 1–6. [Google Scholar] [CrossRef]
- Fang, L.; Li, Z.; Zhang, K.; Liu, K.; Chen, B. Short-Term Load Forecasting Model Based on Modified Sparrow Search Algorithm. In Proceedings of the 2024 IEEE 6th International Conference on Power, Intelligent Computing and Systems (ICPICS), Shenyang, China, 26–28 July 2024; pp. 251–255. [Google Scholar] [CrossRef]
- Zhang, J.; Hu, X.; Ren, C.; Zhan, Z.; Wang, T.; Ma, D. Short-Term Load Forecasting Based on Spatial-Temporal Correlation for Virtual Power Plant. In Proceedings of the 2024 3rd International Conference on Power Systems and Electrical Technology (PSET), Tokyo, Japan, 5–8 August 2024; pp. 791–796. [Google Scholar] [CrossRef]
- Huang, Q.; Zhang, K.; Liu, T.; Zhang, X.; Sun, L.; Wu, P.; Li, L.; Zhang, X. Short Term Load Forecasting Method Based on Time Series Decomposition. In Proceedings of the 2024 4th International Conference on Energy Engineering and Power Systems (EEPS), Hangzhou, China, 9–11 August 2024; pp. 411–414. [Google Scholar] [CrossRef]
- Tang, X. Optimizing LSTM, Bi-LSTM, and GRU Models with SSA for Daily Electricity Forecasting. In Proceedings of the 2024 5th International Conference on Intelligent Computing and Human-Computer Interaction (ICHCI), Nanchang, China, 27–29 September 2024; pp. 53–58. [Google Scholar] [CrossRef]
- Wang, C.; Pinson, P.; Wang, Y. Seamless and Multi-Resolution Energy Forecasting. IEEE Trans. Smart Grid 2025, 16, 383–395. [Google Scholar] [CrossRef]
- Miraki, A.; Parviainen, P.; Arghandeh, R. Probabilistic forecasting of renewable energy and electricity demand using Graph-based Denoising Diffusion Probabilistic Model. Energy AI 2025, 19, 100459. [Google Scholar] [CrossRef]
- Karuparthi, Y.; Shoaib, S.H.; Kommareddi, H.C.; Jothi, J.A.A. Predicting Energy Demand with Interpretable Machine Learning Models. In Proceedings of the 2024 International Conference on Artificial Intelligence, Metaverse and Cybersecurity (ICAMAC), Dubai, United Arab Emirates, 25–26 October 2024; pp. 1–6. [Google Scholar] [CrossRef]
- Kim, D.; Lee, D.; Joo, S.-K.; Wi, Y.-M. Medium-Term Minimum Demand Forecasting Based on the Parallel LSTM-MLP Model. IEEE Access 2024, 12, 195319–195331. [Google Scholar] [CrossRef]
- Li, S.; Kong, W.; Wang, Y.; Yuan, L. Medium and long-term energy demand forecasts by sectors in China under the goal of ‘carbon peaking & carbon neutrality’: Based on the LEAP-China model. Energy 2024, 310, 133017. [Google Scholar] [CrossRef]
- Aldarraji, M.; Vega-Márquez, B.; Pontes, B.; Mahmood, B.; Riquelme, J.C. Addressing energy challenges in Iraq: Forecasting power supply and demand using artificial intelligence models. Heliyon 2024, 10, e25821. [Google Scholar] [CrossRef] [PubMed]
- Ahsan, M.; Aziz, M.O.; Bokhari, S.A.S.; Haris, M.; Iqbal, M.; Ullah, K. Enhancing Short-Term Load Forecasting Accuracy in the Power Systems Using a Hybrid CNN-GRU Model. In Proceedings of the 2024 International Conference on Electrical, Communication and Computer Engineering (ICECCE), Kuala Lumpur, Malaysia, 30–31 October 2024; pp. 1–5. [Google Scholar] [CrossRef]
- Peng, J.; Kimmig, A.; Wang, D.; Niu, Z.; Liu, X.; Tao, X.; Ovtcharova, J. Energy consumption forecasting based on spatio-temporal behavioral analysis for demand-side management. Appl. Energy 2024, 374, 124027. [Google Scholar] [CrossRef]
- Castro, V.; Georgiou, M.; Jackson, T.; Hodgkinson, I.R.; Jackson, L.; Lockwood, S. Digital data demand and renewable energy limits: Forecasting the impacts on global electricity supply and sustainability. Energy Policy 2024, 195, 114404. [Google Scholar] [CrossRef]
- Jiang, M.; Zhou, H. D_KAN Model: Enhancing Power Load Forecasting with Kolmogorov-Arnold Networks. In Proceedings of the 2024 4th International Conference on Energy Engineering and Power Systems (EEPS), Hangzhou, China, 9–11 August 2024; pp. 335–338. [Google Scholar] [CrossRef]
- Cornalino, E.; Camacho, V.; Vallejo, D.; Gaggero, G.; Groposo, V. Probabilistic Modeling for the Uruguayan electrical load: Present capacity and current improvements. In Proceedings of the 2021 IEEE URUCON, Montevideo, Uruguay, 24–26 November 2021; pp. 351–354. [Google Scholar] [CrossRef]
- Cornalino, E.; Chaer, R. Probabilistic Electric Load Forecasting Model for the Uruguayan Interconnected Electrical System. In Proceedings of the International Conference on Renewable Energies and Power Quality (ICREPQ’18), Salamanca, Spain, 21–23 March 2018. [Google Scholar]
- Zhou, W.; Chang, J.; Zuo, W.; Wang, F. A seasonal grey model for forecasting energy imports demand from information differences perspective. Appl. Math. Model. 2025, 140, 115907. [Google Scholar] [CrossRef]
- Rodríguez, F.; Maqueda, E.; Fernández, M.; Pimenta, P.; Marques, M.I. A novel methodology for day-ahead buildings energy demand forecasting to provide flexibility services in energy markets. Int. J. Electr. Power Energy Syst. 2024, 161, 110207. [Google Scholar] [CrossRef]
- Hersbach, H.; Bell, B.; Berrisford, P.; Biavati, G.; Horányi, A.; Muñoz Sabater, J.; Nicolas, J.; Peubey, C.; Radu, R.; Rozum, I.; et al. ERA5 hourly data on single levels from 1940 to present. Copernicus Climate Change Service (C3S) Climate Data Store (CDS). 2023. Available online: https://doi.org/10.24381/cds.adbb2d47 (accessed on 1 March 2025).
Disclaimer/Publisher’s Note: The statements, opinions and data contained in all publications are solely those of the individual author(s) and contributor(s) and not of MDPI and/or the editor(s). MDPI and/or the editor(s) disclaim responsibility for any injury to people or property resulting from any ideas, methods, instructions or products referred to in the content. |
© 2025 by the authors. Licensee MDPI, Basel, Switzerland. This article is an open access article distributed under the terms and conditions of the Creative Commons Attribution (CC BY) license (https://creativecommons.org/licenses/by/4.0/).