Proceeding Paper

Spectroscopic Ellipsometry Detection of Prostate Cancer Bio-Marker PCA3 Using Specific Non-Labeled Aptamer: Comparison with Electrochemical Detection †

1
Material and Engineering Research Institute, City Campus, Sheffield Hallam University, Howard Street, Sheffield S1 1WB, UK
2
Biomolecular Research Centre, City Campus, Sheffield Hallam University, Howard Street, Sheffield S1 1WB, UK
3
Department of Chemistry, The Dainton Building, The University of Sheffield, Brook Hill, Sheffield S3 7HF, UK
*
Author to whom correspondence should be addressed.
Presented at the 1st International Electronic Conference on Chemical Sensors and Analytical Chemistry, 1–15 July 2021; Available online: https://csac2021.sciforum.net/.
Chem. Proc. 2021, 5(1), 65; https://doi.org/10.3390/CSAC2021-10453
Published: 30 June 2021

Abstract

:
The most common prostate cancer (PCa) diagnostics, which are based on detection of prostate-specific antigens (PSA) in blood, have specificity limitations often resulting in both false-positive and false-negative results; therefore, improvement in PCa diagnostics using more specific PCa biomarkers is of high importance. Studies have shown that the long noncoding RNA Prostate Cancer Antigen 3 (lncPCA3) that is over-expressed in the urine of prostate cancer patients is an ideal biomarker for non-invasive early diagnostics of PCa. Geno-sensors based on aptamer bioreceptors (aptasensors) offer cost- and time-effective, and precise diagnostic tools for detecting PCa biomarkers. In this study, we report on further developments of RNA-based aptasensors exploiting optical (spectroscopic ellipsometry) measurements in comparison with electrochemical (CV and IS) measurements published earlier. These sensors were made by immobilization of thiolated CG-3 RNA aptamers on the surface of gold. Instead of a redox-labelled aptamer used previously in electrochemical measurements, a non-labelled aptamer was used here in a combination with total internal reflection ellipsometry (TIRE) measurements. The results obtained by these two methods were compared. The method of TIRE is potentially highly sensitive and comparable in that respect with electrochemical methods capable of detection of PCA3 in sub-pM levels of concentration. The required selectivity is provided by the high affinity of PCA3-to-aptamer binding with KD in the 10−9 M range. The spectroscopic ellipsometry measurements provided additional information on the processes of PCA3 to aptamer binding.

1. Introduction

Prostate cancer (PCa) is considered as one of the most common types of cancer worldwide, and is the second leading cause of mortality among men after lung cancer [1,2]. There are clinical challenges for PCa early-stage diagnosis related to the asymptomatic nature of the disease and the similarity of its symptoms to benign prostatitis [3]. Early diagnosis of PCa can reduce mortality rates and increase the opportunity for effective medical interventions, therefore, the development of reliable diagnostics of PCa is of high importance [4,5]. Current diagnostics of PCa is based on the detection of total serum prostate-specific antigens (PSA) in blood followed by (if PCa suspected) digital rectal examination and imaging studies [6,7]. However, the lack of specificity of PSA markers often leads to both false-positive and false-negative results of the PSA test [8]. Hence, identifying alternative specific prostate cancer biomarkers and developing methods for their detection in the early stage of the disease is of high importance nowadays [9,10]. Several PCa biomarkers have been identified as being over-expressed in prostate tumours [11]. The differential display code 3 (DD3) gene, also known as prostate cancer antigen 3 (PCA3), the long non-coding RNA (lncRNA) discovered in 1999 [12] has been widely accepted as one of the specific biomarkers for malignant PCa [13,14,15]. PCA3 levels can predict the prostatic biopsies’ outcome, especially in combination with other PCa biomarkers, such as PSA, and can reduce the likelihood of false-positive results. The Prognesa® test based on simultaneous detection of PCA3 and PSA using quantitative nucleic acid amplification with high sensitivity and specificity is approved in USA [16]. However, such a test is time-consuming and expensive. The development of PCA3 biosensors for express, accurate and cost-effective diagnostics of PCa is a subject of high importance. Recent developments in biosensing technologies related to the use of aptamers, synthetic bioreceptors having specifically designed sequences of RNA or DNA oligonucleotides to provide the antibody-like function towards a wide range of analytes, leads to substantial progress in cancer diagnostics (including prostate cancer) [17,18]. The RNA-based aptamer (CG3 aptamer), with a high affinity towards 277-bases section of PCA3 transcript, has been developed recently [19]. The successful application of the CG3 aptamer functionalized with ferrocene at C5′ terminal and immobilized on the surface of gold screen-printed electrodes via thiol group at C3′ terminal for electrochemical in-vitro detection of PCA3 in low concentrations down to sub-pM range was reported for the first time in [20].
One of the most attractive optical biosensing technology developed in the last decade was the method of total internal reflection ellipsometry (TIRE) which is a combination of spectroscopic ellipsometry (SE) and surface plasmon resonance (SPR) [21]. The method of TIRE has a high sensitivity (10 times higher than conventional SRP) and thus is particularly attractive for detection of small molecules, such as mycotoxins, in concentrations down to ppt level [22,23]; it is also suitable for the study of adsorption kinetics and subsequent evaluation of the affinity of bioreceptors (antibodies and aptamers). This work is mostly focused on TIRE detection of PCA3 in direct assay with unlabelled CG3 aptamers immobilized on the surface of gold. The results are compared to our data of electrochemical detection of PCA3 using redox-labelled CG3 aptamer reported earlier in [20]. Our observations are a step towards the long-term aim of developing a novel, accurate, simple, and cost-effective diagnostic tool for the early detection of prostate cancer.

2. Materials and Methods

2.1. Chemicals

HEPES binding buffer (HBB) pH 7.2–7.6, sodium phosphate (Na2HPO4), potassium phosphate (KH2PO4), potassium chloride (KCl), magnesium chloride (MgCl2), dithiothreitol (DTT), and sodium chloride (NaCl), were procured from Sigma-Aldrich (UK). All reagents were of analytical grade. The biological target, the 277 nt target analyte fragment of lncRNA PCA3, was purchased from Eurofins Genomics (Germany). The label-free CG-3 RNA-based aptamer (5′-AGUUUUUGCGUGUGCCCUUUUUGUCCCC-3′SH) for optical measurements was acquired from Sangon-Biotech, China. The same aptamer, but labelled with ferrocene at 5′, was used previously [20] for electrochemical detection of PCA3. Before immobilization, the stock solution of aptamer (100 µM) was diluted at desired concentration with PBB supplemented with 2 mM of DTT, then diluted aptamer solution was activated by thermocycling in PCR unit (Prime TC3600) by heating to 90 °C for 5 min and cooling down to 4 °C for 5 min. Immobilization of aptamers was carried out in 100 M HEPES buffer (pH 7.4) with the addition of 2.5 mM DTT and 3 mM MgCl2. Optical measurements were performed in the detection buffer, e.g., 100 mM PBS (pH 7.4), prepared by dissolving 10 mM Na2HPO4, 1.56 mM KH2PO4, 2.5 mM KCl, and 135 mM NaCl in water. Milli-Q water was used for all preparations.

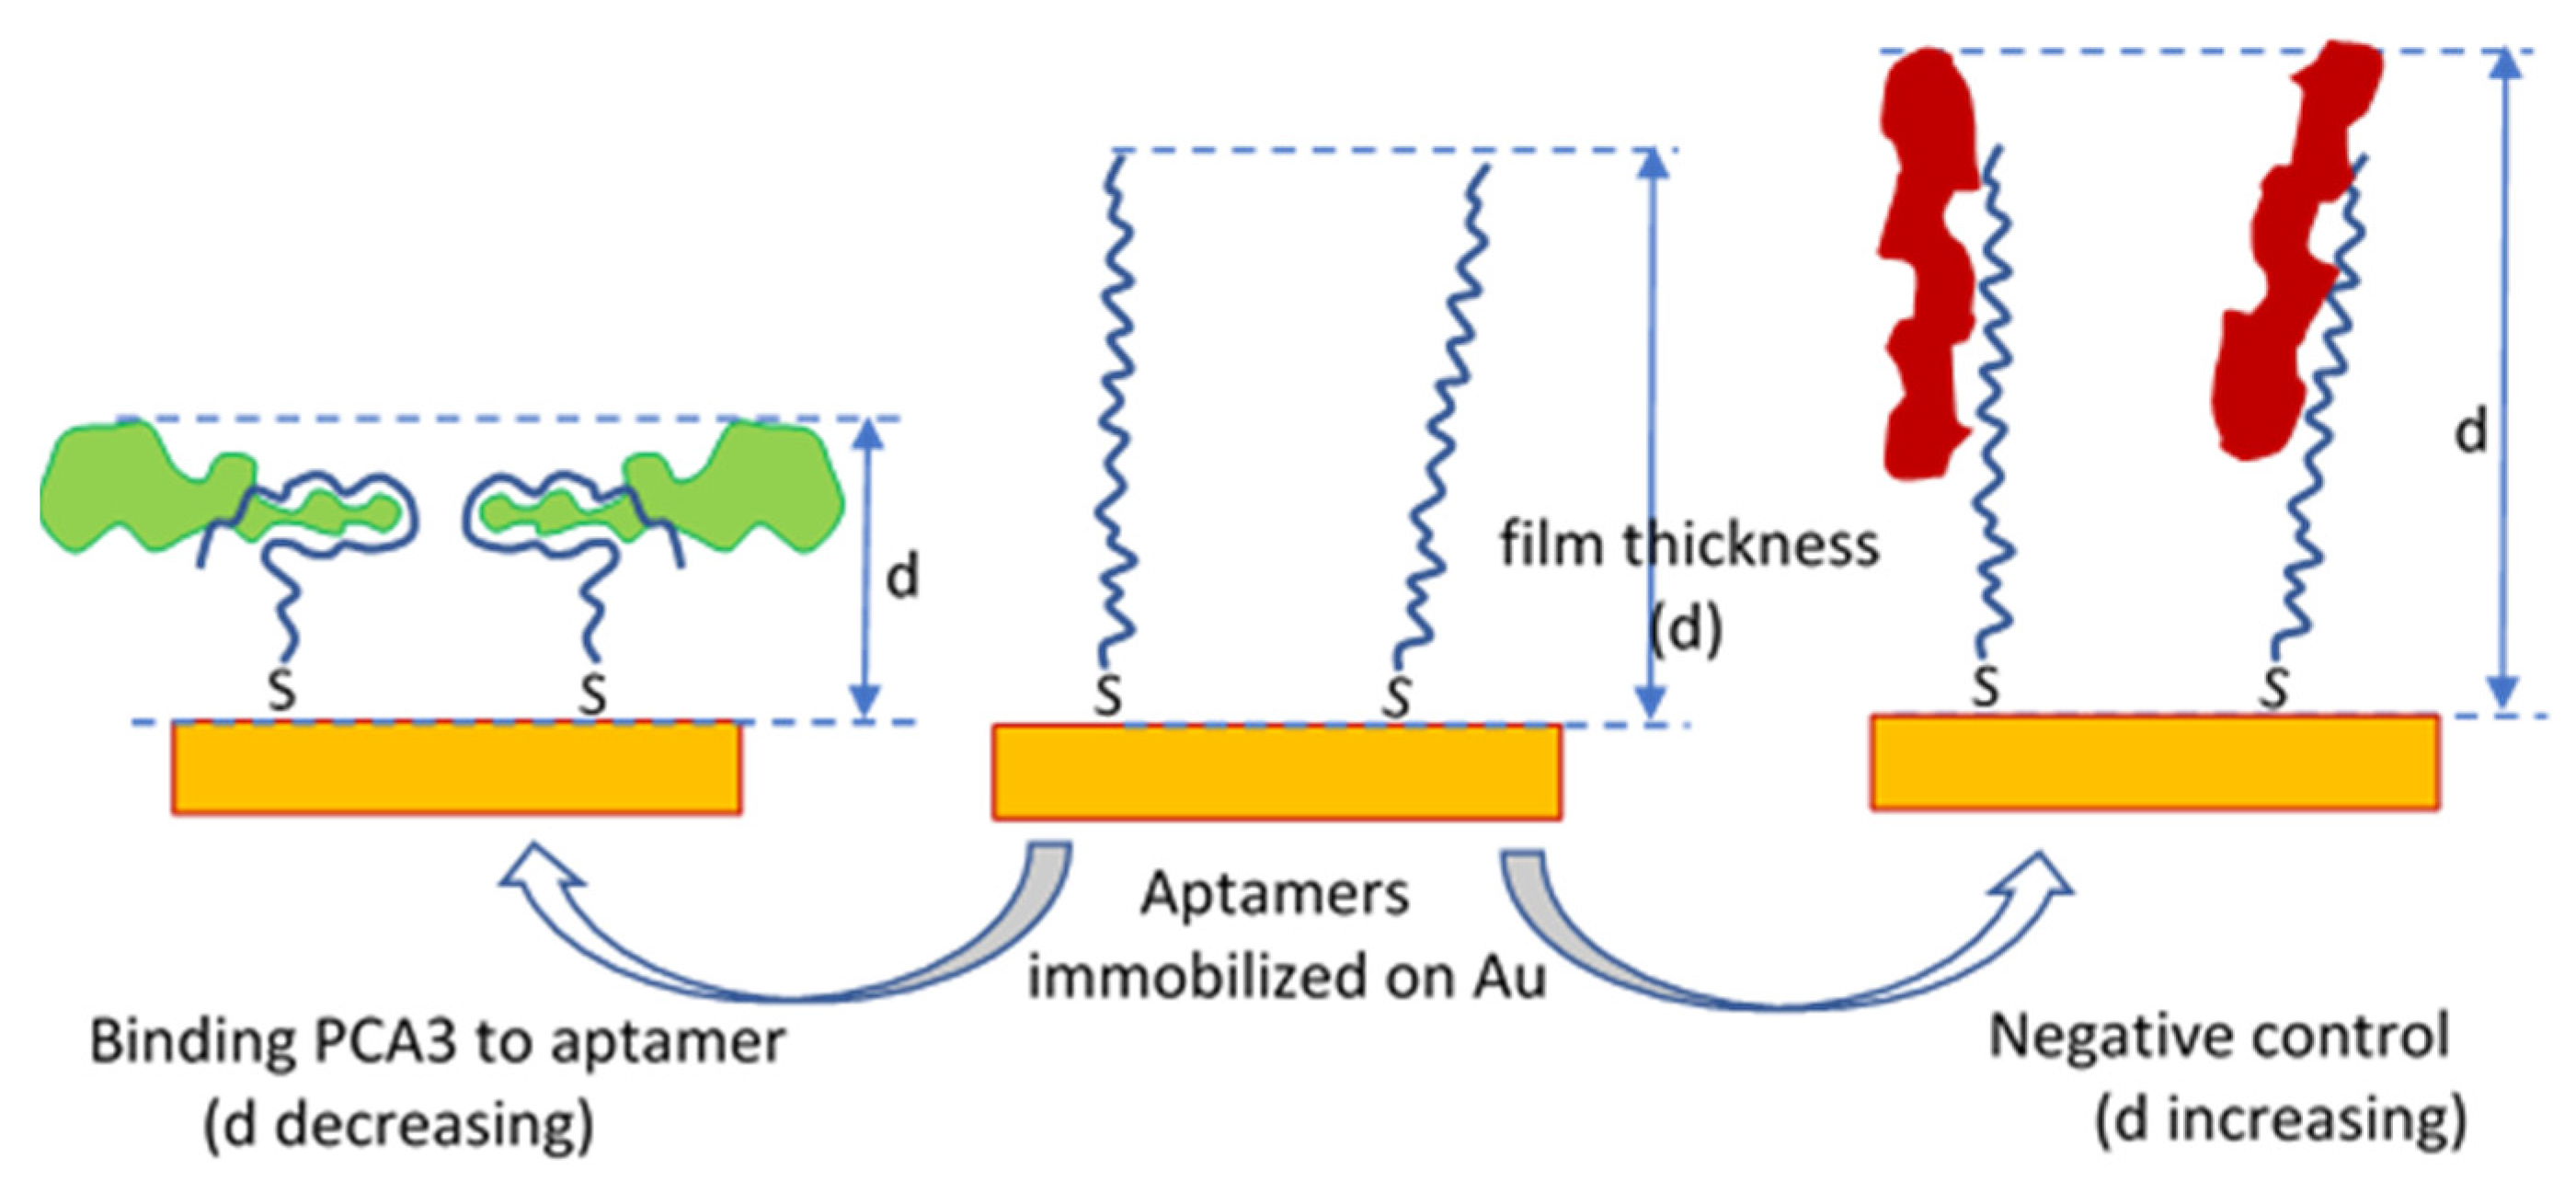
2.2. TIRE-Optical Bio-Transducer

The TIRE experimental set-up schematically shown on inset in Figure 1 is based on J.A. Woollam M2000 spectroscopic ellipsometer with the addition of a 68° glass prism (providing the light coupling at total internal reflection conditions) which was optically connected via index matching fluid with the gold coated glass slide. The PTFE cell of 0.2 mL in volume was sealed against the gold coated glass slide; the inlet and outlet tubes allow the injection of the required liquid reagents in the cell. The principles of total internal reflection ellipsometry (TIRE) measurements and data acquisition were described in detail previously in [21,22,23,24].
Standard microscopic glass slides were cleaned in hot piranha solution (3:1 mixture of H2SO4 and H2O2) for 10 min. followed by rinsing with deionized Milli-Q water and drying under a stream of nitrogen gas. Gold layers of about 20 to 25 nm in thickness were evaporated on glass slides using Edwards E306A metal evaporator unit; an intermediate layer of Cr (3 to 5 nm) was used to improve the adhesion of gold to glass. For TIRE measurements, gold coated glass slides functionalized with label-free aptamer were used.
The PCA3 solutions were prepared by diluting the original stock solution (100 µM) in PBS buffer to obtain the required concentrations of 0.09, 0.5, 1, 10, 100 nM. TIRE measurements were performed in a sequential adsorption manner (starting with the injection of lowest concentration of PCA3) and rinsing the cell after each adsorption step; the initial TIRE measurements of pure buffer were used as a reference. The TIRE setup allows two types of ellipsometric measurements: (i) single spectroscopic spectral scans performed in PBS after completing each stage of molecular adsorption, and (ii) dynamic measurements, e.g., recording of several spectroscopic scans during the binding of analytes (PCA3) to receptors (CG3 aptamer) which provides the information on the reaction’s kinetics.

3. Results and Discussion

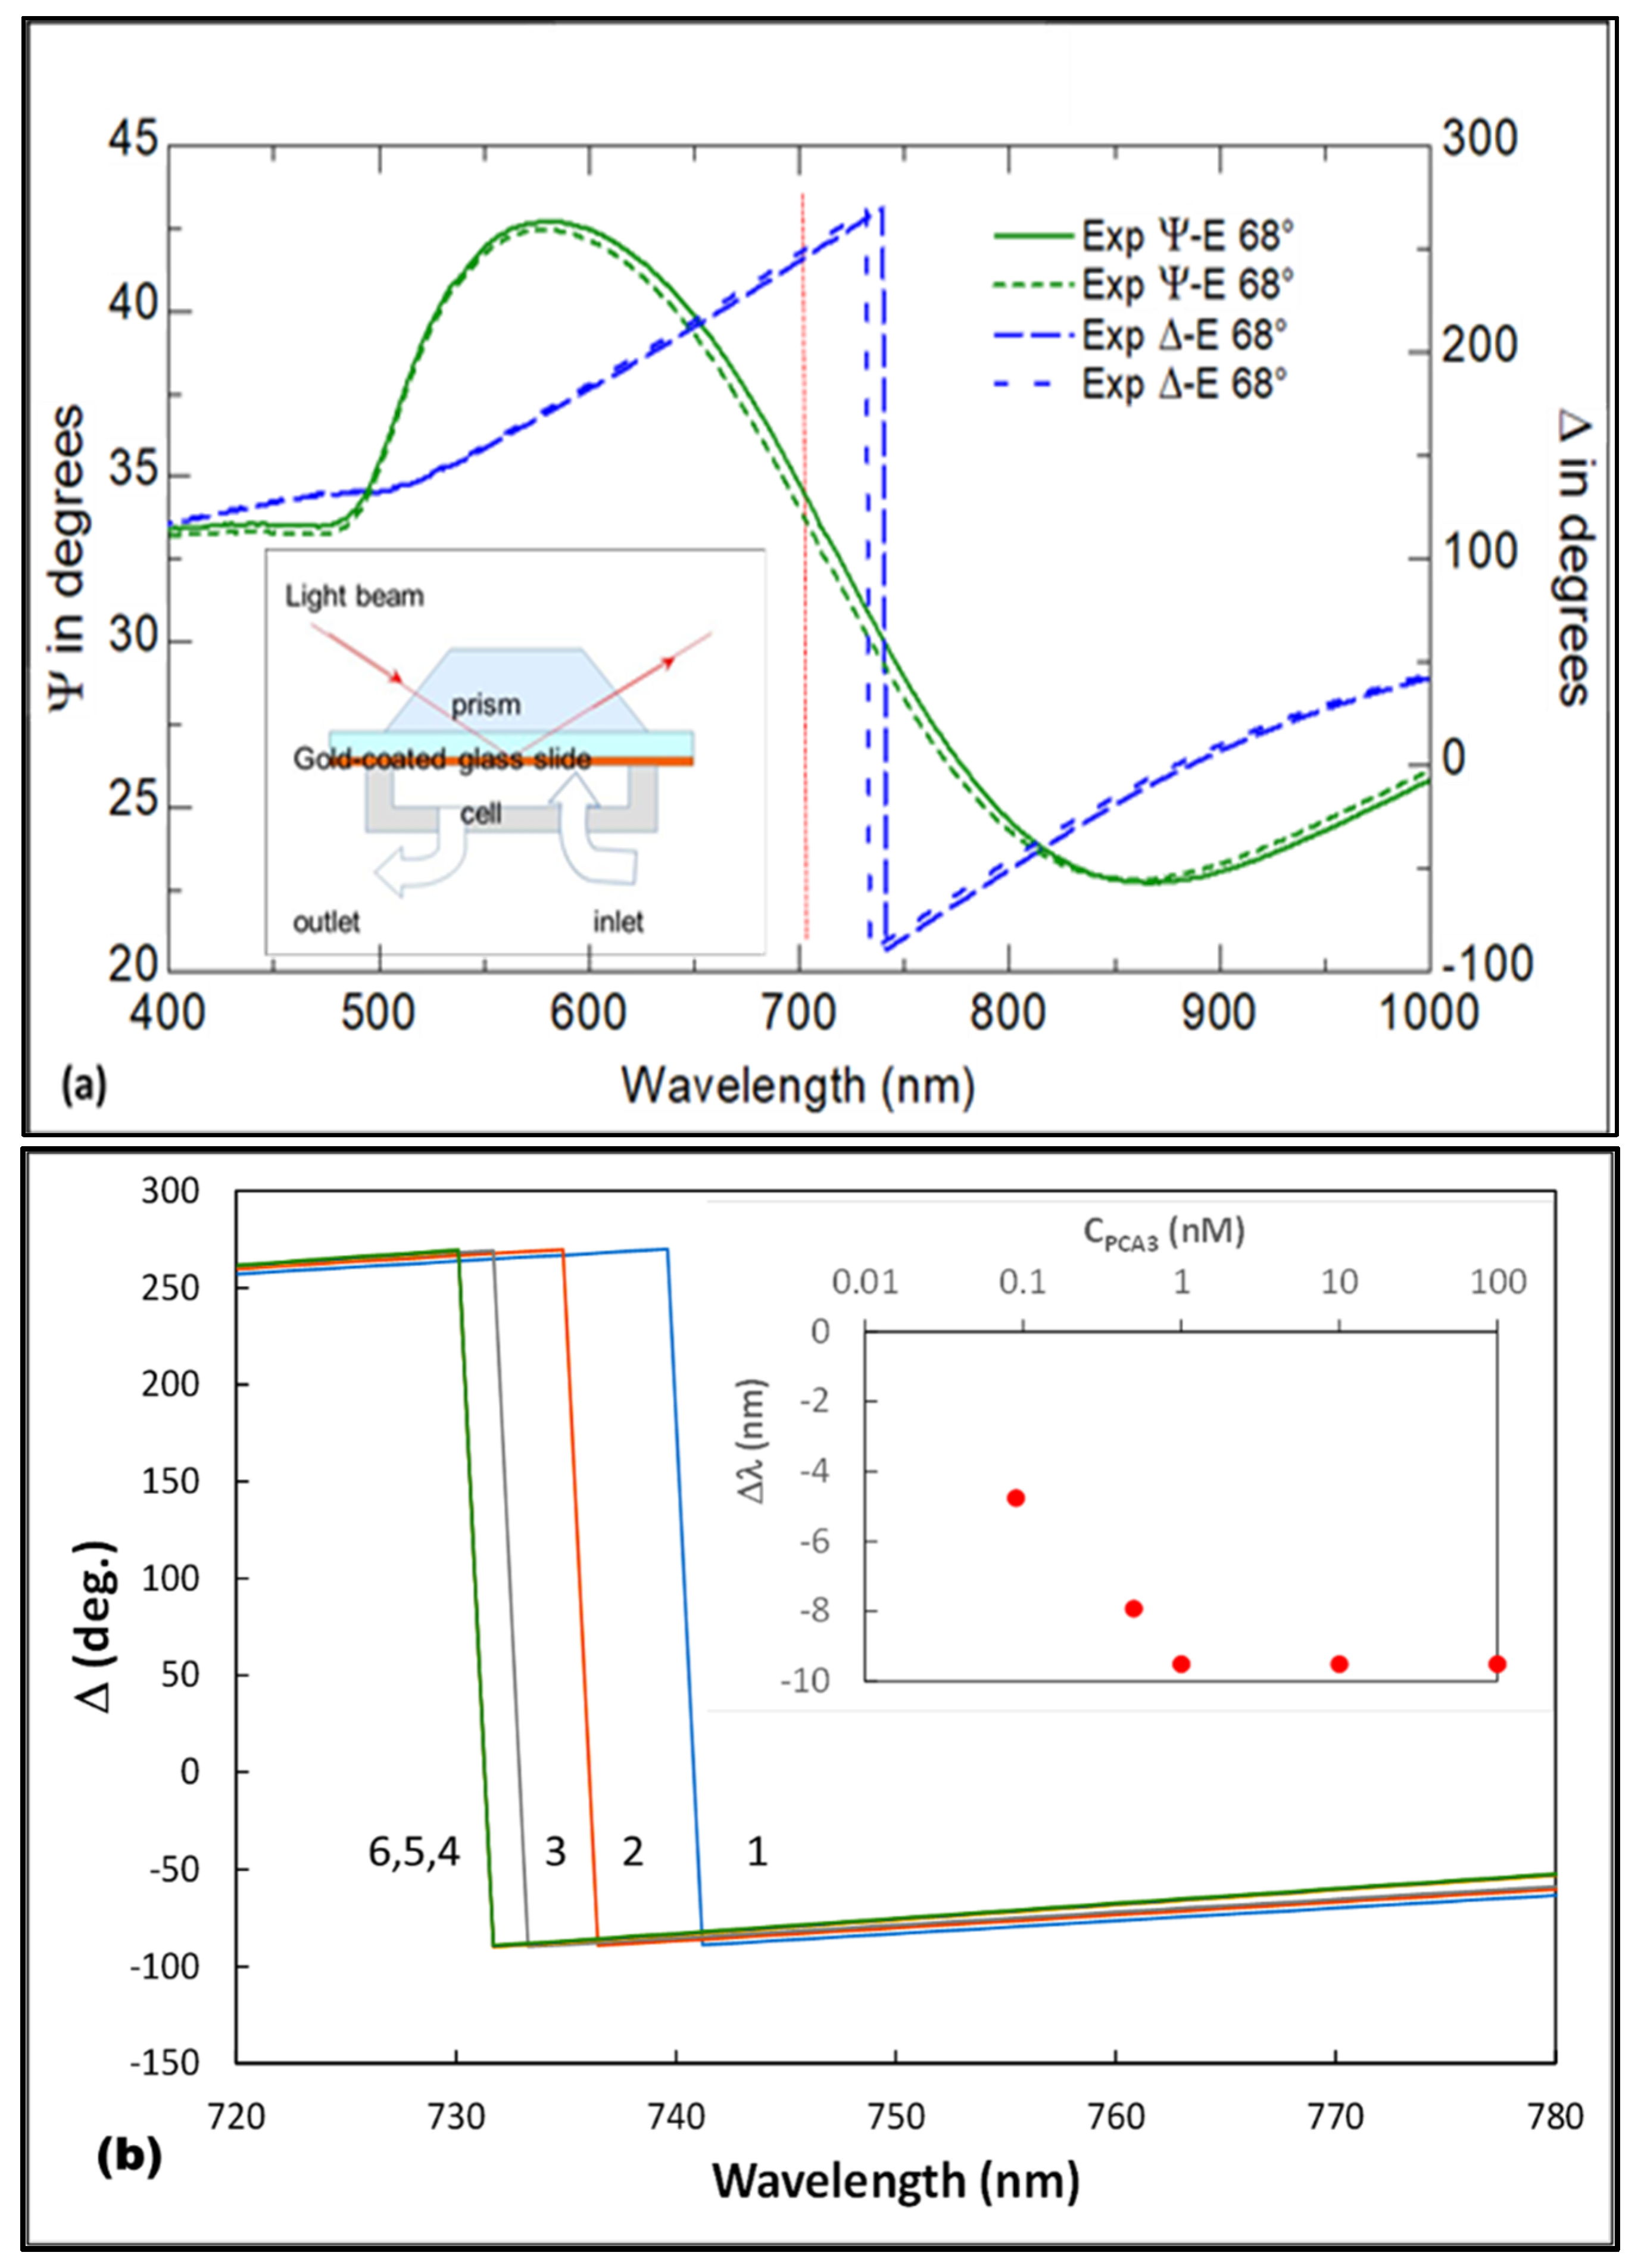
3.1. Results of TIRE Single Spectroscopic Measurements

Typical TIRE spectra of Ψ and Δ of Au/Cr layer on the glass slide functionalized with aptamers are shown in Figure 1. The maximum and minimum in the spectrum of the amplitude-related parameter Ψ correspond, respectively, to the conditions of total internal reflection (TIR) and surface plasmon resonance (SPR), while a sharp drop in a spectrum of phase related parameter Δ is a new quantity non-existent in traditional SPR. The position of such a phase drop is highly sensitive to changes in the optical density of a molecular layer adsorbed the surface of gold; the increase in the molecular layer thickness causes a “red” spectral shift, while thickness decrease causes a “blue” spectral shift of Δ spectrum.
As one ca see in Figure 1a, binding PCA3 from its 0.5 nM solution in PBS to its specific aptamer results in a blue shift of both Ψ and Δ spectra (dotted lines) as compared to the spectra of unperturbed aptamer layer (solid lines).
As shown in Figure 1b, the increase in concentration of PCA3 causes a progressive increase in the blue (negative) spectral shift until the saturation of binding sites, e.g., aptamers) occurs at concentrations larger than 1nM. The saturation of the TIRE sensor response at the level of about −9.5 nm shown as inset in Figure 1b corresponds to a decrease in the film thickness of around 2 nm. The negative control tests were carried out by adsorbing molecules having scrambled the sequence of PCA3, resulting in the “red” (positive) spectral shift of about 20 nm associated with the thickness increase of about 4 nm.
These results can be understood using the model shown in Figure 2 which schematically illustrates the process of PCA3 to aptamer binding during which the aptamer engulfs the target resulting in the thickness decrease. Contrarily, non-specific binding of the scrambled PCA3 to the aptamer results in the thickness increase. Interestingly, that prolonged exposure of aptamer to large concentrations of PCA3 (10 nM and 100 nM) also causes the red spectral shift which is due to the non-specific adsorption (or piling up) of PCA3 molecules. Another explanation of the saturation of the sensor response at relatively low concentrations of PCA3 is in high density of the immobilized aptamers which have no room for coiling around large target molecules of PCA3; optimization of the aptamer concentration is therefore required.
It is worth mentioning that the binding of 90 pM (the lowest concentration used) of PCA3 causes a substantial spectral shift of about 5 nm. Considering the high accuracy of ellipsometry measurements with the noise level of Ψ and Δ in the second decimal digits the actual limit of detection (LOD) could be much lower. In this work, however, the evaluation of LOD was not a priority.
Additional spectroscopic ellipsometry measurements were carried out on dried samples, in order to evaluate the thickness of the aptamer layer covalently bound on the surface of gold. The thicknesses of Au (17 nm to 20 nm) and Cr (5 nm to 7 nm) layers were evaluated first from the measurements on bare metal layers. The aptamer layer thickness of 2.5 nm was found. The thermocycling of gold coated slides with immobilized aptamer in PCR unit (e.g., heating up to 95 °C and cooling down to 5 °C during 10 min.) has resulted in the aptamer layer thickness increase up to 4.5 nm. This shows that aptamer molecules tend to coil in a dry state, while thermocycling in a buffer solution containing Mg2+ ions stabilizes the aptamer structure in the original stretched form suitable for sensing. Such a procedure is recommended for “refreshing” the samples of aptamers immobilized on gold prior to conducting sensing tests.

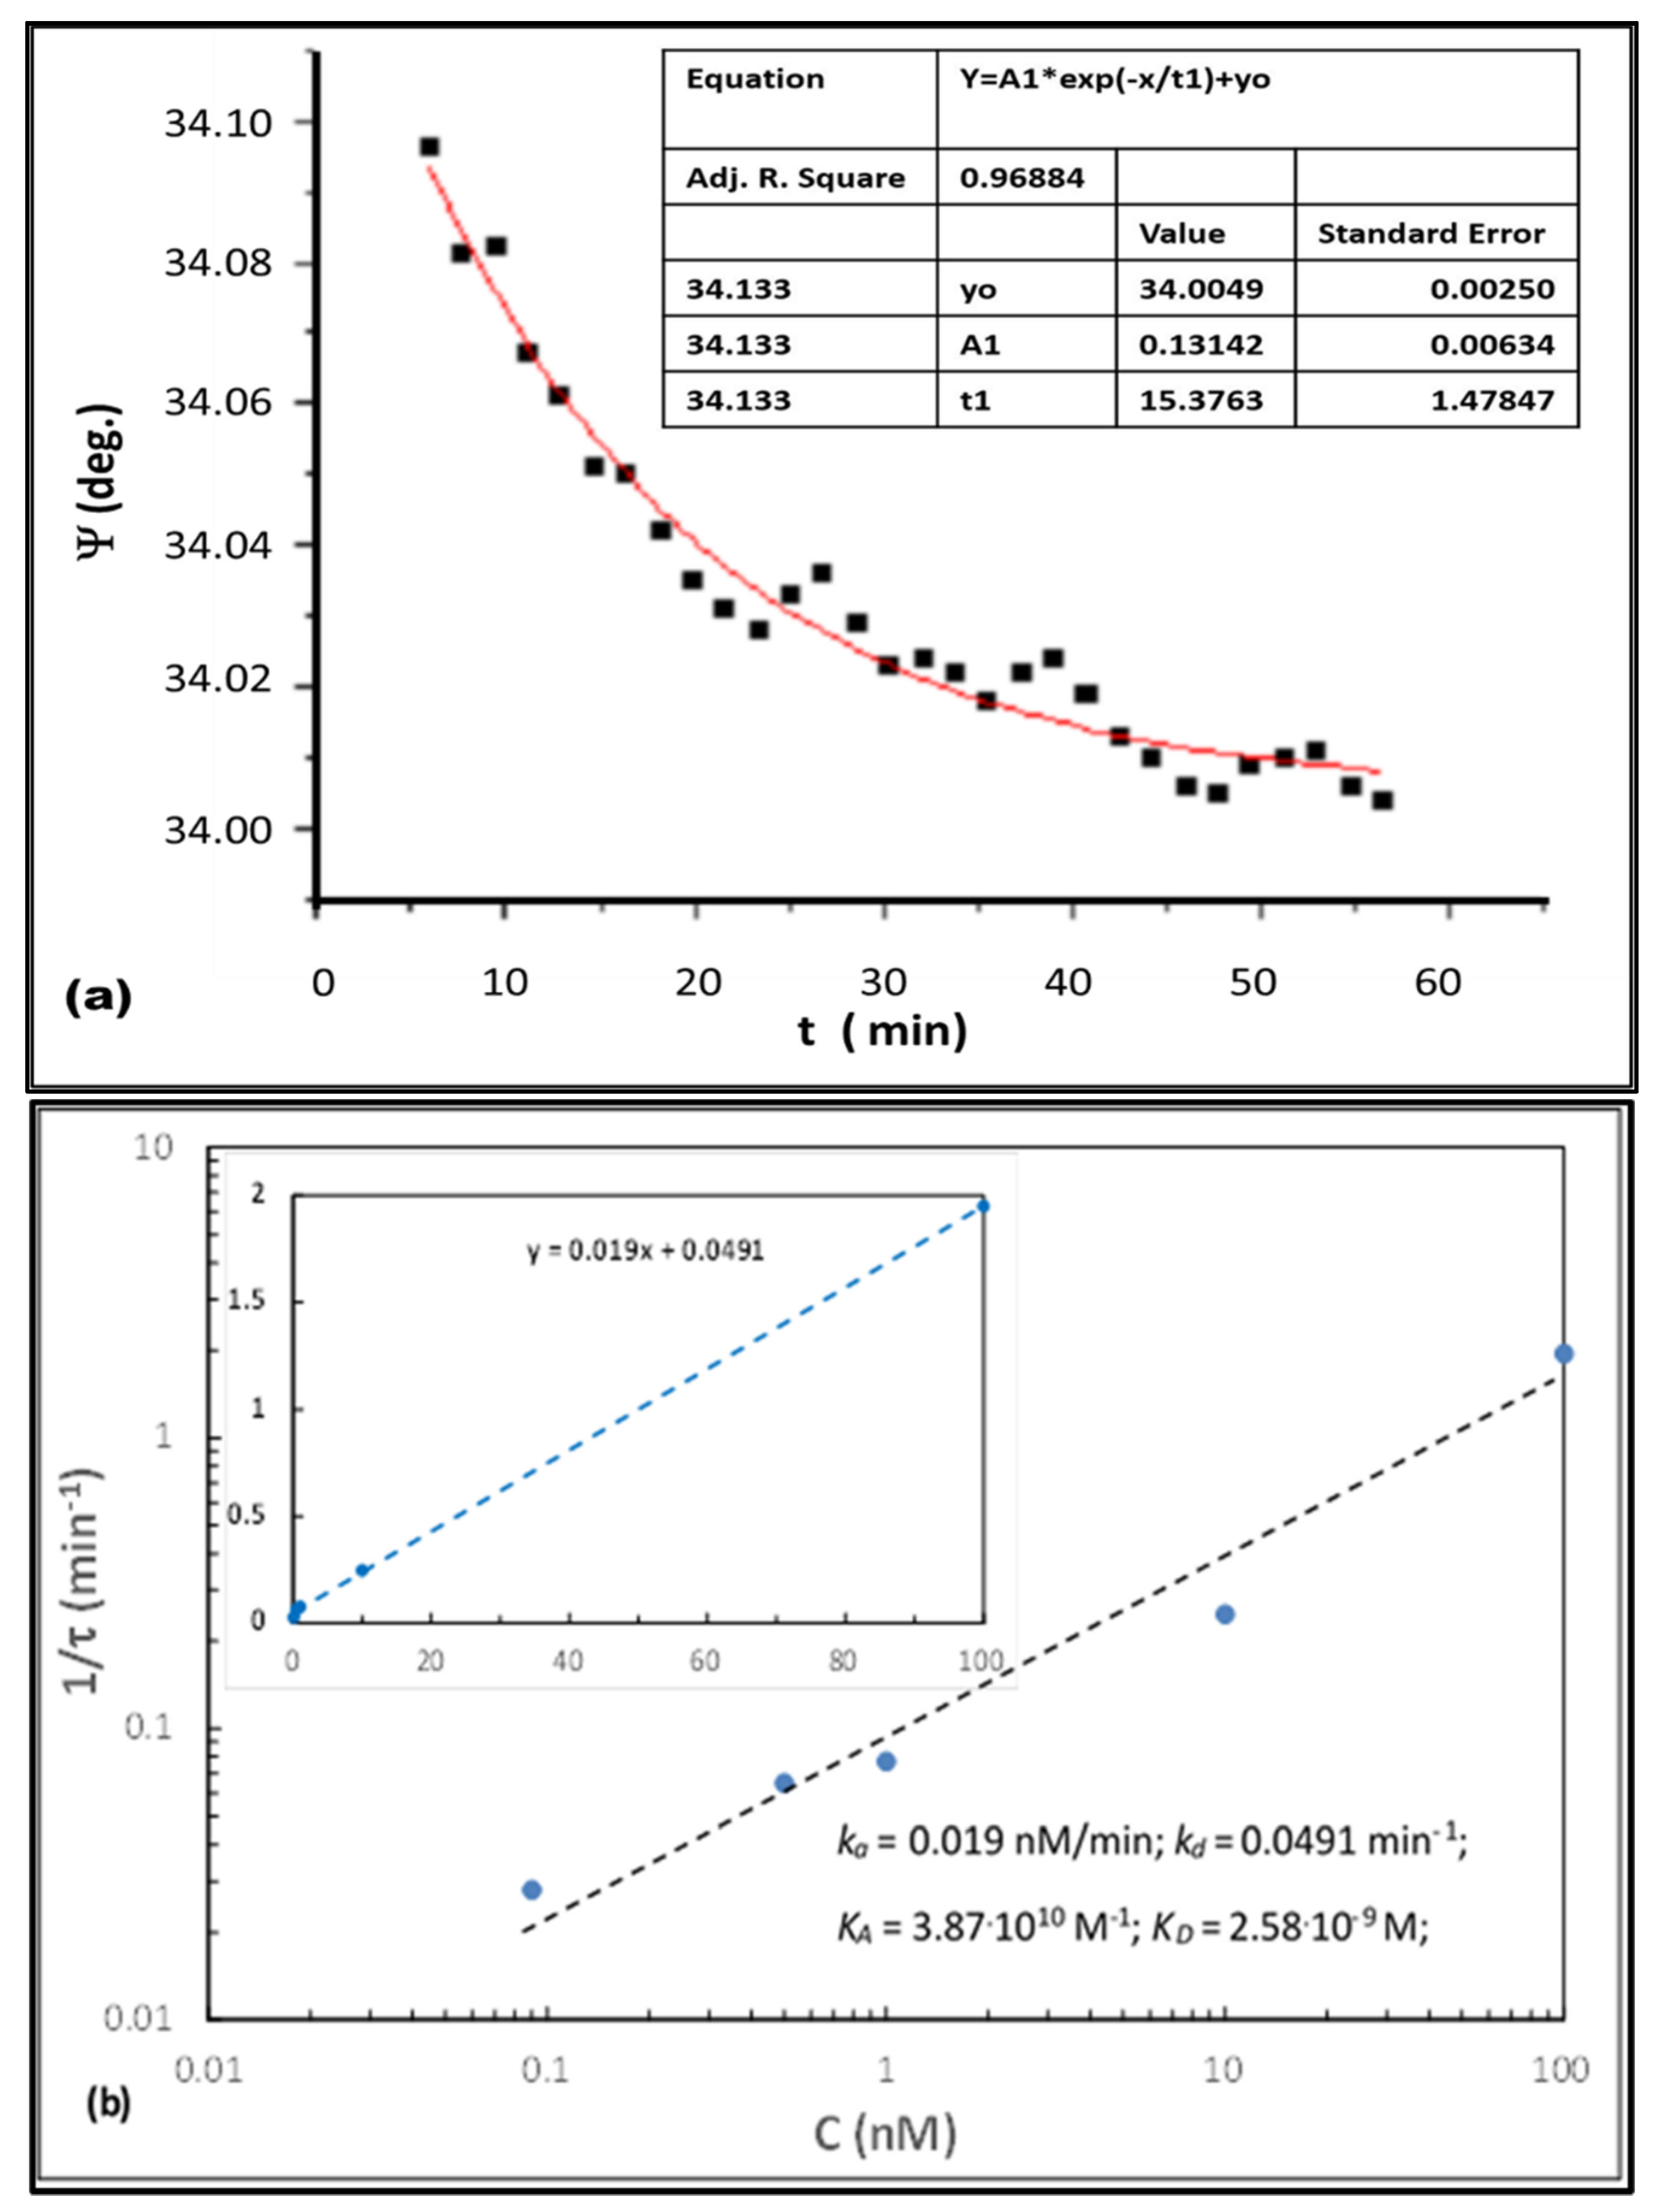
3.2. TIRE Study of the Binding Kinetics

TIRE spectral measurements were carried out (at certain time intervals) during binding PCA3 to aptamers immobilized on the surface of gold. The resulted massive data files can be processed by plotting the time dependencies of either Ψ or Δ at fixed wavelength typically selected on the left side of the resonance (see red dotted line in Figure 1a). A typical example of TIRE binding kinetics of PCA3 (0.5 nM) to aptamers is given in Figure 3a as the time dependence of Ψ at 700 nm. These data were fitted to the rising exponential function with the parameters of the equation given as an inset. The parameter of interest was the time constant (τ). Such measurements were carried out at different concentrations of PCA3 (C) and the characteristic time constants (τ) were evaluated at each concentration. According to the theory of molecular adsorption [20], the rates of adsorption and desorption (ka and kd) can be found, respectively, as the gradient and intercept of the following linear equation: 1 τ = k a C + k d ,   then the association and affinity constants (KA and KD) can be found as K A = k a / k d   ,   K D = 1 / K D .  
Linear dependence of 1/(τ) vs. C given in Figure 3b in both logarithmic and linear coordinates yields the values of KA = 3.87 × 10¹⁰ M−1 and KD = 2.58 × 10⁻⁹ M which are very similar to those obtained earlier by the electrochemical method of CV [20]. Also, the TIRE experiments revealed anomalous kinetics at high concentrations of PCA3 when soon after reaching the saturation the response started to rise again. This is most likely associated with the non-specific adsorption of PCA3.

4. Conclusions: Comparison of the Electrochemical and Optical Detection Strategies

The use of the TIRE method for detection of the lncRNA transcript PCA3 in direct assay with non-labelled aptamer immobilized on the surface proved to be promising. In contrast to electrochemical detection based on labelled aptamers, the optical detection using TIRE showed the increase in the molecular layer thickness caused by the non-specific binding of PCA3 which cannot be detected with the electrochemical method. In terms of sensitivity, the method of TIRE is potentially capable of detection of PCA3 in low concentrations (much lower than 0.09 nM used in this work) which could be comparable with the values of LOD reported earlier for electrochemical CV (0.35 pM–0.78 pM) and EIS (0.26 pM) methods [20]. More detailed optical study in a wider concentration range of PCA3 and optimization of aptamer concentration is currently underway. The high affinity of unlabeled aptamer towards PCA3 was confirmed by TIRE kinetics study which gave similar values KA and KD to those obtained previously from CV measurements for an aptamer labelled with ferrocene [20].
From the point of view of sensing, electrochemical methods are more attractive because of the low cost and simplicity of use, however the optical method of TIRE provides important complementary information on the thickness of molecular layers which allows for better understanding of the processes of aptamer-target interaction.

Author Contributions

Conceptualization A.N.; methodology, A.N. and A.L.; validation, S.T.; formal analysis, A.N.; investigation, S.T.; resources, S.T. and A.N.; writing—original draft preparation, A.N. and S.T.; writing—review and editing, A.N. and D.S.; supervision, A.N., A.L. and D.S. All authors have read and agreed to the published version of the manuscript.

Funding

This research received no external funding.

Informed Consent Statement

Not applicable.

Data Availability Statement

The data are not publicly available; The data files are stored on corresponding instruments and on personal computers.

Acknowledgments

We would like to acknowledge Material and Engineering Research Institute at Sheffield Hallam University for providing full access to its resources and materials.

Conflicts of Interest

The authors declare no conflict of interest.

References

  1. Ferlay, J.; Soerjomataram, I.; Dikshit, R.; Eser, S.; Mathers, C.; Rebelo, M.; Parkin, D.M.; Forman, D.; Bray, F. Cancer incidence and mortality worldwide: Sources, methods and major patterns in GLOBOCAN 2012. Int. J. Cancer 2015, 136, E359–E386. [Google Scholar] [CrossRef]
  2. Liss, M.A.; Santos, R.; Osann, K.; Lau, A.; Ahlering, T.E.; Ornstein, D.K. PCA3 molecular urine assay for prostate cancer: Association with pathologic features and impact of collection protocols. World J. Urol. 2011, 29, 683–688. [Google Scholar] [CrossRef] [Green Version]
  3. Daniyal, M.; Siddiqui, Z.A.; Akram, M.; Asif, H.M. MINI-REVIEW Epidemiology, Etiology, Diagnosis and Treatment of Prostate Cancer. Asian Pac. J. Cancer Prev. 2014, 15, 9575–9578. [Google Scholar] [CrossRef] [Green Version]
  4. Filella, X.; Foj, L. Prostate Cancer Detection and Prognosis: From Prostate Specific Antigen (PSA) to Exosomal Biomarkers. Int. J. Mol. Sci. 2016, 17, 1784. [Google Scholar] [CrossRef]
  5. Miller, K.D.; Siegel, R.L.; Lin, C.C.; Mariotto, A.B.; Kramer, J.L.; Rowland, J.H.; Stein, K.D.; Alteri, R.; Jemal, A. Cancer treatment and survivorship statistics, 2016. CA A Cancer J. Clin. 2016, 66, 271–289. [Google Scholar] [CrossRef] [Green Version]
  6. Salman, J.W.; Schoots, I.G.; Carlsson, S.; Jenster, G.; Roobol, M.J. Prostate Specific Antigen as a Tumor Marker in Prostate Cancer: Biochemical and Clinical Aspects. In Advances in Experimental Medicine and Biology; Springer: Dordrecht, The Netherlands, 2015; Volume 867, pp. 93–114. [Google Scholar] [CrossRef]
  7. Buzzoni, C.; Auvinen, A.; Roobol, M.J.; Carlsson, S.; Moss, S.M.; Puliti, D.; de Koning, H.J.; Bangma, C.H.; Denis, L.J.; Kwiatkowski, M.; et al. Metastatic Prostate Cancer Incidence and Prostate-specific Antigen Testing: New Insights from the European Randomized Study of Screening for Prostate Cancer. Eur. Urol. 2015, 68, 885–890. [Google Scholar] [CrossRef] [PubMed] [Green Version]
  8. Adhyam, M.; Gupta, A.K. A Review on the Clinical Utility of PSA in Cancer Prostate. Indian J. Surg. Oncol. 2012, 3, 120–129. [Google Scholar] [CrossRef] [Green Version]
  9. Mistry, K.; Cable, G. Meta-Analysis of Prostate-Specific Antigen and Digital Rectal Examination as Screening Tests for Prostate Carcinoma. J. Am. Board Fam. Med. 2003, 16, 95–101. [Google Scholar] [CrossRef] [Green Version]
  10. Altuwaijri, S. Role of Prostate Specific Antigen (PSA) in Pathogenesis of Prostate Cancer. J. Cancer Ther. 2012, 3, 331–336. [Google Scholar] [CrossRef] [Green Version]
  11. Landers, K.A.; Burger, M.J.; Tebay, M.A.; Purdie, D.M.; Scells, B.; Samaratunga, H.; Lavin, M.F.; Gardiner, R.A. Use of multiple biomarkers for a molecular diagnosis of prostate cancer. Int. J. Cancer 2005, 114, 950–956. [Google Scholar] [CrossRef]
  12. Bussemakers, M.J.; Van Bokhoven, A.; Verhaegh, G.W.; Smit, F.P.; Karthaus, H.F.; Schalken, J.A.; Debruyne, F.M.; Ru, N.; Isaacs, W.B. DD3: A new prostate-specific gene, highly overexpressed in prostate cancer. Cancer Res. 1999, 59, 5975–5979. [Google Scholar]
  13. Chistiakov, D.A.; Myasoedova, V.A.; Grechko, A.V.; Melnichenko, A.A.; Orekhov, A.N. New biomarkers for diagnosis and prognosis of localized prostate cancer. Semin. Cancer Biol. 2018, 52, 9–16. [Google Scholar] [CrossRef] [PubMed]
  14. Rönnau, C.G.H.; Verhaegh, G.W.; Luna-Velez, M.V.; Schalken, J.A. Noncoding RNAs as Novel Biomarkers in Prostate Cancer. BioMed Res. Int. 2014, 2014, 591703. [Google Scholar] [CrossRef]
  15. Schalken, J.A.; Hessels, D.; Verhaegh, G. New targets for therapy in prostate cancer: Differential display code 3 (DD3PCA3), a highly prostate cancer–specific gene. Urology 2003, 62, 34–43. [Google Scholar] [CrossRef]
  16. Nicholson, A.; Mahon, J.; Boland, A.; Beale, S.; Dwan, K.; Fleeman, N.; Hockenhull, J.; Dundar, Y. The clinical effectiveness and cost-effectiveness of the PROGENSA® prostate cancer antigen 3 assay and the Prostate Health Index in the diagnosis of prostate cancer: A systematic review and economic evaluation. Health Technol. Assess. 2015, 19, 1–192. [Google Scholar] [CrossRef] [PubMed] [Green Version]
  17. Pasinszki, T.; Krebsz, M.; Tung, T.T.; Losic, D. Carbon Nanomaterial Based Biosensors for Non-Invasive Detection of Cancer and Disease Biomarkers for Clinical Diagnosis. Sensors 2017, 17, 1919. [Google Scholar] [CrossRef] [Green Version]
  18. Topkaya, S.N.; Azimzadeh, M.; Ozsoz, M. Electrochemical Biosensors for Cancer Biomarkers Detection: Recent Advances and Challenges. Electroanalysis 2016, 28, 1402–1419. [Google Scholar] [CrossRef]
  19. Marangoni, K.; Neves, A.F.; Rocha, R.M.; Faria, P.R.; Alves, P.T.; Souza, A.G.; Fujimura, P.T.; Santos, F.A.A.; Araújo, T.G.; Ward, L.S.; et al. Prostate-specific RNA aptamer: Promising nucleic acid antibody-like cancer detection. Sci. Rep. 2015, 5, 12090. [Google Scholar] [CrossRef] [Green Version]
  20. Nabok, A.; Abu-Ali, H.; Takita, S.; Smith, D. Electrochemical Detection of Prostate Cancer Biomarker PCA3 Using Specific RNA-Based Aptamer Labelled with Ferrocene. Chemosensors 2021, 9, 59. [Google Scholar] [CrossRef]
  21. Arwin, H.; Poksinski, M.; Johansen, K. Total internal reflection ellipsometry: Principles and applications. Appl. Opt. 2004, 43, 3028–3036. [Google Scholar] [CrossRef] [PubMed]
  22. Nabok, A.; Tsargorodskaya, A.; Mustafa, M.; Szekacs, I.; Starodub, N.; Szekacs, A. Detection of low molecular weight toxins using an optical phase method of ellipsometry. Sens. Actuators B Chem. 2011, 154, 232–237. [Google Scholar] [CrossRef]
  23. Al Rubaye, A.; Nabok, A.; Catanante, G.; Marty, J.-L.; Takacs, E.; Szekacs, A. Detection of ochratoxin A in aptamer assay using total internal reflection ellipsometry. Sens. Actuators B Chem. 2018, 263, 248–251. [Google Scholar] [CrossRef] [Green Version]
  24. Al-Rubaye, A.G.; Nabok, A.; Catanante, G.; Marty, J.-L.; Takács, E.; Székács, A. Label-Free Optical Detection of Mycotoxins Using Specific Aptamers Immobilized on Gold Nanostructures. Toxins 2018, 10, 291. [Google Scholar] [CrossRef] [PubMed] [Green Version]
Figure 1. Results of TIRE spectra measurements: (a) TIRE spectra for Au layer with aptamers immobilized on the surface (solid line) and the same sample after binding 1 nM of PCA3 to aptamer (dotted line); (b) A series of TIRE D-spectra demonstrating the “blue” spectral shift caused by binding PCA3 of different concentrations: aptamer before exposure (1) and after exposure to PCA3 0.09 nM (2), 0.5 nM (3), 1 nM (4), 10nM (5), and 100 nM (6).
Chemproc 05 00065 g001
Figure 2. Schematic diagram of specific and non-specific binding of molecules to unlabeled aptamers immobilized on the surface of gold.
Chemproc 05 00065 g002
Figure 3. Evaluation of the PCA3 to aptamer binding affinity from dynamic TIRE measurements: (a) example of Ψ time dependence upon binding PCA3 (0.5 nM) to aptamer immobilized on the surface of Au; The values of Ψ at 700 nm were presented; (b) evaluation of KA and KD from the 1/τ(C) dependence given in logarithmic and linear scales.
Chemproc 05 00065 g003
Publisher’s Note: MDPI stays neutral with regard to jurisdictional claims in published maps and institutional affiliations.

