
Electrochemical Measurement System for Chlorides in Drinking and Wastewater †

 and
and 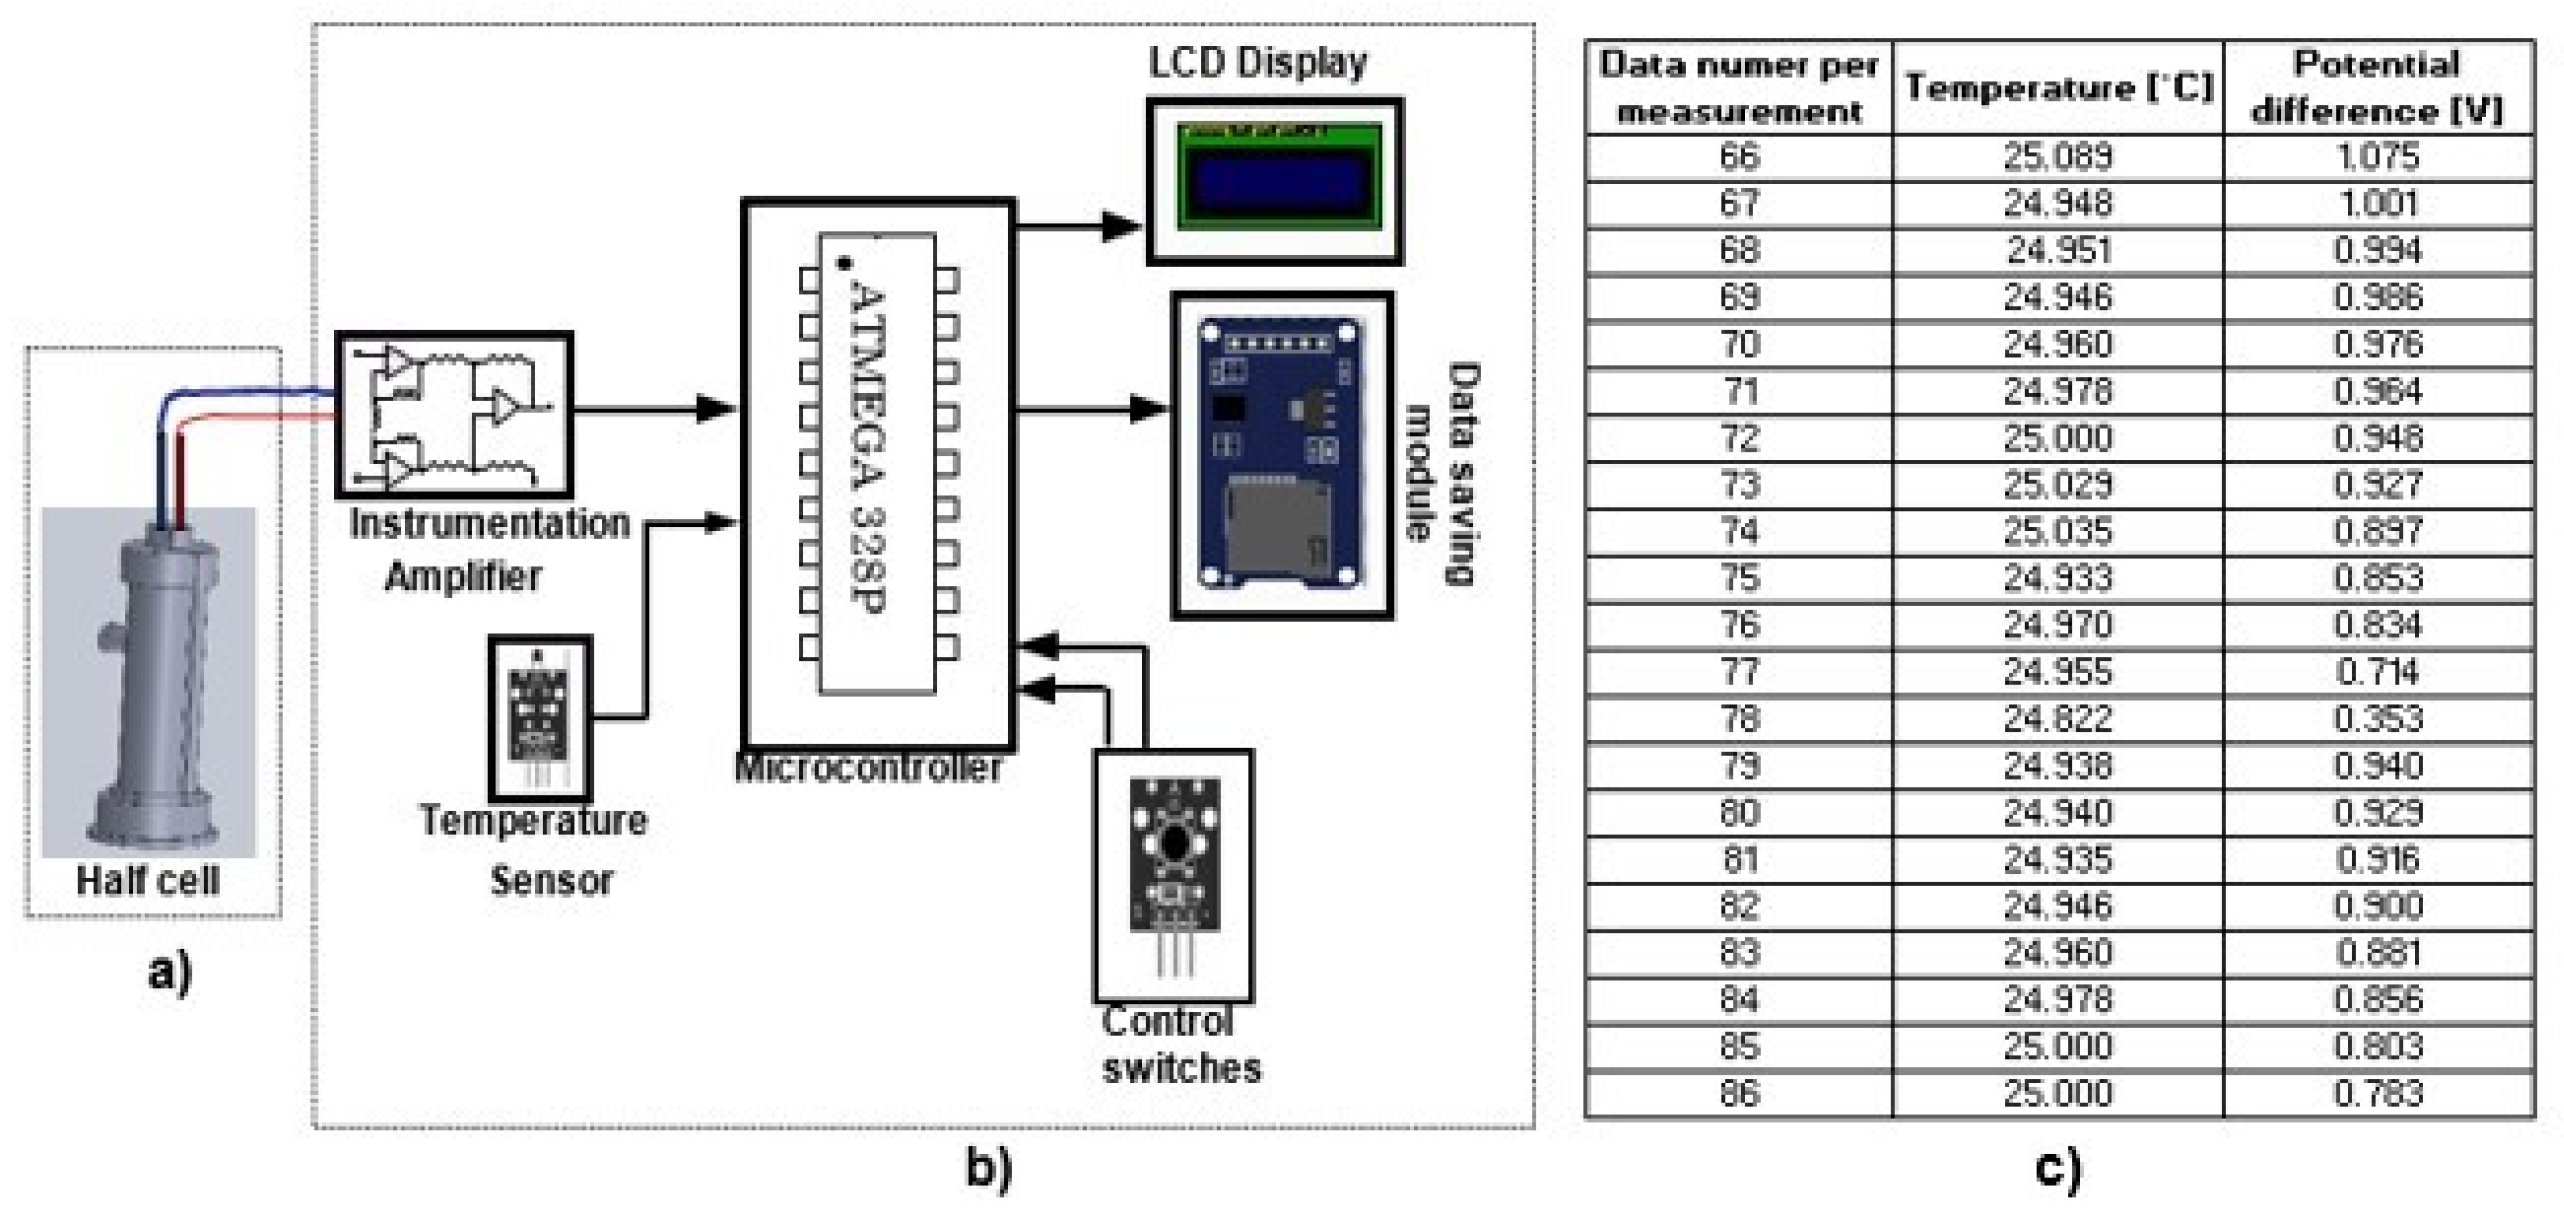
Abstract
:1. Introduction
2. Materials and Methods
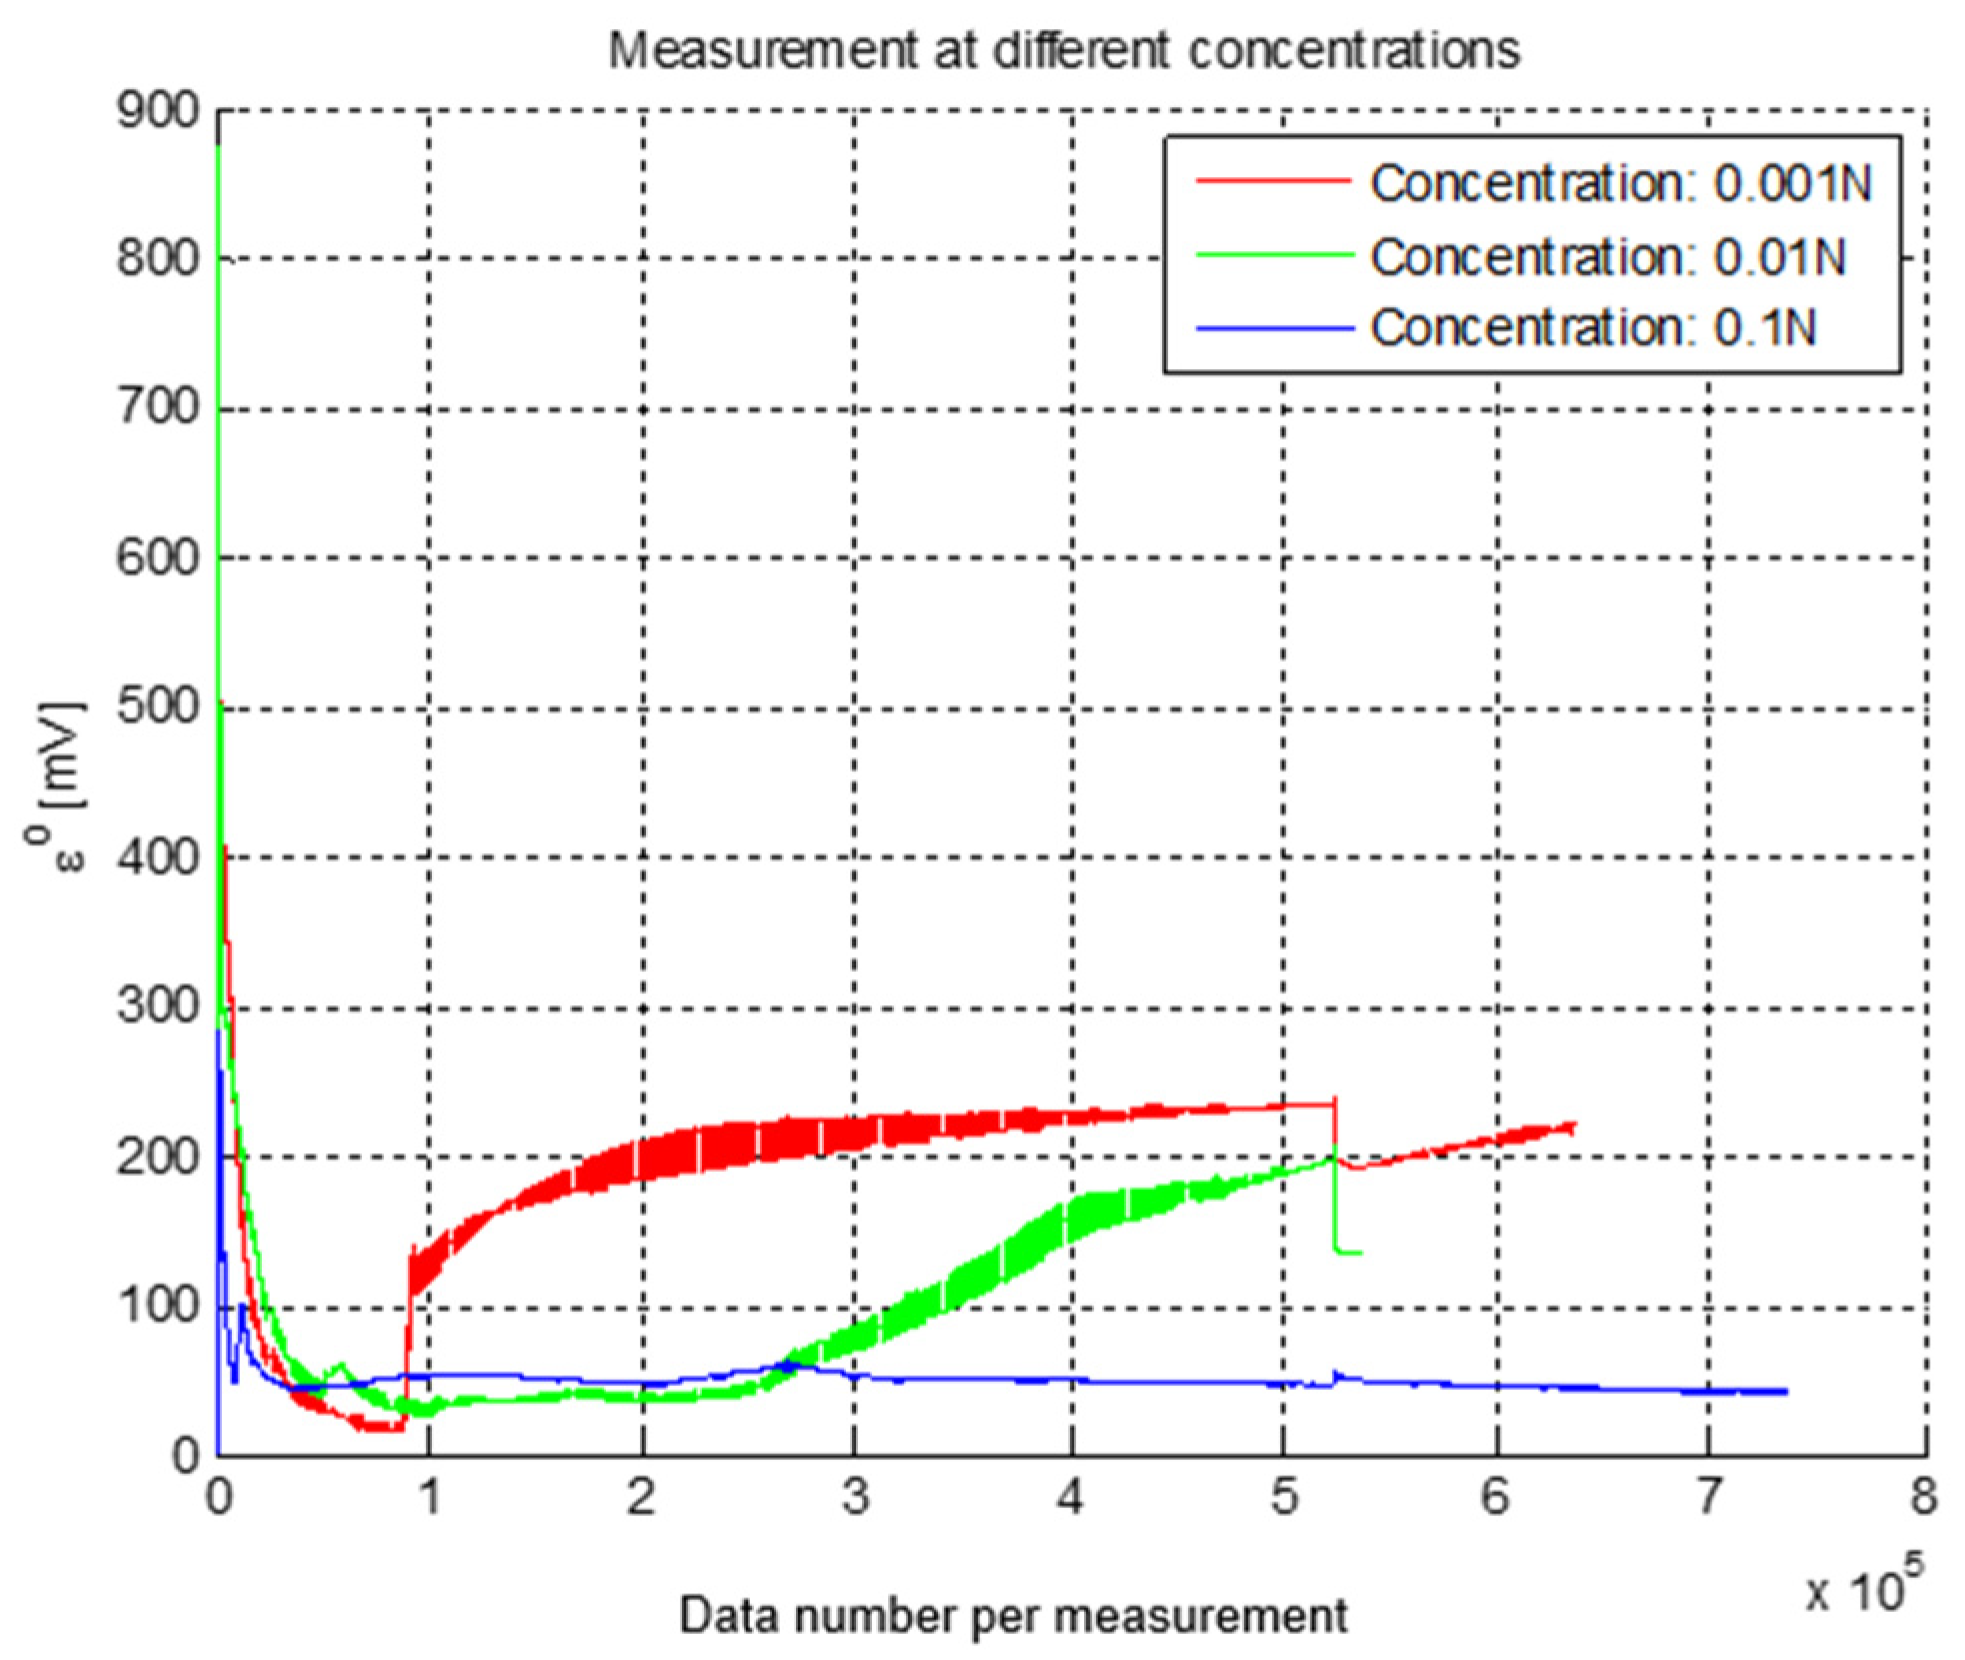
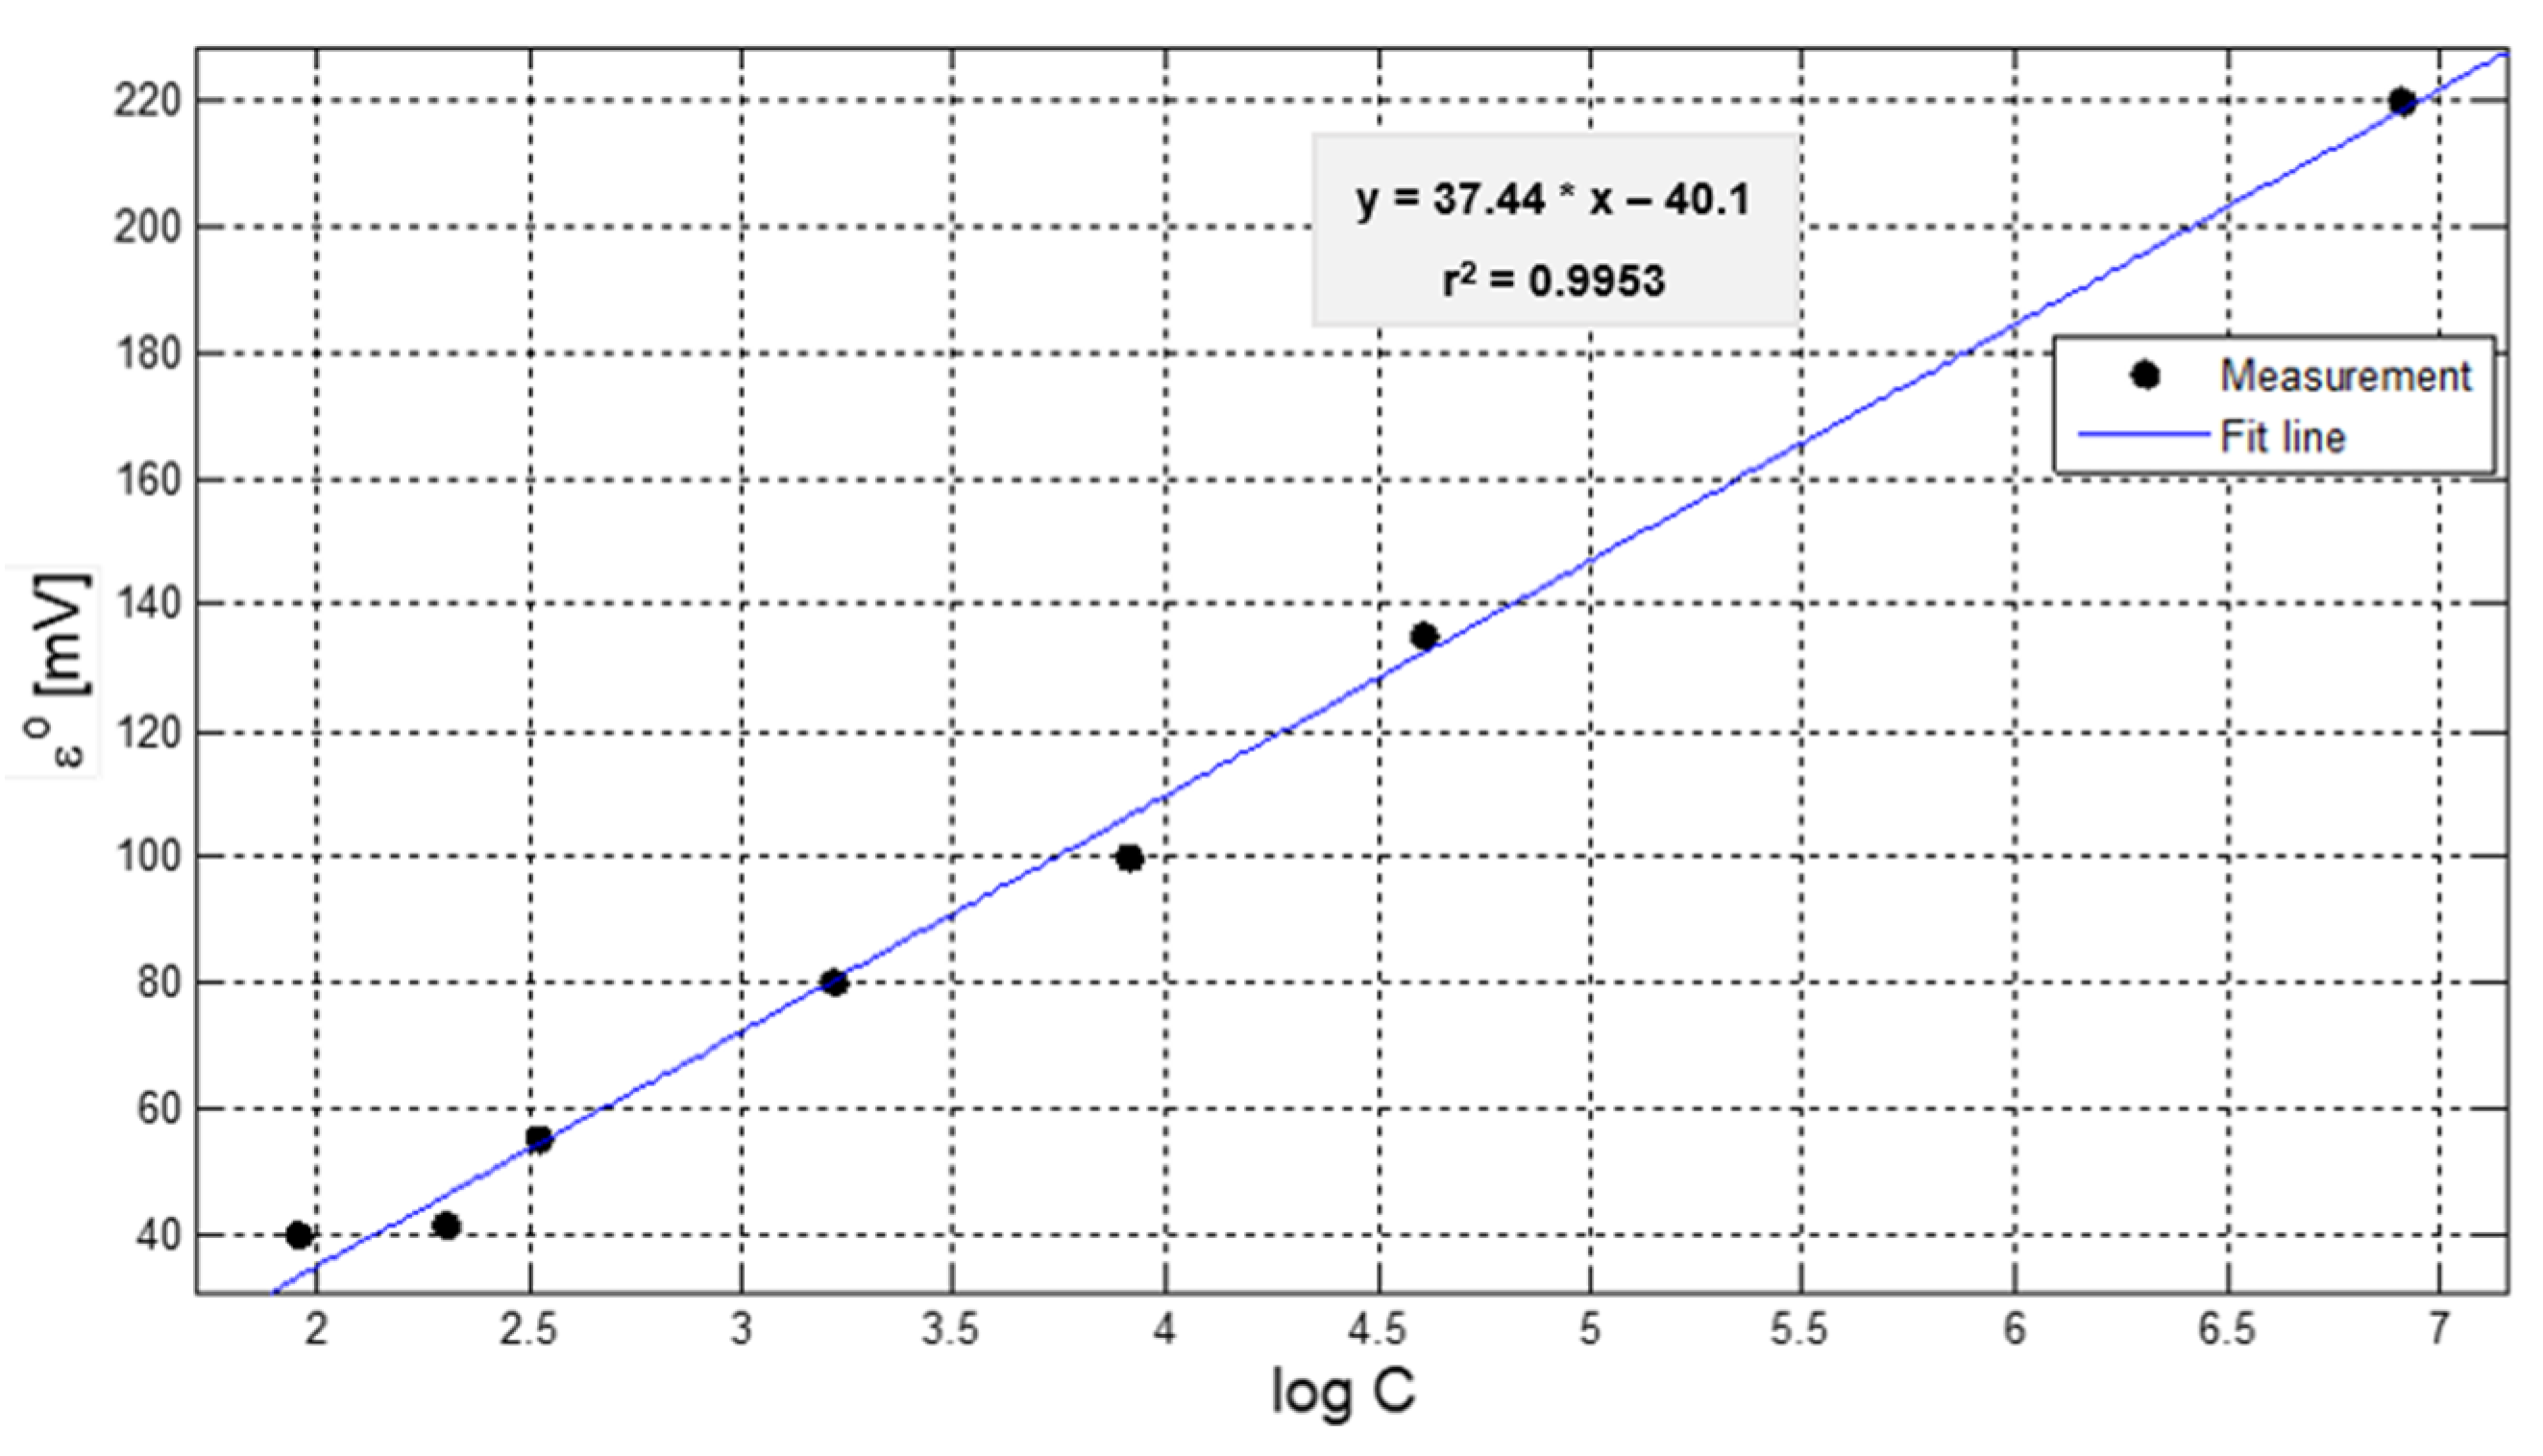
3. Results and Discussion
4. Conclusions
Author Contributions
Funding
Institutional Review Board Statement
Informed Consent Statement
Data Availability Statement
Acknowledgments
Conflicts of Interest
References
- Arada-Pérez, M.; Yazdani-Pedram, M.; Pérez-Saavedra, J. Sensores electroquímicos basados en sales cuaternarias de amonio. Rev. Cuba. Química 2008, 20, 31–38. [Google Scholar]
- Xiao, K.P.; Bühlmann, P.; Nishizawa, S.; Amemiya, S.; Umezawa, U. A chloride ion-selective solvent polymeric membrane electrode based on a hydrogen bond forming ionophore. Anal. Chem. 1997, 69, 1038–1044. [Google Scholar] [CrossRef]
- Meyerhoff, M.E.; Opdycke, W.N. Ion-Selective Electrodes. Adv. Clin. Chem. 1986, 25, 1–47. [Google Scholar] [CrossRef] [PubMed]
- Pérez-Olmos, R.; Rios, A.; Fernández, J.R.; Lapa, R.A.S.; Lima, J.L.F.C. Construction and evaluation of ion selective electrodes for nitrate with a summing operational amplifier. Appl. Tob. Análisis. Talanta. 2001, 53, 741–748. [Google Scholar] [CrossRef]
- Midgley, D. Limits of detection of ion-selective electrodes: Theory and practice. Trans. Inst. Meas. Control 1987, 9, 25–36. [Google Scholar] [CrossRef]
- Gómez-Biedma, S.; Soria, M. Análisis electroquímico. Rev. Diagn. Biol. 2002, 51, 18–27. [Google Scholar]
- Ewing, G.W. Métodos Instrumentales de Análisis Químico; Mc Graw Hill: New York, NY, USA, 1978; pp. 282–369. ISBN 968-6046-10-0. [Google Scholar]
- Levine, I.N. Fisicoquímica, 5th ed.; Mc Graw Hill Interamérica: Aravaca Madrid, Spain, 2004; pp. 515–571. ISBN 84-481-3787-6. [Google Scholar]
- Maron, S.H.; Prutton, C.F. Fundamentos de Fisicoquímica; Limusa: Johannesburg, South Africa, 2012; pp. 479–553. ISBN 968-18-0164-4. [Google Scholar]
- Eggers, D.F.; Gregory, N.W.; Halsey, G.D.; Rabinovitch, B.S. Fisicoquímica; Limusa Wiley: Mexico City, México, 1967; ISBN 0471064998. [Google Scholar]
- Arada-Pérez, M.A.; Pérez-Marín, L.; Calvo-Quintana, J.; Alonso-Chamarro, J.; Tacoronte-Morales, J. Evaluación de un electrodo selectivo a nitrato de membrana líquida con cloruro de trioctilmetilamonio sobre un soporte conductor. Rev. Mex. De Ing. Química 2002, 1, 23–28. [Google Scholar]
- Creus, S.A. Instrumentación Industrial, 8th ed.; Alfaomega Editores: Ciudad de México, México, 2011; pp. 370–376. ISBN 978-607-707-042-9. [Google Scholar]
- Toriz, G.D.A.; Loredo, A.R.; Marcial, M.D. Elaboración de Electrodo para medición de Cloruros en agua. Acad. J. 2013, 5, 3544–3549. [Google Scholar]
- Somoza-Chuay, J.A.; Pavoni-Oliver, S.; Eirez-Izquierdo, J.E.; Bistel-Esquivel, R.A. Análisis de respuestas potenciométricas de electrodos de Vidrio/ITO y Vidrio/ITO/PANI-LS en la medición de pH. Ing. Electrónica Automática Y Comun. 2019, 40, 1–9. [Google Scholar]
- Ben-Rayana, M.C.; Burnett, R.W.; Covington, A.K.; D’Orazio, P.; Fogh-Andersen, N.; Jacobs, E.; Kataky, R.; Külpmann, W.R.; Kuwa, K.; Larsson, L.; et al. Recommendation for measuring and reporting chloride by ISEs in undiluted serum, plasma or blood. Clin. Chem. Lab. Med. 2006, 44, 346–352. [Google Scholar] [CrossRef]
- de Vera, G.; Climenta, M.A.; Antón, C.; Hidalgo, A.; Andrade, C. Determination of the selectivity coefficient of a chloride ion selective electrode in alkaline media simulating the cement paste pore solution. J. Electroanal. Chem. 2010, 639, 43–49. [Google Scholar] [CrossRef] [Green Version]


Publisher’s Note: MDPI stays neutral with regard to jurisdictional claims in published maps and institutional affiliations. |
© 2021 by the authors. Licensee MDPI, Basel, Switzerland. This article is an open access article distributed under the terms and conditions of the Creative Commons Attribution (CC BY) license (https://creativecommons.org/licenses/by/4.0/).
Share and Cite
Toriz-Gutiérrez, D.A.; Ramírez-Gasca, H.; Cárdenas-Galindo, L.E.; Gallegos-Arellano, E. Electrochemical Measurement System for Chlorides in Drinking and Wastewater. Chem. Proc. 2021, 5, 46. https://doi.org/10.3390/chemproc2021005046
Toriz-Gutiérrez DA, Ramírez-Gasca H, Cárdenas-Galindo LE, Gallegos-Arellano E. Electrochemical Measurement System for Chlorides in Drinking and Wastewater. Chemistry Proceedings. 2021; 5(1):46. https://doi.org/10.3390/chemproc2021005046
Chicago/Turabian StyleToriz-Gutiérrez, Diana A., Humberto Ramírez-Gasca, Luis E. Cárdenas-Galindo, and Eloisa Gallegos-Arellano. 2021. "Electrochemical Measurement System for Chlorides in Drinking and Wastewater" Chemistry Proceedings 5, no. 1: 46. https://doi.org/10.3390/chemproc2021005046
APA StyleToriz-Gutiérrez, D. A., Ramírez-Gasca, H., Cárdenas-Galindo, L. E., & Gallegos-Arellano, E. (2021). Electrochemical Measurement System for Chlorides in Drinking and Wastewater. Chemistry Proceedings, 5(1), 46. https://doi.org/10.3390/chemproc2021005046