Abstract
Nowadays, nanosized mesoporous oxides are of increasing interest to scientists. They can be used as components of heterogeneous catalysts, for photo- and electrocatalysis, as gas sensors, etc. For instance, the desired properties in catalysts include a nano size and homogeneity of the particles that form the catalyst. The particle sizes of oxides are set at the initial stage of their formation, as precursors of precipitation in the context of wet chemistry. The creation of optimal conditions is possible through the use of homogeneous precipitation, where the precipitant is formed within the solution itself as a result of a hydrolysis reaction. The resolution of this issue involved the utilization of urea in our experimental setup, obtaining the hydrolysis products of ammonia and carbon dioxide. Consequently, precipitation reactions can be utilized to obtain hydroxides, carbonates, or hydroxy carbonates of metals. The precursors were calcined, obtaining nanosized mesoporous oxides, which can have a wide range of applications. Nanosized 0.1–50 nm metal oxides were obtained, including those aluminum, iron, indium, zinc, nickel, and cobalt.
1. Introduction
The most common use of nanosized oxides with a mesoporous structure is as catalysts for organic synthesis. Catalysts are employed in the majority of organic synthesis processes. The requirements for their properties are increasing on an annual basis. The most significant consumer qualities are high catalytic activity and selectivity for the target reaction.
Successful examples of catalytic processes in organic synthesis have been observed in both the large-scale chemical industry and small-scale pharmaceutical production [1]. In the domain of large-scale chemistry, this process entails the synthesis of acetic acid through the carbonylation of methanol in the presence of a rhodium catalyst. This method is responsible for the production of more than half of the world’s acetic acid, with a current annual output exceeding 2.5 million tons. Another successful example is the production of the well-known and widely used drug ibuprofen. The substance is obtained through a two-step process involving hydrogenation and carbonylation. A common feature of these two technologies is the use of catalysts, which make reactions with high atomic utilization sufficiently fast and attractive for business. It is evident that in order to guarantee the effective utilization of raw materials, it is imperative that catalysts exhibit high process selectivity.
In order to ensure high selectivity, it is essential that catalysts possess a specific crystal structure and chemical composition. These structural characteristics influence the number and quality of the active centers of the catalysts, thereby affecting their performance. In order to enhance the reactivity, it is frequently necessary to add special substances, known as promoters, to catalysts. A pivotal property is the shape and size of the pores, which facilitate access for reagent molecules to the active centers of catalysts. Catalysts composed of particles of uniform size have been shown to exhibit stability, high selectivity, and an increased specific surface area.
A pivotal technological characteristic of catalysts pertains to their specific surface area, which is contingent upon the dimensions of the catalyst particles. It is evident that a reduction in the size of the particles results in an increase in the specific surface area. As observed in [2], significant size effects emerge when the diameter of the catalyst particles is less than 10 nm, and these effects are concomitant with the emergence of the quantum-size effect. The term “single-atom catalyst” has recently emerged in the scientific literature. Advancements in this domain are intended to address the disparity between homogeneous and heterogeneous catalysis. It is generally accepted that this definition pertains to catalysts whose dimensions are comparable to those of single atoms [3].
Presently, research is underway to develop methodologies for the synthesis of nanosized oxides [4]. Wet chemistry methods are regarded as a promising technique due to their ease of operation and the possibility of high-volume production [5].
It is impossible to create oxides with the desired properties and control particle sizes without understanding the nature of the processes of their production. The wet methods under discussion involve the formation of precipitates of metal oxide precursors. In the majority of cases, the precursors are metal hydroxides or carbonates. The dimensions of catalytic oxides are set during the deposition stage. In the case of employing traditional methods, a solution of the precipitating reagent is added to the metal salt solution, with stirring. It has been established that local supersaturation of the solutions occurs in the locations where falling drops take place. This process is the catalyst for the formation of precipitates with polydisperse particles. It has been demonstrated that this process can be prevented through the utilization of the homogeneous precipitation method. Under these conditions, the precipitate is formed within the solution itself as a consequence of the hydrolysis reaction. It is evident that the process of hydrolysis of urea results in the formation of ammonia and carbon dioxide, which function as precipitants. In the precipitation reactions that involve urea, numerous crystallization centers are formed. Furthermore, the absence of local supersaturation within the solution milieu fosters conditions conducive to the genesis of a substantial quantity of highly dispersed precipitate particles. It is evident that the hydrolysis of urea results in the formation of the base, NH4OH, and the carbonate precipitant, (NH4)2CO3.
CO(NH2)2 + 2H2O ↔ 2NH4OH + CO2
During the process of hydrolysis within the solution, the following Equations (2)–(4) may occur:
CO(NH2)2 + H2O ↔ NH4COONH2
NH4COONH2 + H2O ↔ NH4HCO3
2NH4HCO3 ↔ (NH4)2CO3 + H2CO3
Precipitation reactions result in the formation of metal hydroxides, carbonates, or hydroxycarbonates.
In the production of catalysts, the most commonly used oxides are aluminum, iron, zinc, nickel, and cobalt [6]. A significant number of works are published on a regular basis that are devoted to the study of the catalytic properties of metals such as indium [7].
2. Materials and Methods
The method of homogeneous precipitation using urea was employed to obtain nanosized oxides [8].
The objective of this study is to ascertain the probability of the course of reactions that lead to the formation of indium hydroxide precipitates. The Gibbs energy must be calculated for reactions of urea with metal salts and water solutions at a temperature of 100 °C. At lower temperatures, the hydrolysis of urea occurs at a low rate.
The standard method described in detail in [9] was employed for the execution of the potentiometric titration. For the purposes of research, a pH meter GLP21 (Crison Instruments, S.A., Alella, Spain) equipped with the electrode 50-14-T was utilized. For the titration process, 10 mL of a 0.1 N metal nitrate solution was placed in a glass beaker. With constant stirring, a solution of urea hydrolysis products was added from a burette. The volume of the added solution and the pH of the solution were constantly measured. Equivalence points were determined by the inflections of the potentiometric titration curves. Solutions of metal nitrates, which were prepared from metal nitrates (Sigma Aldrich, St. Louis, MO, USA).
The required ratio of reagents was determined by means of a potentiometric precipitation titration. The titration process was conducted using a solution that incorporated urea hydrolysis products. The solution was prepared by subjecting the urea solution to boiling for a duration of one hour. Following the process of hydrolysis, the solution contained 0.03 N of free ammonia.
The precipitation of oxide precursors was then carried out based on the obtained values of the precipitant/metal ratios. All precipitates were thoroughly washed with distilled water, dried at a temperature of 105 °C, and calcined at a temperature of 450 °C for 2 h.
An analysis was carried out on the metal oxides to ascertain their respective properties. This analysis included the specific surface area, porosity, and crystallite size, which were measured using XRD.
The properties of the obtained oxides and their precursors were investigated by XRD analysis. XRD studies were performed using a Bruker D8 Discover diffractometer (Bruker, Billerica, MA, USA). The measurements were equipped with CuKα radiation (λ = 0.15406 nm). The dimensions of the materials’ particles were calculated using the Williamson–Hall method, which has been demonstrated to facilitate more accurate determination of the size of nanoparticles than the traditional FWHM [10,11].
For measuring of specific surface areas of oxides, the Brunauer–Emmet–Teller method (BET) is based on physical adsorption of nitrogen. For the analysis of oxide pore size distribution, the Barret–Joyner–Halenda method (BJH) was used, which is based on nitrogen adsorption isotherms.
3. Results & Discussion
The Gibbs energy values that were calculated by Equations (5)–(16) are presented in Table 1. All calculations were performed for aqueous solutions of salts that are capable of dissociating into ions. The results of calculating the Gibbs energy at a temperature of 373 K for Equations (5)–(16) are as follows; in the case of direct interaction of urea with salt solutions, Equations (5), (6), (13), and (14) are probable.

Table 1.
Gibbs energies of reactions of metal nitrates with urea.
It is important to note that, in the process of urea hydrolysis, the formation of ammonium hydroxide ammonium carbonate occurred by Equations (1) and (4). Consequently, calculations of the forming oxide precursors reactions should be conducted in relation to the products of urea hydrolysis. Since the interaction with metal salts and products of urea hydrolysis occurs in aqueous solutions, the reactions can be interpreted in ionic forms. The formation of precipitates occurs due to the interaction of metal ions in an aqueous solution with hydroxide ions, which are formed by Equation (1), and carbonate ions, which are formed by reaction (4). Equations (17), (18), and (21) reflect the precipitation of three valence metal hydroxides and carbonates by the products of urea hydrolysis. Reactions (19) and (20) reflect the precipitation of two valence metal compounds. The results of this study are presented in Figure 1.
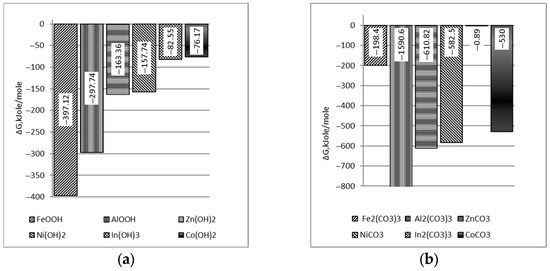
Figure 1.
Gibbs energy of oxides precursors forming reaction: (a) hydroxides according to Equations (17)–(19); (b) carbonates according to reactions (20)–(21).
Consequently, the interaction of metal salt solutions with urea hydrolysis products can result in the formation of hydroxide precipitates and carbonates of these metals. It is important to note that carbonates are formed by weak bases and weak acids, meaning that both their complete and partial hydrolysis will be possible.
The precipitant-to-metal ratio was determined through the execution of potentiometric titration, utilizing metal nitrate solutions in conjunction with a solution of urea hydrolysis products. The results of the titration are presented in Figure 2.
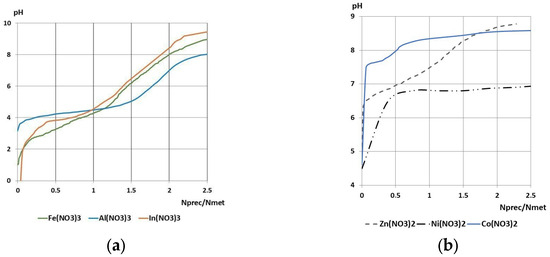
Figure 2.
Potentiometric titration curves of metal salt solutions with the formation of (a) hydroxides; (b) hydroxycarbonates.
The required amount of precipitant was ascertained through the analysis of the potentiometric curves, with the outcomes of the titration curve analysis presented in Table 2.

Table 2.
The results of the titration curves processing.
Subsequent to the obtaining of the precipitant/metal ratios, precipitates of metal oxide precursors—hydroxides and metal hydroxycarbonates—were obtained. Precipitation was carried out in glass beakers containing V = 50 mL of a concentrated solution of metal nitrate (~200 g/L) with the addition of the calculated amount of urea under conditions of constant boiling and stirring. The duration of the process was between 40 and 60 min. The resulting precipitates were then washed with sufficient distilled water to remove any residual mother liquor, after which they were dried at a temperature of 105 °C to constant weight. The dried precursors were analyzed by XRD, the X-ray patterns of which are presented in Figure 3. Phase identification was performed using an open-access dataset [12]. As per the identification process, the following substances were obtained: aluminum hydroxide of the crystalline modification boehmite, iron hydroxide (β-FeOOH), and needlelike indium hydroxide. Furthermore, nickel, cobalt, and zinc hydroxycarbonates were also obtained.
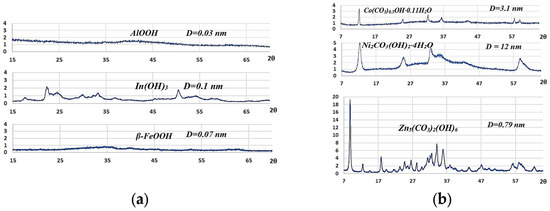
Figure 3.
The XRD patterns of oxide precursors: (a) hydroxides; (b) hydroxycarbonates.
The XRD patterns of all samples were calculated using the Williamson–Hall method [11], which suggested the use of a simple approximation. It was demonstrated that the integral width β is attributable to small crystal sizes and microdeformations. In general, the sizes of oxide crystallites are smaller than the sizes of hydroxycarbonate crystallites.
In order to obtain metal oxides, it was necessary to calcine all precursors for a period of two hours at a temperature of 450 °C. Following a cooling period, the X-ray phase analysis was conducted, and the specific surface area and porosity were subsequently determined. The XRD patterns of oxides and their sizes are presented in Figure 4.
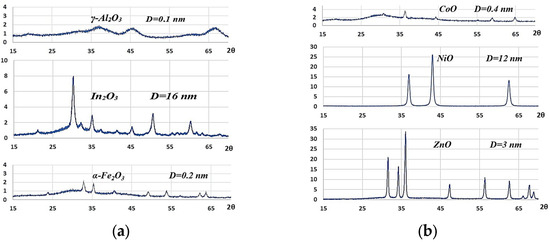
Figure 4.
The XRD patterns of oxides: (a) from hydroxides; (b) from hydroxycarbonates.
The metal oxides were identified as γ-aluminum oxide, cubic indium oxide, β-iron oxide, cubic cobalt oxide CoO, cubic nickel oxide NiO, and zinc oxide ZnO. The smallest of these are the crystallites of aluminum, iron, and cobalt oxides. Their size is measured in nanometers, with a value of less than 1 nm. The crystallites of indium, nickel, and zinc oxides are comparatively larger, ranging from 3 to 16 nm. It is conceivable that the formation of indium and zinc oxides was accompanied by the sintering of the material particles.
The oxide samples were investigated by nitrogen adsorption, and their porosity and specific surface area were determined. The adsorption isotherms are presented in Figure 5.
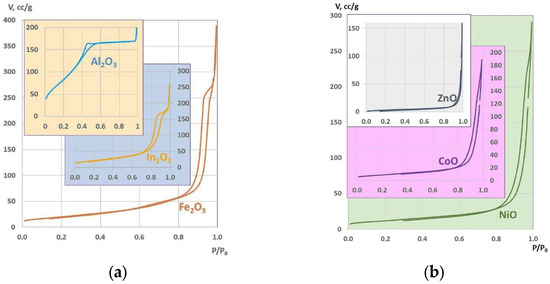
Figure 5.
The adsorption isotherms of oxides: (a) from hydroxides; (b) from hydroxycarbonates.
The presence of hysteresis in the adsorption–desorption isotherms indicates the presence of mesopores in the oxides. The adsorption isotherm of aluminum oxide (illustrated by the blue curve in Figure 5a) differs from the shapes of other isotherms.
This phenomenon can be attributed to the presence of a substantial proportion of pores with a diameter ranging from 2 to 4 nanometers, which can be designated as mesopores. The mean pore diameter for aluminum oxide is 3.53 nm (see Table 1). This fact does not prevent aluminum oxide from having the highest specific surface area among all the studied oxides.
Further findings on porosity and specific surface area measurements are displayed in Table 3.

Table 3.
The results of oxides porosity measuring.
All the studied oxides have good values of specific surface area, which is characteristic of each type of oxide. A substantial proportion of the surface area is concentrated within mesopores. In this instance, the zinc oxide exhibits a reduced size, but when compared to other oxides obtained by a different method [13], it is distinguished by its elevated porosity and a more substantial average pore diameter.
Indium oxide has been found to possess a higher specific surface area than oxide, which is obtained by calcining indium hydroxide at the same temperature [14]. The indium hydroxide [14] was obtained by means of ammonia precipitation.
A similar argument can be made for iron oxide. As demonstrated in [15], analogous results were obtained under analogous conditions, but from hydroxide precipitated with ammonia. The material thus obtained also has a larger specific surface area, average pore diameter, and pore volume.
The specific surface area and average pore diameter of the oxide obtained from nickel hydroxide by calcination at similar temperatures have been shown to be similar [16,17].
In addition to the properties outlined above, our previous research work presented the results of Raman spectroscopy of iron (III) hydroxide [18], which characterizes its crystalline modification as goethite. In the same work, scanning electron microscopy (SEM) photographs are presented, demonstrating the formation of homogeneous crystals that combine to form peanut-like superstructures. The paper [19] presents SEM images of nickel hydroxycarbonate, which demonstrate homogeneous spherical particles combined into agglomerates.
4. Conclusions
Thus, nanosized 0.1–16 nm oxides of aluminum, iron, indium, zinc, nickel, and cobalt were obtained. Consequently, the necessary conditions for obtaining precipitates of metal oxide precursors using urea were determined. It has been established that the precipitates are formed as a result of the interaction of aqueous solutions of metal nitrates with the products of urea hydrolysis, namely, ammonium hydroxide and ammonium carbonate. The requisite precipitant-to-metal ratio was ascertained through the implementation of potentiometric titration. Precursor precipitates were obtained at a boiling temperature, in accordance with the established ratio. Phase analysis using X-rays revealed the following precursors: aluminum, iron, and indium hydroxides, as well as nickel, cobalt, and zinc hydroxycarbonates. Consequently, the process of urea hydrolysis gives rise to the formation of numerous crystallization centers in a concurrent manner, thereby resulting in the precipitation of particles characterized by a monodisperse structure, as previously evidenced through the utilization of SEM. The precipitates were calcined at a temperature of 450 °C for a duration of 2 h.
Following the process of calcination, nanosized metal oxides were obtained. It is noteworthy that some of these oxides are comparable in size to those classified as single-atom. The specific surface area and porosity of the materials were determined by means of nitrogen adsorption. It was established that the specific surface area of the obtained oxides was greater than that of analogues produced by alternative methods. The majority of the surface area is located in mesopores, with a diameter ranging from 2 to 50 nm.
In general, all the obtained oxides can be characterized as nanosized mesoporous materials, which renders them suitable for the production of effective catalysts. It has been demonstrated that, for different types of oxides, it is possible to control the specific surface area and porosity by adjusting the calcination temperature.
Nanoscale oxides are most often used in the composition of heterogeneous catalysts, for energy storage and conversion, for pollutant adsorption, in the field of photo- and electrocatalysis, and as gas sensors. The choice of oxide application will depend not only on the size of the specific surface, but also on its individual properties.
Author Contributions
O.K.: Conceptualization and methodology. Formal analysis and investigation of the indium and cobalt oxides preparation. E.T.: Formal analysis and investigation of the nickel and zinc oxides preparation. K.A.: Formal analysis and investigation of the aluminum and iron oxides preparation. A.M.B.: Project administration. All authors have read and agreed to the published version of the manuscript.
Funding
The work was initiated at the V. Dahl East Ukrainian National University as a postgraduate project by E. Tantsiura and K. Abuzarova under the supervision of Dr. O. Korchuganova. The continuation of the work was made possible by the SusPharma project, that has been funded by the European Union—Health and Digital Executive Agency (HADEA), project SusPharma, grant agreement No 101057430. Views and opinions expressed are, however, those of the authors only and do not necessarily reflect those of the European Union or the Health and Digital Executive Agency. Neither the European Union nor the granting authority can be held responsible for them.
Institutional Review Board Statement
Not applicable.
Informed Consent Statement
Not applicable.
Data Availability Statement
The data supporting the findings of this study are available from the corresponding author upon reasonable request.
Conflicts of Interest
The authors declare no conflicts of interest.
References
- Sheldon, R.A. Selective Catalytic Synthesis of Fine Chemicals: Opportunities and Trends. J. Mol. Catal. A Chem. 1996, 107, 75–83. [Google Scholar] [CrossRef]
- Strizhak, P.E. Nanosize Effects in Heterogeneous Catalysis. Theor. Exp. Chem. 2013, 49, 2–21. [Google Scholar] [CrossRef]
- Parkinson, G.S. Single-Atom Catalysis: How Structure Influences Catalytic Performance. Catal. Lett. 2019, 149, 1137–1146. [Google Scholar] [CrossRef] [PubMed]
- Cheng, N.; Zhang, L.; Doyle-Davis, K.; Sun, X. Single-Atom Catalysts: From Design to Application. Electrochem. Energ. Rev. 2019, 2, 539–573. [Google Scholar] [CrossRef]
- Chen, Y.; Ji, S.; Chen, C.; Peng, Q.; Wang, D.; Li, Y. Single-Atom Catalysts: Synthetic Strategies and Electrochemical Applications. Joule 2018, 2, 1242–1264. [Google Scholar] [CrossRef]
- Kaiser, S.K.; Chen, Z.; Faust Akl, D.; Mitchell, S.; Pérez-Ramírez, J. Single-Atom Catalysts across the Periodic Table. Chem. Rev. 2020, 120, 11703–11809. [Google Scholar] [CrossRef] [PubMed]
- Martin, O.; Martín, A.J.; Mondelli, C.; Mitchell, S.; Segawa, T.F.; Hauert, R.; Drouilly, C.; Curulla-Ferré, D.; Pérez-Ramírez, J. Indium Oxide as a Superior Catalyst for Methanol Synthesis by CO2 Hydrogenation. Angew. Chem. Int. Ed. 2016, 55, 6261–6265. [Google Scholar] [CrossRef] [PubMed]
- Korchuganova, E.H.; Tantsiura, E.; Abuzarova, K.; Prygorodov, P. Study of the Urea Hydrolysis Kinetics in the Precipitation Conditions of Hydroxides and Metal Salts. East.-Eur. J. Enterp. Technol. 2015, 5, 53. [Google Scholar] [CrossRef]
- Harvey, D. Modern Analytical Chemistry; McGraw-Hill: Boston, MA, USA, 2000. [Google Scholar]
- Bunaciu, A.A.; Udriştioiu, E.G.; Aboul-Enein, H.Y. X-Ray Diffraction: Instrumentation and Applications. Crit. Rev. Anal. Chem. 2015, 45, 289–299. [Google Scholar] [CrossRef] [PubMed]
- Rabiei, M.; Palevicius, A.; Dashti, A.; Nasiri, S.; Monshi, A.; Doustmohammadi, A.; Vilkauskas, A.; Janusas, G. X-Ray Diffraction Analysis and Williamson-Hall Method in USDM Model for Estimating More Accurate Values of Stress-Strain of Unit Cell and Super Cells (2 × 2 × 2) of Hydroxyapatite, Confirmed by Ultrasonic Pulse-Echo Test. Materials 2021, 14, 2949. [Google Scholar] [CrossRef] [PubMed]
- COD Maintainers. Crystallography Open Database. 2024. Available online: https://www.crystallography.net/cod/ (accessed on 20 January 2025).
- Chabira, F.; Mahdia, T.; Razika, T.-I.; Humayun, M.; Ouyang, C.; Alanazi, A.F.; Bououdina, M.; Kyzas, G.Z. Exceptional Photocatalytic Performance of Hexagonal ZnO Nanorods for Anionic and Cationic Dyes Degradation. Polyhedron 2025, 265, 117285. [Google Scholar] [CrossRef]
- Zhang, Q.; Li, Z.; Chen, S.; Zhang, Z.; Ali, S.; Jing, L. Improved Photocatalytic Activities of Porous In2O3 with Large Surface Area by Coupling with K-Modified CuO for Degrading Pollutants. Catal. Today 2020, 339, 403–410. [Google Scholar] [CrossRef]
- Figueiredo, V.V.; Bonfim, R.P.F.; Silva, M.A.; Moreira, C.R.; Pérez, G.A.C.; Lourenço, W.A.; Salles, B.R.; Salim, V.M.M. Iron Oxide Nanoparticles: Synthesis, Surface Reactivity and Transformative Behavior under Methane Reducing Atmosphere Study via in Situ XRD. Mater. Chem. Phys. 2025, 337, 130564. [Google Scholar] [CrossRef]
- Fahim, R. Surface Area and Pore Structure of Nickel Oxide. J. Catal. 1970, 17, 10–17. [Google Scholar] [CrossRef]
- Li, J.; Li, P.; Li, J.; Tian, Z.; Yu, F. Highly-Dispersed Ni-NiO Nanoparticles Anchored on an SiO2 Support for an Enhanced CO Methanation Performance. Catalysts 2019, 9, 506. [Google Scholar] [CrossRef]
- Abuzarova, K.; Korchuganova, O. Nanosized Iron Oxyhydroxide: Properties, Application, Preparation. J. Phys. Conf. Ser. 2020, 1534, 012002. [Google Scholar] [CrossRef]
- Denysov, O.; Tantsiura, E.; Abuzarova, K.; Korchuganova, O. Nickel and Zinc Hydroxycarbonates Are Precursors of Nanoscale Oxides. In Proceedings of the 2021 IEEE 11th International Conference Nanomaterials: Applications & Properties (NAP), Odessa, Ukraine, 5–11 September 2021; pp. 1–4. [Google Scholar] [CrossRef]
Disclaimer/Publisher’s Note: The statements, opinions and data contained in all publications are solely those of the individual author(s) and contributor(s) and not of MDPI and/or the editor(s). MDPI and/or the editor(s) disclaim responsibility for any injury to people or property resulting from any ideas, methods, instructions or products referred to in the content. |
© 2025 by the authors. Licensee MDPI, Basel, Switzerland. This article is an open access article distributed under the terms and conditions of the Creative Commons Attribution (CC BY) license (https://creativecommons.org/licenses/by/4.0/).