Proceeding Paper

The Effect of Oxygen on the Optical Properties of Citric Acid-Based Carbon Dots †

by
Federico Turco
,
Benedetta Maria Squeo
,
Francesca Villafiorita-Monteleone
,
Chiara Botta
and
Mariacecilia Pasini
*
Institute of Chemical Sciences and Technologies (SCITEC)—CNR, 20133 Milano, Italy
*
Author to whom correspondence should be addressed.
Presented at the 28th International Electronic Conference on Synthetic Organic Chemistry (ECSOC-28), 15–30 November 2024; Available online: https://sciforum.net/event/ecsoc-28.
Chem. Proc. 2024, 16(1), 107; https://doi.org/10.3390/ecsoc-28-20195
Published: 14 November 2024

Abstract

:
In this study, the photophysical properties of CDs obtained as described in the literature from citric acid, formic acid, and urea were studied in two different solvents, water and DMSO, and under a nitrogen and oxygen atmosphere. The results indicate a possible doping effect of oxygen, which significantly impacts optical proprieties.

1. Introduction

Carbon dots (CDs) are an emerging class of 0-dimensional nanoparticles belonging to the carbon-based family of materials. Characterized by a graphene-like core surrounded by amorphous, functionalized carbon, these nanoparticles are typically less than 20 nm in size and were first reported in 2004 [1]. Over the past few years, CDs have attracted significant attention due to their unique and advantageous properties. They are easily synthesized from a broad range of low-cost starting materials via bottom-up approaches, making their production highly scalable and economically viable [2]. In addition, their biocompatibility, low cytotoxicity [3], tunable photoluminescence [4], and photo-induced electron transfer capabilities have positioned CDs as versatile materials for applications in sensing [5], bioimaging [6], catalysis [7,8], photodynamic therapy [9,10], packaging [11], and optoelectronic devices [12]. Because of these qualities, CDs are increasingly seen as a promising organic alternative to metal-based quantum dots.
Despite their potential, there remain significant challenges in understanding the correlation between the optical properties of CDs and their nanoparticle structure. Achieving reproducibility in their synthesis and gaining insight into the mechanisms behind their photoluminescence are some of the primary hurdles in fully exploiting the potential of these carbon-based nanoparticles.
In particular, CDs that exhibit efficient excitation and emission in the deep-red [13,14,15] and near-infrared (NIR) [16,17] spectral ranges are of considerable interest for bioimaging applications. Emission in these regions is crucial for in vivo imaging since tissue autofluorescence and light scattering are minimized, leading to improved imaging contrast and spatial resolution. Several research groups have reported on CDs with deep-red and/or NIR emissions, typically excited by light in the green spectral region. To achieve such emissions, various techniques such as heteroatom doping, size control, surface engineering, and the chemical environment modulation of CDs have been explored. For instance, Jiang et al. reported CDs [18] with full-range UV-Vis-NIR emission through fluorine and nitrogen co-doping, where the optimum excitation wavelength was around 550 nm with a photoluminescence quantum yield (PLQY) of 9.8%.
Efficient red-emissive CDs in aqueous solutions remain scarce, which limits their performance in high-resolution bioimaging. However, some progress has been made. For example, a one-step solvothermal method has been developed to synthesize pure red-emissive CDs (FA-CDs) [19] from citric acid and urea in formic acid, avoiding the need for complicated purification procedures. Additionally, surface modifications of CDs have been found to affect their NIR absorption and emission properties. The adsorption of electron acceptor groups on the CD surface can enhance NIR emission, and it has been demonstrated that the deprotonation of surface hydroxyl groups can shift the absorption band toward longer wavelengths while also enhancing emission intensity by inhibiting energy dissipation [20].
Understanding the factors that influence photoluminescence emission and photothermal conversion in the deep-red/NIR regions is of utmost importance for the design of CDs with enhanced emission in these ranges. One major area of study is the role of surface hydroxyl groups, which are commonly found on CDs. The protonation and deprotonation processes on the CD surface significantly impact their energy structure, yet relatively few studies have investigated the effects of surface protonation on these optical properties. Moreover, in applications for in vivo bioimaging, the effect of environmental oxygen on CDs must be carefully considered. Unlike in electronic applications, oxygen is always present in biological systems, and its interaction with CDs could influence their optical behavior.
In light of this, the present study examines the combined effects of solvents and oxygen on the optical properties of CDs. Building on previous work by Zhang et al. [20], which successfully demonstrated the use of CDs for in vivo applications, we analyze how both UV absorption and photoluminescence are affected by oxygen exposure. Our results suggest that oxygen may play a role in doping CDs, thereby altering their optical properties. Understanding these interactions is critical for the development of CDs that are optimized for biological imaging, where oxygen is an unavoidable component of the environment. This study contributes to the growing body of knowledge regarding the factors that influence the optical behavior of CDs, particularly in biologically relevant conditions.
By continuing to explore the relationship between CD structure, surface chemistry, and optical properties, researchers aim to enhance the reproducibility and efficiency of CDs, bringing us closer to realizing their full potential in a wide range of applications, especially in biomedical imaging and therapy.

2. Materials and Methods
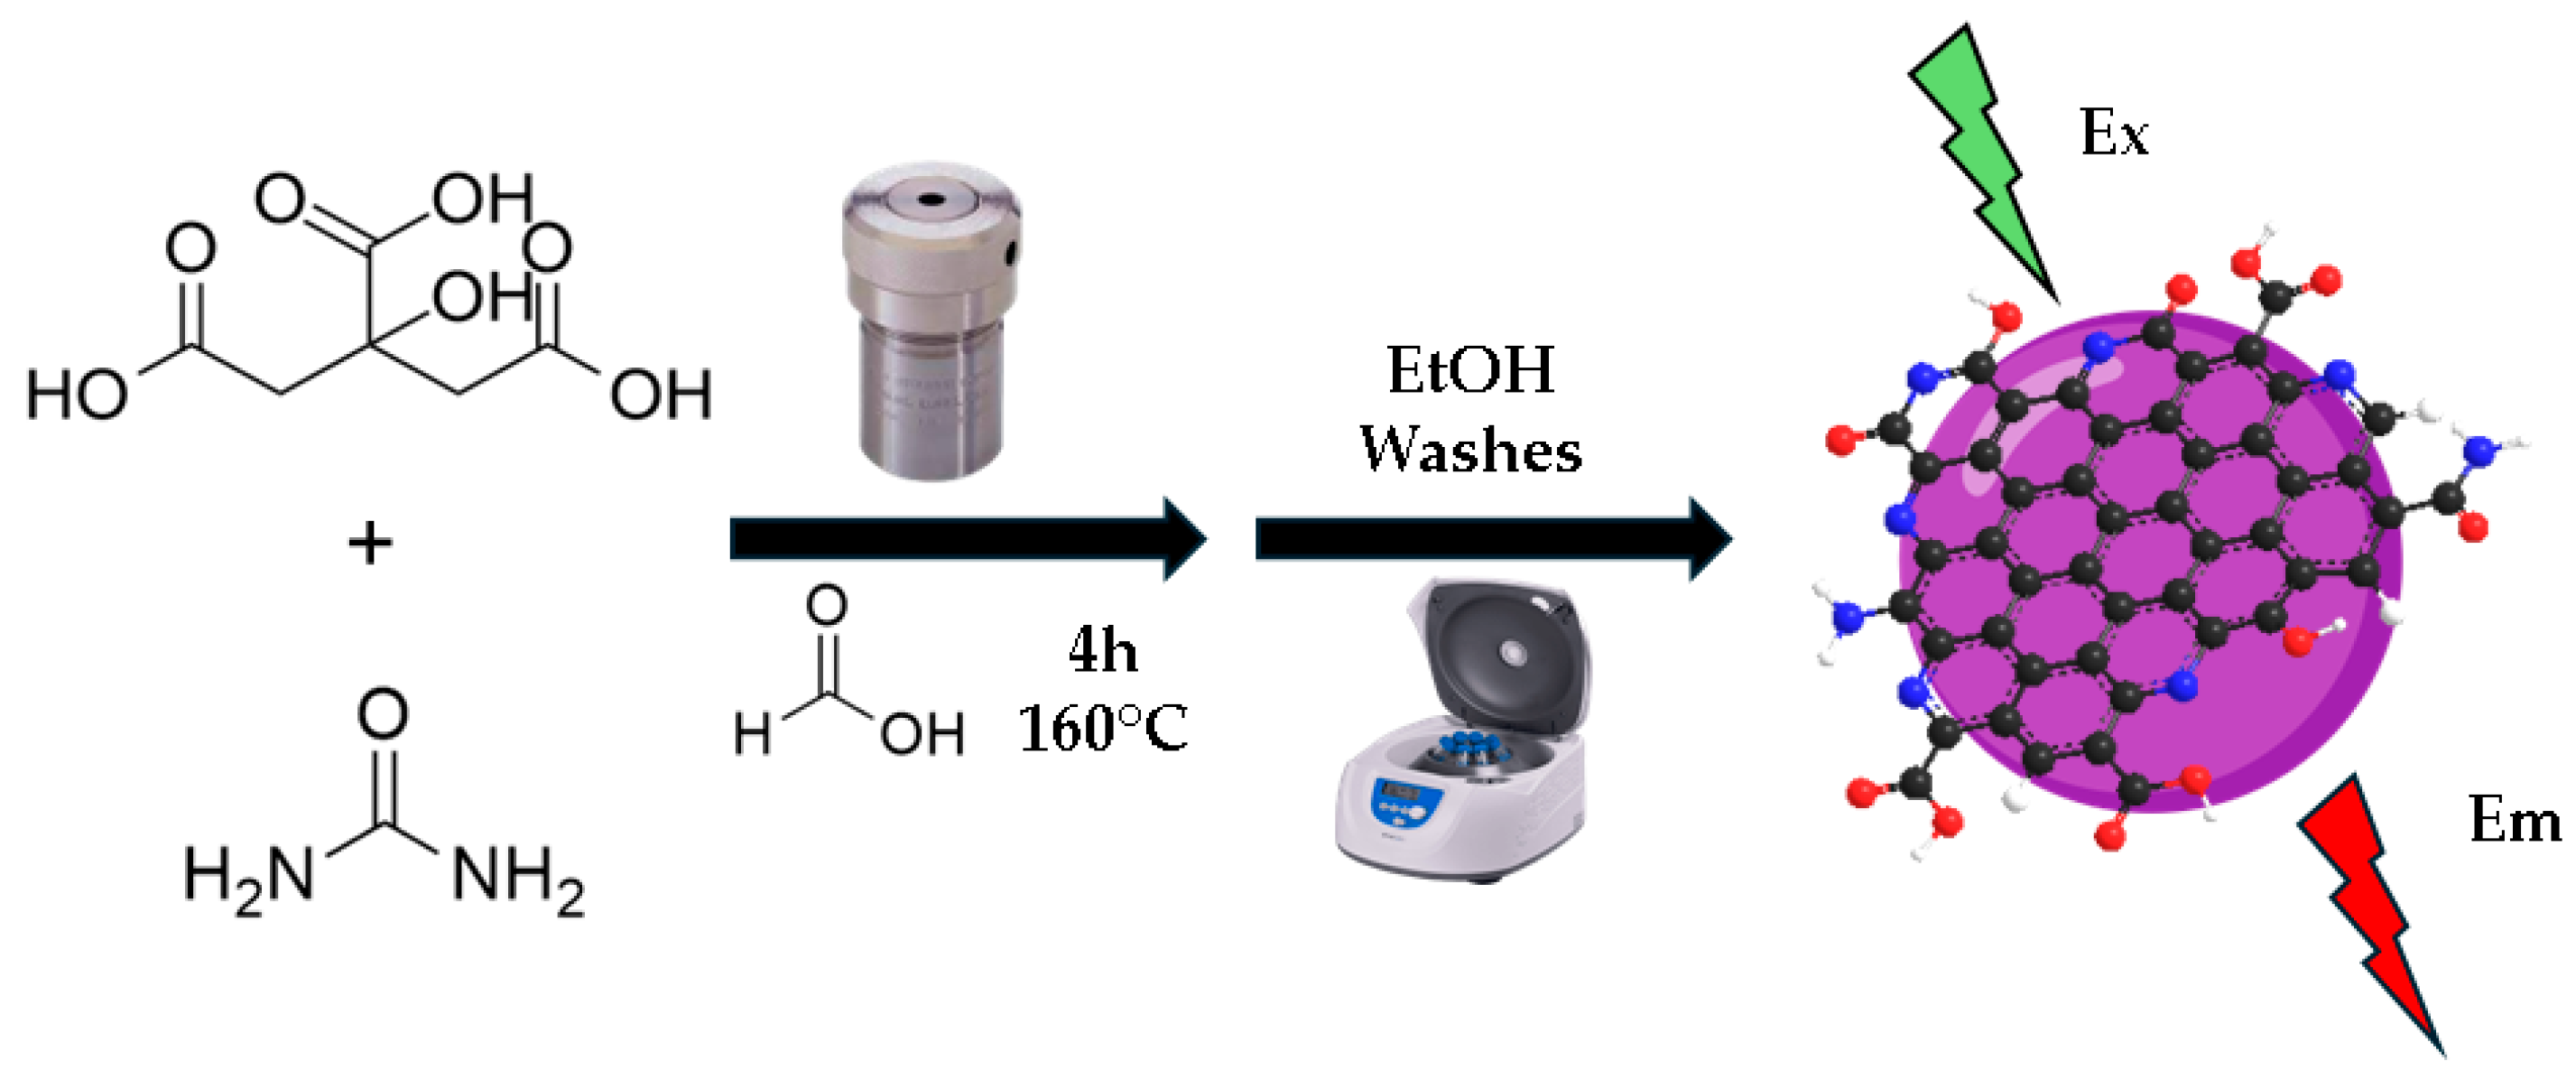
2.1. Materials

Citric acid was provided by Tokyo Chemicals Industry Co. (Tokyo, Japan); urea was provided by J.T. Baker Chemicals (Phillsburg, PA, USA); hydrazine was provided by Fluka Chemika (Buchs, Switzerland); formic acid, DMSO, and Ethanol were provided by Merck (Darmstadt, Germany). Omnipore 0.45 μm PTFE filters were provided by Merck; 0.22 μm Nylon syringe filters were provided by Labbox (Barcelona, Spagna).

2.2. Instruments

The autoclave used is a Buchi Tinyclave with a Teflon insert in a Steel body. Atomic Force Microscopy (AFM) was performed with AFM NTMDT NTEGRA (NT-MDT Spectrum Instruments LLC. Moscow, Russia) in tapping mode with an NSG10 cantilever operating at a typical cantilever resonance frequency of 140–390 kHz. UV-Vis analyses were performed with Perkin Elmer UV/VIS/NIR Lambda 900. Luminescence measurements were conducted with a NanoLog composed of an iH320 spectrograph equipped with a Synapse Qextra charge-coupled device by initiating excitation with a monochromated 450W Xe lamp. FT-IR characterization was carried out with a Bruker Tensor 27. The quartz cuvette used for Abs and Em has a path length of 1 cm, and it has a quartz cap with a sink.

2.3. Methods

The CDs were obtained through a solvothermal reaction (Figure 1) in an autoclave from citric acid and urea using formic acid as a solvent according to [20]. Briefly, 1 g of citric acid (5.2 mmol) and 2 g of urea (6.4 eq) were placed in a 25 mL Teflon-lined autoclave and dissolved in formic acid with the aid of magnetic stirring. Once the reagents were solubilized, the autoclave was heated in an oil bath at 160 °C for 4 h. Then, the autoclave was cooled down to room temperature, and the reaction mixture was diluted with 40 mL of Ethanol, which led to the precipitation of CDs. After centrifugation at 6000 rpm for ten minutes, the supernatant solution was removed, and the CDs were redispersed in Ethanol and centrifugated twice more to remove unreacted precursors and the blue-absorbing fraction of CDs. At the end of this experiment, the washed solid was dissolved in distilled water and was filtered first on a 0.45 μm Buchner filter and then through a 0.22 μm syringe filter. The solution was dried using a rotary evaporator to obtain a black powder.
Absorption and emission spectra were obtained both in distilled water and DMSO. The solutions were prepared in an inert environment under nitrogen gas. The sample powder of the CDs underwent several nitrogen vacuum cycles to ensure the absence of oxygen.

3. Results and Discussion
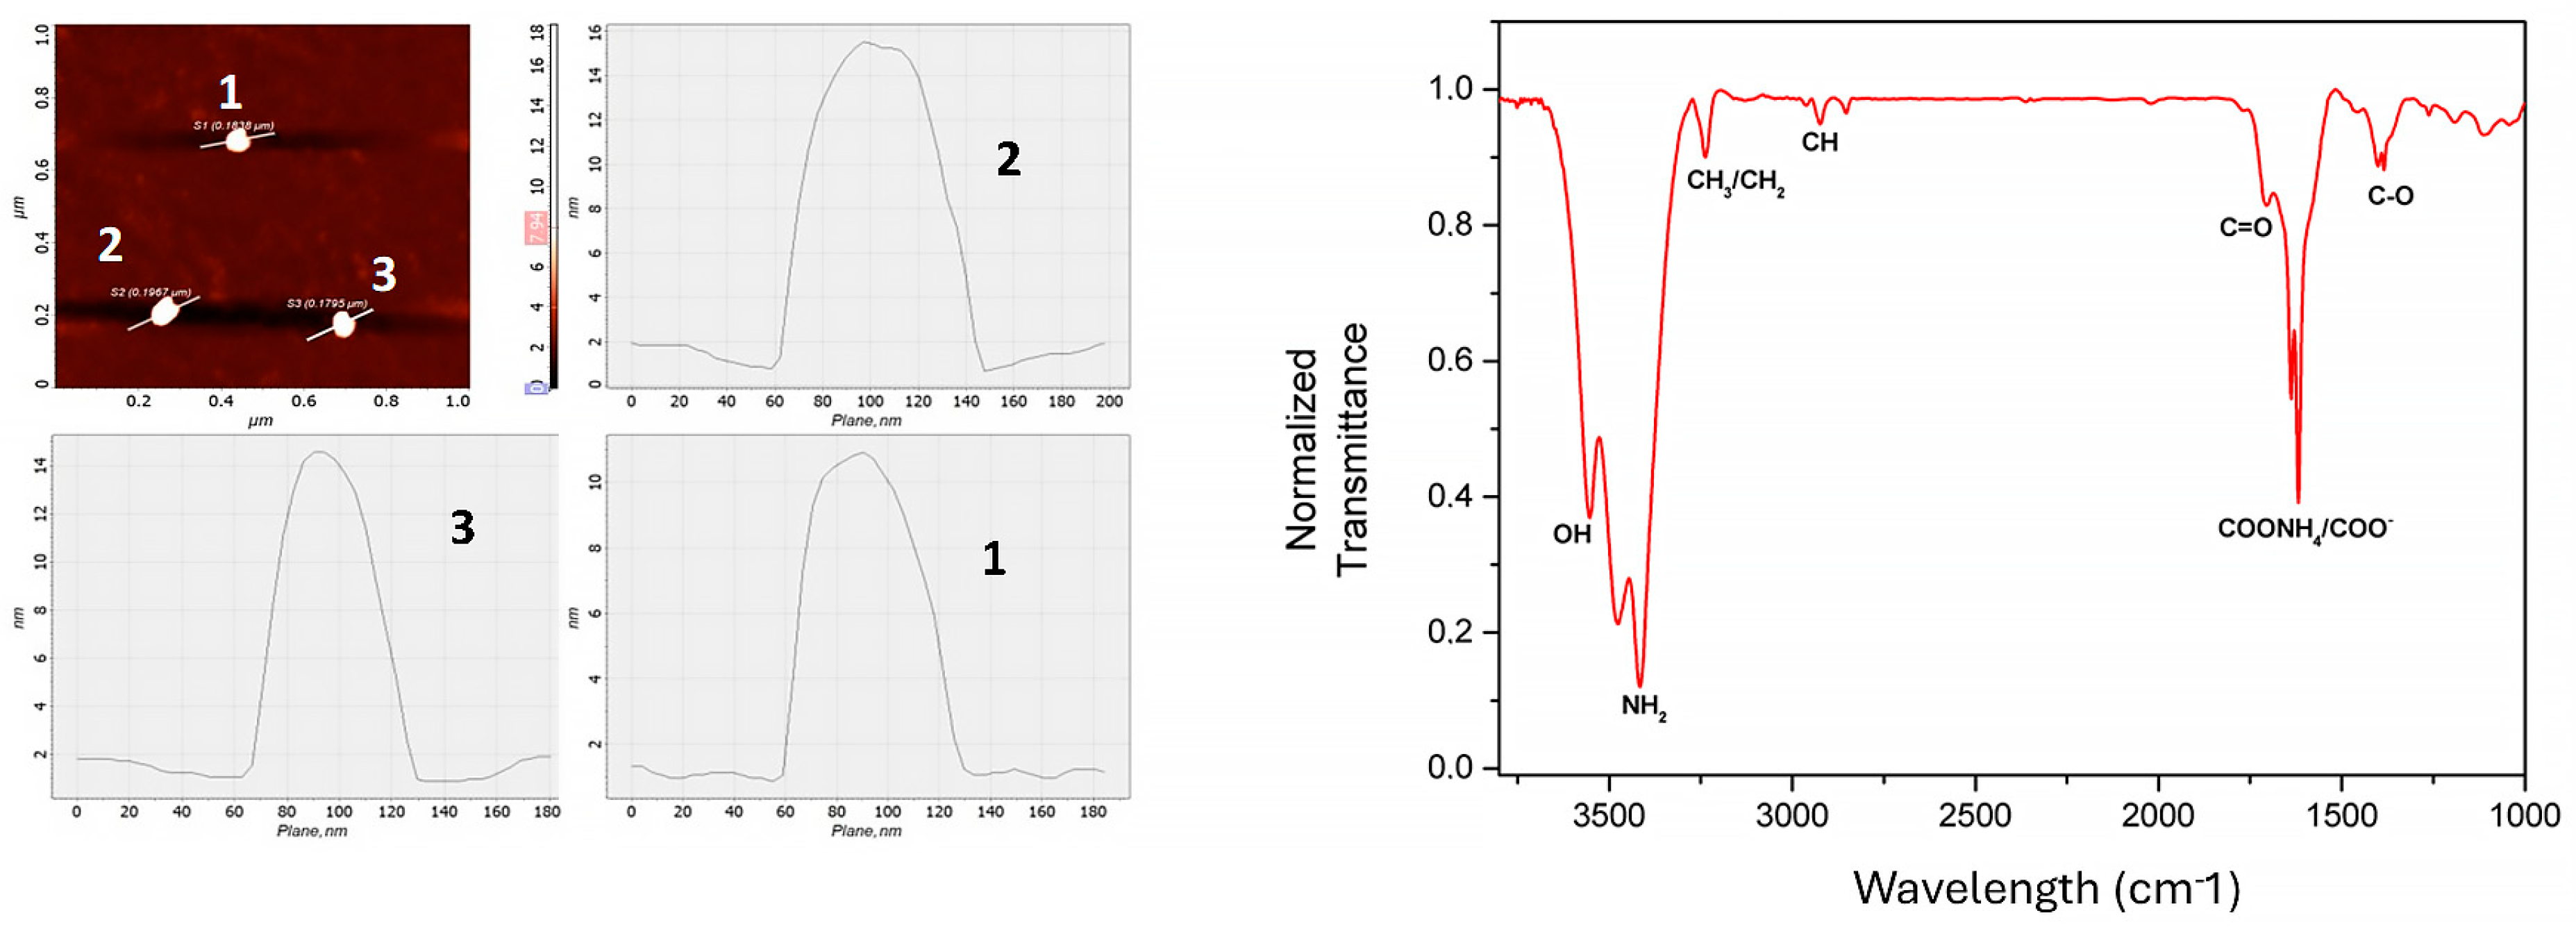
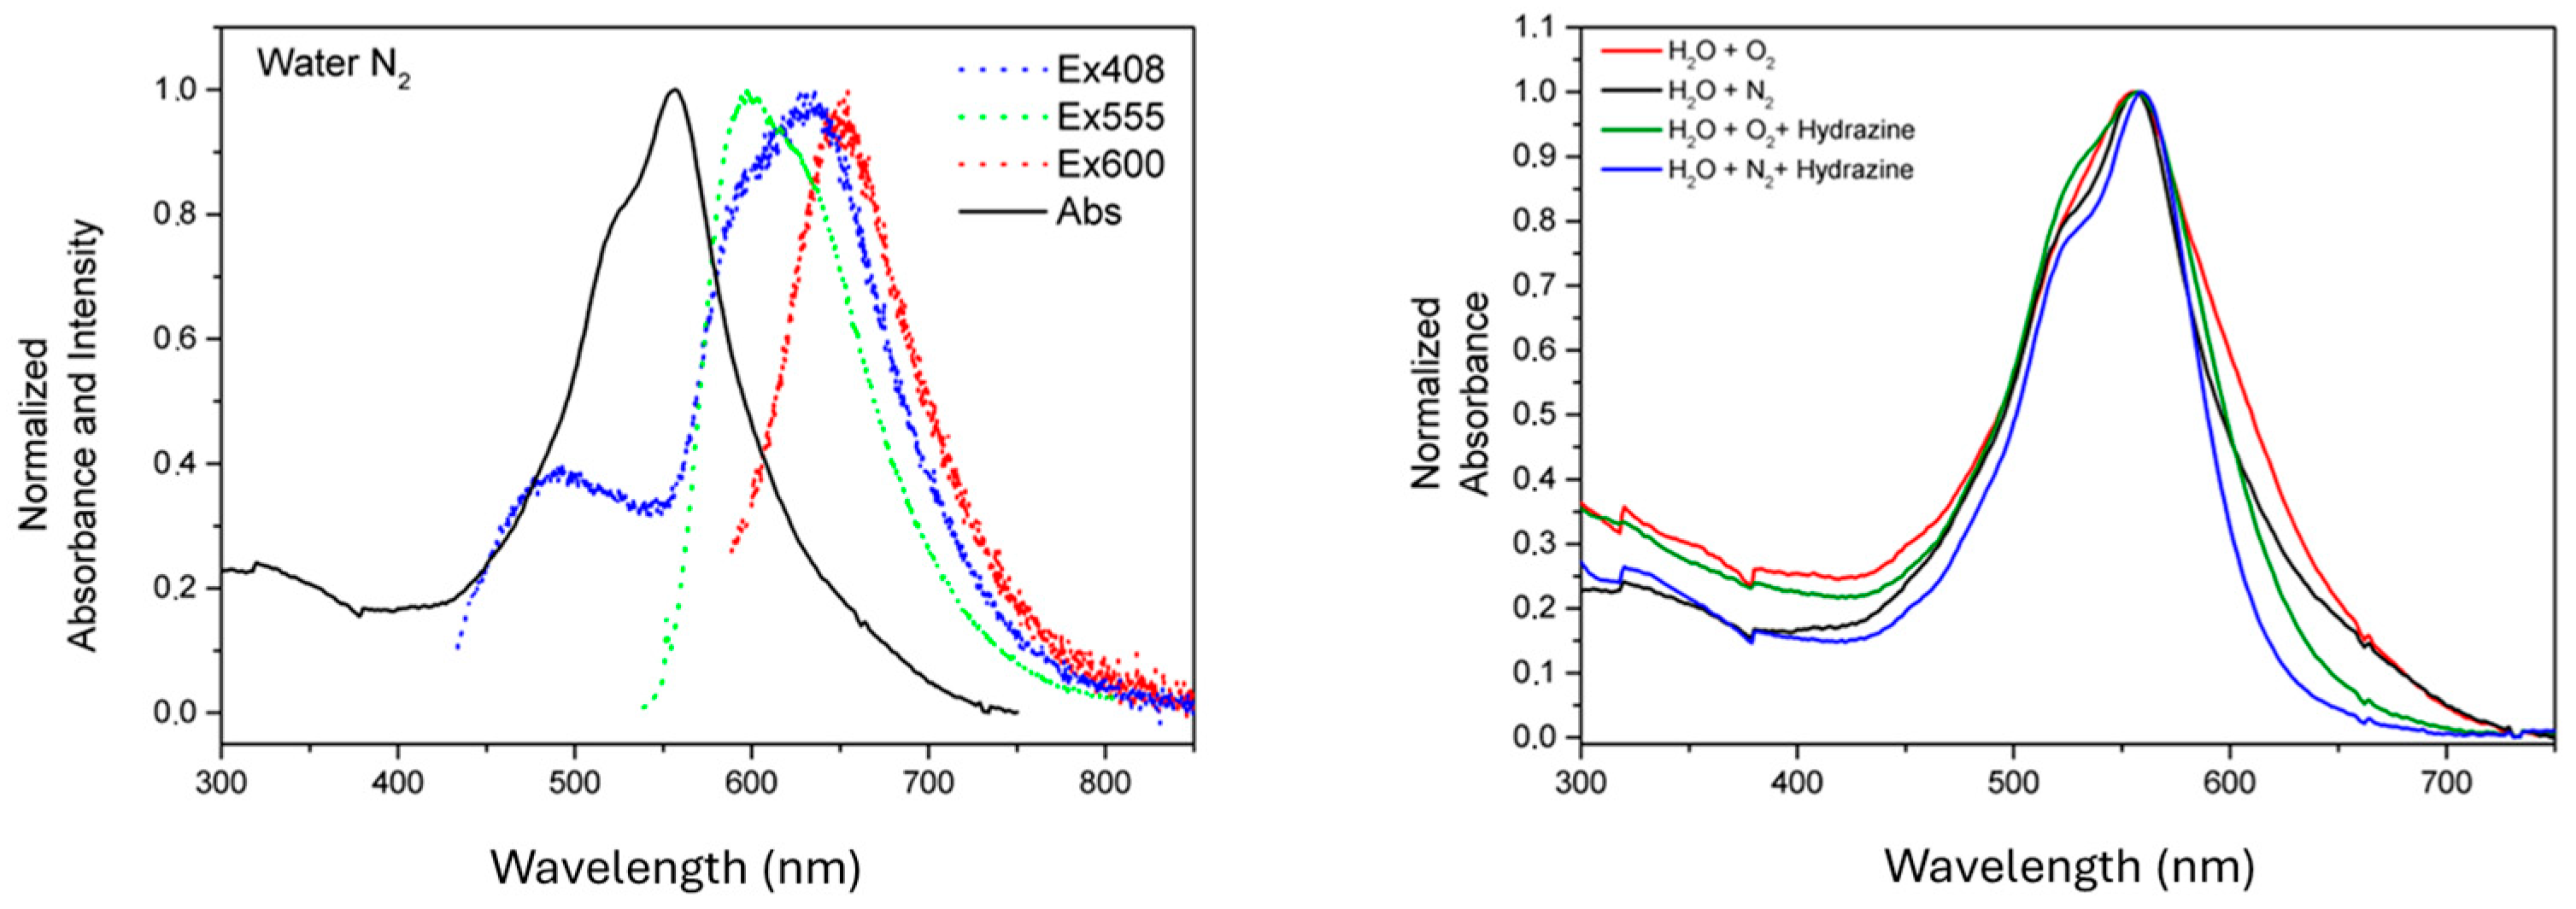
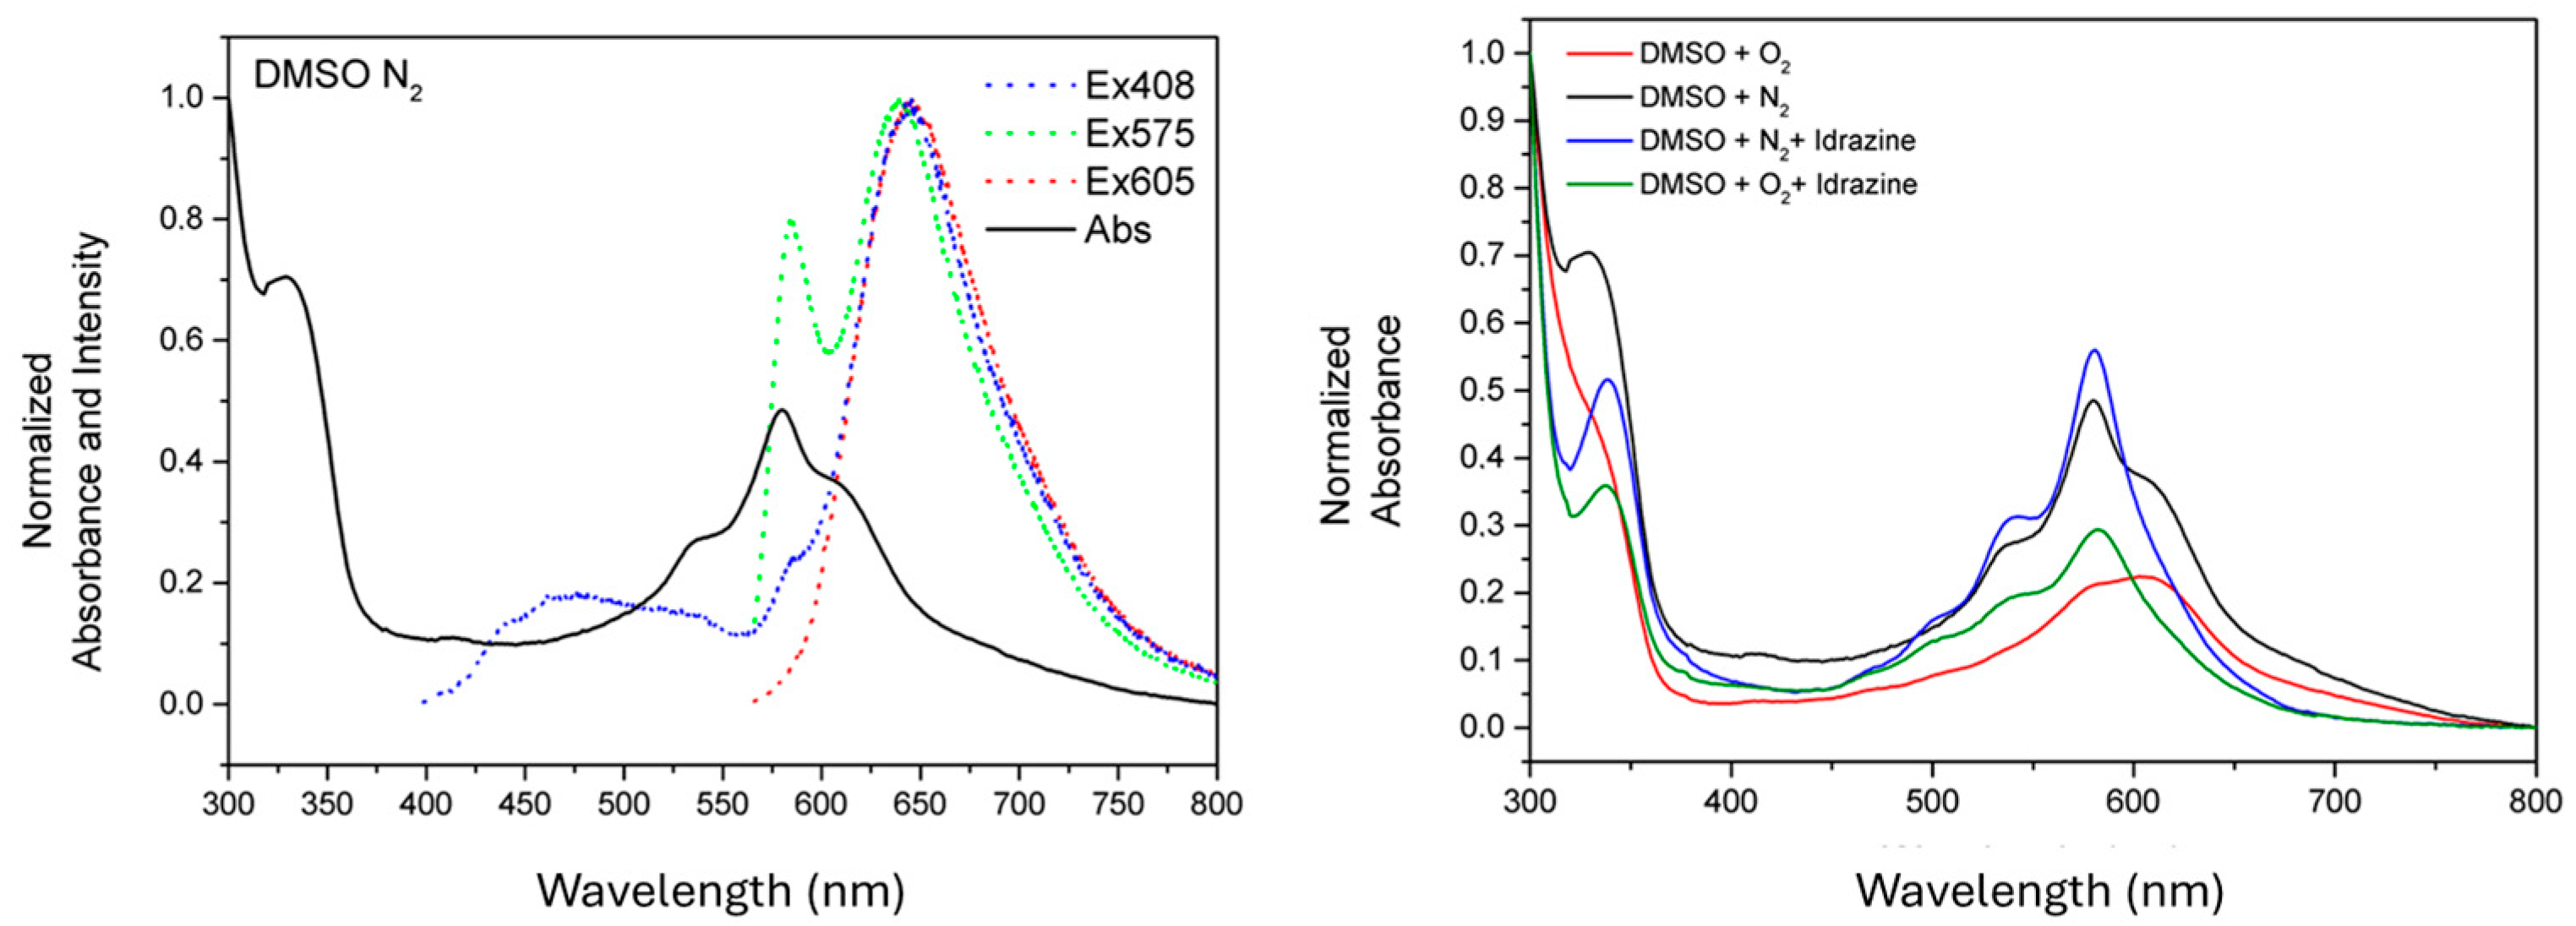
Characterization

The dimensions of the synthetized CDs were evaluated through the AFM technique (Figure 2, left); the height of the samples is 12–15 nm. The FT-IR spectra show (Figure 2, right) absorption peaks at 3550 cm−1 ν of O-H dimers, 3475 cm−1 and 3415 cm−1 ν of N-H of primary amides or amines, a peak at 2962 cm−1 ν of CH3 and CH2, a peak at 2923 cm−1 ν of =C-H, 1704 cm−1 ν of C=O, 1627 cm−1 and 1618 cm−1 of COO-/COONH4, and 1401 cm−1 and 1386 cm−1 of C-O groups. Elemental analysis reveals the composition of the CDs (C, H, N, O), with the oxygen value obtained by the difference of the others: C (45.63%), H (4.12%), N (14.12%), and O (36.13%).
To verify a possible effect of oxygen on absorption/emission properties, spectra were recorded for four different solutions for each solvent: one solution made with a degassed solvent identified as “Solvent + N2”, one identified as “Solvent + O2” obtained from “Solvent + N2” after bubbling oxygen inside, one identified as “Solvent +O2 + Hydrazine” obtained from the previous one with the addition of hydrazine, and a fresh one identified as “Solvent + N2 + Hydrazine”.
Hydrazine is reported in the literature as an agent used for the de-doping of organic materials [21,22]. This is particularly relevant in the cases of oxygen-induced doping, as oxygen often acts as an electron acceptor in conjugated polymers, leading to an increase in charge carrier concentration, essentially creating a “doped” state. Hydrazine, being a strong reducing agent, has the ability to remove these charge carriers and restore the polymer to its neutral or “de-doped” state. Hydrazine is widely used in the treatment of organic materials because it is compatible with the chemical structure of conjugated polymers. It does not damage the polymer chain but acts selectively on the oxidized groups, preserving the desired electronic properties of the material. Thus, CDs can be seen as analogous to organic conjugated polymers [23,24], both in terms of their structural versatility and the presence of functional groups that define their interactions with light, charge carriers, and other materials. For this reason, we decided to treat the solutions with hydrazine.
In Figure 3, on the left, the absorption and emission spectra are reported at different excitation wavelengths of CDs in water under N2. The absorption spectrum has a main absorption band at 556 nm and an excitation-dependent PL (photoluminescence) emission. In water (N2), the overall luminescence is composed of three components [25]: one in the blue range at about 498 nm, one in the yellow area (598 nm), and one red component at 645 nm. In Figure 3, on the right, the absorption spectra in water with and without oxygen and after treatment with hydrazine are reported. No significant changes are observed in the absorption positions, but the broadening of the bands and a longer wavelength tail are noted compared to the corresponding spectra treated with hydrazine.
In Figure 4, on the left, the absorption and emission spectra are reported at different excitation wavelengths of CDs in DMSO under N2. The absorption spectrum has a main absorption band at 580 nm and two shoulders, one at high energy at about 540 nm and one at a lower energy at about 605 nm and a strongly excitation-dependent PL emission. Also, in the DMSO solvent, three different emissions can be recognized, a broad one in the blue region, at about 470 nm (τav = 7.46 ns), and two sharper ones in the yellow and red regions, at 583 nm (τav = 3.84 ns) and 640 nm (τav = 2.74 ns), respectively. The different behaviors in the two solvents, as previously observed in [20], are due to the fact that while water is a polar protic solvent, DMSO is a polar aprotic solvent with good deprotonation ability due to its S = O groups and strong electron-withdrawing ability. It has been demonstrated that the deprotonation of the surface can enhance the surface electron-withdrawing environment of CDs, leading to a red-shifted absorption band and enhanced emission intensity by inhibiting the energy dissipation of hydroxyl groups [20]. Indeed, the PL quantum yields of water and DMSO solutions, measured under N2, display values of 15% and 54% for water and DMSO solutions, respectively (see Table 1).
The effect of oxygen is particularly evident in the absorption spectra of the DMSO solutions, as shown in Figure 4 on the right. In the presence of oxygen, the absorption spectrum shows a sharp reduction in the high energy peak and a consequent red shift of the maximum at around 609 nm. The treatment of the solution with hydrazine does not cause a shift in the main bands but reveals the disappearance of the 640 nm lower energy shoulder, which could be attributed to the presence of oxygen in the synthetized material due to the fact that synthesis and purification were not carried out in an inert atmosphere.
In Figure 5, the PL spectra of water (A) and DMSO (B) solutions are reported for the four solutions whose absorption is reported in Figure 3 (right) and Figure 4 (right). When O2 is bubbled into the solutions, a reduction in the yellow component of the PL spectra is observed, particularly evident in the case of the DMSO solvent. By adding hydrazine to the O2 solution, the yellow emission is partially restored. So, hydrazine is able to partially restore the yellow emission after it has been quenched by O2. By adding hydrazine to the N2 solutions, the PL spectrum shape does not change significantly.
When O2 is bubbled into the DMSO + N2 solution, analogously to the addition to the water solution, the yellow emission at 587 nm is switched off, so each excitation in DMSO + O2 leads to 645 nm emission, while the absorption peaks decrease in intensity, except for the one at 605 nm.
By the addition of hydrazine to the DMSO +O2 sample, the yellow emission is significantly restored at 599 nm, while if it is added to the DMSO + N2 solution, the peak at 587 increases its intensity and red shifts at 591 nm. The lower-energy absorption component, at 605 nm, in both cases, following hydrazine addition, disappears.
In conclusion, we performed a photophysical analysis of water and DMSO solutions under N2, with oxygen or hydrazine addition, in order to recognize the role of oxygen in doping CDs. In both the solvents, three components are present in the absorption and emission spectra. In DMSO, an absorption component at 640 may be attributed to the presence of oxygen accompanied by a sharp reduction in the 540 nm band. The 640 nm component is also present in the broadening at the lower energy of the absorption spectrum in water. The PL analysis shows that oxygen quenches the yellow component of the emission in both water and DMSO. By hydrazine addition, the yellow emission component is partially restored. However, the PL QY analysis in DMSO (see Table 1) shows that the addition of hydrazine induces a reduction in the overall intensity of PL.

Author Contributions

Conceptualization, M.P. and B.M.S.; methodology, F.T., M.P. and C.B.; software, C.B. and F.V.-M.; validation, F.T., M.P. and C.B.; formal analysis, F.T., C.B. and F.V.-M.; investigation, F.T., C.B., M.P. and F.V.-M.; resources, F.T., M.P. and C.B.; data curation, F.T., M.P. and C.B.; writing—original draft preparation, F.T.; writing—review and editing, F.T., M.P. and C.B.; visualization, F.T., M.P. and C.B.; supervision, M.P. and B.M.S.; project administration, M.P.; funding acquisition, M.P. All authors have read and agreed to the published version of the manuscript.

Funding

This research was funded by Fondazione Cariplo “Circular economy for a sustainable future” 2021 call, project ‘FENICE’ (Functional carbon dots for ENhancing tomato production In a Circular Economy scheme), g.a.2021-0626 (2022–2025).

Data Availability Statement

Dataset available on request from the authors.

Conflicts of Interest

The authors declare no conflict of interest.

References

  1. Xu, X.; Ray, R.; Gu, Y.; Ploehn, H.J.; Gearheart, L.; Raker, K.; Scrivens, W.A. Electrophoretic Analysis and Purification of Fluorescent Single-Walled Carbon Nanotube Fragments. J. Am. Chem. Soc. 2004, 126, 12736–12737. [Google Scholar] [CrossRef]
  2. Kang, C.; Huang, Y.; Yang, H.; Yan, X.F.; Chen, Z.P. A review of carbon dots produced from biomass wastes. Nanomaterials 2020, 10, 2316. [Google Scholar] [CrossRef]
  3. Liao, J.; Yao, Y.; Lee, C.H.; Wu, Y.; Li, P. In vivo biodistribution, clearance, and biocompatibility of multiple carbon dots containing nanoparticles for biomedical application. Pharmaceutics 2021, 13, 1872. [Google Scholar] [CrossRef]
  4. Rao, L.; Zhang, Q.; Sun, B.; Wen, M.; Zhang, J.; Zhong, G.; Fu, T.; Niu, X. Multicolor Luminescent Carbon Dots: Tunable Photoluminescence, Excellent Stability, and Their Application in Light-Emitting Diodes. Nanomaterials 2022, 12, 3132. [Google Scholar] [CrossRef]
  5. Hamed, M.; Chinnam, S.; Bedair, A.; Emara, S.; Mansour, F.R. Carbon quantum dots from natural sources as sustainable probes for metal ion sensing: Preparation, characterizations and applications. Talanta Open 2024, 10, 100348. [Google Scholar] [CrossRef]
  6. Wang, B.; Cai, H.; Waterhouse GI, N.; Qu, X.; Yang, B.; Lu, S. Carbon Dots in Bioimaging, Biosensing and Therapeutics: A Comprehensive Review. Small Sci. 2022, 2, 2200012. [Google Scholar] [CrossRef]
  7. Michenzi, C.; Scaramuzzo, F.; Salvitti, C.; Pepi, F.; Troiani, A.; Chiarotto, I. Photo-Activated Carbon Dots as Catalysts in Knoevenagel Condensation: An Advance in the Synthetic Field. Photochem 2024, 4, 361–376. [Google Scholar] [CrossRef]
  8. Carioscia, A.; Cocco, E.; Casacchia, M.E.; Gentile, G.; Mamone, M.; Giorgianni, G.; Incerto, E.; Prato, M.; Pesciaioli, F.; Filippini, G.; et al. Nitrogen-Rich Carbon Dots as Effective Catalysts in the 1,4-Reduction of α,β-Unsaturated Aldehydes via Ion Pair Asymmetric Nano-Organocatalysis. ACS Catal. 2024, 14, 13429–13438. [Google Scholar] [CrossRef]
  9. Nguyen, V.-N.; Pham, H.L.; Nguyen, X.T. Recent progress in organic carbon dot-based photosensitizers for photodynamic cancer therapy. Dye. Pigment. 2024, 230, 112359. [Google Scholar] [CrossRef]
  10. Karagianni, A.; Tsierkezos, N.G.; Prato, M.; Terrones, M.; Kordatos, K.V. Application of carbon-based quantum dots in photodynamic therapy. Carbon 2023, 203, 273–310. [Google Scholar] [CrossRef]
  11. Ardini, B.; Manzoni, C.; Squeo, B.; Villafiorita-Monteleone, F.; Grassi, P.; Pasini, M.; Bollani, M.; Virgili, T. Spectral Imaging of UV-Blocking Carbon Dot-Based Coatings for Food Packaging Applications. Coatings 2023, 13, 785. [Google Scholar] [CrossRef]
  12. Lagonegro, P.; Giovanella, U.; Pasini, M. Carbon Dots as a Sustainable New Platform for Organic Light Emitting Diode. Coatings 2020, 11, 5. [Google Scholar] [CrossRef]
  13. Chen, M.; Ma, J.; Chen, C.; Ding, J.; Liu, Y.; He, H.; Liu, Q.; Hu, G.; Wu, Y.; Liu, X. Cutting-edge innovations in red carbon dots: Synthesis, perfection, and breakthroughs in optoelectronics and electrocatalysis. Chem. Eng. J. 2024, 498, 155302. [Google Scholar] [CrossRef]
  14. Qin, W.; Wang, M.; Li, Y.; Li, L.; Abbas, K.; Li, Z.; Tedesco, A.C.; Bi, H. Recent advances in red-emissive carbon dots and their biomedical applications. Mater. Chem. Front. 2024, 8, 930–955. [Google Scholar] [CrossRef]
  15. Warjurkar, K.; Panda, S.; Sharma, V. Red emissive carbon dots: A promising next-generation material with intracellular applicability. J. Mater. Chem. B 2023, 11, 8848–8865. [Google Scholar] [CrossRef] [PubMed]
  16. Hussain, M.M.; Khan, W.U.; Ahmed, F.; Wei, Y.; Xiong, H. Recent developments of Red/NIR carbon dots in biosensing, bioimaging, and tumor theranostics. Chem. Eng. J. 2023, 465, 143010. [Google Scholar] [CrossRef]
  17. Wang, Y.; Li, X.; Zhao, S.; Wang, B.; Song, X.; Xiao, J.; Lan, M. Synthesis strategies, luminescence mechanisms, and biomedical applications of near-infrared fluorescent carbon dots. Coord. Chem. Rev. 2022, 470, 214703. [Google Scholar] [CrossRef]
  18. Jiang, L.; Ding, H.; Xu, M.; Hu, X.; Li, S.; Zhang, M.; Zhang, Q.; Wang, Q.; Lu, S.; Tian, Y.; et al. UV–Vis–NIR Full-Range Responsive Carbon Dots with Large Multiphoton Absorption Cross Sections and Deep-Red Fluorescence at Nucleoli and In Vivo. Small 2020, 16, 2000680. [Google Scholar] [CrossRef]
  19. Zhang, H.; Wang, G.; Zhang, Z.; Lei, J.H.; Liu, T.-M.; Xing, G.; Deng, C.-X.; Tang, Z.; Qu, S. One step synthesis of efficient red emissive carbon dots and their bovine serum albumin composites with enhanced multi-photon fluorescence for in vivo bioimaging. Light Sci. Appl. 2022, 11, 113. [Google Scholar] [CrossRef]
  20. Liu, E.; Liang, T.; Ushakova, E.V.; Wang, B.; Zhang, B.; Zhou, H.; Xing, G.; Wang, C.; Tang, Z.; Qu, S.; et al. Enhanced Near-Infrared Emission from Carbon Dots by Surface Deprotonation. J. Phys. Chem. Lett. 2021, 12, 604–611. [Google Scholar] [CrossRef]
  21. Shi, W.; Yao, Q.; Qu, S.; Chen, H.; Zhang, T.; Chen, L. Micron-thick highly conductive PEDOT films synthesized via self-inhibited polymerization: Roles of anions. NPG Asia Mater. 2017, 9, e405. [Google Scholar] [CrossRef]
  22. Yemata, T.A.; Zheng, Y.; Kyaw AK, K.; Wang, X.; Song, J.; Chin, W.S.; Xu, J. Modulation of the doping level of PEDOT:PSS film by treatment with hydrazine to improve the Seebeck coefficient. RSC Adv. 2020, 10, 1786–1792. [Google Scholar] [CrossRef] [PubMed]
  23. Tao, S.; Zhu, S.; Feng, T.; Xia, C.; Song, Y.; Yang, B. The polymeric characteristics and photoluminescence mechanism in polymer carbon dots: A review. Mater. Today Chem. 2017, 6, 13–25. [Google Scholar] [CrossRef]
  24. Xia, C.; Zhu, S.; Feng, T.; Yang, M.; Yang, B. Evolution and Synthesis of Carbon Dots: From Carbon Dots to Carbonized Polymer Dots. Adv. Sci. 2019, 6, 1901316. [Google Scholar] [CrossRef]
  25. Mondal, M.; Pramanik, S. A mechanism for excitation-dependent emission from carbon nanodots. Mater. Lett. X 2023, 18, 100195. [Google Scholar] [CrossRef]
Figure 1. Synthesis scheme of CDs.
Chemproc 16 00107 g001
Figure 2. On the left is an AFM image and particle profile; on the right is an FT-IR spectrum in KBr.
Chemproc 16 00107 g002
Figure 3. On the left are the absorption and emission (dotted lines) spectra at different excitation wavelengths of CDs in H2O under N2, and on the right are the absorption spectra of CDs in H2O in the 4 conditions.
Chemproc 16 00107 g003
Figure 4. On the left are the absorption and emission spectra at different excitation wavelengths of CDs in DMSO solution under N2, and on the right are the absorption spectra of CDs in DMSO in the 4 conditions.
Chemproc 16 00107 g004
Figure 5. Emission spectrum of (a) CDs in H2O in 4 conditions with 555 nm excitation and (b) of CDs in DMSO in 4 conditions with 540 nm excitation.
Chemproc 16 00107 g005
Table 1. PL QY of solutions (excitation at 565 nm).
N2 QY%O2 QY%O2 Hydrazine QY%N2 Hydrazine QY%
H2ODMSODMSODMSODMSO
1554453047
Disclaimer/Publisher’s Note: The statements, opinions and data contained in all publications are solely those of the individual author(s) and contributor(s) and not of MDPI and/or the editor(s). MDPI and/or the editor(s) disclaim responsibility for any injury to people or property resulting from any ideas, methods, instructions or products referred to in the content.

