1. Introduction
According to the World Health Organization, one in three adults worldwide has hypertension, defined as blood pressure ≥ 140/90 mmHg or use of antihypertensive medication. From 1990 to 2019, the number of hypertensive individuals doubled from 650 million to 1.3 billion. Hypertension was the leading cause of death in 2019, contributing to stroke, heart disease, kidney damage, and other complications [
1].
Diabetes, another major lifestyle-related disease, was the ninth leading cause of death in 2019. The International Diabetes Federation estimates that 643 million people will have diabetes by 2030 [
2]. Diabetes causes complications including neuropathy, retinopathy, kidney damage, and arteriosclerosis, increasing mortality from cardiovascular diseases. Diabetic retinopathy (DR) affects about 28% of diabetic patients [
3], often leading to blindness. While glycemic control is key to preventing DR, blood pressure management is also important. When diabetes coexists with hypertension, insulin resistance and blood pressure increase, accelerating arteriosclerosis and raising the risk of macrovascular diseases such as myocardial infarction and stroke [
4].
There is also the possibility of worsening conditions such as diabetic nephropathy and DR [
5,
6,
7]. Strict BP control in patients with type 2 diabetes reduces the risk of diabetes-related deaths and complications, progression of DR, and visual loss [
8]. In other words, controlling BP is useful for suppressing the onset and progression of DR in patients with type 2 diabetes. This is supported by reports that renin angiotensin system inhibitors, especially angiotensin-converting enzyme (ACE) inhibitors, reduce the risk of DR and increase the chance of recovery from DR in patients with diabetes [
9]. Nagai et al. (2007) reported that administration of the angiotensin II type 1 receptor blocker (ARB), telmisartan, suppressed retinal inflammation mediated by the NF-κB pathway—such as the expression of ICAM-1 and MCP-1—and inhibited the progression of DR in C57BL/6J mice with streptozotocin (STZ)-induced diabetes [
10]. However, the molecular biologic mechanism underlying the effectiveness of ACE inhibitors and ARBs against DR is unknown. Many unknowns also remain regarding the mechanism by which high BP adversely affects DR. Clarification of these should lead to the development of new therapeutic strategies for controlling DR in patients with existing diabetes and hypertension.
We have been involved in the development and experiments of diabetic animal models with the goal of elucidating the pathogenesis of diabetic eye complications and developing treatments.
Researchers at the Research Laboratories of Torii Pharmaceutical Co., Ltd. (Tokyo, Japan) identified a non-obese diabetic rat exhibiting polydipsia, polyphagia, polyuria, and glucosuria among inbred strains of normal Sprague-Dawley (SD) rats supplied by The Jackson Laboratory Japan, Inc. (formerly Charles River Laboratories Japan, Inc., Yokohama, Japan). By repeated inbreeding of these rats, a new non-obese type 2 diabetic model was established, known as the Spontaneously Diabetic Torii (SDT) rat. In male SDT rats, the onset of diabetes was observed at around 20 weeks of age and fasting and casual blood glucose levels reaching approximately 700 mg/dL. This strain also showed severe diabetic ocular complications [
11]. The SDT fatty rats in the current experiment are a new animal model of diabetes in which the leptin receptor mutation (Lepr^fa), an obesity gene of the Zucker fatty rat, was introduced into the genetic background of the SDT rats [
12]. In addition to hyperglycemia, SDT fatty rats are obese due to overeating caused by loss of leptin activity, and hyperlipidemia; these characteristics make them an animal model for diabetes that mimics patients with diabetes. Furthermore, this model is considered useful for elucidating the mechanisms underlying diabetic complications. In our previous study, DR developed in SDT fatty rats at 16 weeks of age, suggesting that DR develops earlier and is more severe in SDT fatty rats than SDT rats [
13]. Salt loading in SDT fatty rats was also reported to cause hypertension and progressive kidney damage, thus categorizing them as SDT fatty hypertension rats [
14]. However, no reports of DR occurring in SDT fatty hypertension rats have been published. We hypothesize that salt-induced hypertension promotes the onset and progression of DR in SDT fatty rats. Therefore, we loaded SDT fatty rats with 0.3% saline to evaluate the effect of hypertension on DR in SDT fatty rats and verify the possibility of creating a new animal model in which DR progresses due to hypertension caused by salt loading. This study followed the method of our previous study, Yoshiaki Tanaka et al. (2024) [
15].
2. Materials and Methods
2.1. Animals
Male SDT fatty rats and male SD rats were used in this study. The rats were obtained from CLEA Japan Inc. (Tokyo, Japan). These rats are bred and maintained as a closed colony at CLEA. The SD rat is a normal rat without diabetes and does not develop DR. Diabetes was diagnosed in all SDT fatty rats when their non-fasting blood glucose levels reached or exceeded 350 mg/dL. A standard rat diet (CRF-1, Oriental Yeast, Inc., Tokyo, Japan) was administered to all rats. The rats were kept in a cage with a maximum of two rats per cage, and the bedding was changed at least once every two days to reduce stress. The rats’ body temperature was also maintained at about 37 degrees Celsius due to the breeding environment. The care and handling of experimental animals was based on the animal experiment regulations of the Association for Research in Vision and Ophthalmology and Jichi Medical University (Jichi Medical University Animal Experiment Approval No. 20025-01). The experiment was carried out in the animal testing facility of Jichi Medical University Saitama Medical Center from 2021 to 2023.
The rats were first divided into three groups: SDT fatty rats received 0.3% saline from 8 weeks of age (salt SDT fatty group); SDT fatty rats received normal water without saline (SDT fatty control group); and SD rats received normal tap water and served as normal control animals (normal control group). Male SDT fatty rats born on the same day were assigned to two groups without applying specific selection criteria. Allocation was performed according to the order of visual identification in a non-systematic manner, with efforts made to minimize selection bias through operational randomization. Saline and normal tap water each were administered freely to the animals from a water bottle, and the 0.3% saline administration group was given only saline. If a rat died during the experiment, it was excluded from the experiment and analysis.
The number of animals used was determined based on the guidelines by Festing et al. (2002) and Charan et al. (2013), to ensure a statistically significant sample size of at least
n = 6 [
16,
17]. Due to the risk of mortality from continuous hyperglycemia, 8 rats per group were initially reared. However, some deaths occurred—3 salt SDT fatty rats and 2 SDT fatty rats—resulting in fewer than 6 salt SDT fatty rats. Therefore, 8 additional salt SDT fatty rats were reared in a second phase, where only one death occurred. Ultimately, data were collected from 12 salt SDT fatty rats, 6 SDT fatty rats, and 8 SD rats.
In a third phase, rats were reared for fluorescein angiography (FA) and transmission electron microscopy (TEM) analyses: 3 salt SDT fatty rats, 3 SDT fatty rats, and 2 SD rats for FA; 2 salt SDT fatty rats, 2 SDT fatty rats, and 1 SD rat for TEM. Due to deaths and sample preparation issues, analyses were performed using eye samples from 2 rats per group for FA and 1 rat per group for TEM.
In total, 21 salt SDT fatty rats, 13 SDT fatty rats, and 11 SD rats were used in the experiments.
Humane endpoints were established to minimize animal suffering during the study. If rats were found to be in a moribund state—such as having difficulty eating or drinking; exhibiting signs of distress (e.g., abnormal posture, prolonged recumbency, rapid breathing); showing persistent external abnormalities with no signs of recovery (e.g., diarrhea, ulcers, infections, rectal prolapse); experiencing rapid weight loss (≥20% within 7 days); a drop in body temperature; central nervous system symptoms (e.g., convulsions or paralysis); a significant increase in tumor size (tumor diameter ≥ 40 mm in rats); or a lack of response to external stimuli—euthanasia was performed via intraperitoneal administration of pentobarbital at a dose of 135 mg/kg body weight.
2.2. Measurement of Body Weight, Food Consumption, BP, Blood Glucose, and Hemoglobin (HbA1c) Levels
Body weight, food consumption, and blood glucose levels were recorded every two weeks, while blood pressure (BP) and HbA1c levels were assessed every four weeks between weeks 8 and 24 for each rat group. Food consumption was determined by subtracting the amount of uneaten food from the amount initially provided. BP was measured non-invasively at the tail using a BP monitoring device designed for rodents (BP-98AL, Softron, Suginami-ku, Tokyo, Japan). Blood samples were collected from the tail veins of rats in a non-fasted state. Blood glucose and HbA1c levels were measured using a commercially available glucose/ketone meter (StatStrip Xpress, Nova Biomedical, Waltham, MA, USA) and an automated clinical analyzer (Hitachi 7170, Hitachi High-Tech Corporation, Tokyo, Japan), respectively.
2.3. Electroretinography (ERG)
At 8 weeks of age, an agent that contained three anesthetics (Domitor 0.375 mg/kg, midazolam 2 mg/kg, Vetrufal 2.5 mg/kg) was administered intraperitoneally at 5 mL/kg/rat body weight, and the ERG was measured with the animals under sufficient anesthesia.
ERG measurements are performed using an ERG instrument for animal experiments (PuREC, Mayo Corporation, Aichi, Japan) and analysis was performed using the built-in application. We quantitatively analyzed the latency and potential of the a-wave (derived from the retinal photoreceptor cells), b-wave (retinal bipolar cells, Müller cells), and the OP wave (derived from the inner retinal neural network) obtained by ERG. After the measurement, 0.75 mg/kg of Antisedan (Nippon Zenyaku Kogyo Co., Ltd., Fukushima, Japan) was administered intraperitoneally to facilitate the awakening of the animals. The ERG was repeated at 24 weeks of age.
2.4. Measurement of Blood Chemistry Parameters
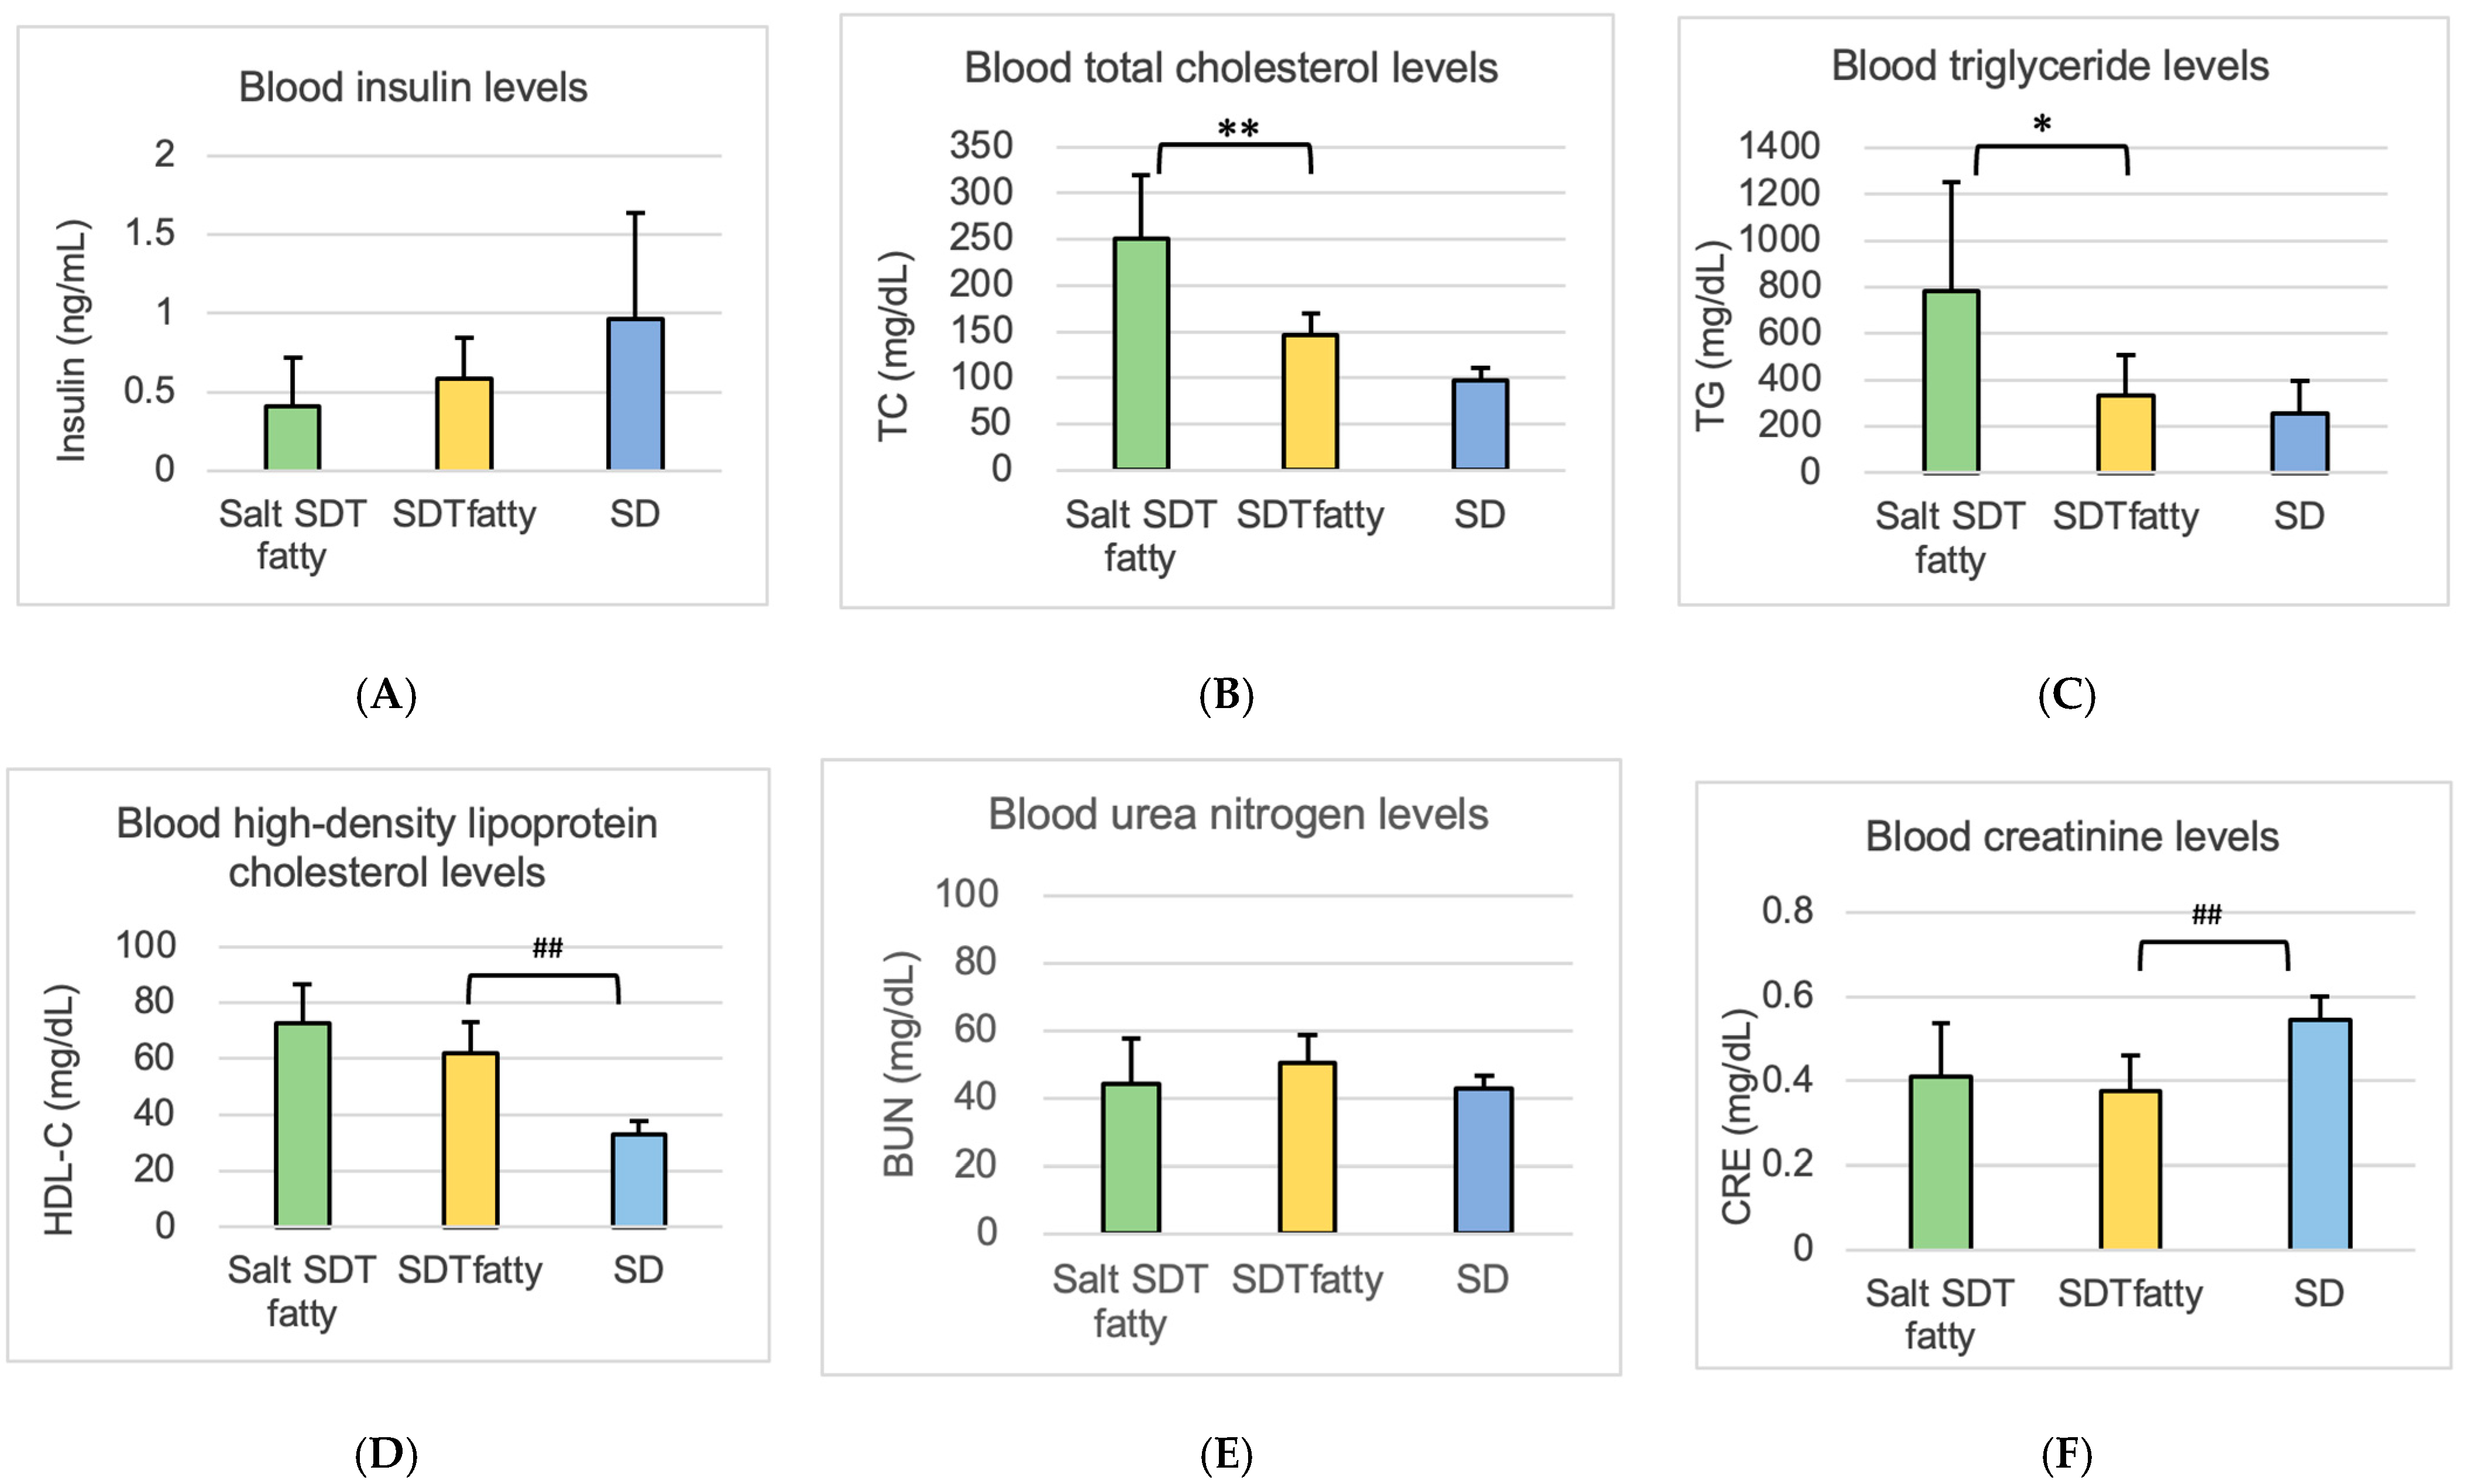
After the ERG at 24 weeks of age, a midline laparotomy was performed with the animals under sufficient anesthesia, and blood was collected from the abdominal aorta. We measured glucose, HbA1c, insulin for diabetes evaluation, and triglycerides (TG), total cholesterol (TC), and high-density lipoprotein cholesterol (HDL-C) for lipid evaluation. We measured the blood urea nitrogen (BUN), creatinine (CRE) for renal function evaluation, and aspartate transaminase (AST), alanine transaminase (ALT), and γ-glutamyl transpeptidase (γ-GTP) for liver function.
2.5. Ocular Histopathology
After ERG at 24 weeks of age, the animals were bled without awakening and euthanized. No rats awakened after the start of anesthesia until euthanasia. The eyes then were enucleated. One of the enucleated eyes was immediately fixed with fixative (Super Fix, KY-500, Kurabo, Japan) to prepare an eye specimen. The fixed eyes were washed with 0.1% mol/L cacodylate buffer and embedded in paraffin; 4 μm sections were prepared from the paraffin blocks by microtome and stained with hematoxylin and eosin (HE).
2.6. Measurement of Retinal Thickness and Retinal Folds
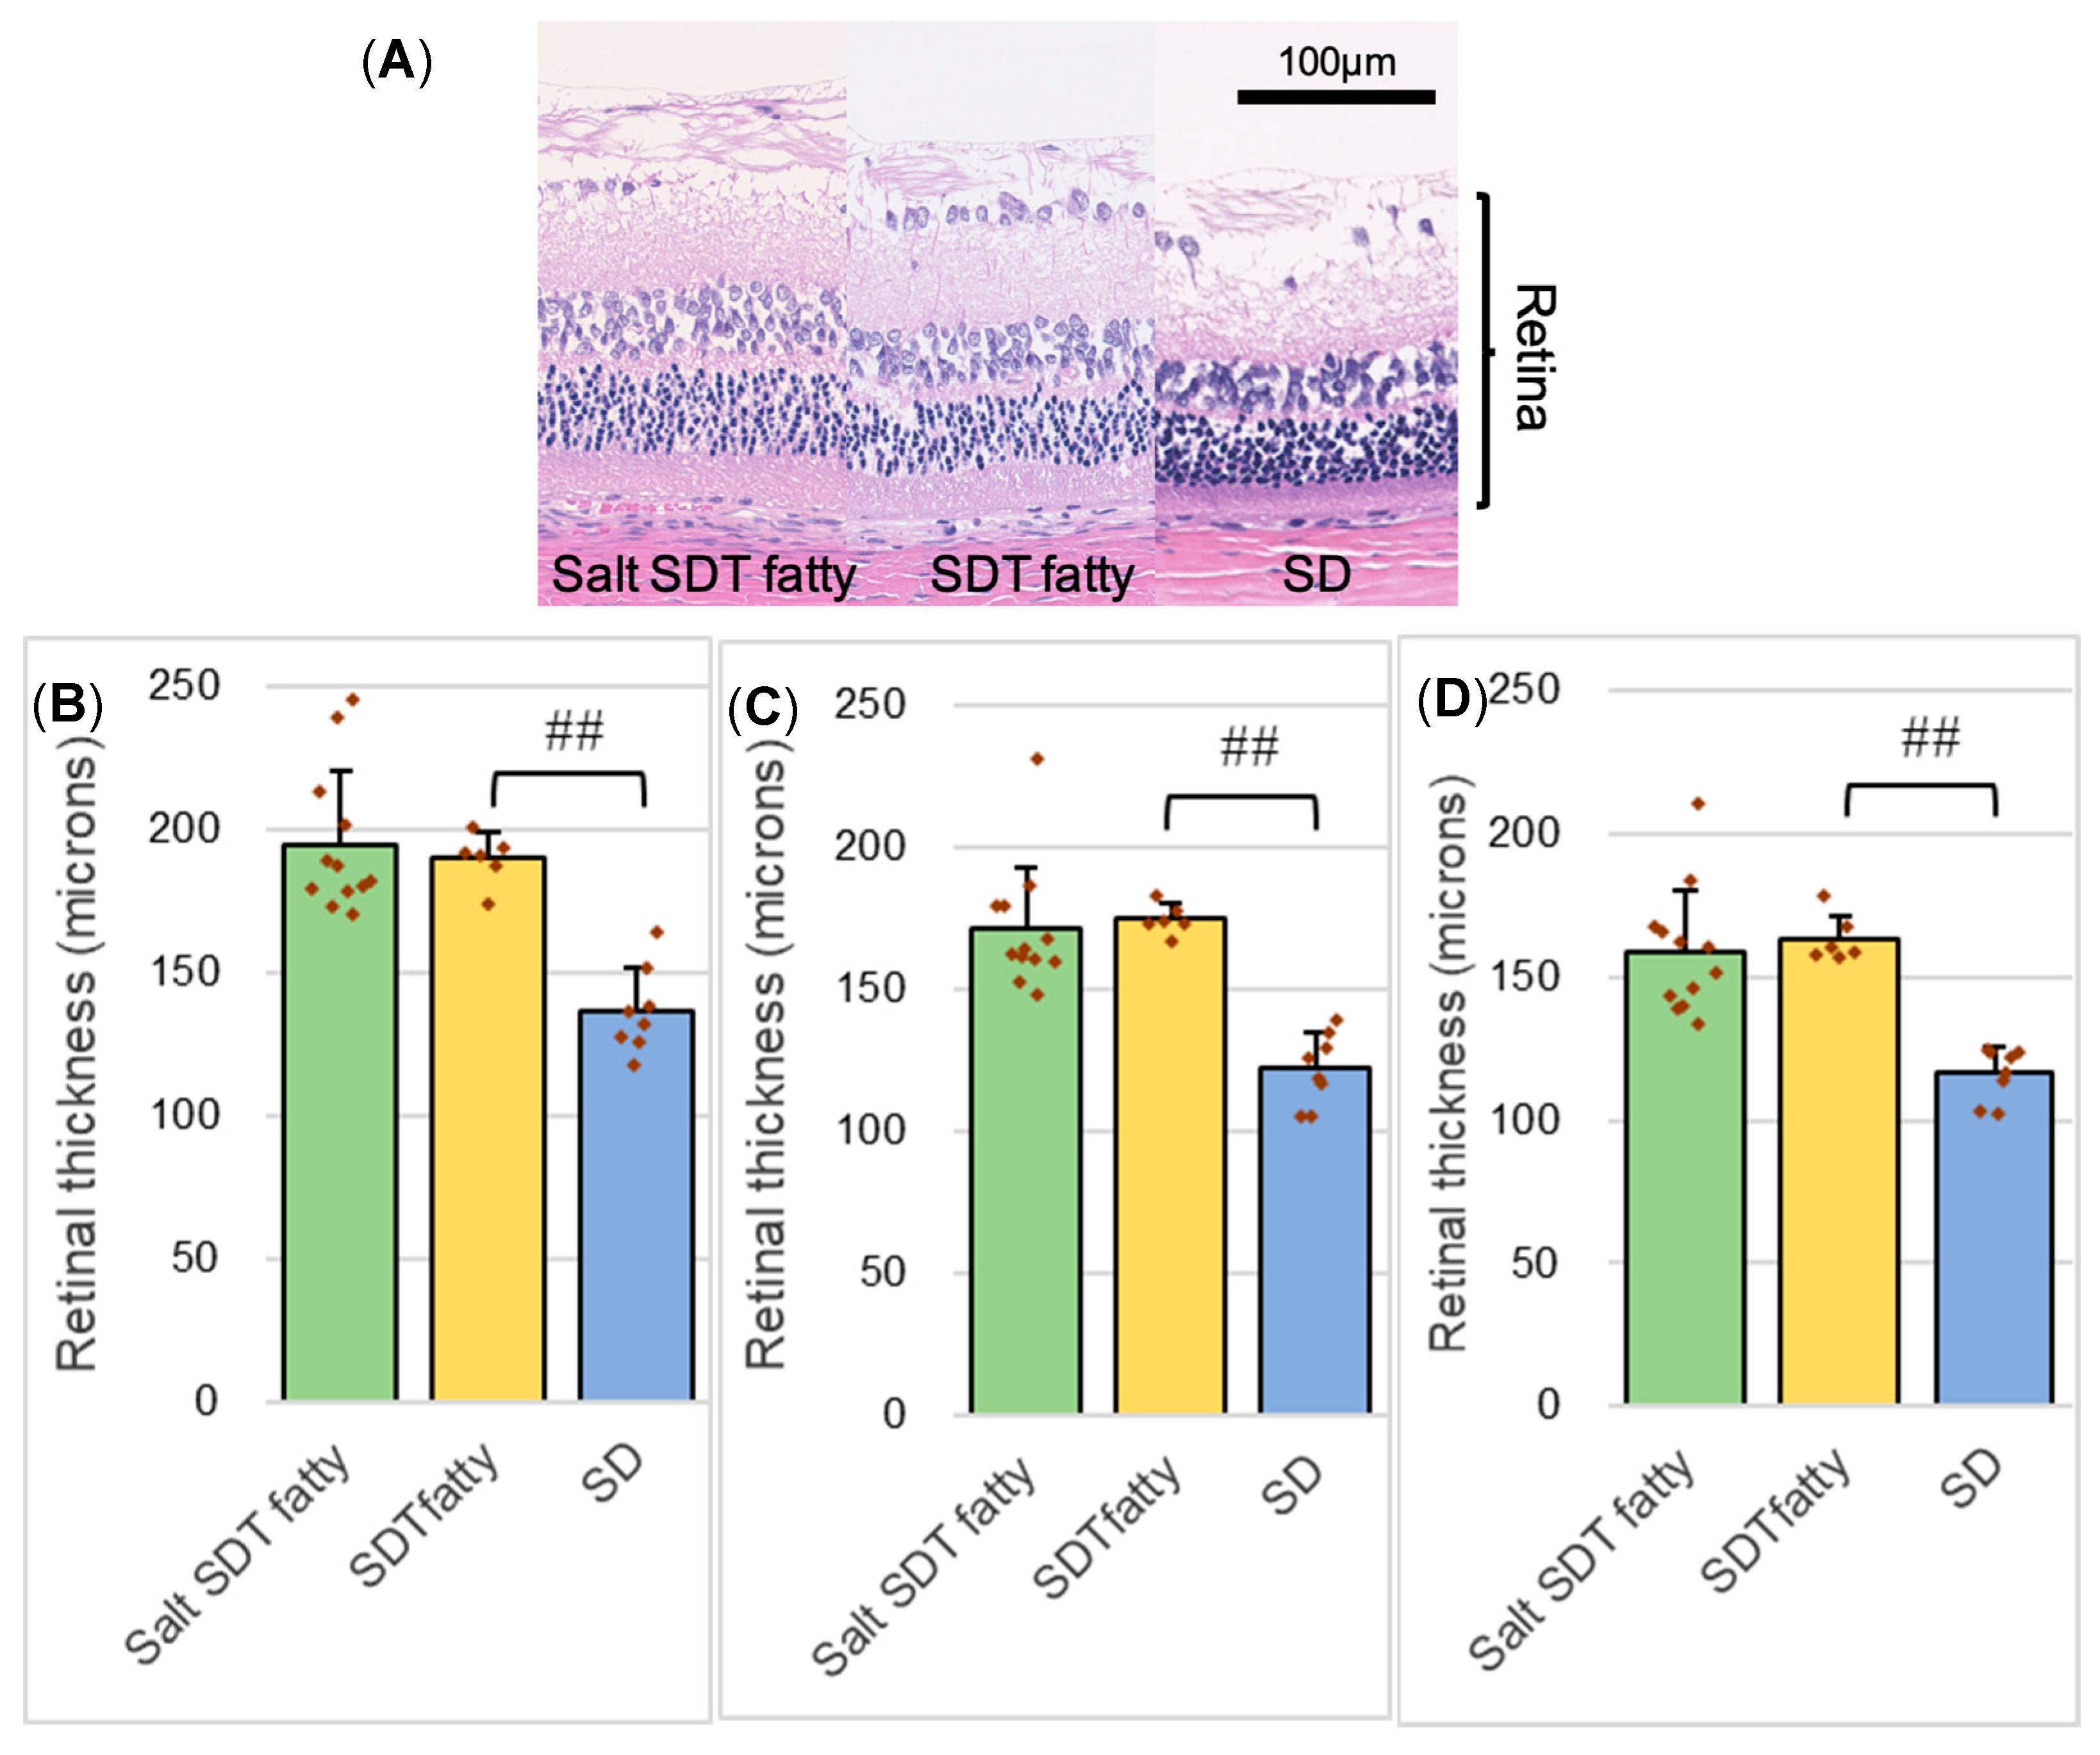
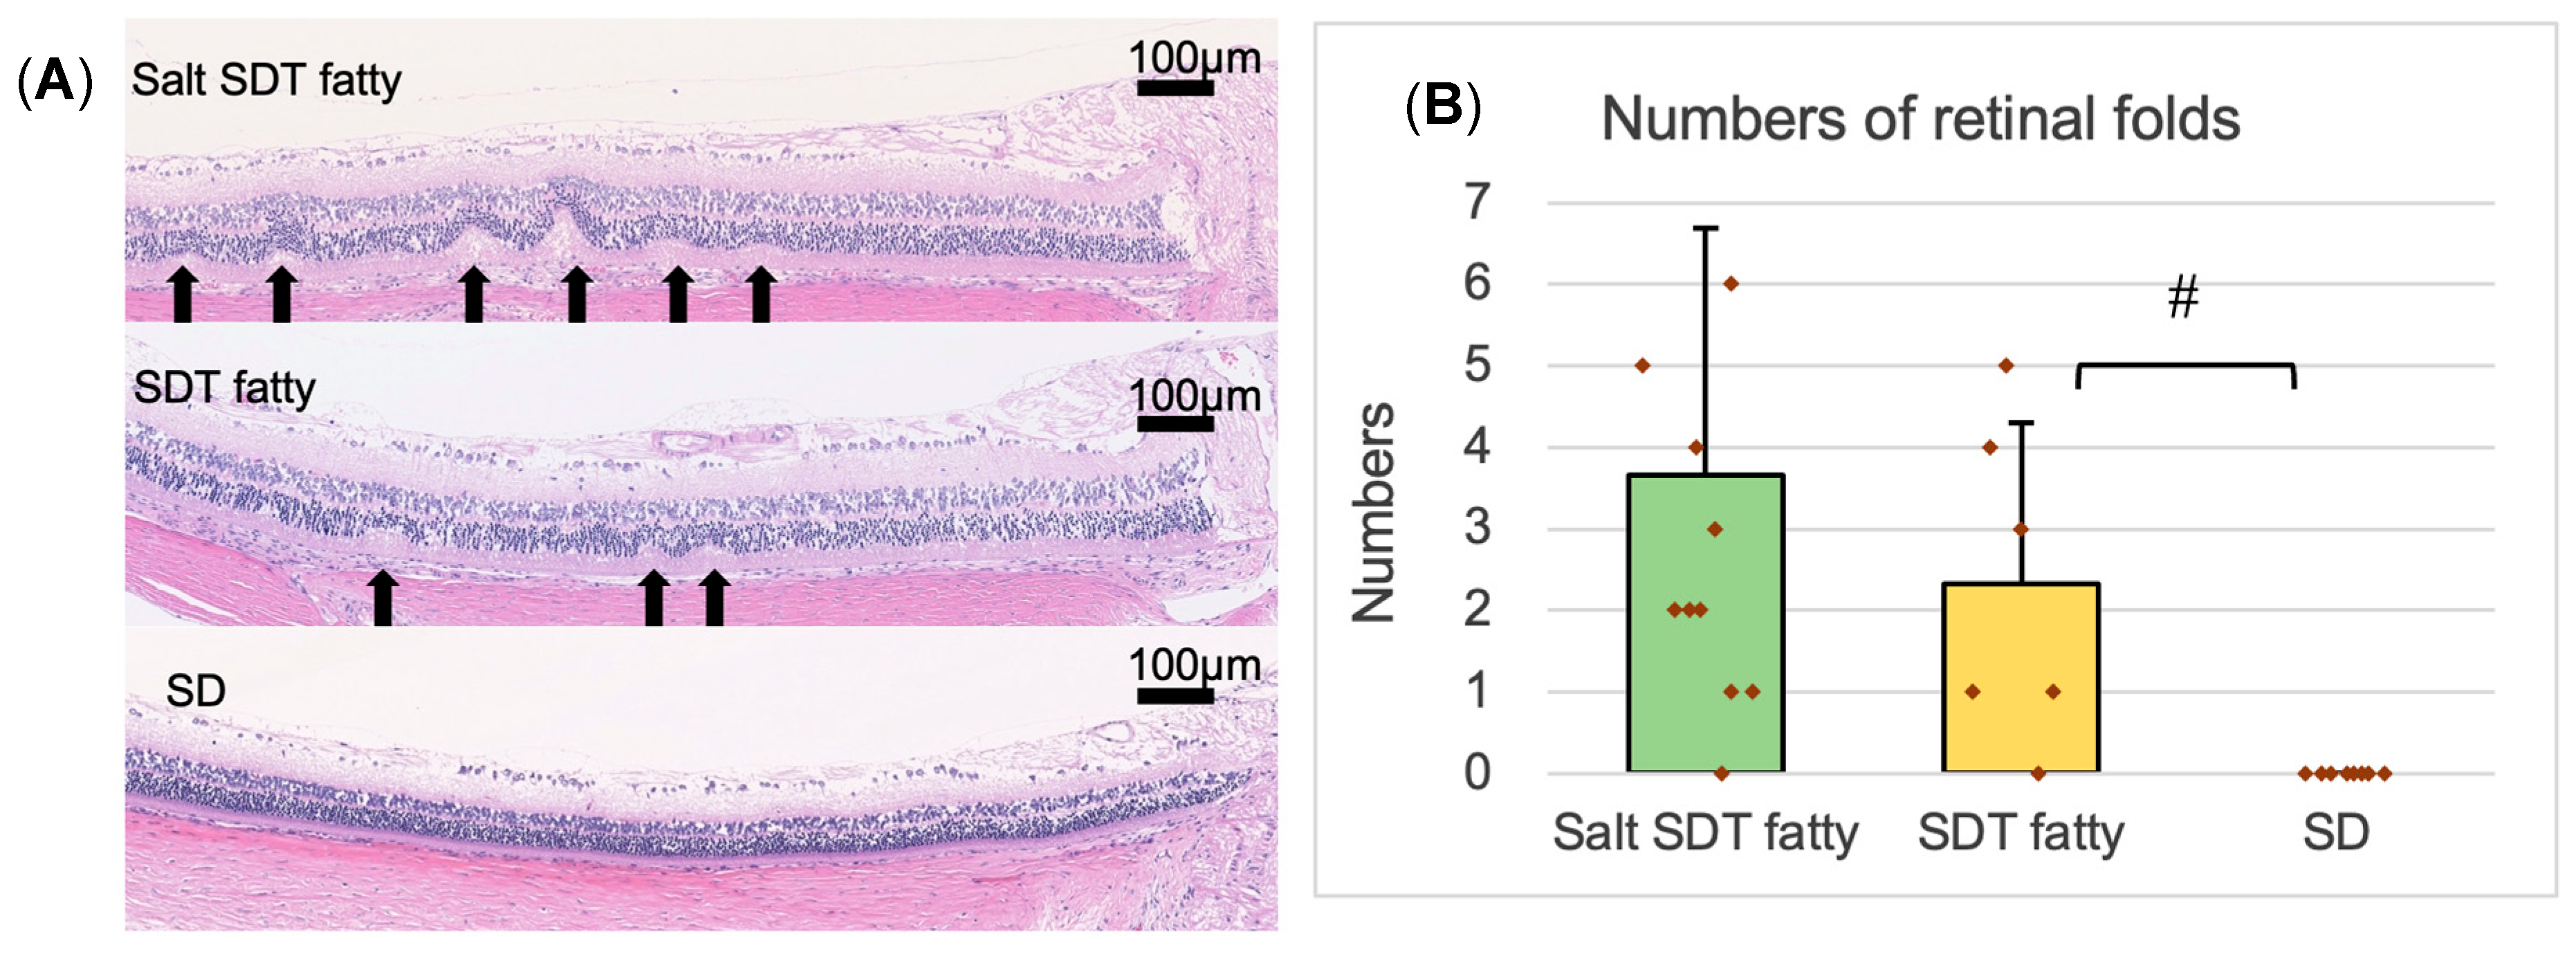
The specimen was used to measure the retinal thickness and the number of outer retinal folds. The 4 μm eye section specimen was observed using the BZ-X700 digital microscope system (Keyence Corp., Osaka, Japan), and images were recorded using the included digital camera and software (BZ-H3XD, Keyence, Osaka, Japan) and downloaded. Using the downloaded HE-stained specimen images, the retinal thicknesses and the number of retinal folds in the outer retinal layer were measured and compared quantitatively. Retinal thickness was measured at distances of 500, 1000, and 1500 μm from the optic disc in each sample. Retinal folds—identified as structural distortions spanning from the outer nuclear layer (ONL) to the plexiform layer—were counted within 1500 μm of the optic disc.
2.7. Transmission Electron Microscopy (TEM)
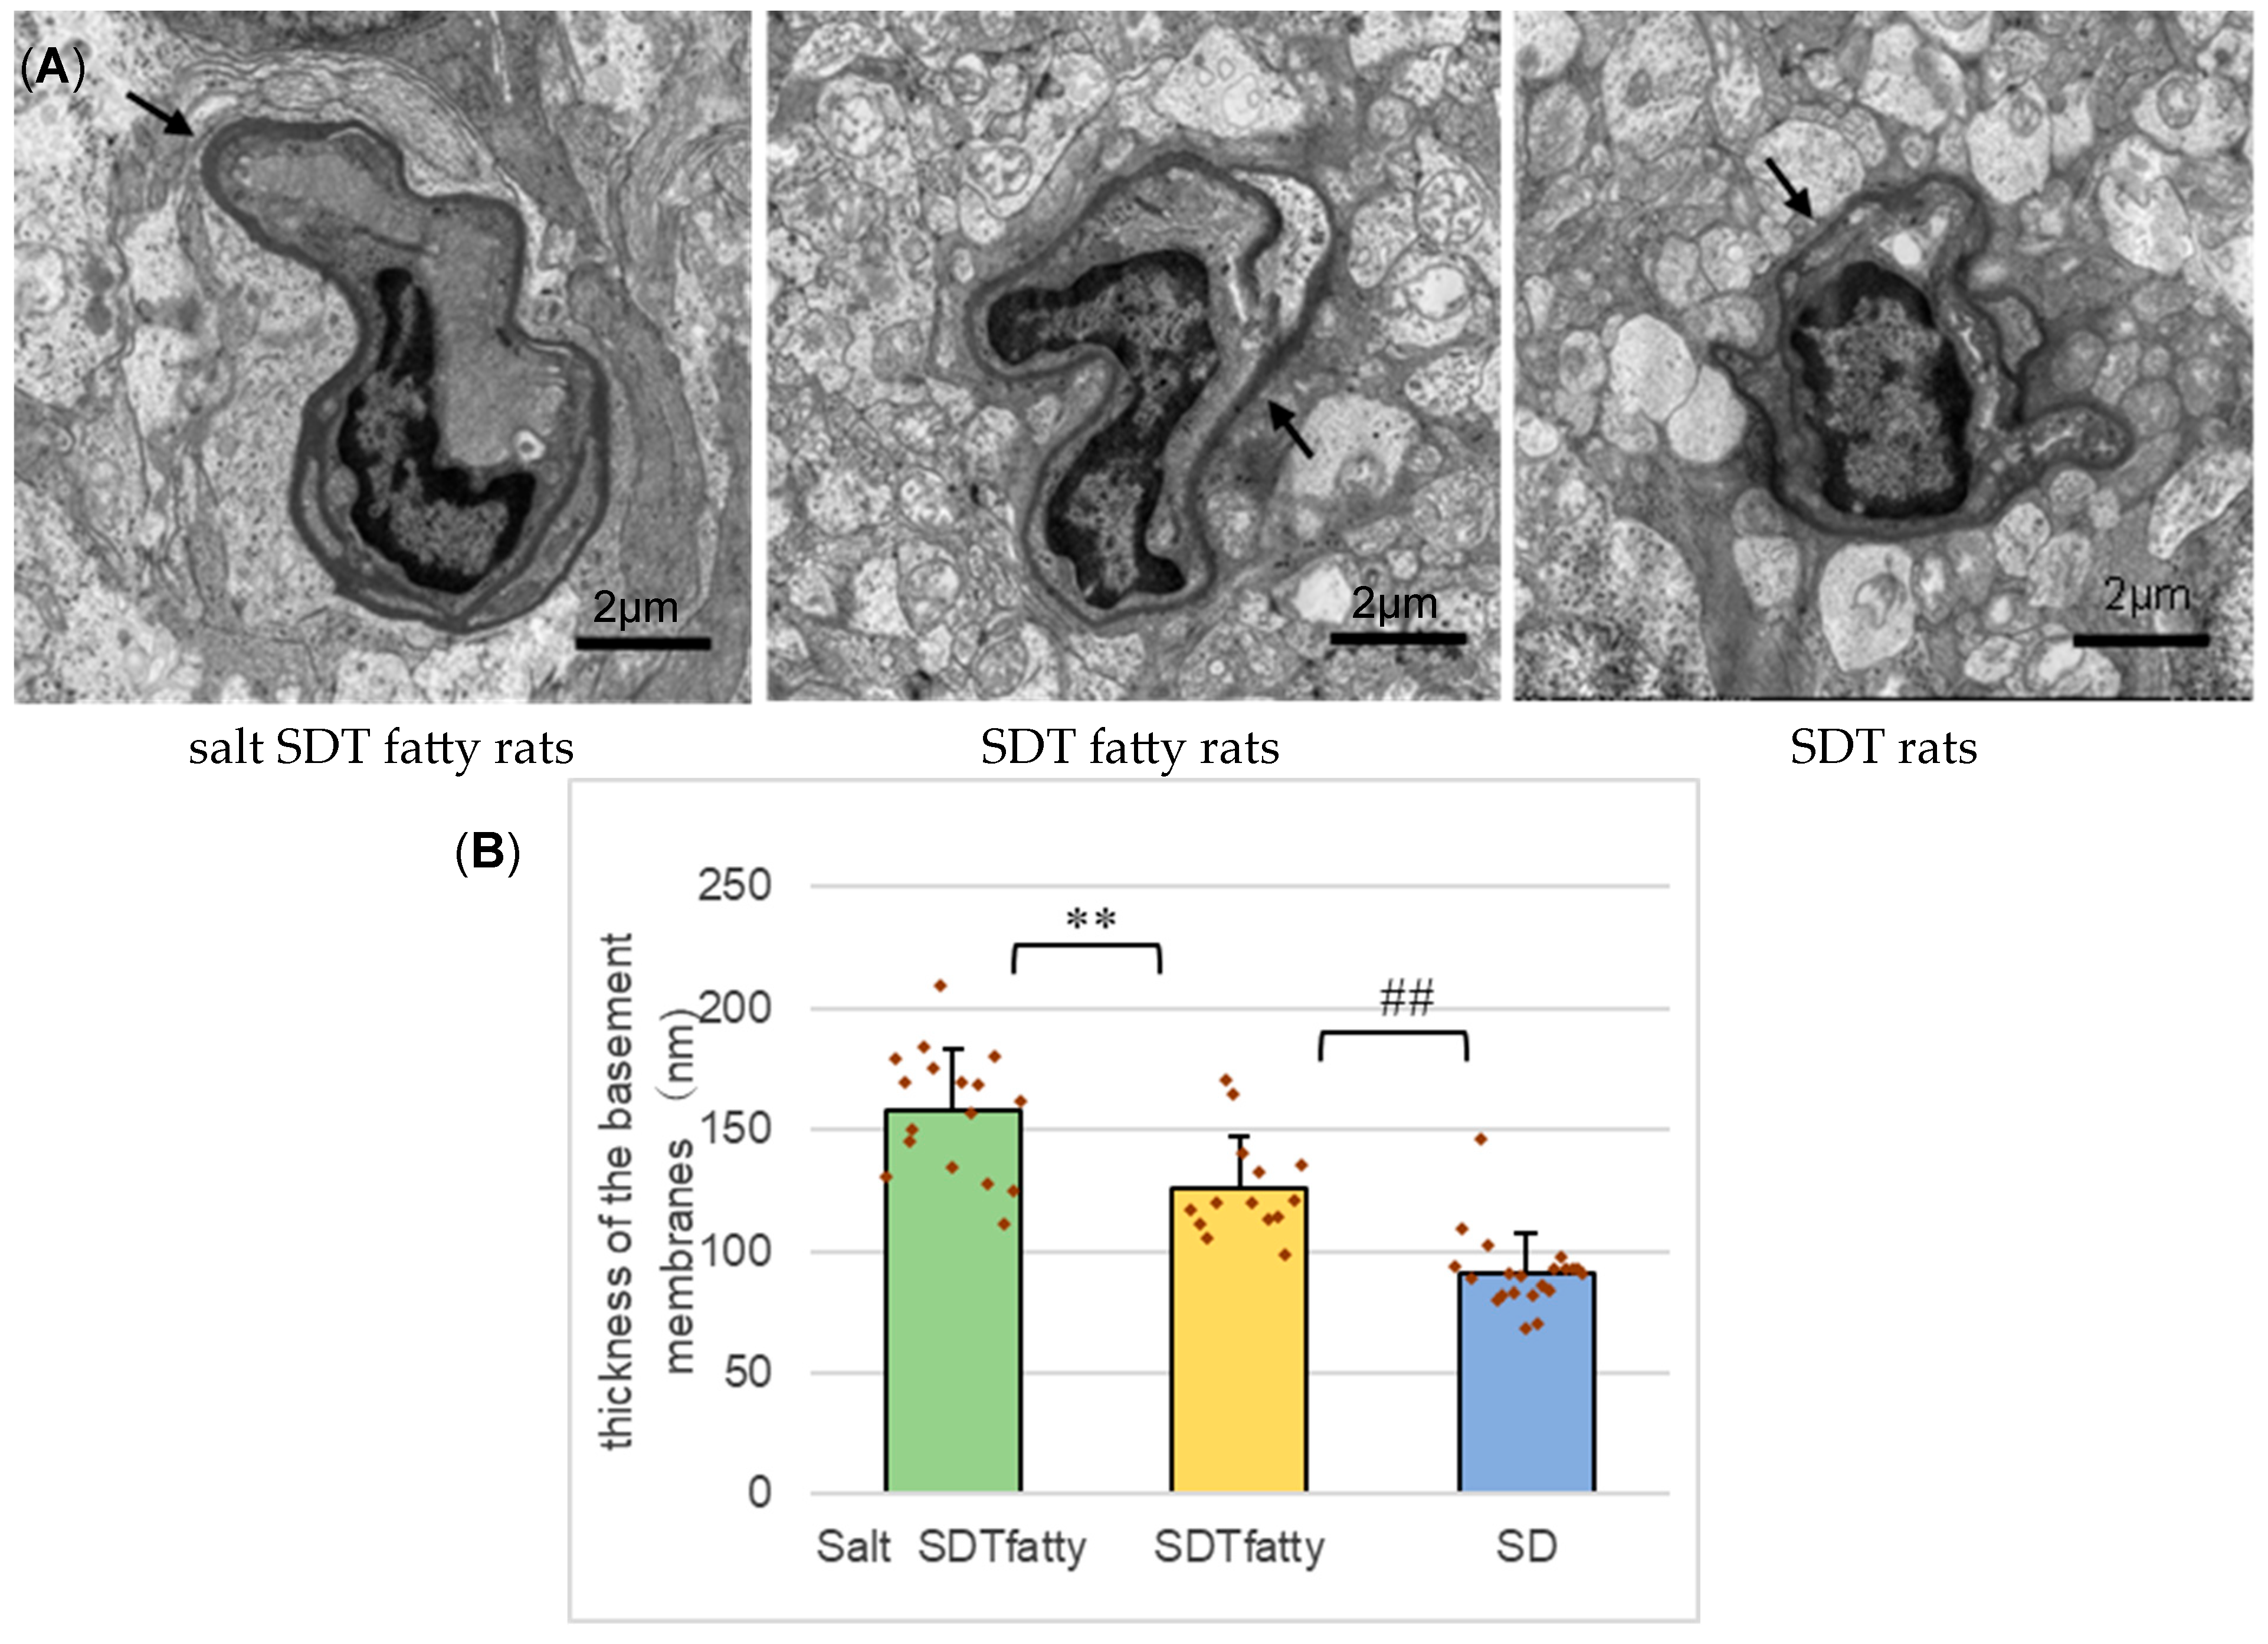
One rat in each of the three groups (total 3 rats) was raised under the same water supply conditions for 24 weeks. After euthanasia, the eyes were fixed with 2% paraformaldehyde (PFA), 2% glutaraldehyde (GA) in 0.1 M cacodylate buffer (pH 7.4) and sent to Tokai Electron Microscope Analysis (Tokai Electron Microscopy, Inc., Aichi, Japan) for post-fixation and resin embedding. Using the resin-embedded blocks prepared there, ultrathin sections for TEM were prepared, stained using 2% uranyl acetate and Reynolds’ solution and imaged with HT-7700 (Hitachi, Tokyo, Japan) at the Morphology Research Collaborative System, Jichi Medical University. The target was the retinal capillaries within a range from 500 to 1000 μm from the optic disc. The electron microscopic images were used to compare the thicknesses of the basement membranes (BM) of the retinal capillaries. The method for measuring the thickness of the BM was based on previous publications [
18,
19]. A grid of lines 2 μm apart was superimposed over each capillary image. The minimal distance across the BM was measured at each intersection point between the BM and a grid line. In specimens in which the BM was doubled due to the cutting angle, the outermost BM was measured. Using these values, the average BM thickness for each capillary was determined.
2.8. Fluorescein Angiography (FA)
Two rats in each of the three groups (total 8 rats) were raised under the same water supply conditions, and the retinal blood vessels were evaluated using fluorescence microscopy. At 24 weeks of age with the animals under sufficient anesthesia, a midline laparotomy was performed, blood was removed from the abdominal aorta with a syringe, fluorescein was injected into the left ventricle, and cardiac massage was performed. This allows the fluorescent contrast agent to be distributed throughout the retina. Thereafter, the eyes were enucleated after euthanasia. A retinal flat mount was made from the eyes, and fluorescence photography was performed to observe the retinal blood vessels.
2.9. Statistical Analysis
Statistical analyses were performed using GraphPad Prism 9 (GraphPad Software, San Diego, CA, USA). We analyzed data using the Dunnett test except for the number of retina folds, which was analyzed using Dunn’s test. A p-value of less than 0.05 was considered statistically significant. Assumptions of the statistical tests were considered to be sufficiently met based on data distribution and experimental design.
4. Discussion
In this study, SDT fatty rats were given 0.3% saline to investigate the impact of hypertension on DR. It was important to choose a saline concentration that would elevate BP without significantly lowering blood glucose compared to controls. Previous studies of SDT fatty rat guided this choice: Katsuda et al. reported that 1% saline induced marked hypertension but also significantly suppressed hyperglycemia [
14]; Shinozaki et al. (2022) showed that saline loading at concentrations of 0.3%, 0.6%, and 0.8% worsened kidney damage in a dose-dependent manner and lowered blood glucose [
20]; Teoh et al. (2021) found that 0.3% saline caused mild hypertension while maintaining hyperglycemia [
21]. Based on these findings, we determined that 0.3% saline concentration was optimal for elevating blood pressure without significantly lowering blood glucose levels and thus selected it for this study. Consistent with earlier reports, 0.3% saline loading similarly induced hypertension and modestly suppressed hyperglycemia. This decrease in blood glucose levels may be associated with an increase in plasma osmolality and circulating blood volume, as well as alterations in renal function. An elevation in plasma osmolality leads to an expansion of circulating blood volume, which could enhance the efficiency of insulin delivery to peripheral tissues. As a result, insulin sensitivity may be transiently improved, promoting glucose uptake into tissues even without changes in insulin secretion, thereby contributing to the reduction in blood glucose levels. Furthermore, as approximately 45% of total gluconeogenesis occurs in the kidney [
22], it is suggested that the kidney plays a significant role in endogenous glucose production. Changes in renal blood flow or glomerular filtration rate (GFR) may influence renal metabolic activity, potentially leading to the suppression of gluconeogenesis. However, the exact mechanism remains unclear. Importantly, blood glucose remained elevated, and blood pressure increased sufficiently, confirming that 0.3% saline is an appropriate concentration for establishing a hypertensive DR model in SDT fatty rats.
ERG demonstrated a reduction in the amplitude of the OP1 wave and an increase in the latency of the OP3, OP4, and OPΣ waves. The OP waves are considered particularly sensitive to disturbances in retinal circulation and are thus regarded as valuable indicators for evaluating diabetic eye function [
23]. DR is characterized by a decrease in OP waves amplitude and a prolongation of OP waves latency [
23,
24,
25]. Barber (2003) proposed that DR should be considered a neurodegenerative disease of the retina, reporting that early neuronal cell death and thinning of the photoreceptor and ganglion cell layers can occur prior to the appearance of microvascular lesions [
26]. This has led to the hypothesis that functional changes observed in the ERG may precede overt vascular pathology in DR. In studies using STZ-induced diabetic rats, Sakai et al. (1995) demonstrated that reductions in the amplitude of Ops and prolongation of peak times were already detectable as early as 2 to 3 weeks after diabetes onset. These changes became more pronounced by 6 weeks post-induction [
27]. Various other studies, including those by Ciprés et al. (2022), Ratra et al. (2021), and Simó et al. (2018) have also reported that retinal neurofunctional impairment progresses prior to the onset of microvascular damage [
28,
29,
30]. Therefore, functional assessment using ERG is considered a useful indicator for the early diagnosis of DR. Furthermore, these findings support the notion that DR is not merely a vascular disorder but also has characteristics of a neurodegenerative disease. In this study, the salt SDT fatty group exhibited reduced OP wave amplitudes and prolonged OP wave latencies in comparison with the SDT fatty group. In other words, this result can be considered to indicate that DR is progressing due to saline loading.
DR was traditionally regarded as a “microvascular disease.” However, it is now considered a “neurovascular disease” that involves both vascular lesions and neurodegeneration. Hypertension is known to induce both neuronal and vascular damage in the retina. In spontaneously hypertensive rats, retinal changes such as arteriole narrowing and thinning of the outer retinal layers have been observed, indicating the involvement of both vascular and neuronal components [
31]. Moreover, in rat models with both hypertension and diabetes, neuronal damage—such as Müller glial activation and increased oxidative stress—was found to occur alongside vascular impairments, including breakdown of the blood retinal barrier [
32]. These findings suggest that hypertension contributes to the progression of DR through both neuronal and vascular pathways.
DR in humans is thought to be primarily caused by vasculopathy. In this scenario, retinal thickening, likely due to retinal edema, is observed, but retinal folds are not observed. On the other hand, DR in SDT fatty rats is considered to be caused not only by edema due to inflammation and vascular damage but also by neurodegeneration, including glial proliferation. Retinal folds like those observed in this study have also been reported in uveitis models [
33] and are likely attributable to volumetric changes caused by edema or inflammation. Alternatively, it has been suggested that proliferation of glial cells between existing retinal cells leads to an increase in retinal volume, resulting in retinal thickening and folding [
13]. However, to date, definitive evidence to support these hypotheses has not been established. No significant differences were seen in retinal thickening or the numbers of retinal folds, which can appear with worsening DR, with saline loading. We consider that this may be due to the increased plasma osmolality caused by salt loading, which draws interstitial fluid into the blood vessels, thus making it less likely that retinal edema would occur. However, we cannot be certain because the plasma osmolality was not measured in the current study.
The insulin levels observed in this study differ somewhat from those reported in previous publications on SDT fatty rats [
12]. The animals used were maintained under the care of CLEA Japan, Inc., and exhibited characteristic phenotypes such as hyperphagia, increased body weight, hyperglycemia, and hyperlipidemia. According to analyses conducted by the supplier, the presence of the Lepr^fa allele has been confirmed; thus, additional genotyping was not performed in this study. Nevertheless, it is acknowledged that subtle genetic variations can accumulate over time, even in inbred strains, potentially contributing to phenotypic variability, including differences in insulin levels. The observed reduction in insulin levels may be attributable to pancreatic β-cell dysfunction secondary to prolonged hyperglycemia, although the precise mechanisms remain unclear.
In light of these considerations, the variability in insulin levels and the lack of in-house genotyping represent limitations of this study. However, these factors are unlikely to undermine the main conclusion that salt loading-induced hypertension exacerbates diabetic retinopathy (DR). Future studies should incorporate more comprehensive genetic analyses and detailed hormonal profiling to further substantiate and expand upon these findings.
Electron microscopy revealed a tendency for the BM of retinal capillaries to be thicker in the SDT fatty group compared to the SD group, with a further increase observed in the salt SDT fatty group. BM thickening is considered to result from increased synthesis and decreased degradation of its components, as well as plasma protein deposition [
34]. Notably, BM thickening in retinal capillaries precedes the appearance of microaneurysms, the earliest clinical signs of DR, and key pathological markers of its progression [
35,
36]. The observed tendency for BM thickening with salt loading suggests a worsening of DR. However, due to the small number of samples in this study, further investigation with a larger sample size is warranted.
DR in FA images features retinal microaneurysms, increased vascular permeability, and non-perfusion areas. Due to the difficulty of creating flat mounts, there are many uncertainties, but vascular permeability and non-perfusion areas appeared to increase in both the SDT fatty groups compared to the SD group. Although the effects of saline loading did not appear to significantly exacerbate these changes, further investigation using a larger sample size is needed to re-evaluate this point.
Even though no marked differences were detected in retinal thickness or the number of folds, the decreased amplitude and prolonged latency of the OP waves in the ERG, along with thickening of the basement membrane of the retinal capillaries as observed by electron microscopy, were considered indicative of DR progression. The pathological progression of human DR occurs in the following order: BM thickening of the retinal capillaries, degeneration of pericytes, development of ghost vessels, ischemia, and development of new blood vessels [
34,
37]. In the present study, SDT fatty rats, a model in which DR is predominantly driven by neurodegenerative mechanisms, were subjected to saline loading to induce hypertension. This intervention imposed additional vascular and neuronal stress, under which a tendency toward thickening of the retinal capillary BM was observed. The progression of DR observed in salt SDT fatty rats was considered to resemble that seen in human DR. In other words, we believe that we can create a new DR rat model that is closer to human DR, in which progression is due to hypertension. Of course, it is necessary to examine methods such as the enzyme-linked immunosorbent assay test and immunostaining to evaluate cytokines and vascular permeability markers. Furthermore, to improve the accuracy of the present findings, it is necessary to determine whether the observed effects are due to salt loading induced hypertension or obesity-related factors by applying salt loading to SDT rats (non-obese diabetic rat). It is also important to evaluate the direct effects of salt loading itself in SD rats. Additional studies are required to clarify these effects. In the future, this new rat model of DR with hypertension may be used to research new treatments and drugs to prevent the onset and progression of DR.


