
Non-Invasive Multiclass Diabetes Classification Using Breath Biomarkers and Machine Learning with Explainable AI

 ,
,  ,
,  ,
,  ,
,  ,
,  and
and 
Abstract
1. Introduction
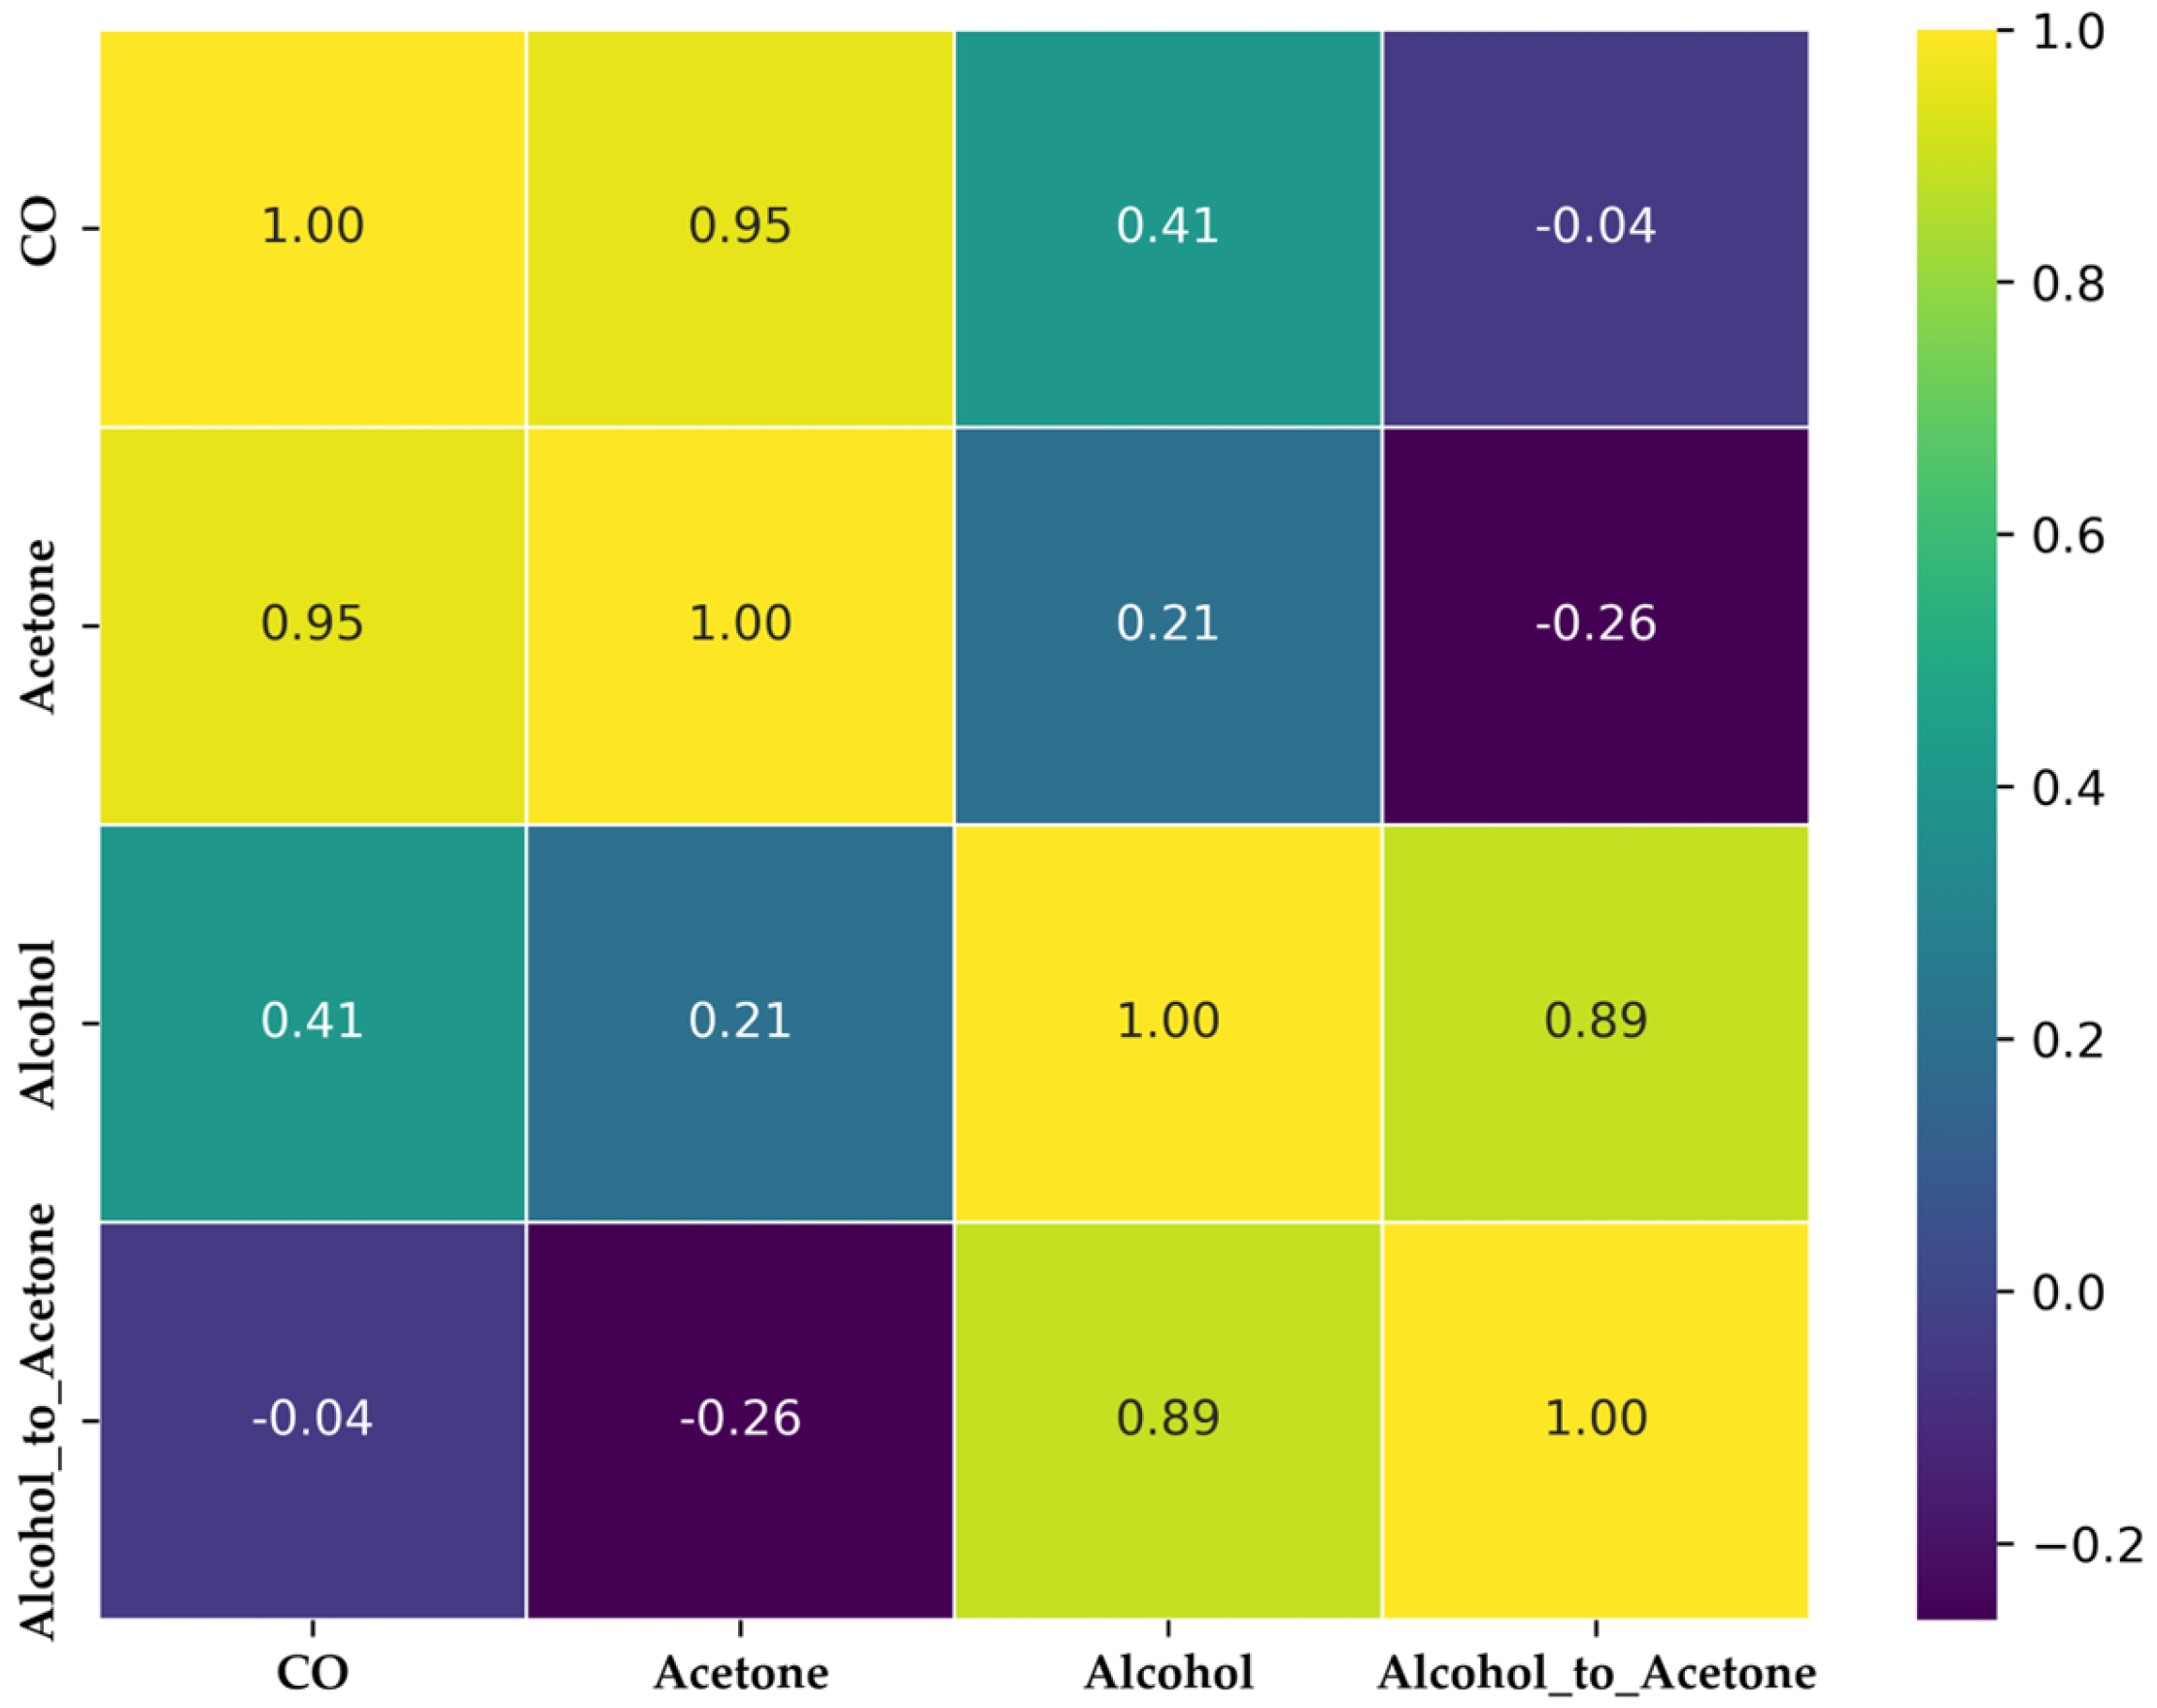
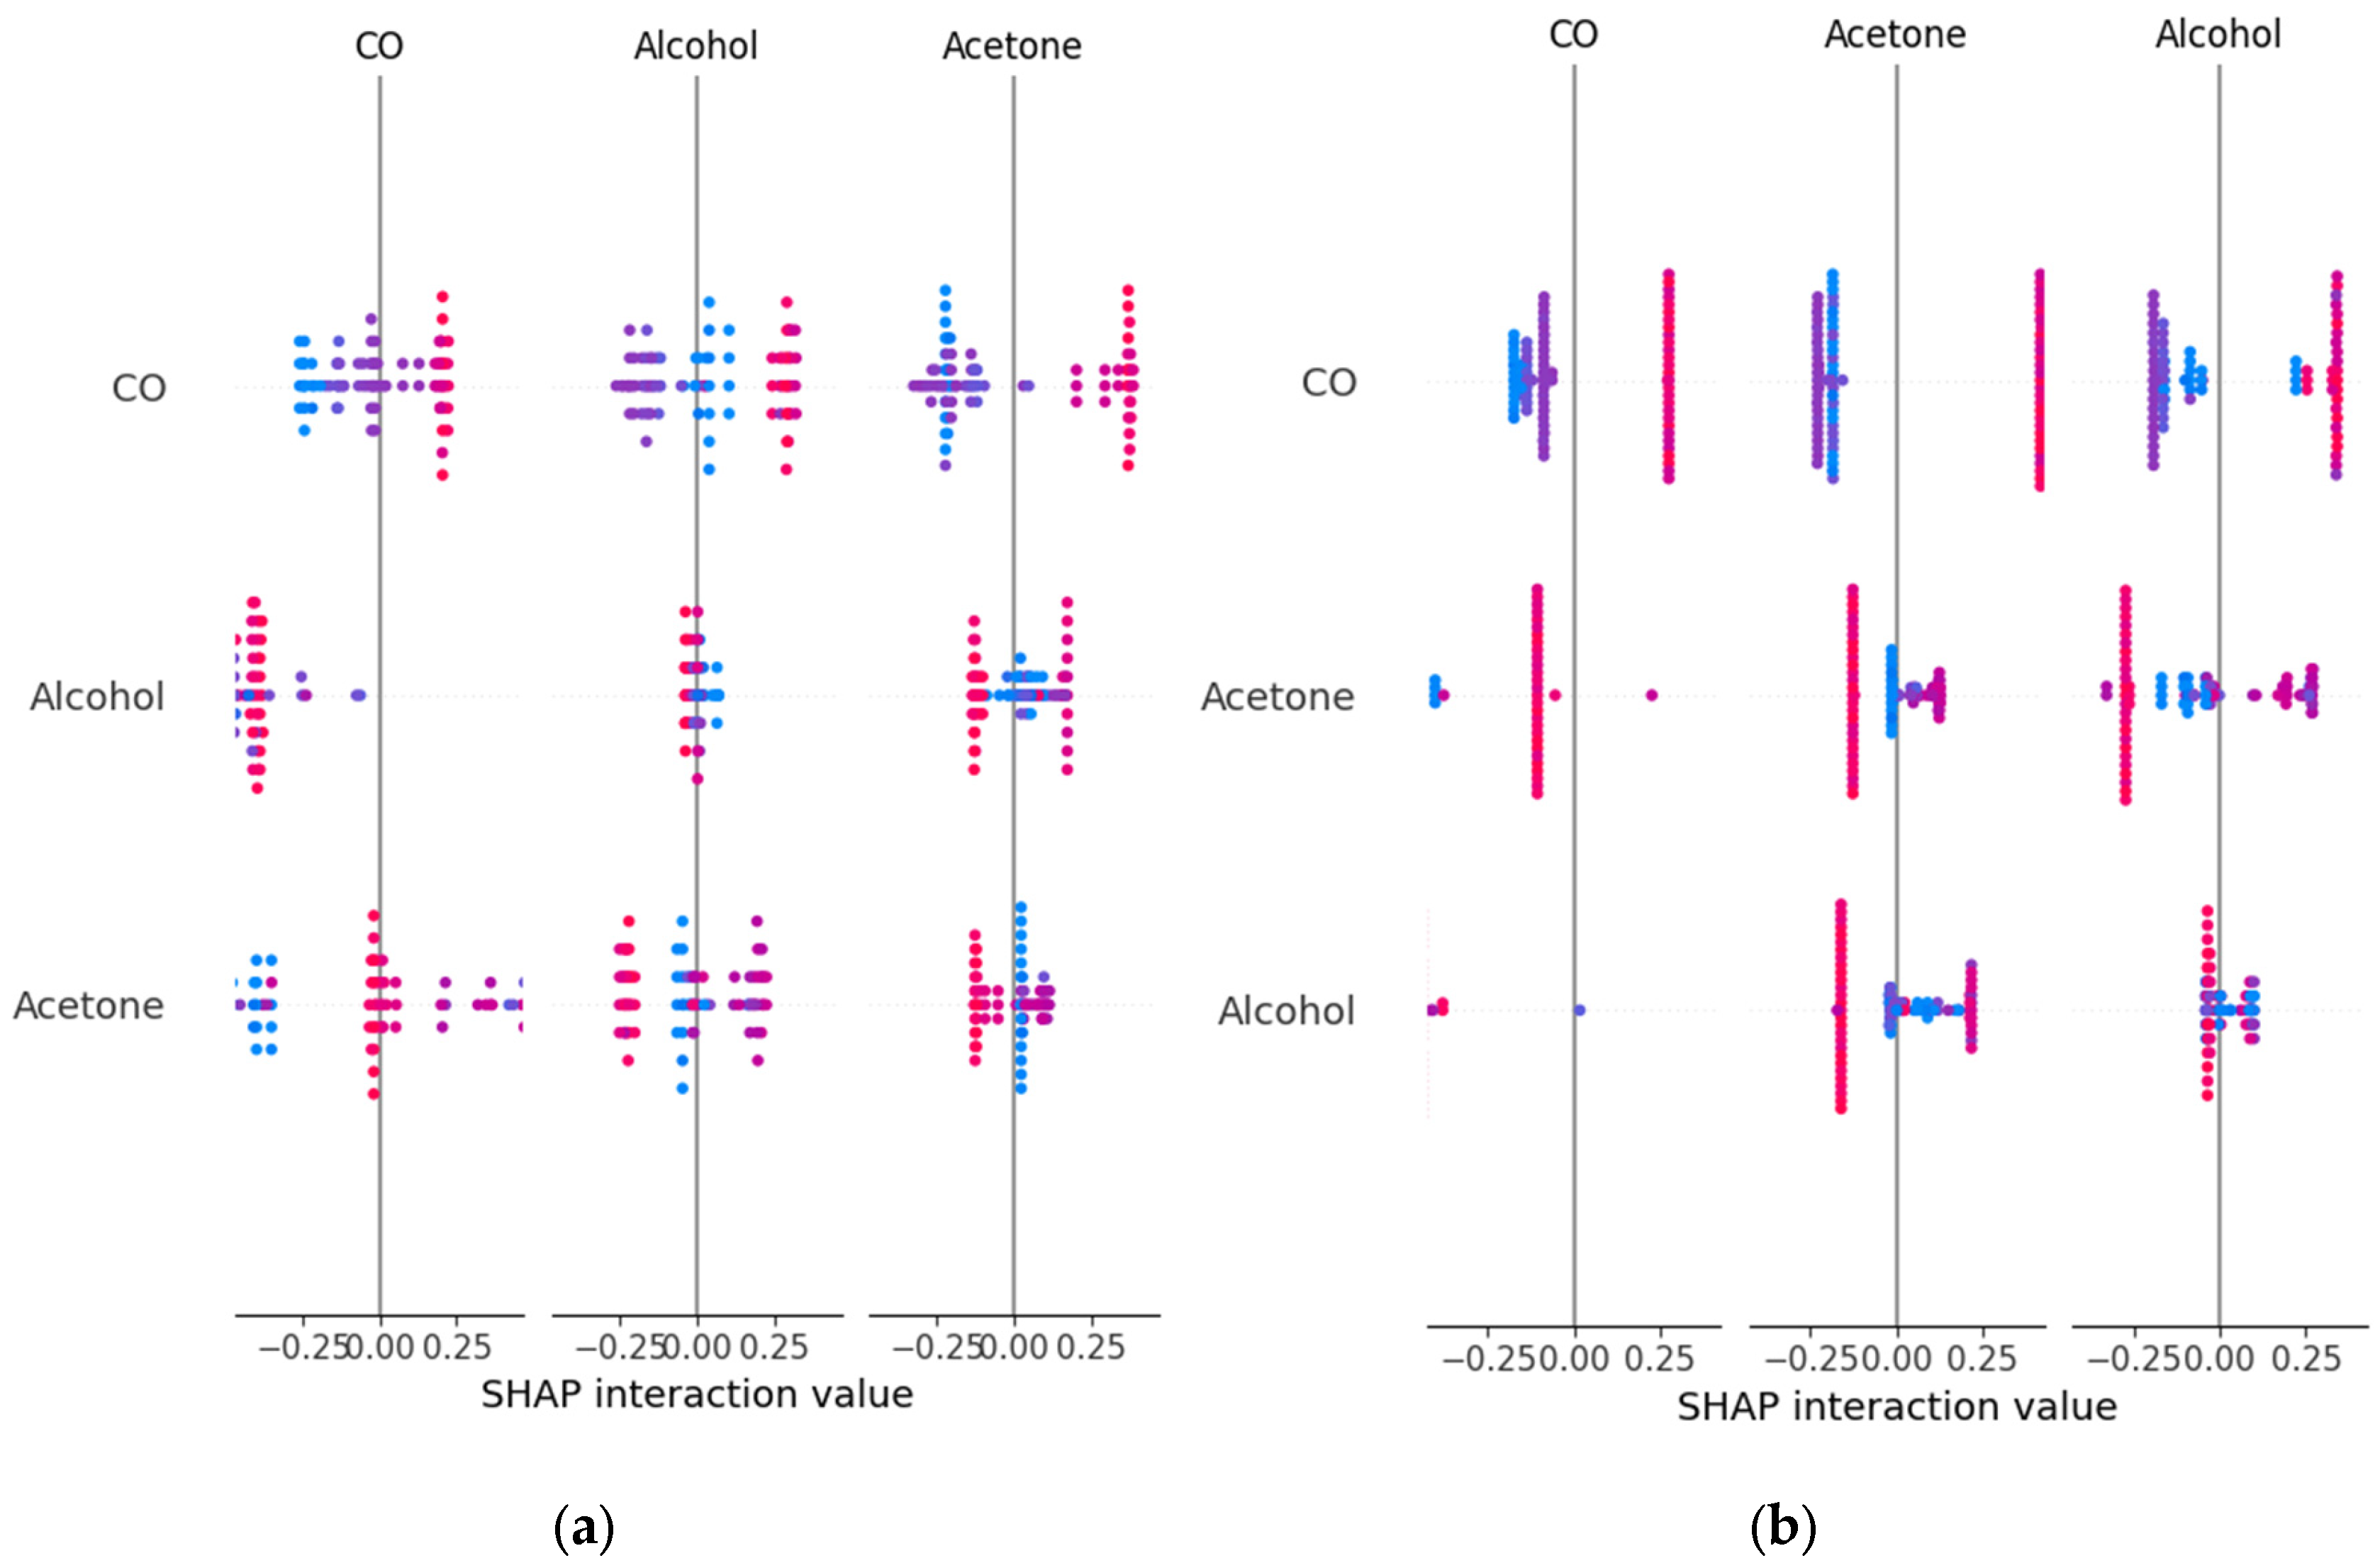
- Introduces the alcohol-to-acetone ratio as a novel biomarker, using only three MOS sensors to achieve an optimal balance between cost-efficiency and classification accuracy, leveraging feature engineering to improve multiclass discrimination (healthy, prediabetic, diabetic).
- Evaluates and compares multiple ML classifiers, employing a nested cross-validation strategy with 3 inner and 3 outer folds to ensure robust hyperparameter tuning and unbiased performance estimation.
- Demonstrates that an ensemble model (Random Forest + Gradient Boosting) achieves high classification performance across multiple metrics, with strong generalization ability.
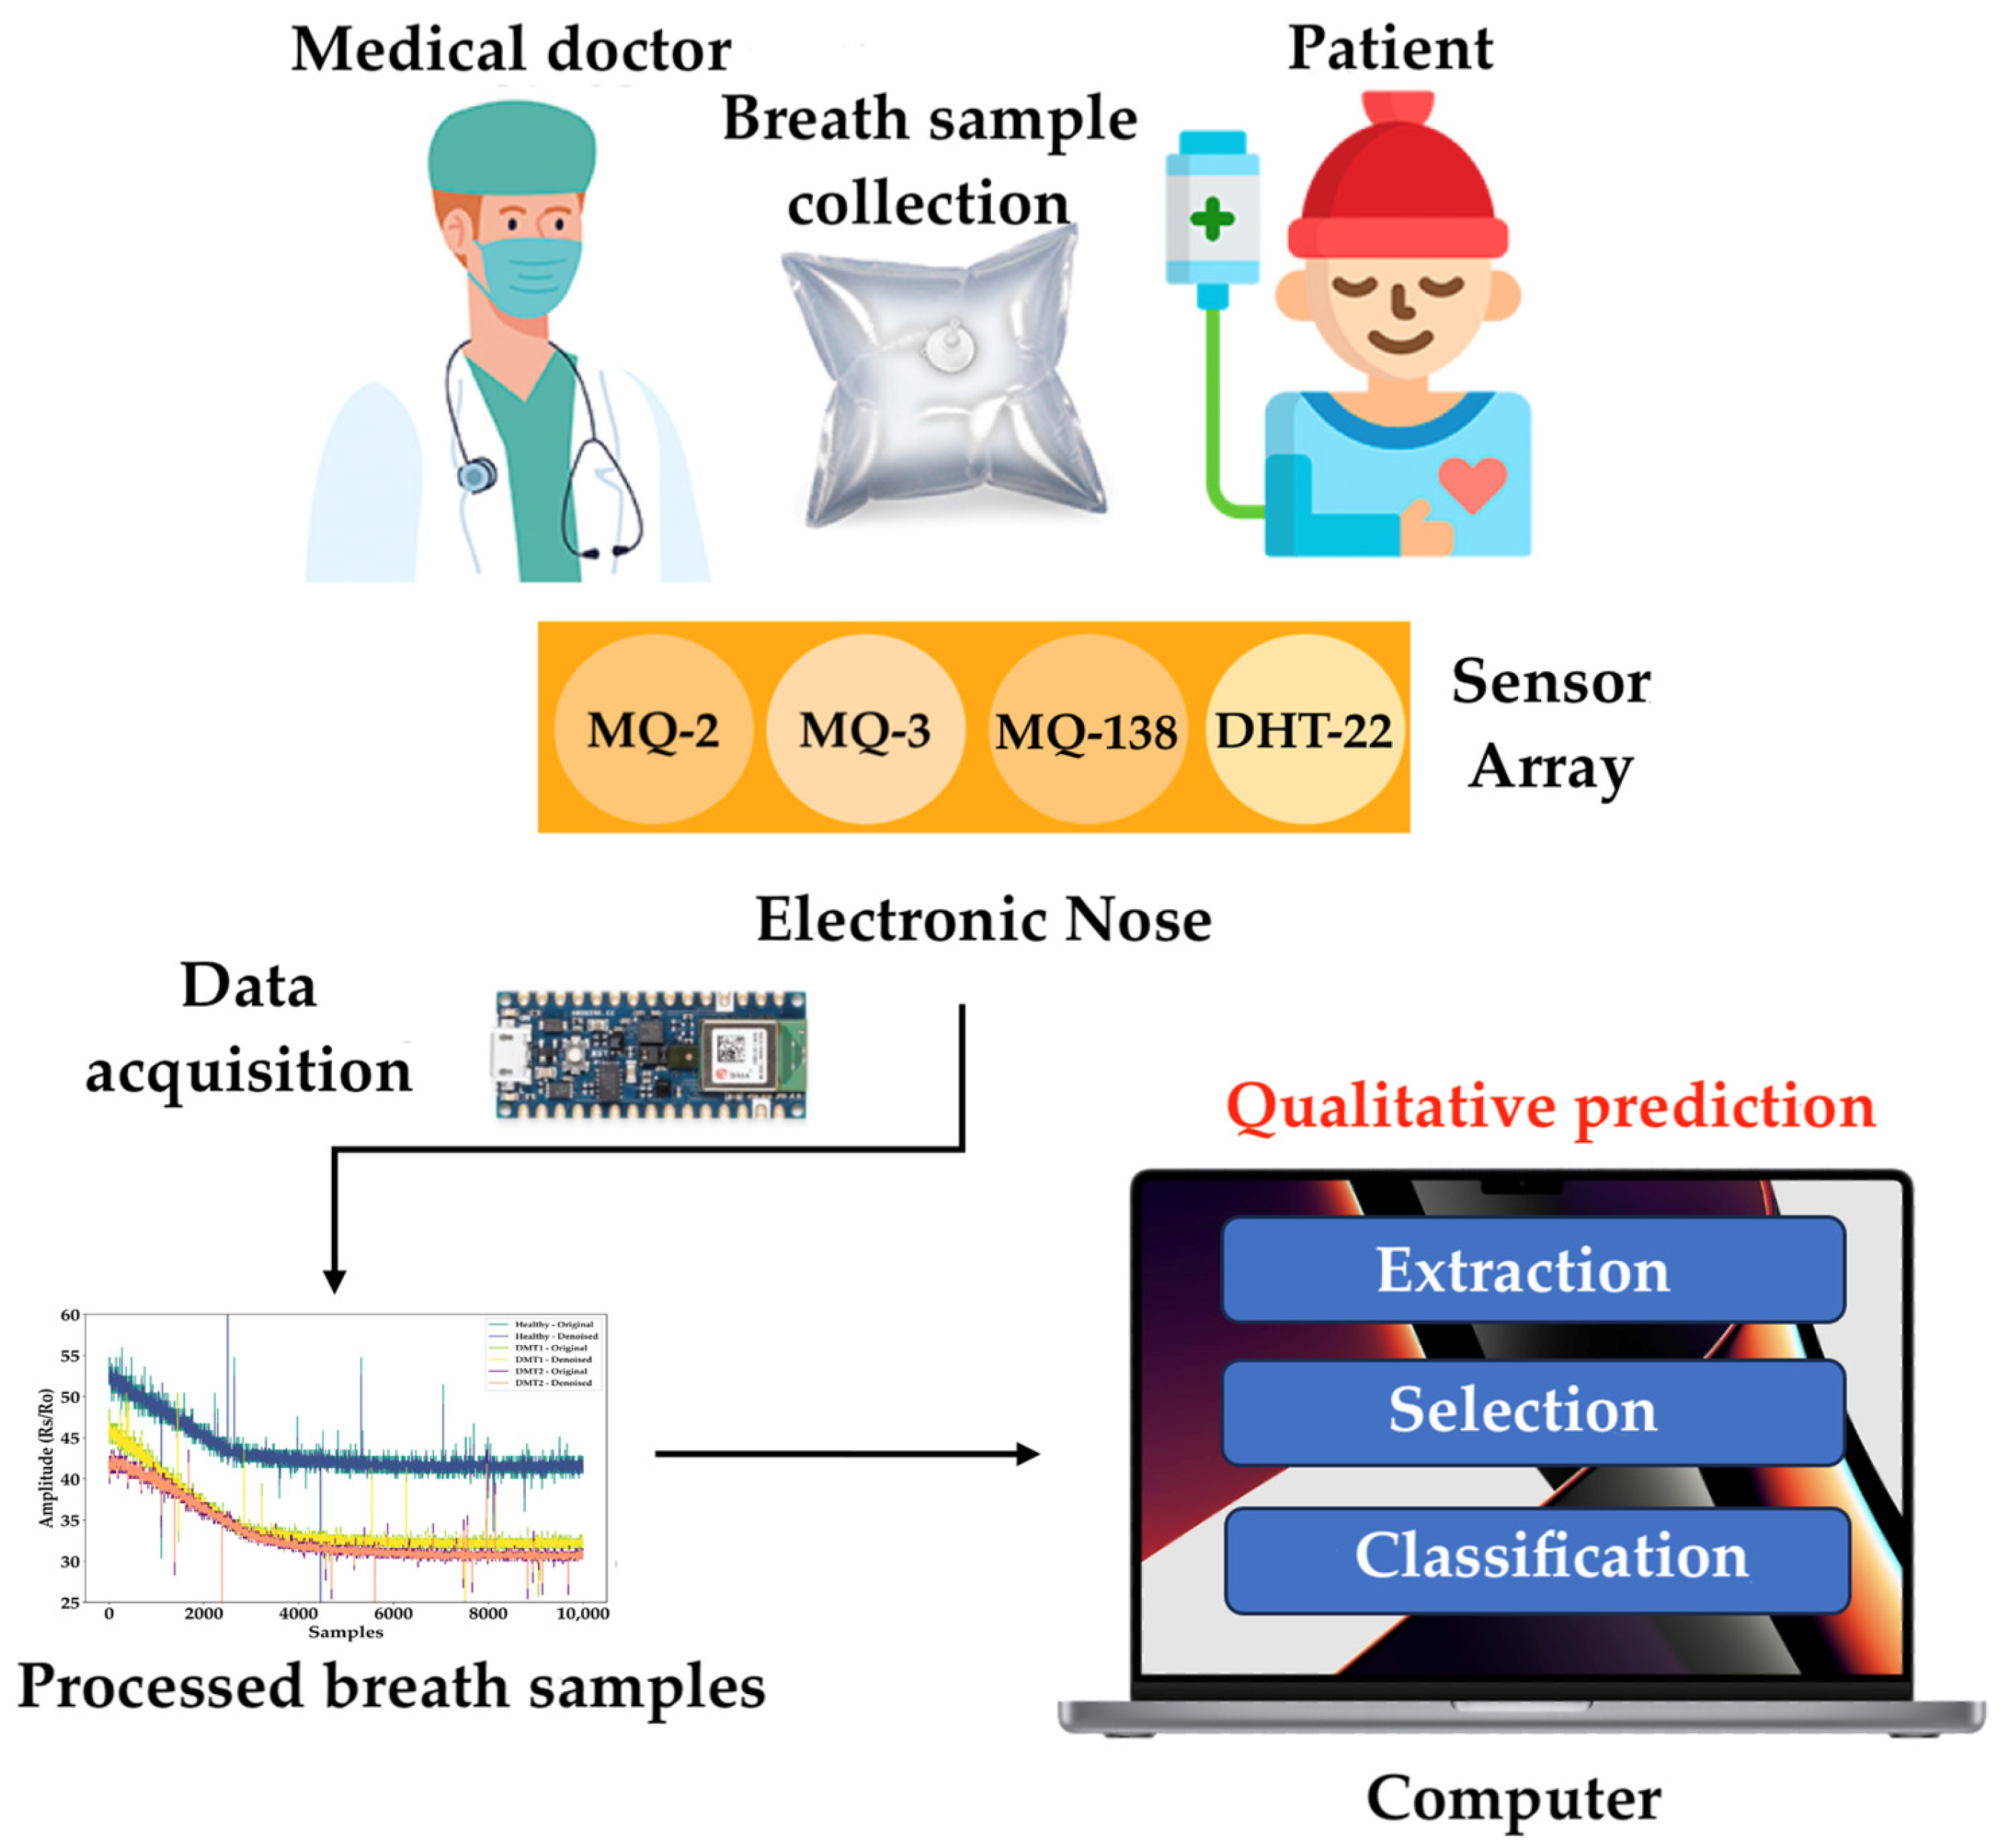
2. Materials and Methods
2.1. Dataset
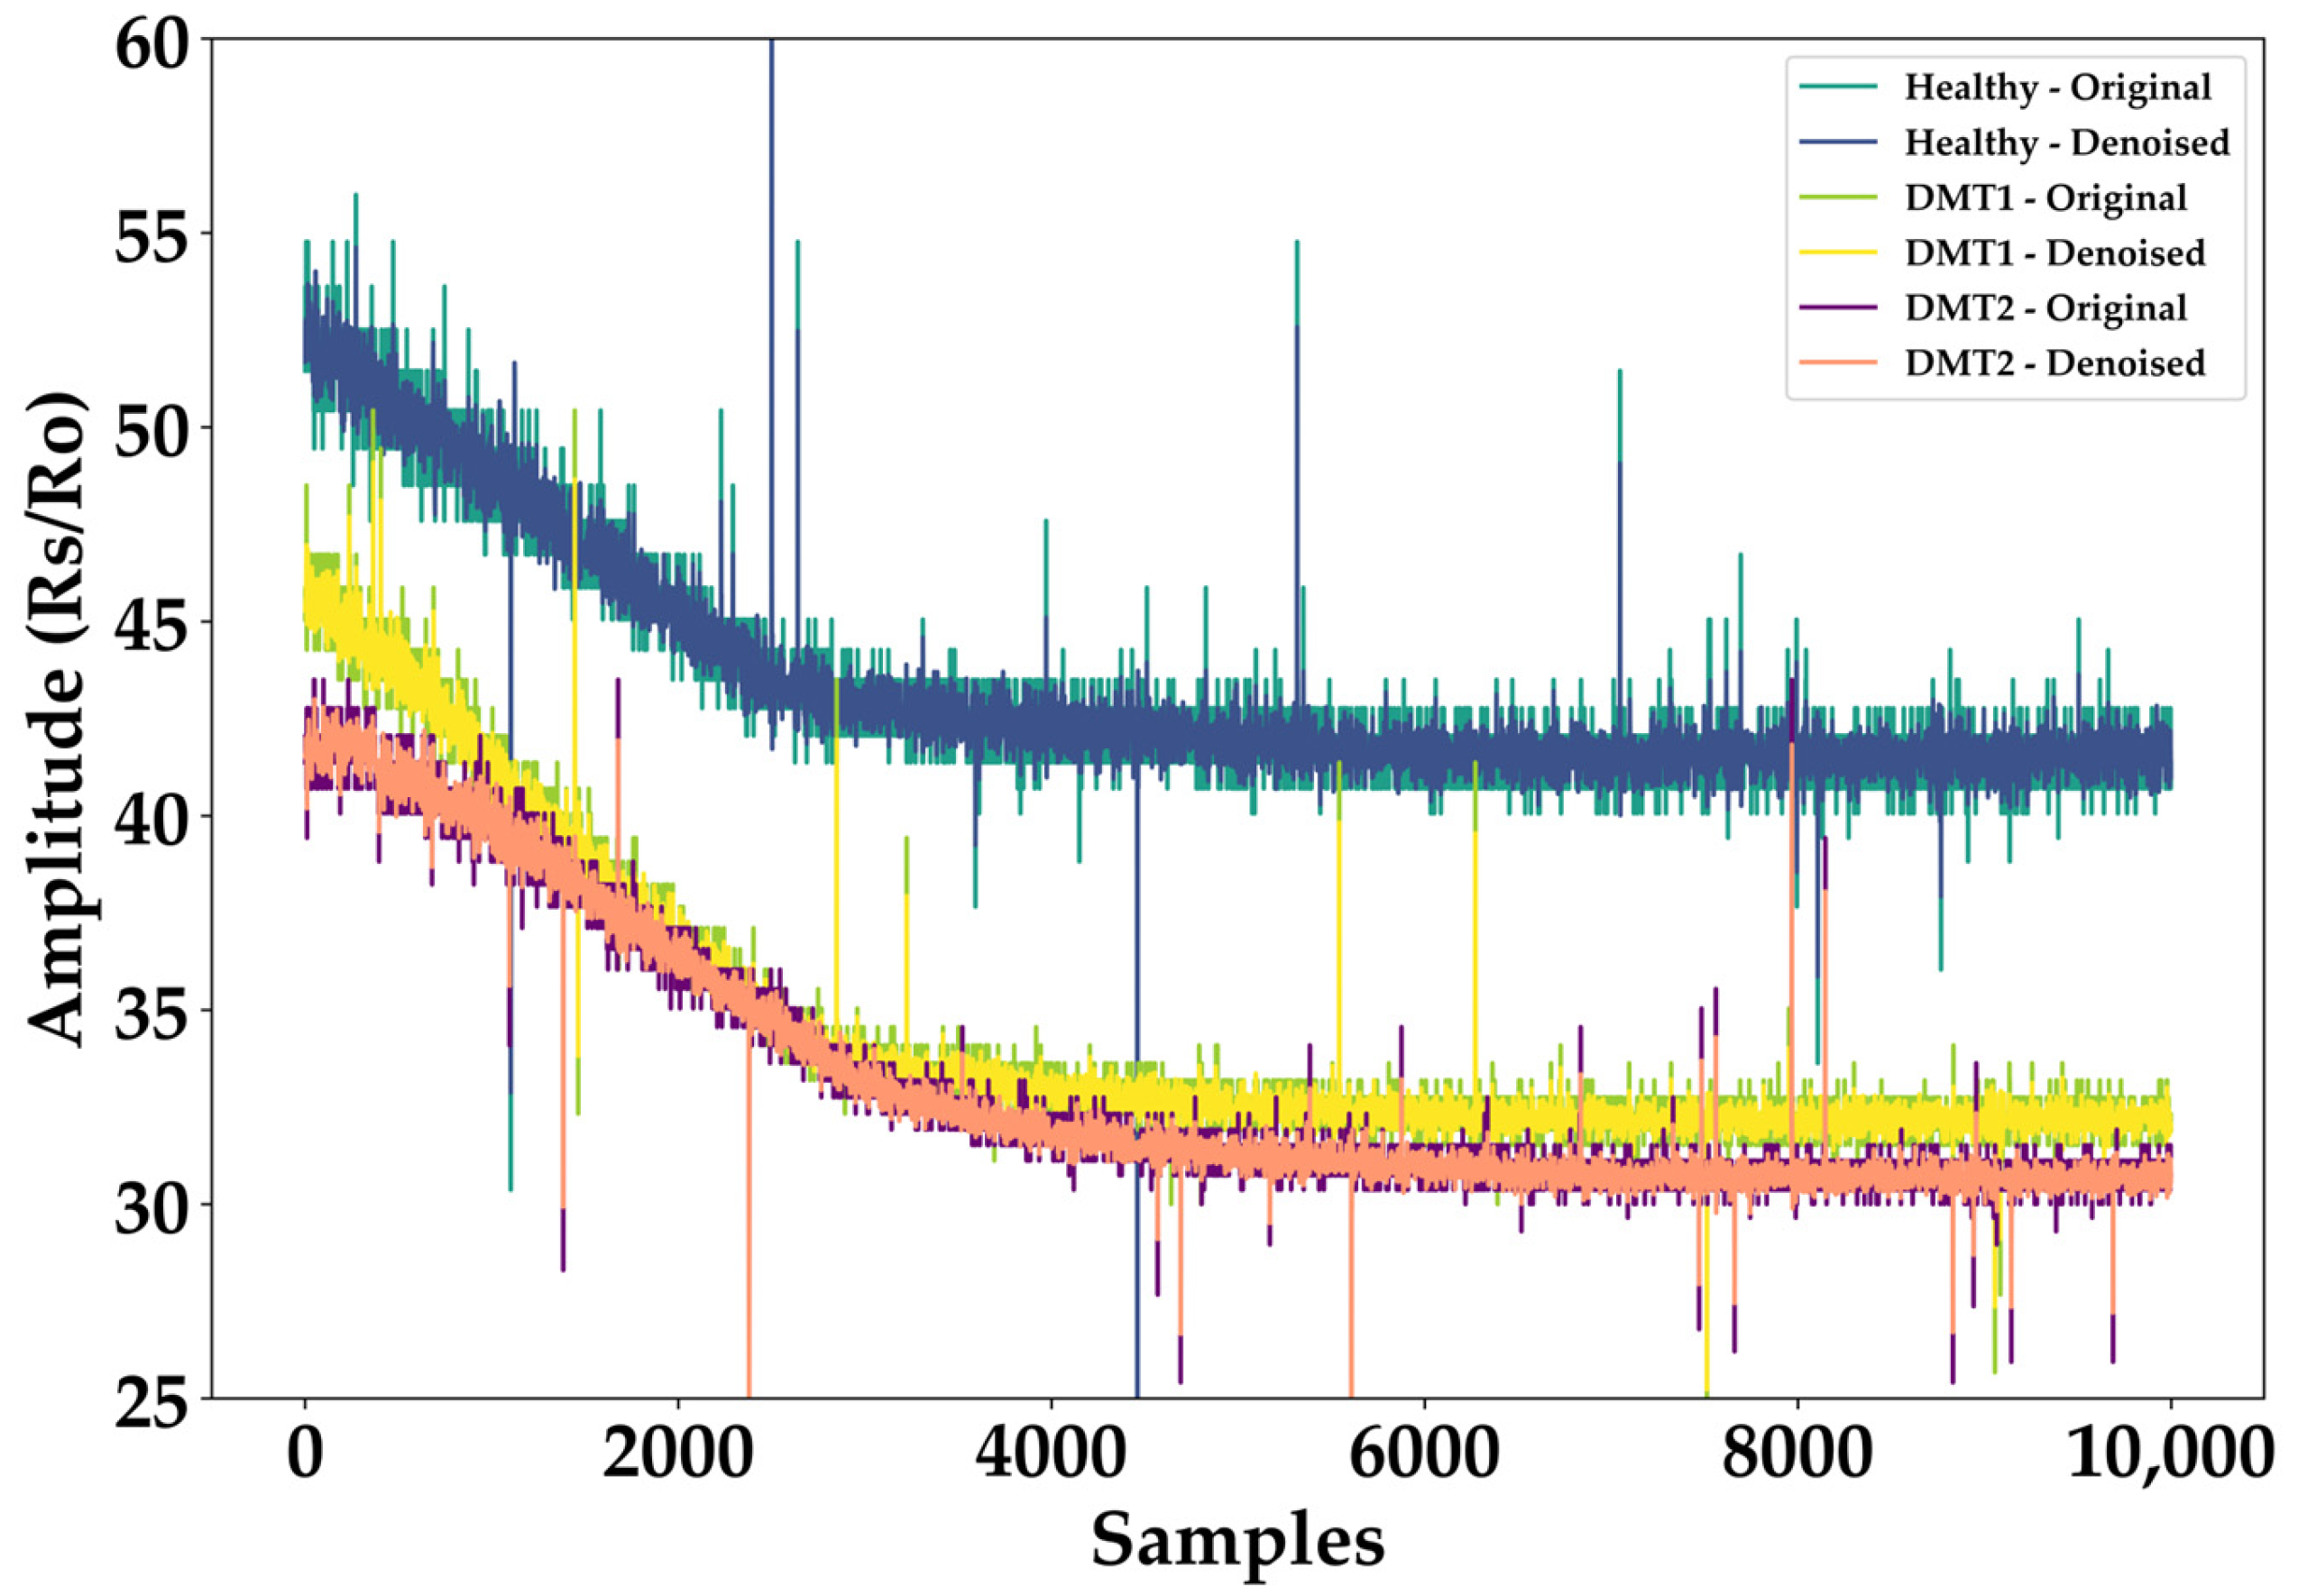
2.2. Data Preprocessing
2.3. Dataset Class Balance with SMOTE
- Healthy: BGL < 100 mg/dL
- Prediabetes: 100 ≤ BGL < 126 mg/dL
- Diabetes: BGL ≥ 126 mg/dL
2.4. Feature Selection
3. Results
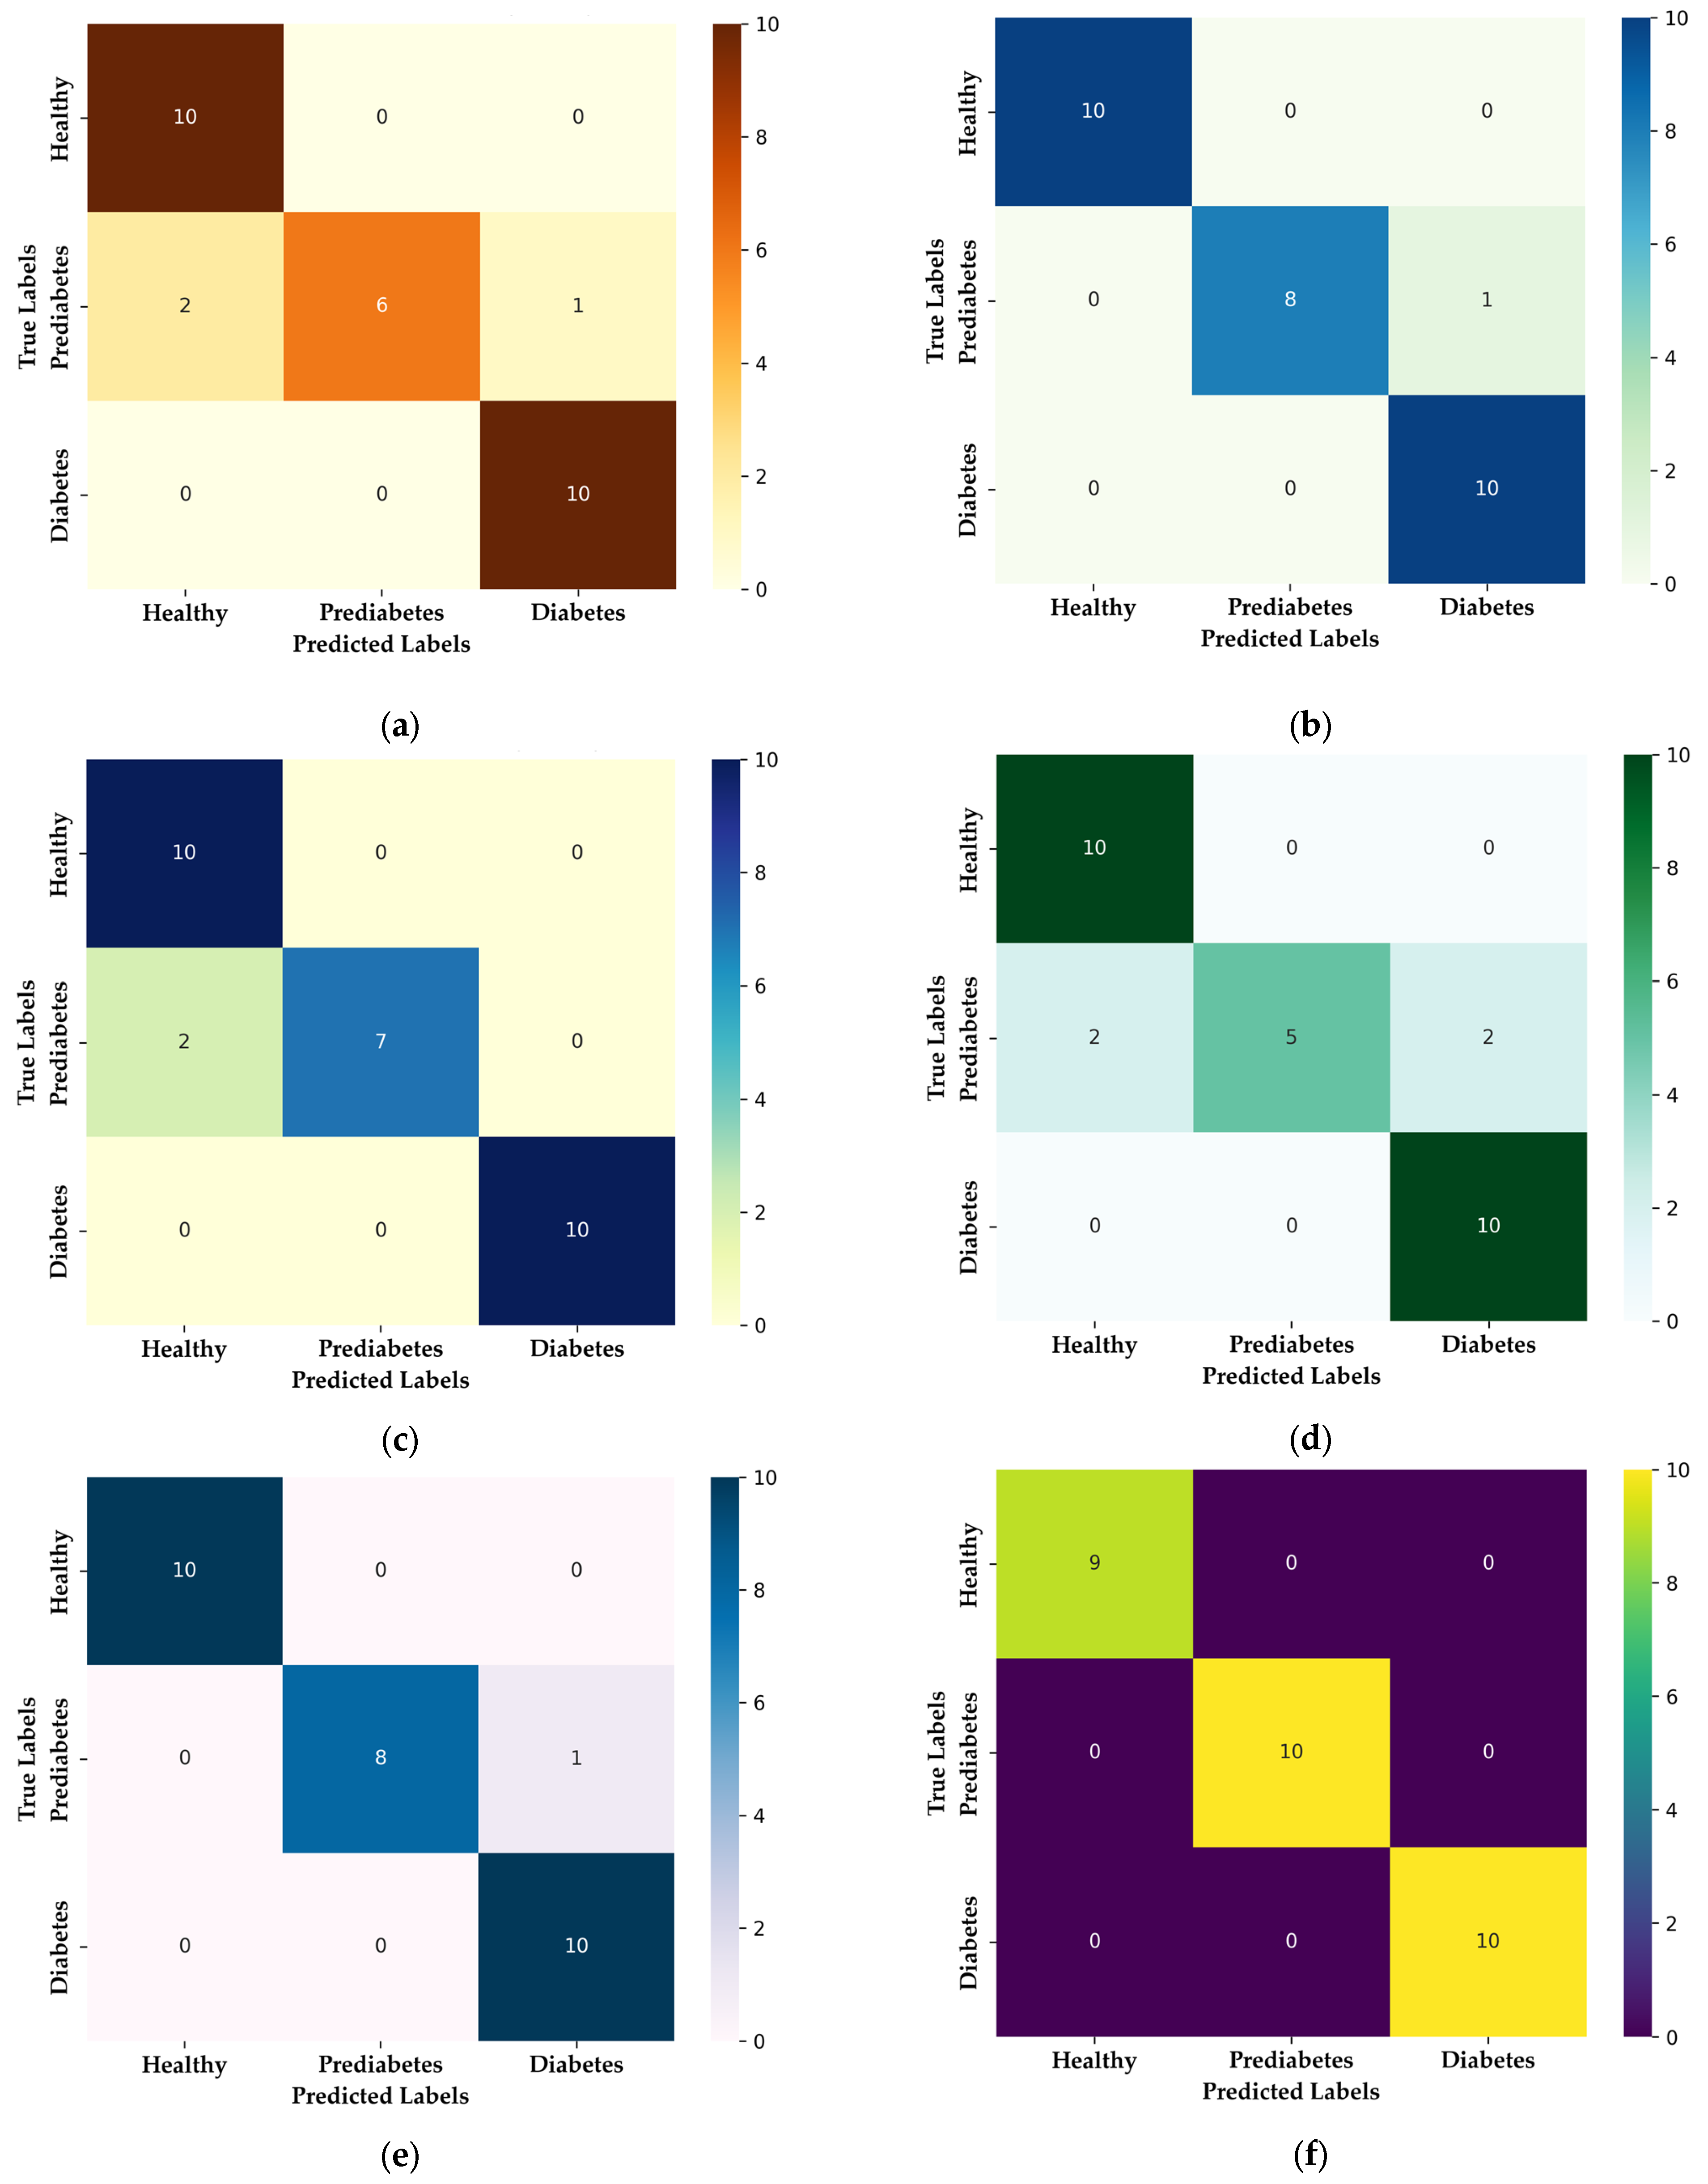
3.1. Multiclass Classification: Healthy, Prediabetic, and Diabetic
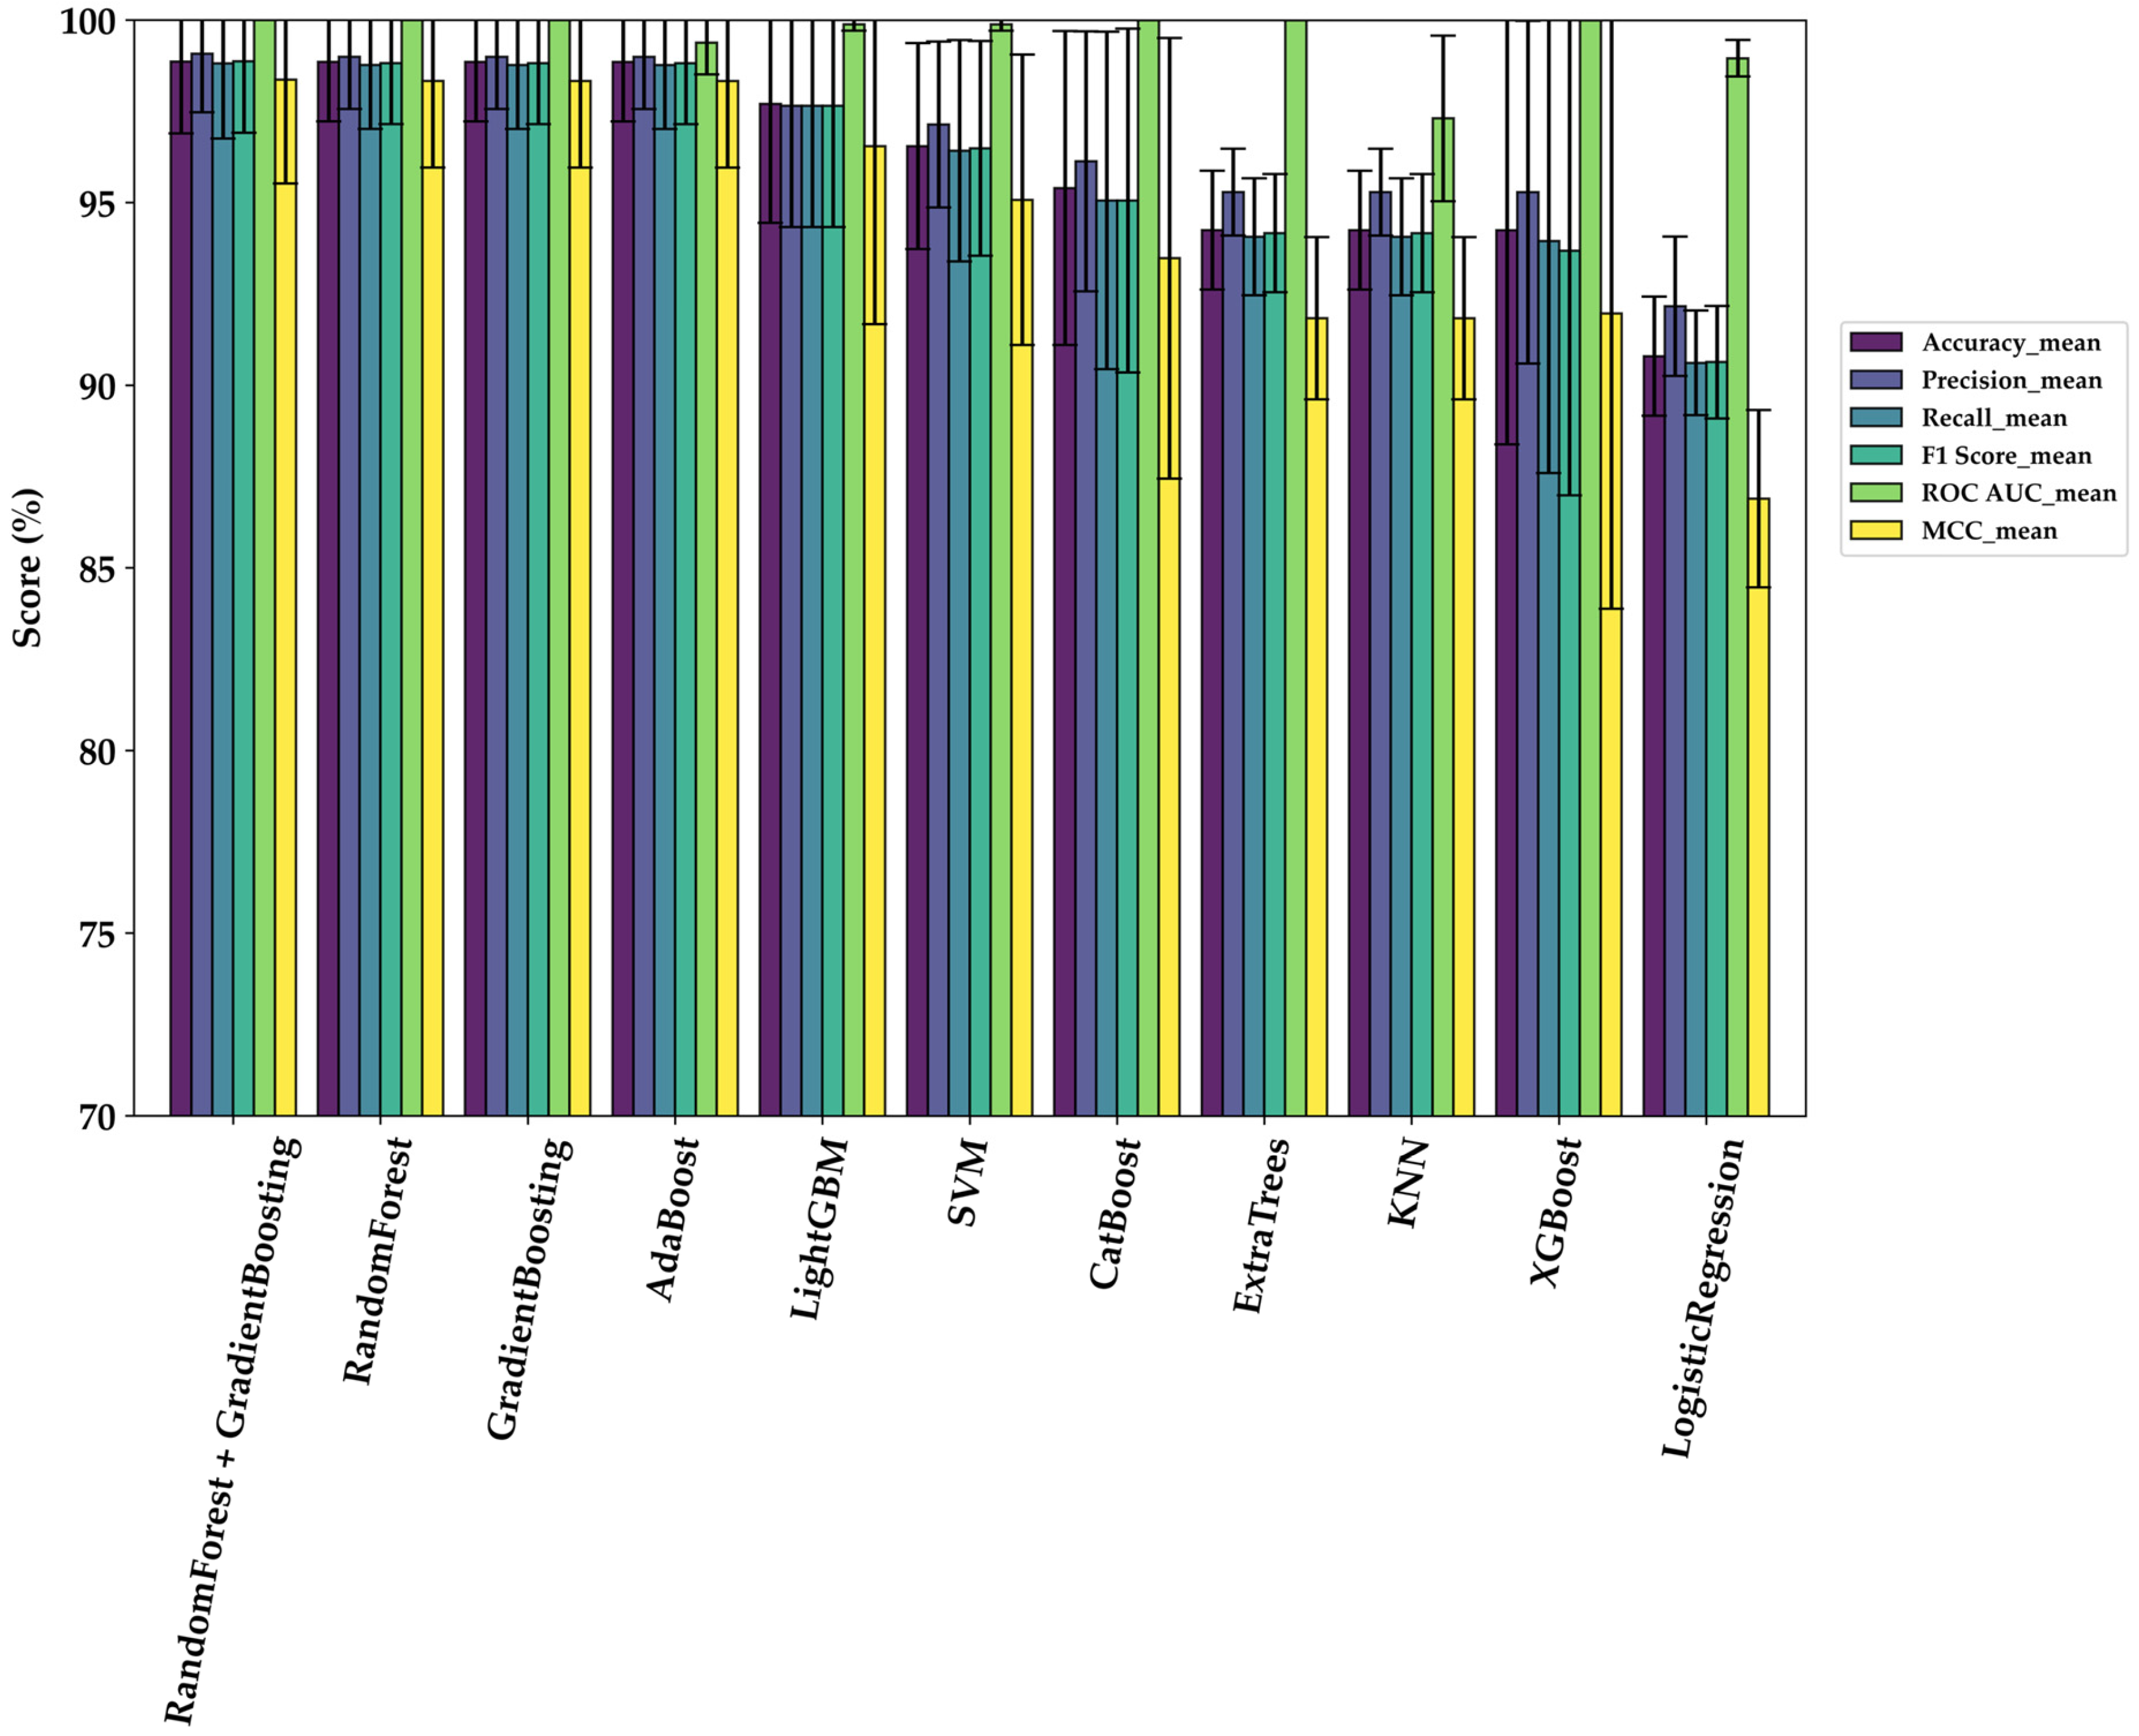
3.2. Comparative Model Performance
3.3. Explainability Analysis with SHAP
4. Discussion
5. Conclusions
6. Patents
Author Contributions
Funding
Institutional Review Board Statement
Informed Consent Statement
Data Availability Statement
Acknowledgments
Conflicts of Interest
Abbreviations
| DM | Diabetes mellitus |
| SMOTE | Synthetic Minority Over-Sampling Technique |
| CO | Monoxide carbon |
| BGL | Blood glucose levels |
| GCM | Continuous glucose monitoring |
| VOCs | Volatile organic compounds |
| GC-MS | Gas Chromatography-Mass Spectrometry |
| SIFT-MS | Selected Ion Flow Tube Mass Spectrometry |
| PTR-MS | Proton Transfer Reaction Mass Spectrometry |
| E-nose | Electronic nose |
| ML | Machine learning |
| DL | Deep Learning |
| MOS | metal-oxide semiconductor |
| CNNs | Convolutional neural network |
| T2DM | type 2 diabetes mellitus |
| T1DM | type 1 diabetes mellitus |
| ADC | analog-to-digital converter |
| RH | relative humidity |
| CSV | comma-separated values |
| DWT | Discrete wavelet transform |
| MOS | metal-oxide semiconductor |
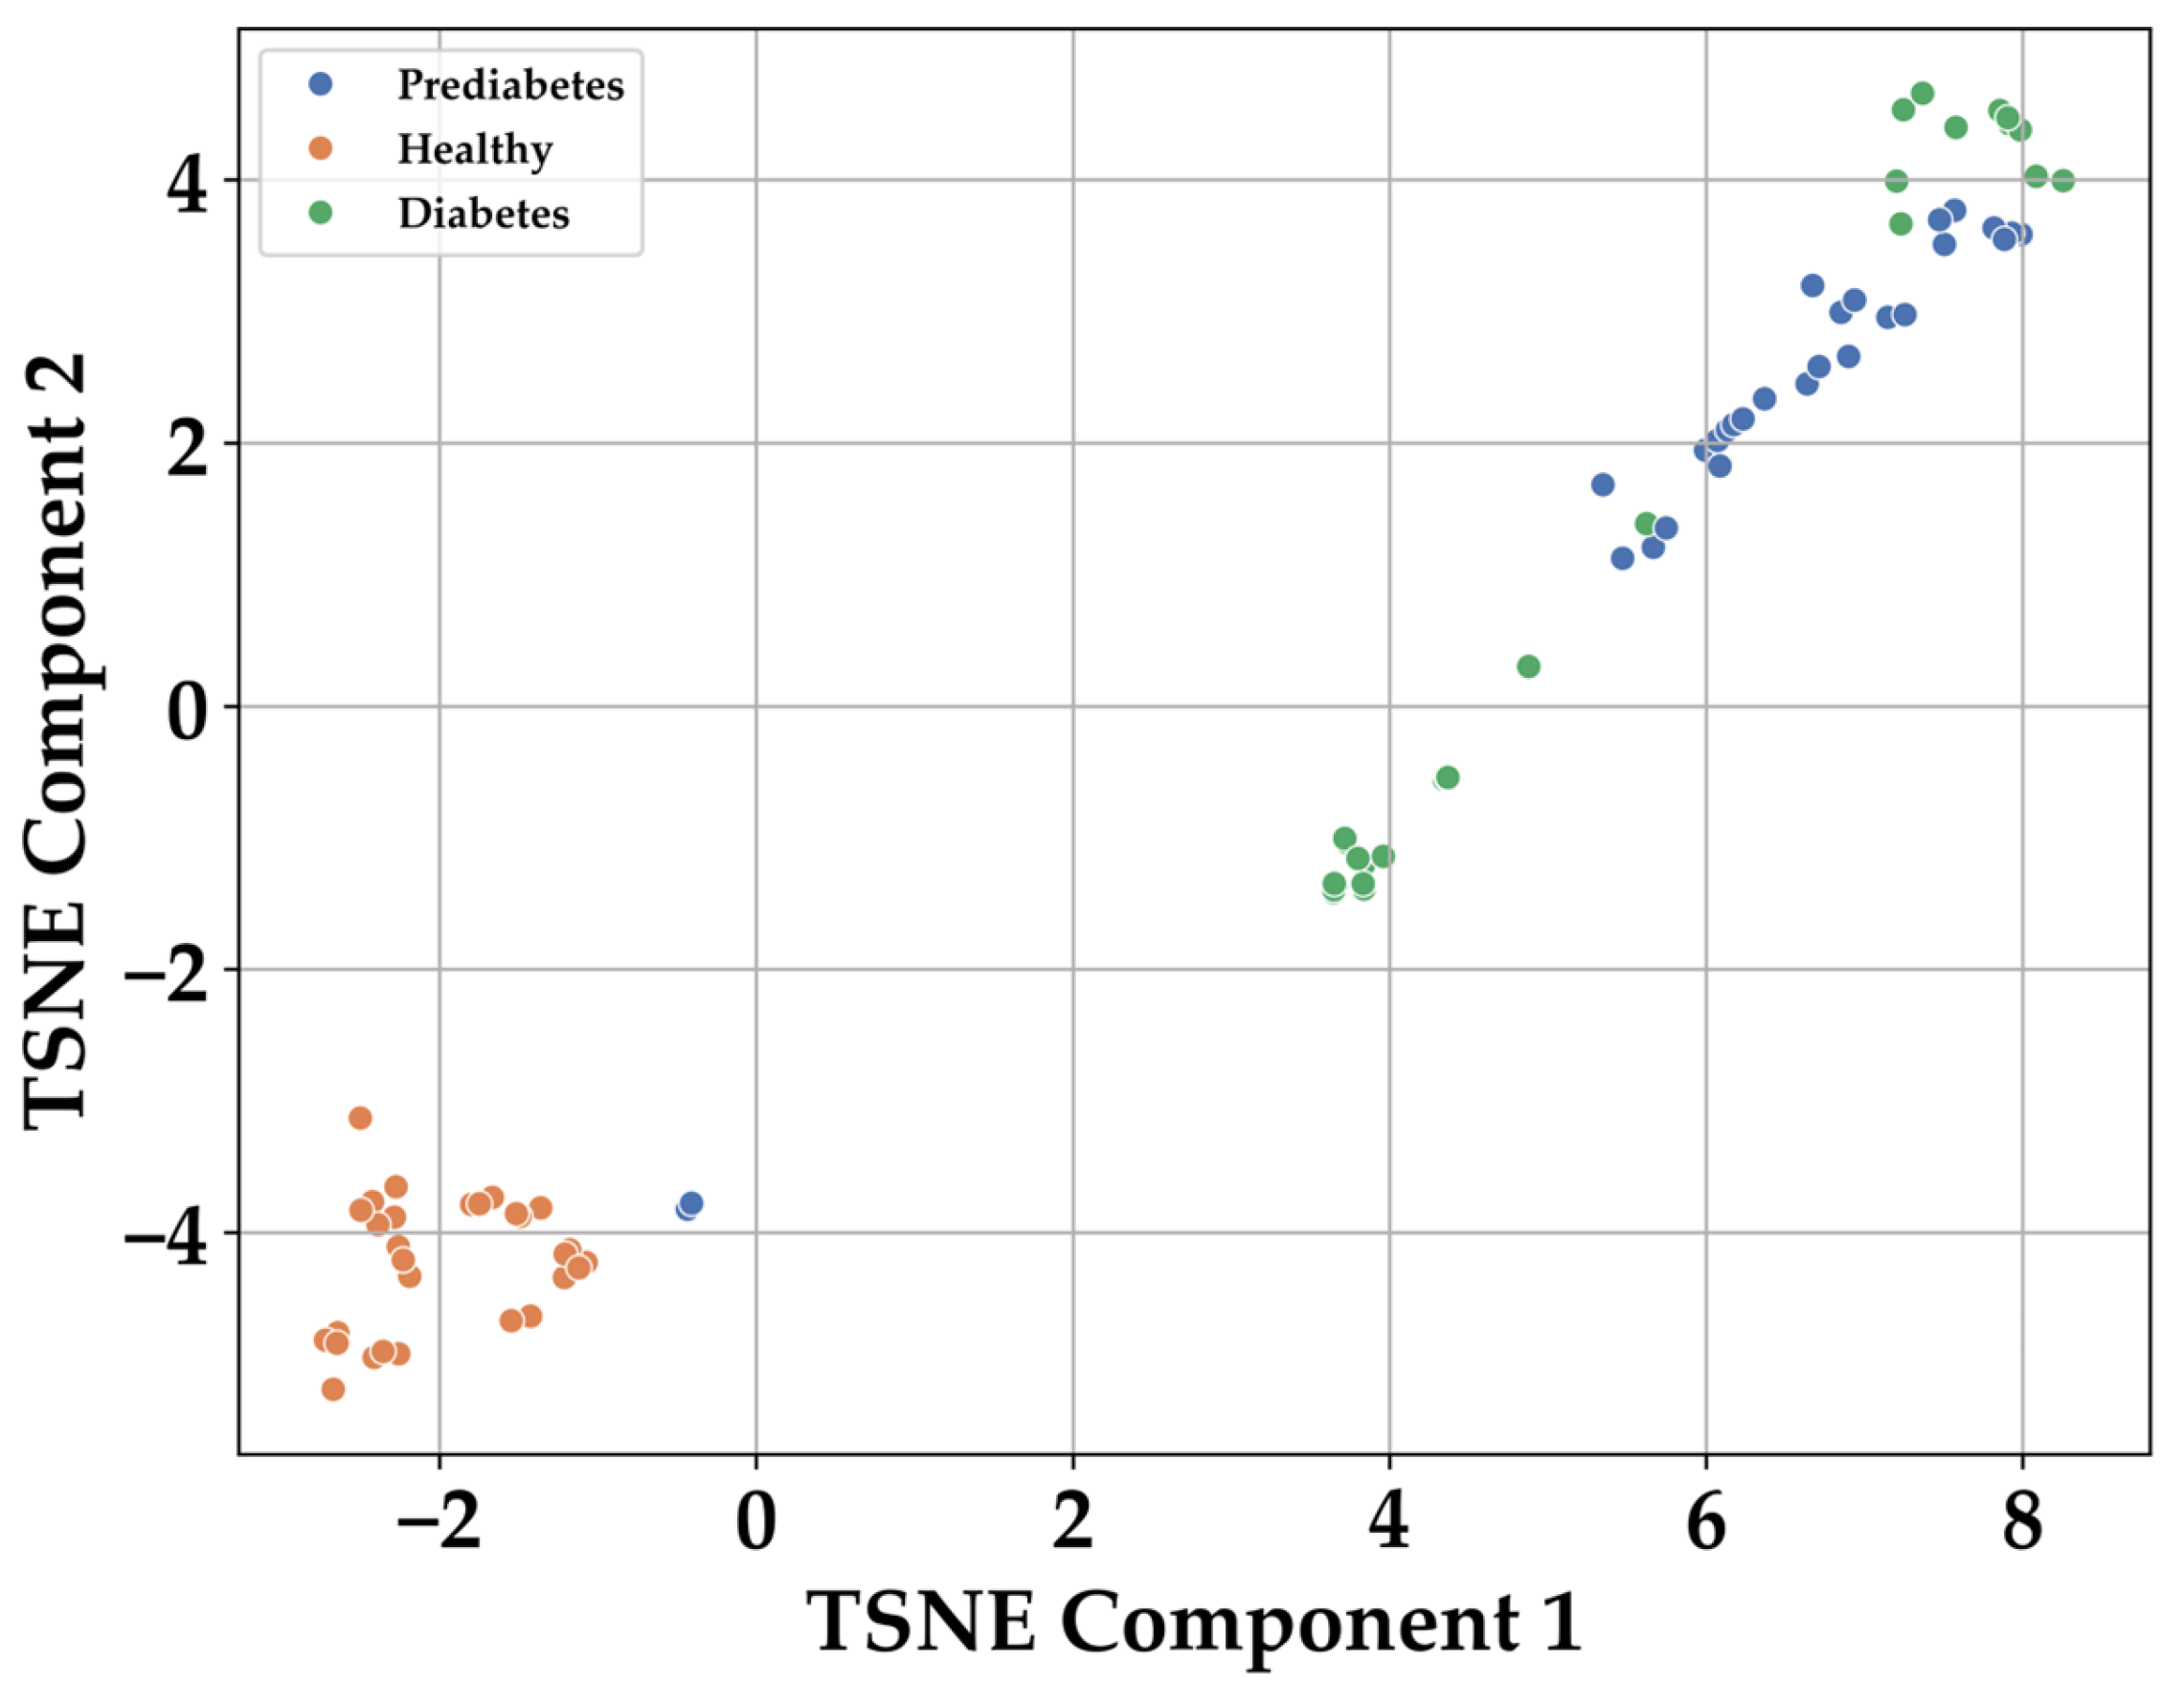
| t-SNE | t-distributed Stochastic Neighbor Embedding |
| KL | Kullback–Leibler |
| SVM | Support Vector Machines |
| KNN | k-Nearest Neighbors |
| XAI | explainable artificial intelligence |
| SHAP | Shapley additive explanations |
| MCC | Matthews Correlation Coefficient |
| XAI | Explainable Artificial Intelligence |
References
- Gregg, E.W.; Buckley, J.; Ali, M.K.; Davies, J.; Flood, D.; Mehta, R.; Zhumadilov, Z. Improving health outcomes of people with diabetes: Target setting for the WHO Global Diabetes Compact. Lancet 2023, 401, 1302–1312. [Google Scholar] [CrossRef] [PubMed]
- Hossain, M.J.; Al-Mamun, M.; Islam, M.R. Diabetes mellitus, the fastest growing global public health concern: Early detection should be focused. Health Sci. Rep. 2024, 7, e2004. [Google Scholar] [CrossRef] [PubMed]
- Menke, A.; Knowler, W.C.; Cowie, C.C. Physical and metabolic characteristics of persons with diabetes and prediabetes. In Diabetes in America, 3rd ed.; National Institute of Diabetes and Digestive and Kidney Diseases: Bethesda, MD, USA, 2018. [Google Scholar]
- Jasim, O.H.; Mahmood, M.M.; Ad’hiah, A.H. Significance of lipid profile parameters in predicting pre-diabetes. Arch. Razi Inst. 2022, 77, 277–285. [Google Scholar] [PubMed]
- Pradeepa, R.; Mohan, V. Epidemiology of chronic complications of diabetes: A global perspective. In Chronic Complications of Diabetes Mellitus; Academic Press: Cambridge, MA, USA, 2024; pp. 11–23. [Google Scholar]
- Lindner, N.; Kuwabara, A.; Holt, T. Non-invasive and minimally invasive glucose monitoring devices: A systematic review and meta-analysis on diagnostic accuracy of hypoglycaemia detection. Syst. Rev. 2021, 10, 145. [Google Scholar] [CrossRef]
- Ortiz-Martínez, M.; González-González, M.; Martagón, A.J.; Hlavinka, V.; Willson, R.C.; Rito-Palomares, M. Recent developments in biomarkers for diagnosis and screening of type 2 diabetes mellitus. Curr. Diab. Rep. 2022, 22, 95–115. [Google Scholar] [CrossRef]
- Jain, P.; Joshi, A.M.; Mohanty, S.P.; Cenkeramaddi, L.R. Non-invasive glucose measurement technologies: Recent advancements and future challenges. IEEE Access 2024, 12, 61907–61936. [Google Scholar] [CrossRef]
- Gouveri, E.; Papanas, N. The emerging role of continuous glucose monitoring in the management of diabetic peripheral neuropathy: A narrative review. Diabetes Ther. 2022, 13, 931–952. [Google Scholar] [CrossRef]
- Jang, S.; Wang, Y.; Jang, A. Review of emerging approaches utilizing alternative physiological human body fluids in non- or minimally invasive glucose monitoring. In Advanced Bioscience and Biosystems for Detection and Management of Diabetes; Springer International Publishing: Cham, Switzerland, 2022; pp. 9–26. [Google Scholar]
- Li, Y.; Chen, Y. Review of noninvasive continuous glucose monitoring in diabetics. ACS Sens. 2023, 8, 3659–3679. [Google Scholar] [CrossRef]
- Fiedorova, K.; Augustynek, M.; Kubicek, J.; Kudrna, P.; Bibbo, D. Review of present method of glucose from human blood and body fluids assessment. Biosens. Bioelectron. 2022, 211, 114348. [Google Scholar] [CrossRef]
- Chowdhury, M.H.; Shuzan, M.N.I.; Chowdhury, M.E.; Mahbub, Z.B.; Uddin, M.M.; Khandakar, A.; Reaz, M.B.I. Estimating blood pressure from the photoplethysmogram signal and demographic features using machine learning techniques. Sensors 2020, 20, 3127. [Google Scholar] [CrossRef]
- Liu, H.; Liu, W.; Sun, C.; Huang, W.; Cui, X. A review of non-invasive blood glucose monitoring through breath acetone and body surface. Sens. Actuators A Phys. 2024, 359, 115500. [Google Scholar] [CrossRef]
- Jadhav, M.R.; Wankhede, P.R.; Srivastava, S.; Bhargaw, H.N.; Singh, S. Breath-based biosensors and system development for noninvasive detection of diabetes: A review. Diabetes Metab. Syndr. Clin. Res. Rev. 2024, 18, 102931. [Google Scholar] [CrossRef] [PubMed]
- Xu, W.; Zou, X.; Ding, H.; Ding, Y.; Zhang, J.; Liu, W.; Chu, Y. Rapid and non-invasive diagnosis of type 2 diabetes through sniffing urinary acetone by a proton transfer reaction mass spectrometry. Talanta 2023, 256, 124265. [Google Scholar] [CrossRef] [PubMed]
- Nicolier, C.; Künzler, J.; Lizoain, A.; Kerber, D.; Hossmann, S.; Rothenbühler, M.; Witthauer, L. Detection of hypoglycaemia in type 1 diabetes through breath volatile organic compound profiling using gas chromatography–ion mobility spectrometry. Diabetes Obes. Metab. 2024, 26, 5737–5744. [Google Scholar] [CrossRef]
- Hu, B. Mass spectrometric analysis of exhaled breath: Recent advances and future perspectives. TrAC Trends Anal. Chem. 2023, 168, 117320. [Google Scholar] [CrossRef]
- Mahnoor, M.; Shah, A.A.; Inam, A. Acetone detection using various techniques for diagnosis of diabetes mellitus from human exhaled breath: A review. In Proceedings of the AIP Conference, Kuala Lumpur, Malaysia, 28–30 August 2024; Volume 3125, p. 1. [Google Scholar]
- Zhang, X.; Frankevich, V.; Ding, J.; Ma, Y.; Chingin, K.; Chen, H. Direct mass spectrometry analysis of exhaled human breath in real-time. Mass Spectrom. Rev. 2025, 44, 43–61. [Google Scholar] [CrossRef]
- Gudiño-Ochoa, A.; García-Rodríguez, J.A.; Ochoa-Ornelas, R.; Cuevas-Chávez, J.I.; Sánchez-Arias, D.A. Noninvasive diabetes detection through human breath using TinyML-powered E-nose. Sensors 2024, 24, 1294. [Google Scholar] [CrossRef]
- Paleczek, A.; Rydosz, A. The effect of high ethanol concentration on E-nose response for diabetes detection in exhaled breath: Laboratory studies. Sens. Actuators B Chem. 2024, 408, 135550. [Google Scholar] [CrossRef]
- Paleczek, A.; Grochala, D.; Rydosz, A. Artificial breath classification using XGBoost algorithm for diabetes detection. Sensors 2021, 21, 4187. [Google Scholar] [CrossRef]
- Zaim, O.; Bouchikhi, B.; Motia, S.; Abelló, S.; Llobet, E.; El Bari, N. Discrimination of diabetes mellitus patients and healthy individuals based on volatile organic compounds (VOCs): Analysis of exhaled breath and urine samples by using e-nose and VE-tongue. Chemosensors 2023, 11, 350. [Google Scholar] [CrossRef]
- Zhu, H.; Liu, C.; Zheng, Y.; Zhao, J.; Li, L. A hybrid machine learning algorithm for detection of simulated expiratory markers of diabetic patients based on gas sensor array. IEEE Sens. J. 2022, 23, 2940–2947. [Google Scholar] [CrossRef]
- Kapur, R.; Kumar, Y.; Sharma, R.; Singh, E.; Rohilla, D.; Kanwar, V.; Dutt, V. GlucoBreath: An IoT, ML, and breath-based non-invasive glucose meter. IEEE Access 2024, 12, 59346–59360. [Google Scholar] [CrossRef]
- Lekha, S.; Suchetha, M. Real-time non-invasive detection and classification of diabetes using modified convolution neural network. IEEE J. Biomed. Health Inform. 2017, 22, 1630–1636. [Google Scholar] [CrossRef] [PubMed]
- Gudiño-Ochoa, A.; García-Rodríguez, J.A.; Cuevas-Chávez, J.I.; Ochoa-Ornelas, R.; Navarrete-Guzmán, A.; Vidrios-Serrano, C.; Sánchez-Arias, D.A. Enhanced diabetes detection and blood glucose prediction using TinyML-integrated E-nose and breath analysis: A novel approach combining synthetic and real-world data. Bioengineering 2024, 11, 1065. [Google Scholar] [CrossRef]
- Ochoa-Ornelas, R.; Gudiño-Ochoa, A.; García-Rodríguez, J.A. A hybrid deep learning and machine learning approach with Mobile-EfficientNet and Grey Wolf Optimizer for lung and colon cancer histopathology classification. Cancers 2024, 16, 3791. [Google Scholar] [CrossRef]
- Ye, Z.; Wang, J.; Hua, H.; Zhou, X.; Li, Q. Precise detection and quantitative prediction of blood glucose level with an electronic nose system. IEEE Sens. J. 2022, 22, 12452–12459. [Google Scholar] [CrossRef]
- Sha, M.S.; Maurya, M.R.; Shafath, S.; Cabibihan, J.J.; Al-Ali, A.; Malik, R.A.; Sadasivuni, K.K. Breath analysis for the in vivo detection of diabetic ketoacidosis. ACS Omega 2022, 7, 4257–4266. [Google Scholar] [CrossRef]
- Grundy, S.M. Pre-diabetes, metabolic syndrome, and cardiovascular risk. J. Am. Coll. Cardiol. 2012, 59, 635–643. [Google Scholar] [CrossRef]
- Rodríguez-Fonseca, L.; Llorente-Pendás, S.; García-Pola, M. Risk of prediabetes and diabetes in oral lichen planus: A case–control study according to current diagnostic criteria. Diagnostics 2023, 13, 1586. [Google Scholar] [CrossRef]
- Paleczek, A.; Rydosz, A. Review of the algorithms used in exhaled breath analysis for the detection of diabetes. J. Breath Res. 2022, 16, 026003. [Google Scholar] [CrossRef]
- Lekha, S.; Suchetha, M. Recent advancements and future prospects on e-nose sensors technology and machine learning approaches for non-invasive diabetes diagnosis: A review. IEEE Rev. Biomed. Eng. 2020, 14, 127–138. [Google Scholar] [CrossRef] [PubMed]
- Ahsan, M.M.; Mahmud, M.P.; Saha, P.K.; Gupta, K.D.; Siddique, Z. Effect of data scaling methods on machine learning algorithms and model performance. Technologies 2021, 9, 52. [Google Scholar] [CrossRef]
- ACE/ADA Task Force on Inpatient Diabetes. American College of Endocrinology and American Diabetes Association consensus statement on inpatient diabetes and glycemic control: A call to action. Diabetes Care 2006, 29, 1955–1962. [Google Scholar] [CrossRef] [PubMed]
- Van De Ruit, M.; Billeter, M.; Eisemann, E. An efficient dual-hierarchy t-SNE minimization. IEEE Trans. Vis. Comput. Graph. 2021, 28, 614–622. [Google Scholar] [CrossRef]
- Yousef, H.; Khandoker, A.H.; Feng, S.F.; Helf, C.; Jelinek, H.F. Inflammation, oxidative stress and mitochondrial dysfunction in the progression of type II diabetes mellitus with coexisting hypertension. Front. Endocrinol. 2023, 14, 1173402. [Google Scholar] [CrossRef]
- Chen, T.C.T.; Wu, H.C.; Chiu, M.C. A deep neural network with modified random forest incremental interpretation approach for diagnosing diabetes in smart healthcare. Appl. Soft Comput. 2024, 152, 111183. [Google Scholar] [CrossRef]
- Wang, Y.C.; Chen, T.C.T.; Chiu, M.C. A systematic approach to enhance the explainability of artificial intelligence in healthcare with application to diagnosis of diabetes. Healthc. Anal. 2023, 3, 100183. [Google Scholar] [CrossRef]
- Oguntibeju, O.O. Type 2 diabetes mellitus, oxidative stress and inflammation: Examining the links. Int. J. Physiol. Pathophysiol. Pharmacol. 2019, 11, 45–52. [Google Scholar]
- Lekha, S.; Suchetha, M. A novel 1-D convolution neural network with SVM architecture for real-time detection applications. IEEE Sens. J. 2017, 18, 724–731. [Google Scholar] [CrossRef]
- Weng, X.; Li, G.; Liu, Z.; Liu, R.; Liu, Z.; Wang, S.; Chang, Z. A preliminary screening system for diabetes based on in-car electronic nose. Endocr. Connect. 2023, 12, e220437. [Google Scholar] [CrossRef]
- Bhaskar, N.; Bairagi, V.; Boonchieng, E.; Munot, M.V. Automated detection of diabetes from exhaled human breath using deep hybrid architecture. IEEE Access 2023, 11, 51712–51722. [Google Scholar] [CrossRef]


| Sensor | Target Gases | Detection Range of Target Gas | Environment Condition Working |
|---|---|---|---|
| MQ-2 | H2, LPG, CH4, CO, Alcohol, Propane, Air | 200–10,000 ppm CO | Temperature: −10–50 °C RH: less than 95% Standard detecting condition: 20 °C ± 2 °C temperature, 65 ± 5% humidity |
| MQ-3 | Alcohol, Benzine, CH4, Hexane, LGP, CO, Air | 0.1–10 mg/L Alcohol | |
| MQ-7 | H2, CO, LPG, CH4, Alcohol, Air | 50–4000 ppm CO | |
| MQ-135 | CO2, Alcohol, Air, NH4, Toluene, Acetone, CO | 0–200 ppm Acetone | |
| MQ-138 | Benzene, CO, CH4, n-Hexane, Alcohol, Propane, Air | 200–10,000 ppm Benzene | |
| DHT-22 | Temperature, Relative Humidity | −40 °C–80 °C Temperature, 0–100% Relative Humidity | Temperature: 0–50 °C RH: 0–100% |
| MICS-5524 | CO, VOCs, C2H6OH, H2, NH3, CH4 | 1–1000 ppm VOCs | Temperature: 23 °C ± 5 °C RH: less than 95% |
| Model | Accuracy | Precision | Recall | F1-Score | ROC AUC | MCC |
|---|---|---|---|---|---|---|
| Ensemble model (Random Forest + Gradient Boosting) | 98.86 ± 1.97 | 99.07 ± 1.60 | 98.81 ± 2.06 | 98.87 ± 1.96 | 1.000 ± 0.0 | 98.36 ± 2.84 |
| Random Forest | 98.85 ± 1.63 | 98.99 ± 1.43 | 98.77 ± 1.75 | 98.82 ± 1.67 | 1.000 ± 0.0 | 98.33 ± 2.37 |
| Gradient Boosting | 98.85 ± 1.63 | 98.99 ± 1.43 | 98.77 ± 1.75 | 98.82 ± 1.67 | 1.000 ± 0.0 | 98.33 ± 2.37 |
| AdaBoost | 98.85 ± 1.63 | 98.99 ± 1.43 | 98.77 ± 1.75 | 98.82 ± 1.67 | 0.9938 ± 0.0087 | 98.33 ± 2.37 |
| LightGBM | 97.70 ± 3.25 | 97.65 ± 3.32 | 97.65 ± 3.32 | 97.65 ± 3.32 | 0.9988 ± 0.0017 | 96.55 ± 4.88 |
| SVM | 96.55 ± 2.82 | 97.14 ± 2.27 | 96.42 ± 3.03 | 96.49 ± 2.94 | 0.9988 ± 0.0017 | 95.08 ± 3.98 |
| CatBoost | 95.40 ± 4.30 | 96.13 ± 3.56 | 95.06 ± 4.62 | 95.06 ± 4.71 | 1.000 ± 0.0 | 93.48 ± 6.03 |
| Extratrees | 94.25 ± 1.63 | 95.29 ± 1.19 | 94.07 ± 1.60 | 94.17 ± 1.62 | 1.000 ± 0.0 | 91.84 ± 2.22 |
| KNN | 94.25 ± 1.63 | 95.29 ± 1.19 | 94.07 ± 1.60 | 94.17 ± 1.62 | 0.9731 ± 0.0227 | 91.84 ± 2.22 |
| XGBoost | 94.25 ± 5.86 | 95.29 ± 4.69 | 93.95 ± 6.35 | 93.69 ± 6.70 | 1.000 ± 0.0 | 91.97 ± 8.08 |
| Logistic Regression | 90.80 ± 1.63 | 92.17 ± 1.91 | 90.62 ± 1.43 | 90.64 ± 1.54 | 0.9896 ± 0.005 | 86.90 ± 2.43 |
| Model | Class | Precision | Recall | F1-Score |
|---|---|---|---|---|
| Random Forest + Gradient Boosting | Healthy | 100 ± 0.00 | 100 ± 0.00 | 100 ± 0.00 |
| Prediabetes | 100 ± 0.00 | 97.55 ± 0.05 | 98.41± 0.02 | |
| Diabetes | 97.55 ± 0.05 | 100 ± 0.00 | 98.41± 0.02 | |
| Random Forest | Healthy | 100 ± 0.00 | 100 ± 0.00 | 100 ± 0.00 |
| Prediabetes | 100 ± 0.00 | 96.30 ± 5.24 | 98.04 ± 2.77 | |
| Diabetes | 96.97 ± 4.29 | 100 ± 0.00 | 98.41 ± 2.24 | |
| Gradient Boosting | Healthy | 100 ± 0.00 | 100 ± 0.00 | 100 ± 0.00 |
| Prediabetes | 100 ± 0.00 | 96.30 ± 5.24 | 98.04 ± 2.77 | |
| Diabetes | 96.97 ± 4.29 | 100 ± 0.00 | 98.41 ± 2.24 | |
| AdaBoost | Healthy | 100 ± 0.00 | 100 ± 0.00 | 100 ± 0.00 |
| Prediabetes | 100 ± 0.00 | 96.30 ± 5.24 | 98.04 ± 2.77 | |
| Diabetes | 96.97 ± 4.29 | 100 ± 0.00 | 98.41 ± 2.24 | |
| LightGBM | Healthy | 100 ± 0.00 | 100 ± 0.00 | 100 ± 0.00 |
| Prediabetes | 96.67 ± 4.71 | 96.67 ± 4.71 | 96.67 ± 4.71 | |
| Diabetes | 96.30 ± 5.24 | 96.30 ± 5.24 | 96.30 ± 5.24 | |
| SVM | Healthy | 94.44 ± 7.86 | 100 ± 0.00 | 96.97 ± 4.29 |
| Prediabetes | 96.97 ± 4.29 | 92.59 ± 10.48 | 94.25 ± 5.15 | |
| Diabetes | 100 ± 0.00 | 96.67 ± 4.71 | 98.25 ± 2.48 | |
| CatBoost | Healthy | 94.44 ± 7.86 | 100 ± 0.00 | 96.97 ± 4.29 |
| Prediabetes | 96.97 ± 4.29 | 88.89 ± 15.71 | 91.75 ± 8.53 | |
| Diabetes | 96.97 ± 4.29 | 96.30 ± 5.24 | 96.45 ± 2.55 | |
| ExtraTrees | Healthy | 94.44 ± 7.86 | 100 ± 0.00 | 96.97 ± 4.29 |
| Prediabetes | 91.41 ± 6.81 | 92.59 ± 10.48 | 91.22 ± 3.17 | |
| Diabetes | 100 ± 0.00 | 89.63 ± 8.18 | 94.34 ± 4.54 | |
| KNN | Healthy | 94.44 ± 7.86 | 100 ± 0.00 | 96.97 ± 4.29 |
| Prediabetes | 91.41 ± 6.81 | 92.59 ± 10.48 | 91.22 ± 3.17 | |
| Diabetes | 100 ± 0.00 | 89.63 ± 8.18 | 94.34 ± 4.54 | |
| XGBoost | Healthy | 94.44 ± 7.86 | 96.67 ± 4.71 | 95.22 ± 3.73 |
| Prediabetes | 96.97 ± 4.29 | 85.19 ± 2.09 | 88.89 ± 1.25 | |
| Diabetes | 94.44 ± 7.86 | 100 ± 0.00 | 96.97 ± 4.29 | |
| Logistic Regression | Healthy | 94.44 ± 7.86 | 100 ± 0.00 | 96.97 ± 4.29 |
| Prediabetes | 86.25 ± 9.93 | 89.26 ± 9.09 | 86.72 ± 0.75 | |
| Diabetes | 95.83 ± 5.89 | 82.59 ± 12.71 | 88.24 ± 8.32 |
| Study | Best Classifier Model | Dataset Type (Real or Artificial) | Year | Accuracy (%) | Precision (%) | Recall (%) | F1-Scores (%) | Multiclass |
|---|---|---|---|---|---|---|---|---|
| Lekha S. et al. [43] | 1D-CNN with SVM | Real: 26 individuals | 2018 | 98 | 98 | 99 | 98 | No |
| Paleczek A. et al. [23] | XGBoost | Artificial breath simulations | 2021 | 99 | 97.9 | 100 | 97.4 | No |
| Weng X. et al. [44] | Random Forest | Real: 240 individuals | 2023 | 93.33 | 97.05 | 89.9 | 92.8 | No |
| Zaim O. et al. [24] | SVM-DFA | Real: 60 individuals | 2023 | 93.75 | - | - | - | No |
| Bhaskar N. et al. [45] | CORNN with SVM | Real: 152 individuals | 2023 | 98 | 97 | 98.5 | 97.8 | No |
| Gudiño-Ochoa A. et al. [21] | XGBoost | Real: 44 individuals | 2024 | 95 | 95 | 95 | 95 | No |
| Kapur R. et al. [26] | GBoost-XGBoost (Ensemble) | Real: 492 individuals | 2024 | 95.8 | 96.9 | - | 96.1 | No |
| Gudiño-Ochoa A. et al. [28] | Random Forest | Artificial: 14,000 samples (from 58 individuals) | 2024 | 94 | 93 | 92.5 | 91 | No |
| This study | Random Forest + Gradient Boosting (Ensemble) | Real: 58 individuals (87 w/SMOTE) | 2025 | 98.86 | 99.07 | 98.81 | 98.87 | Yes |
Disclaimer/Publisher’s Note: The statements, opinions and data contained in all publications are solely those of the individual author(s) and contributor(s) and not of MDPI and/or the editor(s). MDPI and/or the editor(s) disclaim responsibility for any injury to people or property resulting from any ideas, methods, instructions or products referred to in the content. |
© 2025 by the authors. Licensee MDPI, Basel, Switzerland. This article is an open access article distributed under the terms and conditions of the Creative Commons Attribution (CC BY) license (https://creativecommons.org/licenses/by/4.0/).
Share and Cite
Gudiño-Ochoa, A.; García-Rodríguez, J.A.; Ochoa-Ornelas, R.; Ruiz-Velazquez, E.; Uribe-Toscano, S.; Cuevas-Chávez, J.I.; Sánchez-Arias, D.A. Non-Invasive Multiclass Diabetes Classification Using Breath Biomarkers and Machine Learning with Explainable AI. Diabetology 2025, 6, 51. https://doi.org/10.3390/diabetology6060051
Gudiño-Ochoa A, García-Rodríguez JA, Ochoa-Ornelas R, Ruiz-Velazquez E, Uribe-Toscano S, Cuevas-Chávez JI, Sánchez-Arias DA. Non-Invasive Multiclass Diabetes Classification Using Breath Biomarkers and Machine Learning with Explainable AI. Diabetology. 2025; 6(6):51. https://doi.org/10.3390/diabetology6060051
Chicago/Turabian StyleGudiño-Ochoa, Alberto, Julio Alberto García-Rodríguez, Raquel Ochoa-Ornelas, Eduardo Ruiz-Velazquez, Sofia Uribe-Toscano, Jorge Ivan Cuevas-Chávez, and Daniel Alejandro Sánchez-Arias. 2025. "Non-Invasive Multiclass Diabetes Classification Using Breath Biomarkers and Machine Learning with Explainable AI" Diabetology 6, no. 6: 51. https://doi.org/10.3390/diabetology6060051
APA StyleGudiño-Ochoa, A., García-Rodríguez, J. A., Ochoa-Ornelas, R., Ruiz-Velazquez, E., Uribe-Toscano, S., Cuevas-Chávez, J. I., & Sánchez-Arias, D. A. (2025). Non-Invasive Multiclass Diabetes Classification Using Breath Biomarkers and Machine Learning with Explainable AI. Diabetology, 6(6), 51. https://doi.org/10.3390/diabetology6060051