Article

Utility of Flash Glucose Monitoring to Determine Glucose Variation Induced by Different Doughs in Persons with Type 2 Diabetes

1
Diabetology Operative Unit, After Asl Gallura.P.O. San Giovanni di Dio Via a. Moro, 07026 Olbia, Italy
2
Department of Biomedical Sciences, University of Sassari, 07100 Sassari, Italy
3
Mediterranean Center for Disease Control, 07100 Sassari, Italy
*
Author to whom correspondence should be addressed.
Diabetology 2024, 5(1), 129-140; https://doi.org/10.3390/diabetology5010010
Submission received: 12 January 2024 / Revised: 1 March 2024 / Accepted: 7 March 2024 / Published: 12 March 2024
(This article belongs to the Special Issue Feature Papers in Diabetology 2023)

Abstract

:
(1) Background: It has been previously shown that sourdough bread, compared to commercial yeast bread, elicits a lower postprandial glycemic and insulinemic response in patients with impaired glucose tolerance (IGT). Aims: Our aim was to evaluate the following aspects in persons with type 2 diabetes (T2DM): (1) glucose variations induced by three different doughs: X = bread prepared with functional alkaline biocrystal water, Y = sourdough-leavened bread, and W = bakery yeast bread; (2) the utility of flash glucose monitoring (FGM) to measure GL. (2) Methods: Twelve T2DM following diets (six males, diabetes duration 10.9 ± 1.3 years with no complications, Hba1c < 7.0%), after 12 h of fasting, consumed 180 g of the study breads leavened/matured for 48 (X), 8 (Y), and 4 h (W) at room temperature with 200 mL of water, in a random order, in single-blind conditions, on three different days. All patients had FGM running for the entire period of the experiments. Insulin was determined by capillary blood obtained for the basal and peak glucose concentrations. (3) Results: The peak glucose and peak insulin concentrations were significantly (p < 0.05) higher for W versus both X and Y, without significant differences between X and Y. The area under the curve of glucose variations for over 240 min was significantly higher in W than X (p < 0.01) and Y (p < 0.05), without significant differences between X and Y. (4) Conclusions: (1) Bread prepared with biocrystal water has the same lower GL of sourdough bread compared to bakery yeast bread, and it is easier to manage its leavening/maturation period; (2) FGM is a reliable method for determining rapid glucose changes in response to a carbohydrate meal in persons with type 2 diabetes.

1. Introduction

Bread is one of the most relevant sources of carbohydrates, not only in the Mediterranean diet. Bread has a high glycemic index (GI) [1,2], inducing a faster exposure to glucose over time, but it is the actual content of carbohydrates that drives a longer exposure to glucose, the so-called glucose load (GL). In other words, the GI is a ranking of how quickly a food raises blood sugar, while the GL takes into account the GI and the amount of carbohydrate in a serving. The GL is then a measure of the total impact of that kind of food on blood sugar levels, and it is calculated by multiplying the GI by the amount of carbohydrate in a serving, as clearly indicated by different online calculators such as www.omnicalculator.com/health/glycemic-load (accessed on 10 July 2020). An example is given by watermelon, which has a GI of 79 (moderately high), but, in a normal serving, the GL is only 4, since it is mostly water. A reduction in the GL is considered favorable to health in diabetic or pre-diabetic persons in which a high GL is responsible for a greater and longer increase in postprandial glycemia associated with cardiovascular disease [3,4,5,6]. In non-diabetic subjects, high-GL food may be associated with cancer [7] or with Nonalcoholic Fatty Liver Disease [8], particularly in the presence of insulin resistance. The possible beneficial effects obtained in long-term interventions in which low-GL food is administered are highlighted by the decrease in fasting insulin and pro-inflammatory markers such as C-reactive protein, which are proven to be linked with obesity-associated diseases [9]. Several studies have shown that the sourdough fermentation of wheat flour dough significantly decreases the glucose load of bread, since the starch has a reduced amount of glucose [10,11,12]. In addition to the sourdough fermentation of wheat flour, to date, different strategies to reduce the GL of bread have been evaluated, but the preparation of most of these breads is very difficult and not applicable in real life, reducing the possibility of preparing bread with a low GL for the entire population. Preparing bread with low salt content has become a nearly-zero-cost intervention directed toward the whole population; it can reduce salt intake and reduce the spread of hypertension and cardiovascular risk in the population [13]. In the same direction, the adoption of a low-GL bread by the entire population might be also an additional strategy for a significant reduction in cardiovascular disease in the population. This goal is achievable if the bread can be prepared with timeliness and costs favorable to bakers.
Continuous subcutaneous glucose monitoring (CGM) is now widely accepted as an alternative means to conventional finger-prick tests for measuring glucose levels in individuals with diabetes mellitus, particularly those who utilize intensive insulin treatment [14,15,16]. Flash glucose monitoring (FGM) is a wireless method that uses a sensor to monitor interstitial fluid glucose functioning as a hybrid between blood glucose measurement with a glucometer (SMBG) and CGM. Patients can obtain near-real-time glucose levels without finger pricks by regularly scanning the sensor. FGM has been proven to be an economical alternative to CGM [17,18]. More than 99.9% of the interstitial glucose measurements by FGM and capillary glucose pairs are within the combined zones of A and B of the consensus and Clarke error grids [19,20].
Recently, we become aware of a particular kind of bread with a long maturation/fermentation time (between 24 and 48 h) at room temperature, the dough of which is prepared with functional alkaline (biocrystal) water at pH 9.0, which has glucose/fructose content some 10 times lower than usual bread.
In the light of these considerations, the two aims of this work were as follows:
(1)
To compare the GL of the dough prepared with functional alkaline (biocrystal) water (X) against one prepared with “mother” yeast, sourdough-leavened bread (Y), and one prepared with a commercial rapid leavening dough, bakery yeast bread (W), in persons with type 2 diabetes (T2DM);
(2)
To investigate the utility of FGM to measure rapid glucose changes after a GL in T2DM.

2. Patients and Methods

This work has been carried out in accordance with The Code of Ethics of the World Medical Association [1964 Declaration of Helsinki and its later amendments] for experiments involving humans. The study was approved by the local Ethics Committee on 14 July 2020 (NP 248/2020/CE), and informed consent was obtained from each participant.

2.1. Patients

Twelve type 2 persons with diabetes (T2DM, Table 1) in good metabolic control without drug therapy, regularly attending our Diabetology Operative Unit, were enrolled in the study after informed consent was obtained. Female patients had been in physiological menopause for at least two years. Patients did not have evidence of celiac disease or gluten intolerance.
Patients were randomly offered 180 g of three different breads prepared in the form of “focaccia”, cooked on the morning of the experiment, with 200 mL of still water at 08:00 a.m. after at least 10 h of fasting. The bread was consumed within 15 min, and during the test, participants remained seated quietly for the entire observation period of 240 min. All subjects followed a standard normal-caloric balanced diet (57% carbohydrates with <10% simple carbohydrates, 25% fat with <10% saturated fat, 18% protein, salt < 6 g per day, fibres 16 g/1000 Kcal) at least three weeks before starting the study and maintained it thoroughout the entire observation period. In detail, they ate the same dinner the evening before the entire observation period for the different tests. Patients were asked to maintain the same usual physical activity during the experimental period.
All patients had FGM running (FreeStyle Libre ® from Abbott, Chicago, IL, USA) from at least 24 h before the first test day and expiring at least 24 h after the third test day. Blood samples for serum insulin and blood glucose were collected basally and at the peak glucose concentration, as determined by FGM measurements being in stable phases. All subjects ate the different breads on three different occasions that were three/four days apart.

2.2. Study Breads

The three different types of bread with standardized compositions and fermentation/maturation times at room temperature are described in Table 2.
The biocrystal alkaline water used in this study was functional alkaline water, obtained through purification with ceramics with trace elements, antioxidants, ionization, and hydrogenation. Specifically, the water was initially micro-filtered through activated carbon and then, through a process of reverse osmosis, the pure osmotic water passed through a system of bioceramics and semi-precious metals (tourmaline, zeolite, hematite), becoming alkaline functional water at pH 9.0 (www.biocrystalacquaalcalina.com/acqua-biocrystal, accessed on 20 March 2021).

2.3. Isolation of Microbial Flora by Culture-Dependent Microbiological Analysis

To determine the presumptive lactic acid bacteria [LAB] in the three dough samples (X, Y, and W), 10 g of each dough was mixed with 40 mL of sterile NaCl solution (0.9% weight/volume) and homogenized in a classic blender. Tenfold dilution series for each suspension were made, and 100 μL of each dilution was plated in triplicate on de Man–Rogosa–Sharpe (MRS) agar medium (Biolife, Bellingham, WA, USA), supplemented with 10 mg/L of cycloheximide (Sigma-Aldrich, St. Louis, MO, USA, Merck, Rahway, NJ, USA) and in Luria Bertani (LB) agar (Sigma-Aldrich, Merck) medium. All plates were incubated at 30 °C for 48 h. The procedures were performed in triplicate. Up to 50 colonies were then randomly picked from the lowest countable dilutions and were grown in 5 mL of MRS broth (Biolife) at 30 °C for 24 h.

2.4. Bacterial Identification by MALDI-TOF Mass Spectrometry

Isolated bacteria were identified by MALDI-TOF mass spectrometry according to the “direct colony extraction technique” [21]. Briefly, a small portion of a single colony was directly smeared as a thin film onto a target plate (VITEK® MS-DS SLIDE, Biomerieux, Marcy-l’Étoile, France), using a 1 μL loop (performed in two spots for each strain), immediately followed by the addition of 1 μL of α-cyano-4-hydroxycinnamic acid (VITEK MS-CHCA, BioMerieux) for each sample spot. The samples were allowed to dry at room temperature before MS analysis [22]. To calibrate the mass spectrometer, the E. coli ATCC 8739 strain was inoculated on the central spot of the target slide, useful for every acquisition group. Matrix solution (α-cyano-4-hydroxycinnamic acid, BioMérieux) was also tested alone as a negative control. For the analysis, each spot was irradiated with 500 laser shots at 50 Hz, and spectra were acquired (mass range of 2 to 20 kDa in the linear model). Identification results were obtained by transferring the data from the Vitek acquisition station to the Vitek MS analysis server. Confidence values for each tested strain were calculated using the software MK2/2020. According to the manufacturer, values between 60.0 and 99.9 indicated the reliable discrimination of species or species groups [23].

2.5. Glucose and Insulin Determinations during the Study

During the three test days, participants performed manual scanning of the sensor every 5 min after eating to identify the peak glucose concentration. The analysis of the graph obtained during the 4-h study allowed the calculation of the area under the curve (AUC) of glucose variations after the bread was eaten (Figure 1).
This was obtained with Excel using the trapezoidal formula, dividing the 240-min experiment into 5-min intervals. During the study, serum samples were collected by finger pricks for blood glucose and insulin determination at the basal concentration, before eating the bread, and at the peak blood glucose concentration, as determined by the “flat” position of the arrow in the FGM display. The first blood drop from the finger prick was used to determine blood glucose (blood glucose readings were performed on the built-in meter free style® glucometer, Abbott, used to scan interstitial glucose variations over time), while an additional 8–10 drops were collected in a conical 1.0 mL Eppendorf vial and centrifuged for 20 min at 4000 rpm with a refrigerated Eppendorf centrifuge, 5427R, and the supernatant was stored at −20 °C until it was assayed for insulin determination. Insulin was determined in all twelve T2DM for the three different test days in the same assay using a sandwich immunological test based on the principle of chemiluminescence (LIAISON Insulin kit; DiaSorin, Saluggia, Italy). Briefly, 100 μL of serum was diluted with 210 μL of the LIASON Endocrinology Diluent buffer, and after being mixed well, 150 μL of the mixture was used to determine insulin concentrations. All samples were assayed in duplicate. The assay was not affected by hemoglobin values up to 1000 mg/dL, and the analytical sensitivity was 0.5 μIU/mL. The evaluation of serum insulin response along with the glycemic one is more effective in characterizing glucose metabolism impairment [24,25].

2.6. Statistical Analysis

The sample size was calculated based on preliminary data and considering a minimum power of 80% (type-II error, 1-beta), 5% of significance (alpha: 0.05), and a medium effect size (f = 0.25), using Gpower software(GH/2021). Descriptive summary statistics for continuous data numbers, means, and standard errors of the mean (SEMs) were performed for all measurements. Multiple linear regression analysis was used to determine the predictors of significance at the determined points (from 0 to 240 min at 30-min intervals for interstitial glucose variation during the three test days). ONE-way ANOVA was used to compare data at the single time points during the bread load, and T-Student’s test for paired data was applied when appropriate. p values ≤ 0.05 were considered statistically significant. All statistics were performed with the SPSS software package V28 for Windows.

3. Results

3.1. Bread Characterisation

The three different kinds of bread were highly different in terms of glucose/fructose and lactic acid composition. Both the functional alkaline water bread and sourdough-leavened bread had a similar low concentration of glucose/fructose, which was somehow 10–15 times lower than the bakery yeast bread, while the sourdough-leavened bread was richer in lactic acid (Table 3).
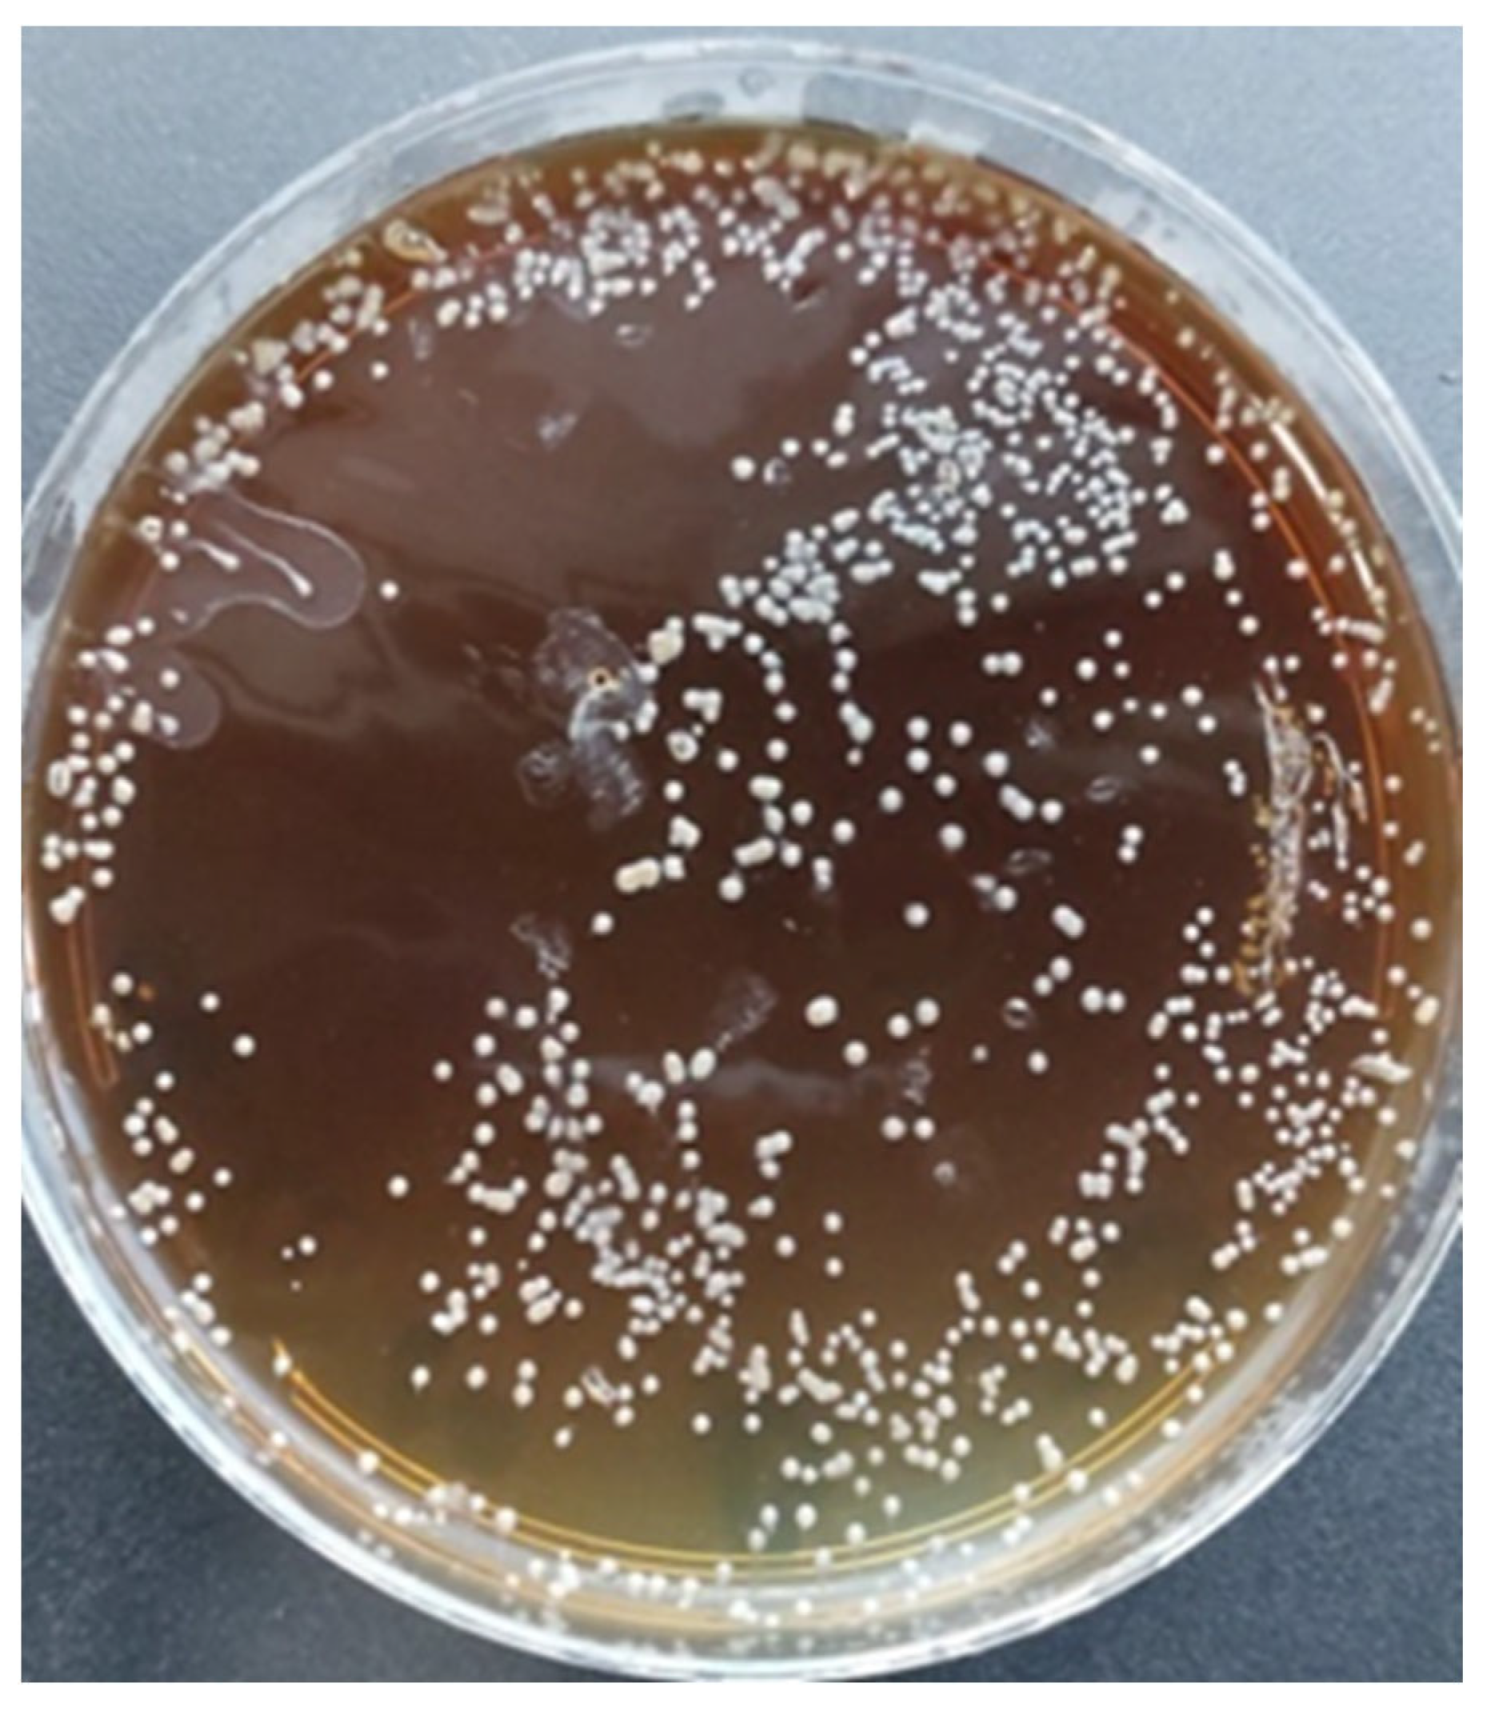
Microbiological analysis showed the absence of bacterial growth on the plates belonging to the X and W doughs, while 100% of the colonies isolated from the plates of the sourdough (Y) dough belonged to Pediococcus parvulus. The absence of contamination was confirmed by the absence of bacterial growth on LB agar plates plated with suspensions of each dough.

3.2. Effect of the Different Bread Doughs on Interstitial Glucose, Capillary Blood Glucose, and Serum Insulin

Absolute changes (delta values) in interstitial glucose at 30-min intervals for all the observational periods were significantly higher with the bakery yeast bread (W) than the sourdough-leavened bread (Y) and functional alkaline water bread (X) after 60 min (p < 0.05 and p < 0.01, respectively), 90 min (p < 0.05 and p < 0.01, respectively), and 180 min (p < 0.01 for both). The peak glucose concentration was anticipated at 90′ with W compared to Y and X (120′ for both) (Figure 2).
The AUC of interstitial glucose as determined by Libre FGM in the period of 0–240 min was significantly higher with bakery yeast bread (W) in comparison to the other two tested breads, without a significant difference between these last two (Table 4). The interstitial glucose at time 0 and the peak glucose concentration were not significantly different from what was obtained when measuring blood glucose in the three different test days (Table 4). The delta peak blood glucose was significantly lower in the functional alkaline water bread and sourdough-leavened bread as compared to the bakery yeast bread (p < 0.05). No significant differences were evident for basal insulin in the three test days, while the insulin at peak glucose was significantly higher in the bakery yeast bread as compared to the functional alkaline water bread (p < 0.05) and sourdough-leavened bread (p < 0.05), without significant differences between the last two (Table 4).
No significant changes in the baseline anthropometric and biochemical data were present at the end of the three experimental days in the twelve T2DM. AGP reports were downloaded at the end of the 14 days, with either the mean glucose concentration (7.0 ± 0.1 mmol/L), the glucose management index (42 ± 1.3 mmol/L), or the time in range—TIR (80 ± 3.4%) confirming the good metabolic control of the twelve T2DM during the 14-day study period.
Additional material has been added at the end of the emanuscript (see Appendix A).

4. Discussion

A decreased postprandial glucose concentration induced by a low-GL diet is associated with a reduced risk for cardiovascular disease [26,27], particularly in persons with diabetes [28,29] and, likely, could help in preventing some forms of cancer [30,31]. In addition, low-carbohydrate [32,33,34] or low-GL diets [35,36] result in great weight loss over periods of 3–6 months and have a favorable effect on triglyceride and HDL cholesterol [37].
In this work, we analyzed the GL induced by three different breads, and we observed a significant decrease in GL induced by functional alkaline water bread and sourdough-leaved bread compared with bakery yeast bread. Although one limitation of this “acute” study is that the results cannot be transferred in the long term, these results suggest that the continuous use of these kinds of breads might be useful in reducing weight in overweight/obese T2DM when assumed chronically, with beneficial effects on both glycemic metabolic control and the reduction in cardiovascular risk. These results may encourage the commencement of long-term studies in this direction.
Interestingly, we also observed a reduction in postprandial blood glucose, a well-established cardiovascular risk factor in T2DM, with both the functional alkaline water and sourdough-leaved bread. Foods with high GI can result in an increase in blood glucose and insulin concentration in blood, whereas those with low GI do not have these effects [38], ultimately reducing the cardiovascular risk and diabetes onset in predisposed subjects.
In recent years, there has been an increased focus by food manufacturers on the use of low-glycemic products, replacing the sugars and starch in conventional food with ingredients such as alcohols, oligo- and polysaccharides, or glycerin. The effectiveness of added dietary fibers in reducing the GL of bread is controversial [39]. In addition, even if the inclusion of fibers or wholemeal flour in the production of bread can influence the glycemic response, the protocols to implement this method, to be effective, must consider the use of different technologies which are sometimes complicated to implement in practice [40]. Another method described for the reduction in GL in bread is the addition of beta glycans, [41], which effectively reduce GL, but their taste is not very pleasant and they are therefore not usable in practice. Other authors have suggested replacing breads with rice, potatoes, or hummus [42], but this option is difficult to apply to Mediterranean culture, where bread is one of the main sources of carbohydrates.
It has been reported that sourdough-leaved bread has a lower GI than commercial bread, due to the consumption of glucose by the enzymes of the lactobacilli bacterial and fungal flora of the dough “ mother”, improving glucose metabolism in healthy subjects [43]. This effect has been attributed mainly to the reduction in sugars and the presence of lactic acid. Previously, postprandial glycemic and insulinemic responses to a meal containing sourdough bread, compared to a reference meal containing leavened bread with yeast for bread making, in subjects with impaired glucose tolerance was evaluated [44]. A limitation of that study was that a 500-calorie mixed meal (100 g of bread, 200 mL of semi-skimmed milk, 15 g of glucose-free marmalade, 10 g of butter) containing 58% carbohydrates, 12% protein, and 30% lipids was used. The mixed meal might have altered the absorption of carbohydrates, making the interpretation of the data difficult.
In this study, we offered bread alone with a total of 480 calories to T2DM, and both the functional alkaline water and sourdough-leavened bread resulted in a lower AUC over the period of 240 min, together with a significantly lower increase in glucose at the predetermined 60, 90, and 180 min. Both kinds of breads had somehow 10–15-fold less simple sugar due to the consumption operated by lactobacilli in sourdough-leavened bread in a relatively short period and by yeasts operating for 48 h in functional alkaline water bread. The process of maturation in the functional water bread lasted between 24 and 48 h due to the fact that the starting pH was 9.0 and so remained ideal [pH 5.0] until the end of the maturation period. Without using the functional water, the pH of the dough would have rapidly gone below pH 3.0, making the dough inedible. Due to the similar results obtained with the two breads, we have hypothesized that the main driver of the reduction in glycemic response to the meal was the consumption of simple sugars more than the presence of lactic acid, although we cannot exclude the idea that the more complete maturation time obtained with the functional water bread might have influenced sugar absorption. Sourdough-leavened bread only had a significant amount of lactic acid, as expected by the presence of Pediococcus parvolus, a species belonging to lactic acid bacteria commonly associated with the fermentation process of wines and cider and recently found in sourdough of household origin [45].
Bakers and pizza makers choose to use rapid leavening dough since the use of “mother” yeast has very narrow margins of use, caused by the very tight fermentation/maturation time (between 6 and 8 h). This time affects the work activity of the baker, with repercussions on the final price and therefore causing a reduction in the possibility of spreading this type of dough to the general population. A much more flexible process that could foresee a leavening/maturation time with wider margins, between 24 and 48 h at room temperature, would clearly allow the baker to lower costs and therefore the increase the possibility of greater diffusion at the population level. We found no bacterial growth in our “functional” bread, indicating that the process of maturation/leaving for 48 h at room temperature is safe.
To the best of our knowledge, this is the first time that FGM has been used to determine glucose variations in response to different doughs in humans. We measured blood glucose and insulin by finger pricks at both basal and peak interstitial glucose concentrations in a moment when the two compartments were in equilibrium, with no significant differences between blood and interstitial glucose. On the other hand, using the plot of the curve of interstitial glucose variation over 240 min after eating the bread, we were able to calculate the AUC by the trapezoidal rule at 5-min intervals, giving a more precise calculation compared to what is usually determined at 30-min intervals. Using FGM, we were also able to observe the glucose patterns in the days before the three experiments and, in particular, the night before.
One limitation of this study is that the results cannot be transferred in the long term, being an “acute“study. Long-term population studies could favor the production of this kind of bread at the same cost as regular bread, allowing to diffuse it amongst the whole population, prioritizing the health of the general population with a “small coin for big numbers”. At present, we are trying to start this implementation in the local population.

5. Conclusions

(1)
Bread prepared with biocrystal water has the same low glycemic load of sourdough bread compared to traditional bread, and it enables the easier management of the leavening/maturation period.
(2)
FGM is a reliable method to determine the area under the curve during glycemic changes in response to a carbohydrate meal in persons with type 2 diabetes.

Author Contributions

M.A.T. and G.T. initiated and designed the study; M.A.T., G.T. and S.C. performed the experiments; V.M., G.C. and P.R. collected and performed the microbiological analysis; S.C. prepared the balanced diets for the twelve T2DM and performed insulin measurements; I.C. collected and analyzed the data; G.T. and M.A.T. analyzed and interpreted the data and wrote the initial draft of the manuscript. All authors critically reviewed the manuscript through the process and approved the final draft of the manuscript. All authors have read and agreed to the published version of the manuscript.

Funding

This research received no external funding.

Institutional Review Board Statement

“COMITATO BIOETICA ATS SARDEGNA” on 14 July 2020 (NP 248/2020/CE).

Informed Consent Statement

Informed consent was obtained from all subjects involved in the study.

Data Availability Statement

The raw data supporting the conclusions of this article will be made available by the authors on request.

Acknowledgments

We thank Fabrizio Contino, for sharing his idea regarding the functional biocrystal alkaline water and for preparing the different doughs. We thank JANASDIA (Associazione Scientifica Ricerca sul Diabete ONLUS, www.janasdia.com, accessed on 5 August 2021) for covering the expense of the insulin determinations, biochemical analyses, and FGM sensors for the patients.

Conflicts of Interest

The authors declare that they have no conflicts of interest.

Appendix A

Table A1. Randomization chart.
PatientSEXTest Day 1Test Day 2Test Day 3
1MXYW
2FXYW
3MXYW
4FWXY
5MWXY
6MWXY
7FYWX
8MYWX
9MYWX
10FWYX
11FYXY
12FXWW
M = male, F = female; X = functional alkaline water bread; Y = sourdough-leavened bread; W = bakery yeast bread. Tests were performed in single-blind conditions on three different days in random order, three days apart, over a period of two weeks.
Figure A1. Colonies of lactic acid bacteria obtained from sourdough-leavened bread dough sample (Y).
Diabetology 05 00010 g0a1
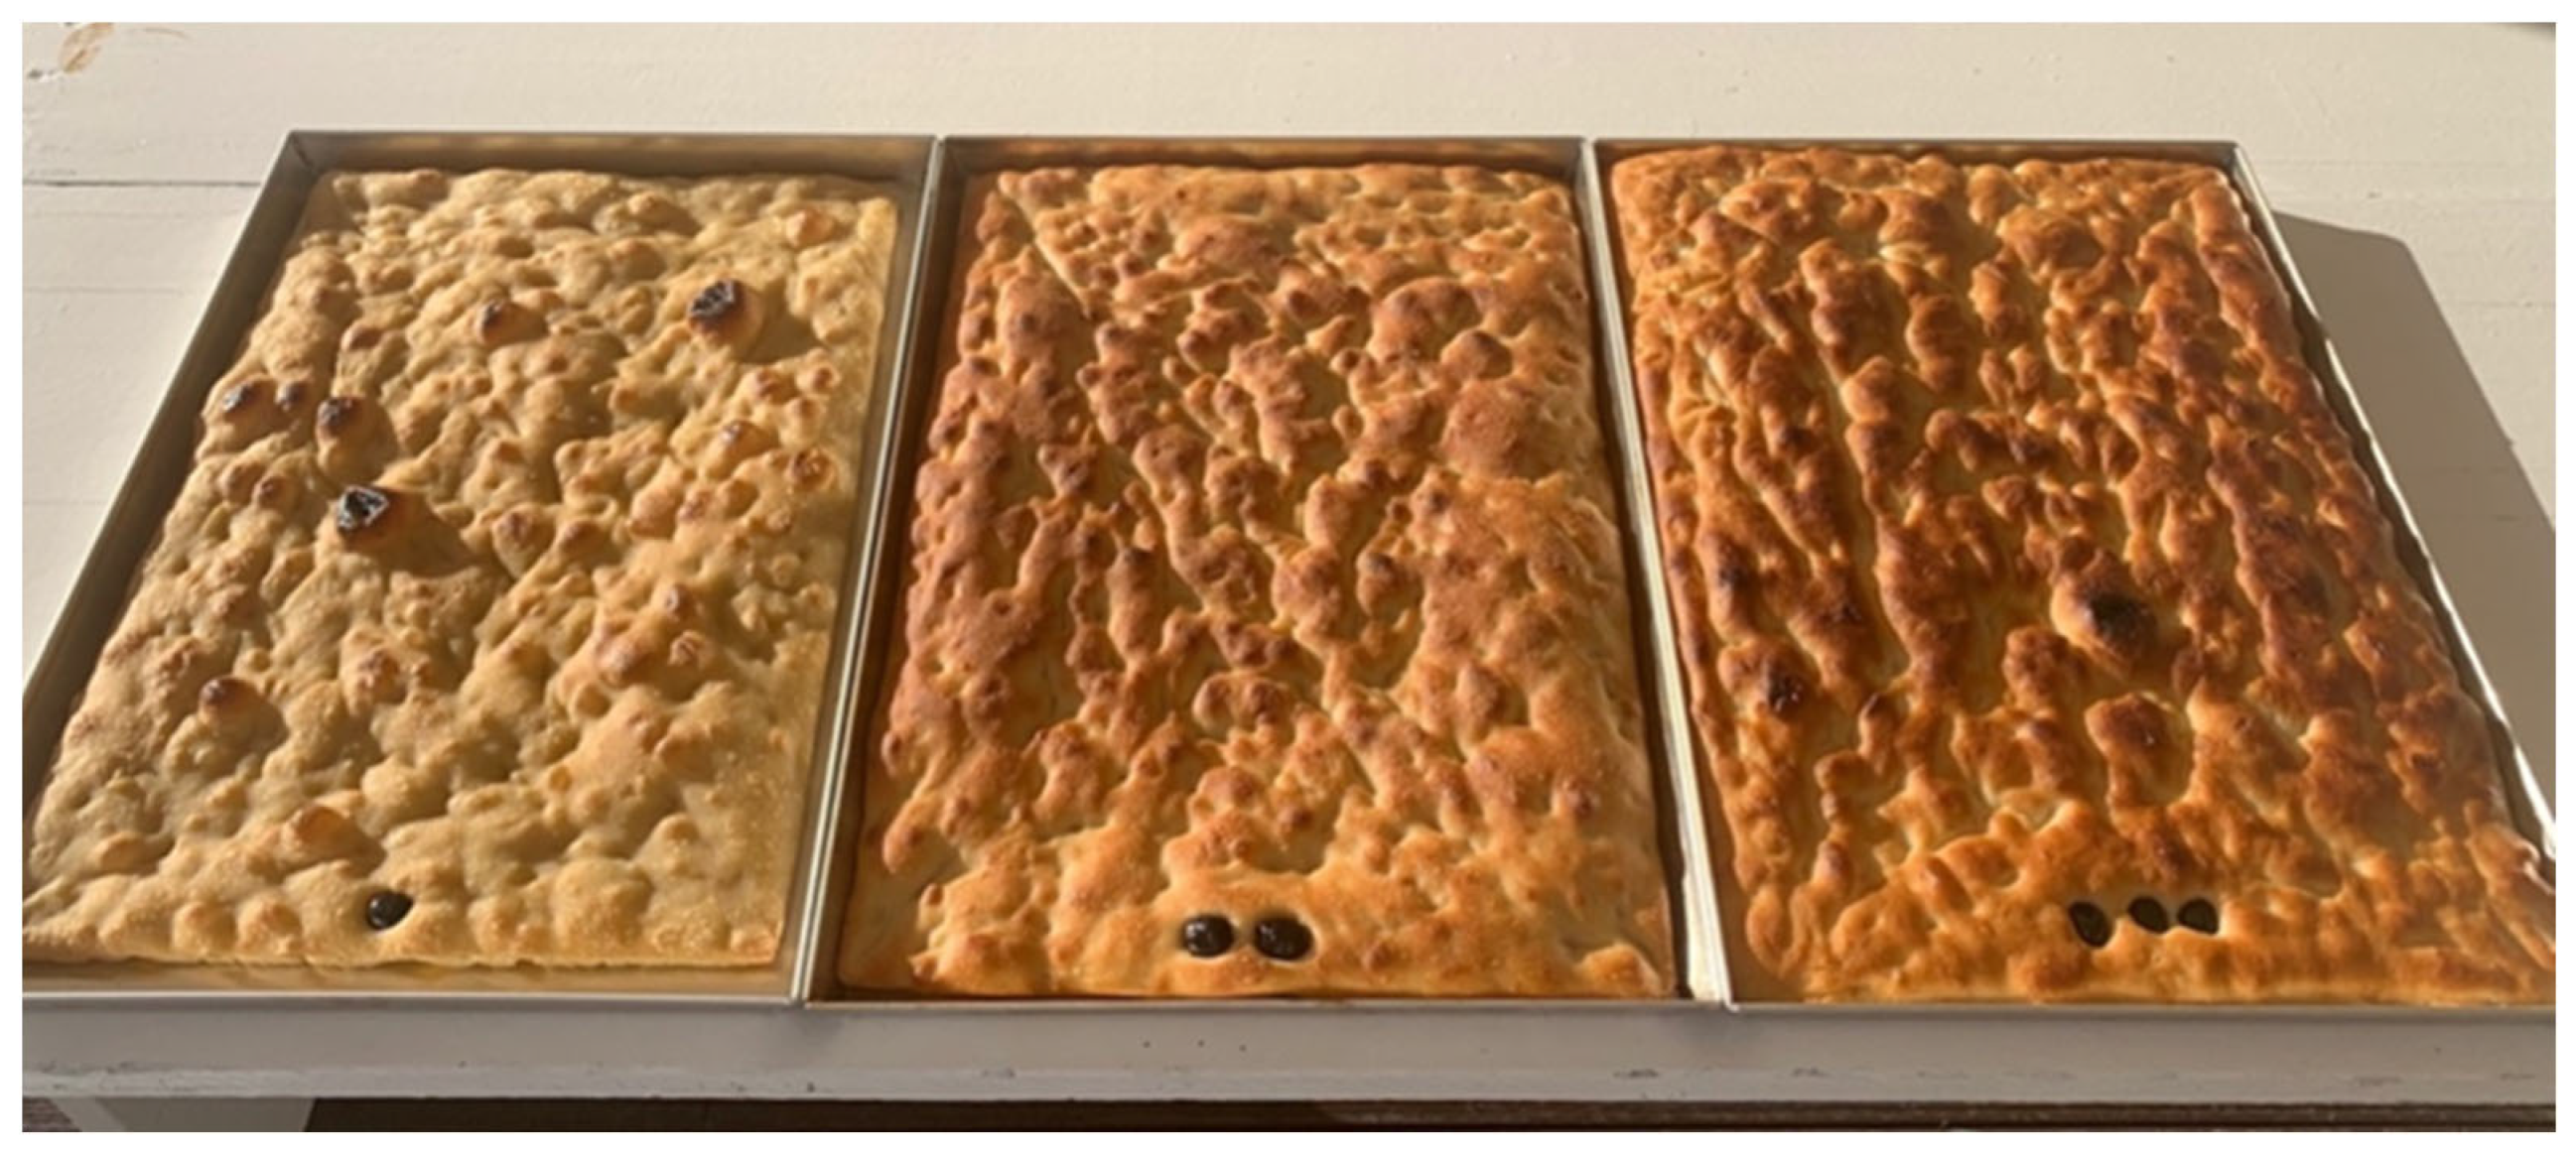
Figure A2. Appearance of the different types of bread after baking and immediately before serving. The three different types of bread as they were prepared for each session from left to right: functional alkaline water bread, sourdough-leavened bread, bakery yeast bread.
Diabetology 05 00010 g0a2
Table A2. Results from the 5-point hedonic scale for each sensorial attribute.
BreadSmellTaste ConsistencyAcceptance
Functional alkaline water bread3.9 ± 1.1 4.1 ± 1.14.4 ± 0.94.6 ± 0.5
Sourdough-leavened bread4.7 ± 0.4 *4.7 ± 0.44.7 ± 0.74.8 ± 0.3
Bakery yeast bread4.2 ± 1.24.3 ± 1.04.6 ± 0.74.7 ± 0.5
* p < 0.05 vs. functional alkaline water bread. To determine consumer acceptability, a simple 5-point hedonic scale questionnaire for each sensorial attribute (odor, taste, texture, and general acceptance during the test) was used, where 5 was the highest score (i.e., extremely positive = like very much) and 1 the lowest (i.e., extremely negative = dislike very much). No substantial differences in terms of the consumer acceptability of the three different bread were reported apart from smell.

References

  1. Jenkins, D.J.; Wolever, T.M.; Taylor, R.H.; Barker, H.; Fielden, H.; Baldwin, J.M.; Bowling, A.C.; Newman, H.C.; Jenkins, A.L.; Goff, D.V. Glycemic index of foods: A physiological basis for carbohydrate exchange. Am. J. Clin. Nutr. 1981, 34, 362–366. [Google Scholar] [CrossRef] [PubMed]
  2. Wolever, T.M.S.; Jenkins, D. The use of the glycemic index in predicting the blood glucose response to mixed meals. Am. J. Clin. Nutr. 1986, 43, 167–172. [Google Scholar] [CrossRef] [PubMed]
  3. Coutinho, M.; Gerstein, H.C.; Wang, Y.; Yusuf, S. Relationship between glucose and incident cardiovascular events. A metaregression analysis of published data from 20 studies of 95,783 individuals followed for 12.4 years. Diabetes Care 1999, 22, 233–240. [Google Scholar] [CrossRef] [PubMed]
  4. Levitan, E.B.; Song, Y.; Ford, E.S.; Liu, S. Is non diabetic hyperglycemia a risk factor for cardiovascular disease? A meta-analysis of prospective studies. Arch. Intern. Med. 2004, 164, 2147–2155. [Google Scholar] [CrossRef] [PubMed]
  5. Glucose tolerance and mortality: Comparison of WHO and American Diabetes Association diagnostic criteria. The DECODE study group.European Diabetes Epidemiology Group, Glucose tolerance and mortality: Comparison of WHO and American Diabetes Association diagnostic criteria. Diabetes Epidemiology: Collaborative analysis of Diagnostic criteria in Europe. Lancet 1999, 354, 617–621. [Google Scholar] [CrossRef]
  6. Vega-López, S.; Mayol-Kreiser, S.N. Use of the glycemic index for weight loss and glycemic control: A review of recent evidence. Curr. Diabetes Rep. 2009, 9, 379–388. [Google Scholar] [CrossRef]
  7. Zelenskiy, S.; Thompson, C.L.; Tucker, T.C.; Li, L. High dietary glycemic load is associated with increased risk of colon cancer. Nutr. Cancer 2014, 66, 362–368. [Google Scholar] [CrossRef]
  8. Parker, A.; Kim, Y. The Effect of Low Glycemic Index and Glycemic Load Diets on Hepatic Fat Mass, Insulin Resistance, and Blood Lipid Panels in Individuals with Nonalcoholic Fatty Liver Disease. Metab. Syndr. Relat. Disord. 2019, 17, 389–396. [Google Scholar] [CrossRef]
  9. Schwingshackl, L.; Hoffmann, G. Long-term effects of low glycemic index/load vs. high glycemic index/load diets on parameters of obesity and obesity-associated risks: A systematic review and meta-analysis. Nutr. Metab. Cardiovasc. Dis. 2013, 23, 699–706. [Google Scholar] [CrossRef]
  10. Capurso, A.; Capurso, C. The Mediterranean way: Why elderly people should eat wholewheat sourdough bread—A little known component of the Mediterranean diet and healthy food for elderly adults. Aging Clin. Exp. Res. 2020, 32, 1–5. [Google Scholar] [CrossRef]
  11. Sterr, Y.; Weiss, A.; Schmidt, H. Evaluation of lactic acid bacteria for sourdough fermentation of amaranth. Int. J. Food Microbiol. 2009, 136, 75–82. [Google Scholar] [CrossRef] [PubMed]
  12. Montemurro, M.; Coda, R.; Rizzello, C.G. Recent Advances in the Use of Sourdough Biotechnology in Pasta Making. Foods 2019, 8, 129. [Google Scholar] [CrossRef] [PubMed]
  13. Daugirdas, J.T. Potential importance of low-sodium bread and breakfast cereal to a reduced sodium diet. J. Ren. Nutr. 2013, 23, 1–3. [Google Scholar] [CrossRef] [PubMed]
  14. Cappon, G.; Vettoretti, M.; Sparacino, G.; Facchinetti, A. Continuous Glucose Monitoring Sensors for Diabetes Management: A Review of Technologies and Applications. Diabetes Metab. J. 2019, 43, 383–397. [Google Scholar] [CrossRef] [PubMed]
  15. Bailey, T.; Bode, B.W.; Christiansen, M.P.; Klaff, L.J.; Alva, S. The performance and usability of a factory-calibrated flash glucose monitoring system. Diabetes Technol. Ther. 2015, 17, 787–794. [Google Scholar] [CrossRef] [PubMed]
  16. Giani, E.; Macedoni, M.; Barilli, A.; Petitti, A.; Mameli, C.; Bosetti, A.; Cristiano, A.; Radovanovic, D.; Santus, P.; Zuccotti, G.V. Performance of the flash glucose monitoring system during exercise in youth with type 1 diabetes. Diabetes Res. Clin. Pract. 2018, 146, 321–329. [Google Scholar] [CrossRef] [PubMed]
  17. Blum, A. Freestyle Libre glucose monitoring system. Clin. Diabetes 2018, 36, 203–204. [Google Scholar] [CrossRef]
  18. Hayek, A.A.; Al Dawish, M.A. The Potential Impact of the FreeStyle Libre Flash Glucose Monitoring System on Mental Well-Being and Treatment satisfaction in patients with type 1 diabetes: A prospective study. Diabetes Ther. 2019, 10, 1239–1248. [Google Scholar] [CrossRef]
  19. Ji, L.; Guo, X.; Guo, L.; Ren, Q.; Yu, N.; Zhang, J. A multicenter evaluation of the performance and usability of a novel glucose monitoring system in Chinese adults with diabetes. J. Diabetes Sci. Technol. 2017, 11, 290–295. [Google Scholar] [CrossRef]
  20. Ang, E.; Lee, Z.X.; Moore, S.; Nana, M. Flash glucose monitoring [FGM]: A clinical review on glycaemic outcomes and impact on quality of life. J. Diabetes Its Complicat. 2020, 34, 107559. [Google Scholar] [CrossRef]
  21. Lévesque, S.; Dufresne, P.J.; Soualhine, H.; Domingo, M.-C.; Bekal, S.; Lefebvre, B.; Tremblay, C. A side by side comparison of Bruker Biotyper and VITEK MS: Utility of MALDI-TOF MS technology for microorganism identification in a public health reference laboratory. PLoS ONE 2015, 10, e0144878. [Google Scholar] [CrossRef] [PubMed]
  22. Westblade, L.F.; Jennemann, R.; Branda, J.A.; Bythrow, M.; Ferraro, M.J.; Garner, O.B.; Ginocchio, C.C.; Lewinski, M.A.; Manji, R.; Mochon, A.B.; et al. Multicenter study evaluating the Vitek MS system for identification of medically important yeasts. J. Clin. Microbiol. 2013, 51, 2267–2272. [Google Scholar] [CrossRef] [PubMed]
  23. Ghaith, D.; Zafer, M.M.; Hosny, T.; AbdElfattah, M. MALDI-TOF MS Overcomes Misidentification of the Uncommon Human Pathogen Candida famata by Routine Phenotypic Identification Methods. Curr. Microbiol. 2021, 78, 1636–1642. [Google Scholar] [CrossRef] [PubMed]
  24. Yari, Z.; Behrouz, V.; Zand, H.; Pourvali, K. New Insight into Diabetes Management: From Glycemic Index to Dietary Insulin Index. Curr. Diabetes Rev. 2020, 16, 293–300. [Google Scholar] [CrossRef]
  25. Matthews, D.R.; Hosker, J.P.; Rudenski, A.S.; Naylor, B.A.; Treacher, D.F.; Turner, R.C. Homeostasis model assessment: Insulin resistance and beta-cell function from fasting plasma glucose and insulin concentrations in man. Diabetologia 1985, 28, 412–419. [Google Scholar] [CrossRef] [PubMed]
  26. Liu, S.; Willett, W.C.; Stampfer, M.J.; Hu, F.B.; Franz, M.; Sampson, L.; Hennekens, C.H.; Manson, J.E. A prospective study of dietary glycemic load, carbohydrate intake and risk of coronary heart disease in US women. Am. J. Clin. Nutr. 2000, 71, 1455–1461. [Google Scholar] [CrossRef] [PubMed]
  27. Frost, G.; Leeds, A.A.; Dore, C.J.; Madeiros, S.; Brading, S.; Dornhorst, A. Glycaemic index as a determinant of serum HDL-cholesterol concentration. Lancet 1999, 353, 1045–1048. [Google Scholar] [CrossRef]
  28. Salmerón, J.; Ascherio, A.; Rimm, E.B.; A Colditz, G.; Spiegelman, D.; Jenkins, D.J.; Stampfer, M.J.; Wing, A.L.; Willett, W.C. Dietary fiber, glycemic load, and risk of NIDDM in men. Diabetes Care 1997, 20, 545–550. [Google Scholar] [CrossRef]
  29. Salmerón, J.; Manson, J.E.; Stampfer, M.J.; Colditz, G.A.; Wing, A.L.; Willett, W.C. Dietary fiber, glycemic load and risk of non-insulin dependent diabetes mellitus in women. JAMA 1997, 277, 472–477. [Google Scholar] [CrossRef]
  30. Augustin, L.S.A.; Dal Maso, L.; La Vecchia, C.; Parpinel, M.; Negri, E.; Vaccarella, S.; Kendall, C.W.C.; Jenkins, D.J.A.; Franceschi, S. Dietary glycemic index and glycemic load, and breast cancer risk: A case-control study. Ann. Oncol. 2001, 12, 1533–1538. [Google Scholar] [CrossRef]
  31. Higginbotham, S.; Zhang, Z.-F.; Lee, I.-M.; Cook, N.R.; Giovannucci, E.; Buring, J.E.; Liu, S. Women’s Health Study Dietary glycemic load and risk of colorectal cancer in the Women’s Health Study. J. Natl. Cancer Inst. 2004, 96, 229–233. [Google Scholar] [CrossRef] [PubMed]
  32. Foster, G.D.; Wyatt, H.R.; Hill, J.O.; McGuckin, B.G.; Brill, C.; Mohammed, B.S.; Szapary, P.O.; Rader, D.J.; Edman, J.S.; Klein, S. A randomized trial of a low-carbohydrate diet for obesity. N. Engl. J. Med. 2003, 348, 2082–2090. [Google Scholar] [CrossRef] [PubMed]
  33. Westman, E.C.; Yancy, W.S.; Edman, J.S.; Tomlin, K.F.; E Perkins, C. Effect of 6-Month Adherence to a Very Low Carbohydrate Diet Program. Am. J. Med. 2002, 113, 30–36. [Google Scholar] [CrossRef] [PubMed]
  34. Samaha, F.F.; Iqbal, N.; Seshadri, P.; Chicano, K.L.; Daily, D.A.; McGrory, J.; Williams, T.; Williams, M.; Gracely, E.J.; Stern, L. A low-carbohydrate as compared with a low-fat diet in severe obesity. N. Engl. J. Med. 2003, 348, 2074–2081. [Google Scholar] [CrossRef]
  35. Ebbeling, C.B.; Leidig, M.M.; Sinclair, K.B.; Hangen, J.P.; Ludwig, D.S. A reduced-glycemic load diet in the treatment of adolescent obesity. Arch. Pediatr. Adolesc. Med. 2003, 157, 773–779. [Google Scholar] [CrossRef] [PubMed]
  36. McMillan-Price, J.; Petocz, P.; Atkinson, F.; O’neill, K.; Samman, S.; Steinbeck, K.; Caterson, I.; Brand-Miller, J. Comparison of 4 diets of varying glycemic load on weight loss and cardiovascular risk reduction in overweight and obese young adults: A randomized controlled trial. Arch. Intern. Med. 2006, 166, 1466–1475. [Google Scholar] [CrossRef] [PubMed]
  37. Stern, L.; Iqbal, N.; Seshadri, P.; Chicano, K.L.; Daily, D.A.; McGrory, J.; Williams, M.; Gracely, E.J.; Samaha, F.F. The Effects of Low-Carbohydrate versus Conventional Weight Loss Diets in Severely Obese Adults: One-Year Follow-up of a Randomized Trial. Ann. Intern. Med. 2004, 140, 778–785. [Google Scholar] [CrossRef]
  38. Wolever, T.M.; Jenkins, D.J.; Jenkins, A.L.; Josse, R.G. The glycemic index: Methodology and clinical implications. Am. J. Clin. Nutr. 1991, 54, 846–854. [Google Scholar] [CrossRef]
  39. Scazzina, F.; Siebenhandl-Ehn, S.; Pellegrini, N. The effect of dietary fibre on reducing the glycaemic index of bread. Br. J. Nutr. 2013, 109, 1163–1174. [Google Scholar] [CrossRef]
  40. Korem, T.; Zeevi, D.; Zmora, N.; Weissbrod, O.; Bar, N.; Lotan-Pompan, M.; Avnit-Sagi, T.; Kosower, N.; Malka, G.; Rein, M.; et al. Bread Affects Clinical Parameters and Induces Gut Microbiome-Associated Personal Glycemic Responses. Cell Metab. 2017, 25, 1243–1253.e5. [Google Scholar] [CrossRef]
  41. Tessari, P.; Lante, A. A Multifunctional Bread Rich in Beta Glucans and Low in Starch Improves Metabolic Control in Type 2 Diabetes: A Controlled Trial. Nutrients 2017, 9, 297. [Google Scholar] [CrossRef]
  42. Augustin, L.S.A.; Chiavaroli, L.; Campbell, J.; Ezatagha, A.; Jenkins, A.L.; Esfahani, A.; Kendall, C.W.C. Post-prandial glucose and insulin responses of hummus alone or combined with a carbohydrate food: A dose—Response study. Nutr. J. 2016, 15, 13. [Google Scholar] [CrossRef]
  43. Ostman, E.M.; Elmståhl, H.G.M.L.; Björck, I.M.E. Barley Bread containing lactid acid improves glucose tolerance at a subsequent meal in healthy men and women. J. Nutr. 2002, 132, 1173–1175. [Google Scholar] [CrossRef]
  44. Maioli, M.; Pes, G.M.; Sanna, M.; Cherchi, S.; Dettori, M.; Manca, E.; Farris, G.A. Sourdough-leavened Bread Improves Postprandial Glucose and Insulin Plasma Levels in Subjects with Impaired Glucose Tolerance. Acta Diabetol. 2008, 45, 91–96. [Google Scholar] [CrossRef]
  45. Comasio, A.; Verce, M.; Van Kerrebroeck, S.; De Vuyst, L. Diverse Microbial Composition of Sourdoughs from Different Origins. Front. Microbiol. 2020, 11, 1212. [Google Scholar] [CrossRef] [PubMed]
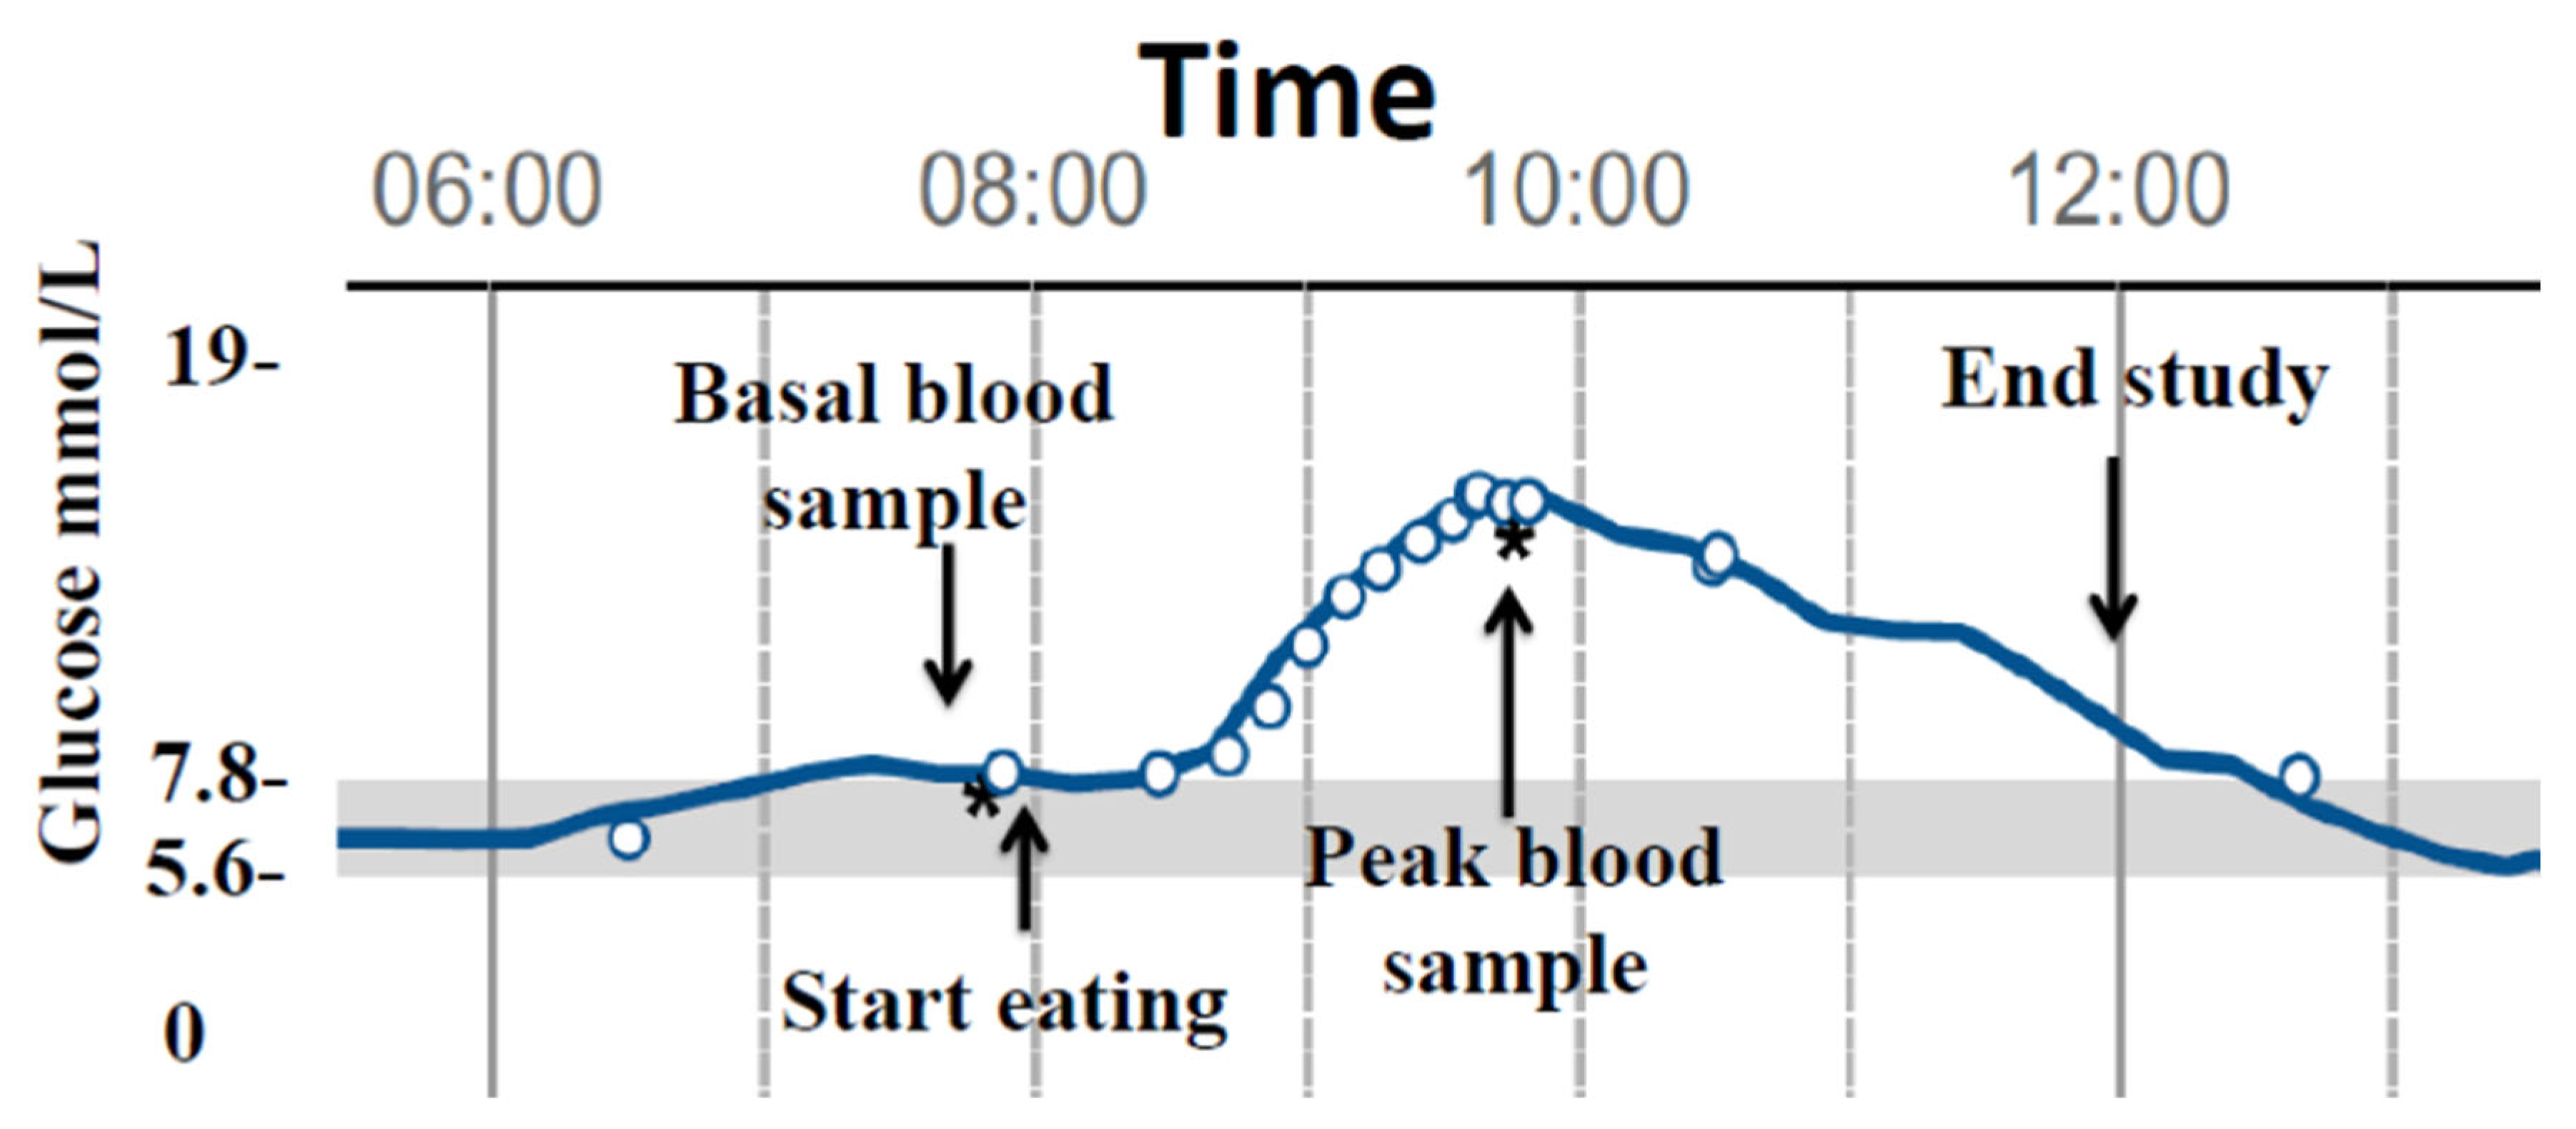
Figure 1. Representation of the interstitial glucose modifications during the one-day test in one T2DM. In the figure, the start eating = 08:00 a.m. and end study day = 12:00 a.m. times are indicated. * indicates blood sampling: at basal and at peak. ° indicates the moment of scanning the sensor; this was carried out frequently after having eaten the bread to identify the peak of glucose increase after the meal.
Diabetology 05 00010 g001
Figure 2. Interstitial glucose as determined by FGM in the 12 patients during the three different experimental days. Delta changes from basal in interstitial glucose determined at 30-min intervals during the entire experiment as determined by FGM. ** p < 0.01 functional alkaline water bread vs. bakery yeast bread; § p < 0.05. §§ p < 0.01 sourdough-leavened bread versus bakery yeast bread in the 12 T2DM.
Diabetology 05 00010 g002
Table 1. Baseline anthropometric and biochemical data of the twelve T2DM.
Age [years]69.9 ± 1.3LDL Cholesterol [mmol/L]2.91 ± 0.5
HbA1c [mol/L %]49.8 ± 1.8
6.7 ± 0.25
Total Cholesterol [mmol/L]4.92 ± 0.6
BMI27.9 ± 1.2Triglycerides [mmol/L]1.42 ± 0.3
Diabetes duration [years] 10.9 ± 1.3HDL Cholesterol [mmol/L]1.44 ± 0.1
Systolic blood pressure [mmHg]119 ± 3.1SGOT [nkat/L]415 ± 39
Diastolic blood pressure [mmHg]75 ± 1.2SGPT [nkat/L]421 ± 49
Creatinine [μmol/L]75.4 ± 4.1γGT [nkat/L]445 ± 69
Data are represented as mean SEM.
Table 2. Doughs’ compositions.
Flour [g]Yeast [g]Biocrystal Water [g]Salt [g]Extra Virgin Olive Oil [g]Homemade Mother Yeast [g]Tap Water [g]Fermentation/Maturation [h]
X1000270025300048
Y10002025302506008
W100020253007004
Doughs’ compositions. X = Functional alkaline water bread; Y = sourdough-leavened bread; W = bakery yeast bread. Doughs were prepared to finish fermentation maturation time together and cooked in the morning just before the experiments.
Table 3. Moisture [weight loss in grams from 100 g of dough left for 5 h in an oven at 100 °C], simple carbohydrate, and lactic acid concentrations at the end of fermentation/maturation in the three different breads.
Moisture [g]Glucose g/100 gFructose g/100 gLactic Acid g/100 g
Functional alkaline water bread320.0620.1<0.001
Sourdough-leavened bread300.050.220.381
Bakery yeast bread271.51.3<0.001
Table 4. Effect of the different bread doughs in the twelve T2DM.
XYWp
Interstitial Glucose
mmol/L
AUC 0–240 min819.6 ± 72.1926.0 ± 73.41016.4 ± 84.4**,§
Time −10′7.4 ± 0.57.3 ± 0.37.4 ± 0.5ns
Delta peak/basal7.7 ± 0.38.0 ± 0.99.4 ± 0.5ns
Capillary blood glucose
mmol/L
Time −10′7.3 ± 0.47.2 ± 0.37.3 ± 0.3ns
Delta peak/basal7.7 ± 0.48.1 ± 0.79.3 ± 0.6*,^
Serum insulin
[μU/mL]
Basal insulin9.5 ± 2.19.3 ±1.99.7 ± 1.7ns
Peak insulin63.5 ± 10.862.2 ± 10.585.7 ± 14.2*,§
AUC = area under the curve. Interstitial glucose: glucose determined by FGM; capillary blood glucose: glucose determined by finger prick test. X: functional alkaline water bread; Y: sourdough-leavened bread; W: bakery yeast bread. Data are means ± SEM. * p < 0.05, and ** p < 0.01 X vs. W; ^ p < 0.05, X vs. Y; § p < 0.05, Y vs. W. No significant differences were present within any group for both basal and peak glucose concentration measured in blood and determined by FGM.
Disclaimer/Publisher’s Note: The statements, opinions and data contained in all publications are solely those of the individual author(s) and contributor(s) and not of MDPI and/or the editor(s). MDPI and/or the editor(s) disclaim responsibility for any injury to people or property resulting from any ideas, methods, instructions or products referred to in the content.