1. Introduction
MUC-1 encodes a protein called carbohydrate antigen 15-3 (CA 15-3), which is a commonly used cancer biomarker in clinical examinations [
1]. In individuals with breast cancer, the presence of tumor cells leads to an increase in CA 15-3 levels in bodily fluids [
2]. Consequently, CA 15-3 can be measured in blood serum to monitor disease progression and detect breast cancer recurrence. High CA 15-3 levels may suggest the presence of aggressive adenocarcinomas such as ovarian, pancreatic, gastric, and liver cancers. The normal range for CA 15-3 concentrations in the blood is 30 U/mL [
3,
4].
There are multiple methods used for measuring CA 15-3, including enzyme-linked immunosorbent assays (ELISA), which are the most commonly used immunoassays. These methods include sandwich-type assays, which employ two monoclonal antibodies, and competitive assays, which involve a single monoclonal antibody. Signal transduction in immunoassays can be achieved using techniques such as chemiluminescence, electrochemiluminescence, fluorescence, surface-enhanced Raman spectroscopy, and electrochemical methods [
5,
6]. Although numerous methods exist for cancer biomarker detection, they frequently entail intricacy, time consumption, and high costs, necessitating specialized laboratory apparatus [
7]. Consequently, there is a demand for rapid and accurate methods for identifying cancer biomarkers. Researchers are exploring the development of cost-effective devices that can accurately measure biomarkers with heightened sensitivity and reduced testing time, as these have the potential to provide beneficial solutions [
8,
9].
Electrochemical sensors offer several advantages over conventional techniques for biomarker detection. Immunosensors used to measure CA 15-3 levels rely on the interaction between anti-CA 15-3 antibodies (Ab) and the CA 15-3 protein. Electrochemical immunosensors developed over the last decade for the detection of CA 15-3 have been described in the literature [
3,
10,
11,
12,
13,
14,
15]. Additional modifications to the transducer have been made to enhance the stability, conductivity, and electrochemical performance of immunosensors, including the incorporation of nanoparticles [
10], mercaptosuccinic acid [
3], nanocomposites [
11], N-doped graphene sheets [
12], poly(glutamic acid) [
13], and composites of reduced graphene oxide and copper sulfide [
14], among many others.
In most cases, CA 15-3 has been determined using redox species such as potassium ferrocyanide [
3], potassium ferricyanide [
12,
13], ferrocene [
11], and catechol [
14], which are responsible for the electrochemical signal. Marques et al. [
10] measured the response through an enzymatic reaction between 3-indoxylphosphatedisodiumsalt and silver nitrate, in which the electrochemical oxidation current of enzymatically deposited silver was determined.
Printed electrochemical sensors have great potential for health monitoring and numerous studies have been conducted using various materials for these applications [
16,
17,
18]. The findings of this study support this notion and demonstrate the possibility of developing sensitive devices for CA 15-3 detection. Notably, different conductive inks such as carbon, silver, and graphite are used in the fabrication of screen-printed electrodes (SPE) [
19,
20]. Some researchers have utilized commercial samples, whereas others have preferred to synthesize their own inks. The choice of substrate depends on its specific application, and it is essential to ensure efficient adhesion of the stencil to the substrate without causing damage.
In this study, an electrochemical platform previously fabricated by our research group using an SPE paper-based device fabricated with homemade conductive inks was utilized for the development of a voltammetric immunosensor for detecting CA 15-3 in human serum and saliva samples. To accomplish this, a simple modification of SPE with AuNPs was performed to immobilize human anti-CA 15-3 antibodies (Ab) for the recognition of the analyte (CA 15-3). Differential pulse voltammetry (DPV) with potassium ferrocyanide was used as a redox species to monitor the antigen–antibody interactions. To enhance the performance of the immunosensor, we investigated various optimization steps, such as the incubation time of anti-CA 15-3, time and concentration of the bovine serum albumin (BSA) blocking protein, response time, and pH of the electrolyte.
2. Materials and Methods
2.1. Reagents
Silver powder with a particle size of 5–8 µm and 99.9% trace metal basis was obtained from Sigma-Aldrich (São Paulo, Brazil) along with sodium tetrachloroaurate (III) dihydrate (NaAuCl4). Potassium ferrocyanide ([Fe(CN)6]4−) was purchased from Neon (Suzano, Brazil). Graphite powder (98%), sodium phosphate dibasic heptahydrate (Na2HPO4.7H2O), sodium phosphate monohydrate (NaH2PO4·H2O), sodium citrate (Na3C6H5O7), and acetone were purchased from Synth (Diadema, Brazil). Cora colorless nail polish and Acrilex mineral spirit were utilized. A 3.48% sodium hypochlorite solution, which is household bleach, was obtained from Marina.
Three types of paper were used: Clear Sticker Paper A4 (80 micra), Photo Paper Matte A4 (108 g/m2), and Self-Adhesive Photo Paper A4 (180 g/m2) from Folien, Spiral, and Multilaser (São Paulo, Brazil), respectively. The stencil was obtained using a cutter plotter MVSK800 from Visutec, and sandpaper with 80 Grit from Carborundum was used to polish the surface. The paper substrates were chosen owing to several attractive features, such as high availability, low cost, low weight, flexibility, biocompatibility, and biodegradability.
Anti-human CA 15-3 (Ab) and CA 15-3 at concentrations of 490 µg/mL and 30 kU/mL, respectively, as well as normal saliva from a female human donor were obtained from Lee Biosolutions (Maryland Heights, MO, USA). Molecular biology-grade bovine serum albumin (BSA; 20 mg/mL) was acquired from BioLab, Hindmarsh, Austrailia. Ascorbic acid was obtained from Synth. Uric acid, cholesterol, dopamine, IgG (derived from human serum), and human serum from AB plasma (sterilized via filtration) were purchased from Sigma-Aldrich. Tris–HCl buffer (10 mM Tris prepared with 150 mM NaCl, pH 7.5) was used to dilute the samples.
All reagents were of the highest purity and were prepared using purified deionized water from a Millipore Milli-Q system with a resistivity of 18.2 MΩ cm.
2.2. Fabrication of the SPE and Construction of Immunosensor
Initially, the synthesized AuNPs were immobilized on the SPE surface via physical adsorption. Graphite and silver inks were prepared according to the procedure outlined in our previous studies [
21,
22]. The fabrication and characterization of the SPE are described in detail in our previous work [
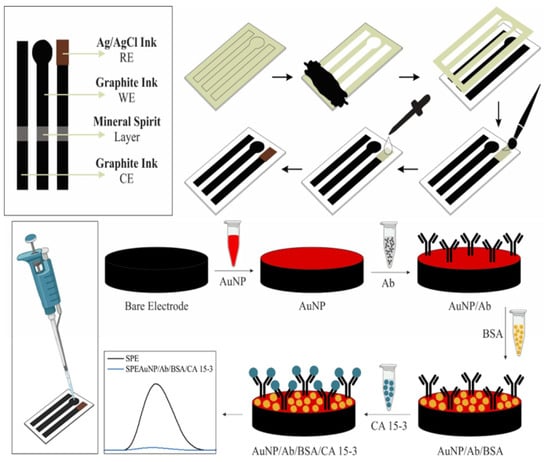
23]. Briefly, a stencil was cut from clear sticker paper using a cutter plotter. The stencil was placed on a previously sanded photo matte. The graphite ink was applied to the stencil using a plastic scraper, after which the stencil was carefully removed. Subsequently, silver ink was printed to serve as the quasi-reference electrode, followed by chlorination of the bleach solution for 5 min. The SPE was thoroughly rinsed with deionized water and dried at 60 °C for 20 min. Finally, a thin layer of mineral spirit was applied to the surface of the sensor, in the middle approximately, by using a paint brush. The resulting sensor is referred to as SPE.
AuNPs were synthesized using the Turkevich method. Initially, 30 µL of AuNPs was deposited onto the SPE and dried at 60 °C for 10 min, resulting in the formation of a thin layer of AuNPs. In a separate step, 420 µL NaAuCl
4 (0.125 M) was diluted in 94.6 mL of deionized water under agitation and heated to 90 °C. Subsequently, 5 mL sodium citrate (10 mg/mL) was quickly added whilst stirring and heating for 20 min. The color change from light yellow to red confirmed the formation of AuNPs [
24]. The AuNPs were stored at 4 °C in the dark.
Subsequently, 30 µL Ab (2.0 µg/mL) was added to the platform and incubated at 4 °C for 6 h. Next, 30 µL of BSA (1.0 mg/mL) was added to block non-specific binding sites and incubated for 1 h at 4 °C. After each step, the sensor was washed in 0.10 M phosphate-buffered saline (PBS, pH 7.5) and dried under nitrogen. The immunosensor, known as SPE/AuNP/Ab/BSA, was stored at 4 °C until further use.
Figure 1 outlines the entire process of manufacturing and modifying SPEs using AuNPs, anti-CA 15-3, and BSA to detect CA 15-3.
The immunosensor was then incubated with a solution containing CA 15-3. Specifically, 30 µL of the sample solution was added to the sensor to interact with anti-CA 15-3 and was incubated for 1 h at 4 °C. The resulting system was denoted as SPE/AuNPs/Ab/BSA/CA 15-3. Measurements were performed using a redox species consisting of 0.50 mM [Fe(CN)6]4− in PBS, and a linear relationship between the CA 15-3 concentration and electrochemical response was observed.
All electrochemical measurements were carried out on a Metrohm Autolab Potentiostat (PGSTAT204) using NOVA software version 2.1. Electrochemical profiles were obtained in 0.50 mM potassium ferrocyanide in PBS using DPV (scan rate: 20 mV/s and amplitude: 40 mV).
2.3. Optimization Studies
The following parameters were optimized: incubation time for anti-human CA 15-3 (4, 6, and 8 h), time and concentration of BSA (30, 60, and 90 min; 0.5, 1.0, and 1.5 mg/mL), CA 15-3 (30, 60, and 90 min), and PBS pH (6.5–8.5).
To determine the optimal values, the electrochemical performance of the immunosensor was evaluated under each condition by using DPV. Voltammetric measurements were performed using 0.50 mM potassium ferrocyanide in PBS. The sensors were incubated with 30 µL of CA 15-3 at a concentration of 20 U/mL.
2.4. Atomic Force Microscopy Analysis
Atomic force microscopy (AFM) was employed to analyze each phase of the immunosensor assembly, including SPE, SPE/AuNPs, SPE/AuNPs/Ab, SPE/AuNPs/Ab/BSA, and SPE/AuNPs/Ab/BSA/CA 15-3. Bruker Multimode 8 (MM8) was used for the analysis, with a scan size of 5.0 µm and an amplitude of 5 V. The samples were secured onto a circular metallic holder using silver tape.
2.5. Application in Serum and Saliva Samples
The immunosensor was used to assess CA 15-3 levels in human serum and saliva samples. For serum samples, a 1:10 (v/v) ratio with PBS was employed, whereas no dilution was necessary for the saliva samples. The immunosensors were prepared according to a previously described method. Subsequently, the serum and saliva samples were supplemented with various concentrations of CA 15-3, followed by the addition of 30 µL of each sample to the immunosensor and incubation for 1 h at 4 °C.
2.6. Specificity and Reproducibility
Specificity studies were conducted using dopamine (0.03 ng/mL), cholesterol (190 μg/mL), BSA (1.0 mg/mL), ascorbic acid (10 μg/mL), uric acid (50 μg/mL), and IgG (1.0 mg/mL) at concentrations based on normal reference levels of interfering substances found in human serum and saliva. Using an immunosensor for each potential interferent, they were combined with 20 U/mL CA 15-3 for a duration of 1 h.
Reproducibility analysis was performed by measuring the electrochemical responses of four identical electrodes under various conditions using DPV and [Fe(CN)6]4− prepared in PBS.
3. Results and Discussion
3.1. Principles of Operation of the Immunosensor
AuNPs were first adsorbed onto the SPE surface through physical adsorption. At this stage, it is important to mention that the only change made to the SPE was this modification, which simplified the process of manufacturing the immunosensor when compared to other devices that have been previously reported in the literature. AuNPs are commonly used in immunosensors because of their ability to enhance electron transfer, thereby improving electrochemical signals. The high surface-to-volume ratio of AuNPs makes it possible to immobilize more layers, while their biological inactivity ensures that they do not interfere with the activity or molecular structure of that immobilized [
25,
26].
The subsequent process required immobilization of anti-CA 15-3 onto the SPE/AuNPs. The anti-CA 15-3 utilized was an unconjugated monoclonal antibody of the IgG1 type with high purity. Bioconjugation of AuNPs and antibodies can be achieved using chemical and physical methods. In the proposed immunosensor, a physical method, specifically adsorption, was employed. These methods are simple because they do not require the modification of antibodies or AuNPs. The main drawback of adsorption is that Ab is randomly immobilized on AuNPs. This may result in a partial loss of the antigen-binding capacity, owing to steric hindrance. Each Ab can adopt four possible spatial orientations: tail-on (Fc region attached to the surface), flat-on (three fragments attached to the surface), head-on (two Fab regions attached to the surface), and side-on (one Fc and one Fab attached to the surface). The tail-on orientation is more desirable because Ab-binding sites are available to interact with the cognate antigen. Ruiz et al. [
27] demonstrated that pH can influence the protonation/deprotonation of functional groups present in the antibody, thus improving the orientation of AuNPs. At pH 7.5, the highest amount of immobilized antibodies showed activity, suggesting that the binding of the tail portion to the AuNPs was favored. Hence, selecting a pH of 7.5 is a favorable strategy for preparing the Ab solution to improve tail-on adsorption.
Subsequently, BSA was added to block the non-specific binding of SPE/AuNPs/Ab. BSA is an inert protein and has several advantages such as low cost, natural abundance, and wide availability. The behavior of BSA and the optimization parameters (incubation time and concentration) are discussed in more detail in subsequent sections.
The immunosensor was ready for use and was stored at 4 °C. If the storage temperature exceeds this value, antibodies may undergo denaturation and lose their ability to bind to specific targets [
28]. As previously mentioned, immunosensors can use an antibody as a bioreceptor for specific molecular recognition of an antigen, resulting in the formation of a stable immune complex. Thus, the next step involved the incubation of the target analyte (CA 15-3).
CA 15-3 is derived from glycoprotein mucin 1 (MUC1). MUC1 is a transmembrane glycoprotein that consists of a glycosylated polypeptide with a large number of tandem repeats composed of serine- and threonine-rich amino acid sequences. The glycoprotein sequence has a high carbohydrate content [
29,
30]. The biomarker CA 15-3 interacts with two monoclonal antibodies: DF3, which is utilized for detection, and 115D8, which serves as a capture antibody. The DF3-detection antibody is produced from human breast cancer metastasis to the liver and recognizes the MUC1 sequence, DTRPAPGS, which corresponds to the amino acid Asp-Thr-Arg-Pro-Ala-Pro-Gly-Ser. On the other hand, 115D8 is derived from human milk fat globule membranes and binds to the peptide carbohydrate epitope on the same repeat unit, acting as the capture antibody in the sandwich assay [
31,
32,
33]
The DF3 detection antibody in this study is the anti-CA 15-3. Therefore, after incubating CA 15-3 in the immunosensor, an interaction occurs between the amino acid sequence (DTRPAPGS) of CA 15-3 and the binding sites of anti-CA 15-3, resulting in the formation of the antigen–antibody complex. The interactions involved in the construction of the immunosensor, particularly the antigen–antibody interaction, are shown in
Figure 2A, while
Figure 2B shows the immunosensor.
3.2. Electrochemical Behavior of Immunosensor
Voltammetric measurements were conducted after the addition of each layer to construct the immunosensor: SPE, SPE/AuNPs, SPE/AuNPs/Ab, SPE/AuNPs/Ab/BSA, and SPE/AuNPs/Ab/BSA/CA 15-3. These analyses were performed in an electrochemical cell containing 0.50 mM [Fe(CN)
6]
4− in PBS (
Figure 3A), and the voltammograms are shown in
Figure 3B.
Initially, the modification of the SPE with AuNPs resulted in an increase in the peak current, owing to the excellent electrical conductivity of the metallic nanoparticles. When the Ab layer was added to the SPE/AuNPs, it formed an insulating protein layer that acted as a kinetic barrier for the transfer of mass and electrons between the transducer and the redox species. This resulted in a decrease in the current response. Blocking with BSA further decreased the current. The formation of an immune complex on the surface of the immunosensor, which occurs after the interaction of the antigen with the antibody, complicates the electronic transfer process and results in practically zero-current values. This caused a significant difference in the responses of the device in the presence and absence of the analyte, enabling indirect detection through the oxidation of potassium ferrocyanide. These findings suggest that the immunosensor may be useful for detecting CA 15-3 by monitoring ferrocyanide oxidation and relating it to antigen–antibody interactions.
3.3. AFM Analysis
AFM images were acquired to examine the surface morphology, roughness, and thickness. By comparing the images, it was possible to observe the immobilization of each layer during the immunosensor’s construction. The average surface roughness (Ra) and root mean square (RMS) roughness were calculated to evaluate the samples. AFM images of the working electrodes on SPE, SPE/AuNPs, SPE/AuNPs/Ab, SPE/AuNPs/Ab/BSA, and SPE/AuNPs/Ab/BSA/CA 15-3 are shown in
Figure 4.
The AFM image of the SPE exhibited a flaky appearance with sharp edges of graphite, as shown in
Figure 4A. In addition, because the ink involves grinding graphite with a binder, the particles are reduced in size, which explains the smaller particles attached to the surface. The AFM images in
Figure 4B for the SPE/AuNPs depict individual spherical nanoparticles and their aggregates. Graphite flakes were also observed beneath the AuNP layer, indicating a very thin layer of nanoparticles. The R
a and RMS values of SPE (2.1 and 2.8, respectively) and SPE/AuNPs (2.4 and 2.9, respectively) were quite similar, indicating that the addition of AuNPs did not significantly increase the roughness.
Upon immobilization of anti-CA 15-3, a clear change in the surface topography was observed (
Figure 4C). The R
a and RMS of SPE/AuNPs/Ab increased to 3.1 and 3.8, respectively. The increase in roughness can be attributed to the attachment of the antibodies. A slightly globular structure was observed, reflecting the protein nature of Y-shaped antibodies. The SPE/AuNP layer was almost entirely covered with anti-CA 15-3, confirming the successful immobilization.
Figure 4D shows the AFM image of SPE/AuNPs/Ab/BSA. After addition of the BSA layer, the porosity of the electrode decreased. A more uniform and smoother surface was observed, explaining the decreases in Ra and RMS to 1.2 and 1.7, respectively. The adsorption of the blocking agent BSA onto non-specific sites resulted in a good coverage of the remaining areas on the electrode surface. A globular appearance was also observed, which is characteristic of BSA, although the BSA protein is larger than anti-CA 15-3.
An AFM image of the immunosensor SPE/AuNPs/Ab/BSA incubated with CA 15-3 is shown in
Figure 4E. The surface texture changes consist of larger particles. The Ra and RMS values (4.0 and 6.0, respectively) indicate an increase in the surface roughness after capturing CA 15-3.
The AFM images taken before and after incubation with CA 15-3 showed a noticeable difference, indicating the detection of CA 15-3 and supporting the results of the voltammetric measurements.
3.4. Optimization of Immunosensor Operating Conditions
To improve the efficiency of the immunosensor, various parameters, including the incubation time, concentrations of anti-CA 15-3, BSA, and CA 15-3, and the pH of the electrolyte were explored, as shown in
Figure 5. The improvement in immunosensor performance relies on achieving better antigen–antibody interactions, which results in a decrease in current values due to the increased blockage of access of the redox species to the electrode surface.
Initially, the effect of anti-CA 15-3 incubation time on the immunosensor current response was evaluated (
Figure 5A). Short incubation times may not be adequate, whereas longer incubation times can result in increased non-specific binding. Therefore, three immunosensors were prepared with different antibody incubation times (4, 6, and 8 h) and incubated with a CA 15-3 solution (20 U/mL). DPV measurements were conducted and the results are shown in
Figure 5A. The peak current initially decreased with increasing incubation time from 4 to 6 h, and then increased from 6 to 8 h. This behavior can be attributed to the optimal immobilization conditions on the transducer surface, which are related to its ability to recognize the analyte (CA 15-3). In general, increasing the amount of immobilized antibodies can lead to a greater ability to interact with the target. However, saturation can result in non-specific interactions [
34,
35]. Therefore, the incubation time for anti-CA 15-3 chosen for subsequent studies was 6 h.
Figure 5B shows the effect of the reaction time of the immunosensor on CA 15-3. It was observed that at 30 min, the interaction of the antigen–antibody immunocomplex may not have occurred properly, owing to the short incubation period of the antigen and resulting in higher current values. At 60 min, the response was the smallest, likely due to the more efficient formation of the antigen–antibody complex, leading to a reduction in the peak current. This interaction might have reached saturation during the study period. After 90 min of reaction, the redox species response increased again, which may have been associated with a decrease in the affinity between the antigen and antibody. Therefore, 60 min was selected as the optimal reaction time for the immunosensor with CA 15-3.
Non-specific adsorption occurs when other substances adsorb onto antibodies or the support surface, leading to an increase in the background signal and a decrease in sensitivity. Hence, non-specific adsorption is a major problem in immunosensors because it affects the electrochemical signal and it cannot be distinguished whether is due to immunoreaction or adsorption of other substances. Therefore, the incubation time and BSA concentration were optimized to increase the ability to block unreacted binding sites. Initially, immunosensors were manufactured with different BSA incubation times (30, 60, and 90 min) using BSA stock solution (1.0 mg/mL). Each immunosensor was subjected to voltammetric measurements, and the results are shown in
Figure 5C. At 30 min, the highest current values were observed, suggesting low interaction between the analyte and the immobilized antibodies. This could have been due to an insufficient BSA layer to block the electrode surface, resulting in possible CA 15-3 adsorption on the electrode and removal during the washing step. However, for incubation times of 60 and 90 min, the lowest current values were recorded, indicating that the BSA layer effectively maintained the immunosensor interaction with the analyte and reduced the current values of the redox species. Consequently, the optimal incubation time for BSA was determined to be 1 h.
After optimizing the BSA incubation times, immunosensors were prepared using different concentrations of BSA (0.5, 1.0, and 1.5 mg/mL), maintaining an incubation time of 60 min. The results, shown in
Figure 5D, demonstrate that the peak current was lower when the BSA concentration was 1.0 mg/mL. This indicated that this concentration was effective in blocking the electrode surface, leaving only the antibody recognition sites free for binding to the antigen. In contrast, incubation with a BSA concentration of 0.5 mg/mL may have resulted in poor immobilization, failing to effectively block non-specific sites. Therefore, 1.0 mg/mL BSA was selected for 60 min.
The effect of pH on electrochemical response can be attributed to protein denaturation. To investigate the pH of the electrolyte used in the analysis, a range of 6.5–8.5 was examined while keeping all other parameters constant. The resulting voltammograms are shown in
Figure 5E. The results indicated that at pH 7.0, the immunosensor exhibited the lowest electrochemical response, which could be attributed to the successful immobilization of each layer in the device. Notably, all the modifications resulted in a decrease in the signal, including the insulating immune complex of the antigen antibody. Below pH 7.0, no further decrease in the peak current was observed. Therefore, a pH value of 7.0 was selected as the optimal pH. The peak current displayed a substantial increase within the pH range from 7.5 to 8.5. This increase can be ascribed to the detrimental effects of highly acidic or alkaline solutions on the interactions between the antigens and antibodies. The presence of H
+ and OH
− ions and their interaction with the amino acid sequence of antibodies may impair the structural integrity and functional activity of anti-CA 15-3 [
36]. Hence, measurements using immunosensors are typically performed at neutral pH to ensure optimal conditions.
3.5. Imunossensor Performance
Analytical measurements were conducted by incubating various immunosensors with solutions containing CA 15-3 at concentrations of 2–20 U/mL.
Figure 6A shows the results of this analysis.
The voltammograms show the suppression of the oxidation peak of the redox species with increasing CA 15-3 concentrations. This behavior can be attributed to the formation of an antigen–antibody complex, which blocks the electrochemical process of the redox species on the transducer surface. The response gradually decreased until it reached a minimum, after which the CA 15-3 concentration could continue to increase without affecting the peak current. This indicates that the immunosensor was capable of detecting changes in CA 15-3 concentrations.
A calibration curve was constructed by plotting the anodic peak current as a function of the antigen concentration (
Figure 6B). The curve showed a linear regression equation of
ip[μA] = −0.01231 [U/mL] + 0.2354, with a linear range from 2 to 16 U/mL (R
2 = 0.9976) and sensitivity of 0.01231 μA U/mL.
The limits of detection (LOD) and quantification (LOQ) were obtained by dividing the standard deviation of the blank solution (n = 10) by the slope of the calibration curve three and ten times, respectively. The resulting values were 0.56 U/mL for the LOD and 1.88 U/mL for LOQ.
Table 1 provides a comparison of the analytical performance of the immunosensor proposed for the detection of CA 15-3 with other methods reported in the literature, including the type of electrode, technique, modification, type of sample, and response time. Although glassy carbon electrode-based immunosensors showed the lowest LOD and gold screen-printed electrodes demonstrated the highest linear range, our proposed immunosensor performed satisfactorily in terms of LOD for analytical measurements, including a reasonable analysis time, ease, and faster transducer modification. Furthermore, our method includes the use of homemade conductive inks and the manufacture of a disposable device made from paper.
The selectivity of the immunosensor was evaluated to assess the feasibility of detecting CA 15-3 in complex systems such as human serum and saliva samples. Thus, electrochemical measurements were conducted using possible interfering substances, including ascorbic acid, cholesterol, uric acid, dopamine, BSA, and human IgG. These interferers were chosen from a group of substances commonly found in human serum with the exception of BSA. Although human serum does not naturally contain BSA, it is often used as an affordable substitute for human serum albumin, which is the most abundant protein in blood. According to the voltammograms obtained, the presence of these interfering substances did not result in significant changes in the current signal, with a minimal peak-current variation of 4.94% compared with the response without interference (blank). These results indicate that the immunosensor exhibits good selectivity and specificity for CA 15-3, making it suitable for application in biological samples, such as serum and saliva.
To evaluate the reproducibility of the proposed method, four identical immunosensors were constructed using different materials, equipment, and solutions. Additionally, the repeatability of each electrode was considered, as it was used to detect CA 15-3 three times. The results demonstrated excellent reproducibility, with a relative standard deviation (RSD) of 5.65%. This indicated that the precision of the immunosensor was acceptable, thereby confirming its reproducibility and reliability. The storage stability of SPE/AuNPs/Ab/BSA was evaluated by monitoring its response after three months of storage at 4 °C. The immunosensor response decreased by 18.7% (n = 4), indicating a certain level of instability during the storage period.
3.6. CA 15-3 Determination in Biological Samples
To evaluate the performance of the immunosensor and the matrix effect, standard addition analysis was used to determine CA15-3 levels in complex samples such as human serum and saliva. Human serum and saliva samples were spiked with known amounts of the antigen at three concentrations (serum: 2.5, 5.0, and 10 U/mL; saliva: 2.0, 4.0 and 8.0 U/mL). All analyses were performed in triplicate.
Typically, the normal level of CA 15-3 in human serum is less than 30 U/mL [
3]. As the linear range of the immunosensor was between 2 and 16 U/mL with an LOQ of 1.88 U/mL, it was necessary to dilute the human serum sample at a ratio of 1:10 (
v/
v) for CA 15-3 determination using the immunosensor.
Table 2 shows the recovery values obtained for the immunosensor using diluted human serum and saliva samples. The results for human serum indicated an RSD ranging from 1.02% to 3.99% and an average recovery between 100.24% and 108.53%.
The concentration of CA 15-3 in saliva has yet to be determined. However, some studies have reported a correlation between CA 15-3 in saliva samples and the evolution of breast cancer. Laidi et al. [
42] found an average CA 15-3 concentration of 4.77 U/mL for women with breast cancer and 2.71 U/mL for healthy women, whereas Farahani et al. [
43] obtained 9.20 U/mL and 4.50 U/mL, respectively. Therefore, because of the low concentrations of CA 15-3 present in saliva samples, the immunosensor was used without dilution. The results indicated average recoveries of 100.25% to 110.82% and RSDs of 1.26% to 2.51%. These results suggest that the proposed immunosensor can be used for quantitative determination of CA 15-3 in human serum and saliva samples.
The immunosensor exhibited satisfactory recovery when applied to human serum and saliva samples. This demonstrates the versatility and potential for use in different biological matrices, allowing for convenient and noninvasive sample collection. The ability to analyze multiple sample types expands the scope of immunosensor applications, enabling their use in various clinical scenarios. The high precision observed in the results highlights the reliability and reproducibility of the immunosensor.
Overall, the immunosensor demonstrated potential for the clinical analysis of CA 15-3. The consistent and accurate measurements obtained indicated that the system can provide reliable diagnostic information. This is of utmost importance in clinical analysis, where precision and reproducibility are critical for accurate disease detection and monitoring.
4. Conclusions
One of the main objectives of research in the manufacturing of sensors is determination in clinical analysis and the search for the creation of devices similar to glucose monitors. The development of chemical sensors is a key point in modern analytical instrumentation, allowing for the dispensation of complex devices and greater infrastructure. The manufacture of printed sensors allows for the development of a low-cost and easy-to-handle technique. The inks produced have low cost and high efficiency for the construction of printed electrodes. This study successfully demonstrated the efficient use and implementation of a paper-based SPE device utilizing homemade conductive ink.
The determination of CA 15-3 in body fluids plays a crucial role in monitoring patients with breast cancer. Although CA 15-3 levels are generally elevated in women with breast cancer, they rarely exceed the normal levels during the early stages of the disease. Consequently, CA 15-3 is not recommended for diagnostic purposes but rather for monitoring therapy response, screening for metastases, and surveillance of recurrence. In this context, electrochemical sensors present several advantages over conventional techniques for biomarker determination, including high selectivity, sensitivity, cost-effectiveness, real-time analysis, and minimal pretreatment requirements.
The voltammetric immunosensor showed promising results for the detection of the breast cancer biomarker CA 15-3 in human serum and saliva. It exhibited a high sensitivity of 0.012 μA/U mL−1, an LOD of 0.56 U/mL, and an LOQ of 1.88 U/mL. The modification process, which involved the integration of SPE with AuNPs, anti-CA 15-3, and BSA, required approximately 7 h. Additionally, the immunosensor displayed a response time of 1 h for an effective interaction with the CA 15-3 antigen. This extended response time ensures robust antigen–antibody binding, enabling the immunosensor to capture and detect the target biomarker with exceptional specificity and sensitivity.
The study findings suggest that printed electrochemical sensors can be utilized as alternatives for the determination of CA 15-3 in biological samples. These sensors offer a range of benefits such as low cost, real-time data analysis, and the potential for miniaturization. Further optimization and applications can be proposed to improve the performance of sensors, including the formulation of conductive inks, increasing sensitivity, reducing the limit of detection, and exploring the detection of other biomarkers for diseases, such as cardiovascular disease. These sensors are valuable for clinical applications because of their rapid analytical response and potential for point-of-care testing, which allow for immediate decision making in patient care. Therefore, some experimental adjustments can be made to the sensors to decrease the analysis time and allow for the use of portable potentiostats.


