Review

Review of the Analytical Methods Based on HPLC-Electrochemical Detection Coupling for the Evaluation of Organic Compounds of Nutritional and Environmental Interest

Department of Agricultural, Environmental and Food Sciences (DiAAA), University of Molise, Via De Sanctis, I-86100 Campobasso, Italy
*
Author to whom correspondence should be addressed.
Analytica 2022, 3(1), 54-78; https://doi.org/10.3390/analytica3010005
Submission received: 28 December 2021 / Revised: 6 February 2022 / Accepted: 7 February 2022 / Published: 15 February 2022
(This article belongs to the Section Chromatography)

Abstract

:
This review would like to show the state of the art regarding the coupling of High-Performance Liquid Chromatography (HPLC) with Electrochemical Detection (ED). Since a universal detector for HPLC is not available, the electrochemical detection methods, thanks to their versatility and specificity, are competitive with respect to the detectors currently used. The papers present in literature on HPLC-ED technique are analyzed and discussed: for example, they regard the development of analytical determinations of resveratrol, rosmarinic acid, aromatic heterocyclic amines and glyphosate in food matrices such as meat, aromatic plants, vegetables, fruit and tomato juices. These papers show that electrochemical sensors used as detectors for HPLC can offer better sensitivity values than other detectors. Furthermore, the use of specific working potentials allows avoid matrix interferences to be avoided by almost exclusively determining the analytes of interest. It should be underlined that HPLC-ED methods have a selectivity that allows for limitation of the sample preparation and clean-up procedures to a minimum, making them quick and easy to apply. In addition, these methods offer advantages such as the possibility of direct analysis, that derivatization is often not necessary, the cost-effectiveness of the instrumentation and the possibility of regenerating the electrodes which allows numerous analyses in succession.

1. Introduction

Today the term chromatography encompasses a wide range of analytical techniques, which have in common the use of a mobile phase and a stationary phase. If the interaction between the column and the mobile phase plays an important role in relation to the separation to be made [1], an equally important role is played by the detector. The characteristics of a performing detector must be good sensitivity (between 10−8 and 10−15), good stability and reproducibility, linear response, short response time, reliability, ease of use and small size. Currently, there is no universal detector for high-performance liquid chromatography (HPLC) and therefore it is necessary to select it according to the nature of the compounds to be analyzed. The most-used detectors are based on the measurement of absorbance in the ultraviolet and visible spectrum (UV-Vis) or revealing fluorescence (Fl). It is also possible to couple HPLC to mass spectrometry (HPLC-MS) but appropriate and expensive technology (i.e., vaporization of the eluate of the column, consequent removal of the solvent, very small volumes) is required. In recent years, detectors based on electrochemical techniques have been developed; they are inexpensive, easy to assemble and of high analytical robustness.
Basically, a working electrode potential is set at different values, so a cell detector is able to change the electroactive compound response. This change is recorded by means of sigmoidal I/V curves (hydrodynamic voltammograms, HDVs). There are different electrodes: for instance, small electrodes in amperometric measurements are affected by passivation, whereas electrodes with a large surface area cause an oxidation/reduction increase [2]. A common situation for almost all the electrodes, better for their surface, is the signal decrease when they are contaminated, so it is necessary an electrochemical cleaning [3].
On the other hand, a chemical sensor is defined as a device that converts chemical information, ranging from the concentration of a specific component of the sample to the analysis of the total composition, into an analytically useful signal [4]. Another exhaustive definition of a chemical sensor is provided by Wolbeis in 1990, i.e., a miniaturized device capable of continuously and reversibly providing the measurement of a chemical concentration by means of a recognition element, a transducer and a signal processor [5]. The recognition element is called the receptor and it is the site of the sensor in which the chemical reaction, in which the analyte participates, gives rise to a form of energy that can be measured by the transducer. In electrochemical sensors, for example, a chemical equilibrium at the analyte–receptor interface is established, as they are part of the same redox couple. On the other hand, the transducer manages to convert the energy generated by the receptor into an electrical signal [4]. The signal produced by the transducer meets an amplifier and finally a microcomputer.
In terms of sensitivity and selectivity, no optical detector (e.g., UV-Vis, Fluorescence, Refractive Index RI) nor aerosol-based detector (i.e., Evaporative Light Scattering Detector ELSD, Nano Quantity Analyte Detector NQAD, Charged Aerosol Detector CAD) can compete with the electrochemical detector. Basically, whenever an analyte is electroactive, scilicet it can undergo oxidation or reduction, an electrochemical detection (ED) can be applied. Sometimes it is necessary to confirm the electroactivity property of a compound by voltametric measurements (e.g., cyclic voltammetry) [6,7]. The HPLC-ED approach is an extremely selective and sensitive detection technique that is applied in many analyses in agricultural, environmental and food fields [8]. It should be considered that ED has an enormous linear dynamic range of more than six orders of magnitude. This means that concentrations as low as 10 pmol L−1 and as high as 500 µmol L−1 or more can be detected.
This review would like to show the state of the art of this methodology. The authors will start with a brief section regarding the sensor classification, and after that they will analyze and discuss the main applications found in literature on this coupling.

2. Sensor Classification

The classification of chemical sensors can be performed according to different aspects. A summary classification, for example, can be based on the type of analyte for which the sensor is used. Therefore, there are sensors for measuring pH, sensors for analyzing metal ions, and sensors for detecting oxygen or other gases [4]. Of course, these are just some examples. Another type of discrimination can be performed on the basis of the type of signal transduction, which depends on the analytical technique used [9]. Figure 1 illustrates some subgroups of electrochemical devices [10].

2.1. Potentiometric Sensors

In the past, the term “potentiometric sensors” referred to both the classic galvanic cell and the actual miniaturized devices. Today, however, this term only defines small and large-scale instruments, even though the difference is purely geometric. The most common potentiometric sensors are ion-selective electrodes (ISEs) and glass electrodes [11].
The complexity of manufacturing actual potentiometric sensors lies in miniaturization. There are two limits to be overcome: the direct contact of the reference electrode with the analyte and the difficulty of putting the indicator electrode in contact with the voltmeter. However, technological development has made it possible to develop miniaturized systems that offer a satisfactory performance. An example is the Ion-Selective Field Effect Transistor (ISFET) [12] or Chemical field-effect transistor (ChemFET) [13]. The latter integrates the receptor with a semiconductor amplification component (Metal-Oxide field Effect Transistor, MOSFET) [14] thanks to which the input and output circuits are electrically isolated from each other.
Other techniques for producing potentiometric sensors are electrodes with thin-film technology or with thick-film technology (screen printing) [15,16] (Figure 2). Hybrid sensors have also been designed with electrodes with screen printing or thin-film technology and the MOSFET amplification component. For example, a potentiometric sensor for pH measurement has been studied thanks to electrodes built with screen-printing technology. The RuO2/TiO2 indicator electrode and the Ag/AgCl/KCl reference electrode were printed on an aluminum substrate [17].

2.2. Amperometric Sensors

Amperometric sensors are not inherently selective [18]. Any electrode active species is detected [19,20] (Figure 3). In order to increase the selectivity, it is possible to operate with a filtering of the ion flux before it comes into contact with the electrode surface, for example by means of selectively permeable membranes that exclude the molecules based on their size or properties, such as lipophilic or hydrophobic membranes [21]. Another technique is the positioning of a layer of selective catalyst on the electrode surface [22].
Recently, amperometric sensors have been largely investigated, especially in environmental and food fields: for example, a high-performance amperometric sensor has been described for the selective determination of two widely used herbicides, diuron (3-(3,4-dichlorophenyl)-1,1-dimethylurea) and phenuron (1,1-dimethyl-3-phenylurea) [23].

2.3. Coulometric Sensors

Coulometry is an electrolytic technique that is based on the measurement of the electrical charge necessary for the complete conversion of the analyte into a product with a known composition (Figure 4).
The difference between coulometric and amperometric measures is that in coulometry an attempt is made to reduce the effect of polarization, whereas in amperometry this effect is favored since the analysis is carried out with complete polarization, i.e., in conditions of total independence between the applied potential (V) and current (I) [25]. In amperometric detectors the electrodes can be in series or in parallel, whereas in a coulometric detector they are only arranged in series [26]. It should be noted that the coulometric measures can be performed in screening mode (the interfering compounds are removed by oxidation or reduction and the target compound analyzed by a second cell) and in a dual electrode detector (using a coulometric cell followed by an amperometric flow through cell). A first example of this system was described by Matson et al. [27] that built a detector equipped with 16 coulometric channels in four cell blocks for analyzing neurotransmitters: using HPLC, the authors obtained 16 chromatograms increasing the electrode potential with the scope both of reducing the background current and of increasing the detection.

2.4. Biosensors

The term “biosensor” has been proposed as a condensed form of the term “bioselective sensor” [28]. Biosensors can be defined as analytical devices which include a combination of a biological detecting element and a transducer [29]. The electrochemical biosensors are a class of biosensors that function using an electrochemical transducer (Figure 5). Nowadays, biosensors are the subject of continuous and in-depth studies as they are considered valuable tools for environmental analysis, but above all for food. In fact, biosensors have been developed for the determination of the most common food contaminants of both chemical and biological nature [30].
For example, a biosensor was manufactured that was capable of determining the concentration of organophosphate pesticides (OPs) by means of the immobilization, on the surface of the indicator electrode, organophosphate hydrolase enzymes of bacterial origin enzymes (i.e., organophosphorus hydrolase, OPH, and organophosphorus acid anhydrolase, OPAA) able to hydrolyze OPs. These have also allowed the assembly of easily usable devices for the analysis of real matrices and suitable for field analyzes [32].

3. HPLC and ED Coupling

The presence of contaminants in food and the environment has led to the need for the development of increasingly sensitive, rapid and economical analytical techniques for the detection of these substances both in food matrices and in environmental matrices. An example is represented by herbicides, characterized by an important environmental persistence such as the case of glyphosate (Gly). Furthermore, analytical methodologies are indispensable for the evaluation of secondary products originating from treatments applied to foods, such as heterocyclic aromatic amines (HAAs). In fact, they develop because of heat treatments of foods such as meats. However, analytical techniques are also necessary for the study of compounds useful for the preservation of food matrices, as in the case of phenolic and polyphenolic compounds.
In recent years, HPLC coupling with electrochemical sensors (Figure 6) has shown numerous advantages for the determination of compounds of food and environmental interest. The versatility of the electrochemical sensors has allowed their application for the determination of different analytes. A search on the Scopus database using the keywords “HPLC”, “food analysis” and “coulometric detection” or “electrochemistry”, led to 249 publications between 1982 and 2021: not all results, however, were related to the coupling of the two analytical techniques. Most of the papers concern electrochemical techniques later validated with HPLC. On the other hand, if the search was carried out using the keywords “HPLC-ED”, “food” and “environment”, the database reports about 20 papers, with growing interest in recent years. This demonstrates the attention being paid to the considerable potential of this coupling in the context of food and environmental control, despite the technological difficulties present in the coupling of these two techniques.
The first examples of such coupling were present in two papers published by Welch et al. in 1989 [34] and by Mögele et al. in 1992 [35]. In the first paper, the authors proposed an anion-exchange amino acid separation followed by pulsed coulometric detection (PSD) or by potential-sweep pulsed coulometric detection (PS-PCD). They introduced the gold electrodes. Until then, platinum electrodes were used for the pulsed amperometric detection (PAD): the analyte response in terms of reproducibility and repeatability was better because, using the non-degassed solutions, the oxygen reduction wave was well-solved from the cathodic stripping peak of gold oxide, in contrast with occurring with the Pt electrode. Under these conditions a limit of detection (LOD, defined as 3 × standard deviation of the blank, whereas Limit of quantification, LOQ, is defined as 10 × standard deviation of the blank [36]) for lysine was 40 ppb, whereas the LODs of the other primary amino acids were within ±3 times that for lysine. It should be underlined that the analysis was carried out on underivatized amino acids. The second paper reported the determination of organic acids (i.e., oxalic acid, lactic acid, ascorbic acid), amino acids and sugars (i.e., glucose, galactose, sucrose, maltose, fructose) in foodstuffs (e.g., pear juice, soft cheese, etc.). The authors used HPLC analysis (specifically, reversed phase, RP, or flow injection analysis, FIA) followed by a post-column enzyme reaction with amperometric detection. The approach was very easy but very effective: from the oxidase-enzyme reaction hydrogen peroxide was produced, an amperometric detector was used for measuring H+ at +0.6 V on a platinum electrode (H2O2 → O2 + 2H+ + 2e). The authors managed to detect such compounds with LODs ranging between nM and pM with a relative standard deviation (RSD) between 2 and 5%. Finally, in 2000 Arias de Fuentes et al. proposed a polymeric membrane ion-selective electrode (ISE) as HPLC detector for determining cholic acids in pharmaceutical preparations [37]. The authors tested such ISE, selective for cholic acid (specifically, deoxycholic DCA, chenodeoxycholic CDCA, ursodeoxycholic UDCA, taurocholic TCA sodium salts), both in batch and in flow injection analysis (FIA), using a wall jet type of flow cell: response times < 8 s, correlation coefficients above 0.9943, average slopes (as ΔmV/ΔlogC) of 59.6 in the concentration range between 5.0 × 10⁻⁵ and 5 × 10⁻² and satisfactory LODs (ranging between 1.6 and 3.3 µg vs. 0.2–1.8 determined by HPLC-UV) were achieved under the investigated conditions (i.e., pH 7.0–9.2, at lower pH value the ISE response drastically decreased; different solvent tested; isocratic elution, whereas gradient elution had to be carried out in further studies). This study represents an important step in the FIA because it highlighted the importance of the wall jet cell that helped to solve some problems in the flow analysis.
During the past four decades, the coupling between HPLC and the electrochemical detection (as amperometric, voltametric, coulometric and potentiometric methods) has been extensively used to determine different organic compounds in different alimentary (foods and beverages) and environmental samples.

3.1. Cereals, Rice and Wheat

Cereals, rice and wheat are the first samples to be presented. Table 1 resumes all the data reported in this section.
The first paper concerning HPLC and electrochemical detection for determining altertoxins (ATX-I and ATX-II), was by Visconti et al. [38]. They investigated the content of such toxic metabolites produced by Alternaria alternata, a fungus colonizing a wide variety of agricultural commodities in the field or during storage, at sub-ppm levels (LOD 30 pg, RSD 3.3–5.8%) in rice, maize and tomato samples by means of an isocratic elution (methanol-water, 60:40, v/v) followed by dual in-series electrodes detection operating in the “redox” mode (generator electrode +1.0 V, indicator electrode −0.1 V). Another toxin compound was the citrinin, a mycotoxin produced by several fungal species including Penicillium and Aspergillus [42]. Wiplinger et al. set up a procedure for analyzing such mycotoxin in different matrices (e.g., cereals, cereal-based foods, rice, wheat, etc.) by means of reversed-phase (RP-)HPLC in isocratic elution and detection with coulometric array (eight electrodes) [39] reaching LODs between 1 and 28.5 µg kg−1 (depending on the matrix) at detector V +600 mV. A toxic xenobiotic species, 4-nonylphenol (4-NP), was analyzed by HPLC with coulometric electrode array detection (CEAD) [40]. The authors studied the 4-NP migration from PVC film to food (cooked rice reheated in microwave oven) wrapped with such material. The detector V rose to +670 mV for the presence of the phenolic group. Finally, in 2008, Polish authors described a RP-HPLC method with coulometric electrochemical detection for the determination of folic acid (FA) in fortified cereal products and fruit juices [41]. FA, simply vitamin B9, is a cofactor essential for the synthesis of purines and pyrimidines and in the production of methionine from homocysteine [43]: it is required in the diet because humans cannot synthetize it, so it is present in fortified-folate alimentary food. The authors developed an HPLC method for analyzing it: an isocratic elution allowed to separate FA from folate with low detection limits (1.3 and 4.5 ng mL−1, respectively), high correlation coefficients (r ≥ 0.998), good recoveries (98.0% and 103.6%, respectively), and resolution within a minimum analysis time of 16 min. For achieving good analysis, high potentials (potentials for the guard cell, electrode E1, and electrode E2 were set at +0.85, +0.20, and +0.80 V, respectively) were used for avoiding the detection of oxidized compounds and for increasing the sensitivity.

3.2. Meat and Fish

Meat and fish are two matrices where HPLC elution is largely applied for studying nutritional or toxic compounds. On some occasions, different authors have proposed the coupling with an electrochemical detector instead of ultraviolet/fluorescence/mass spectrometry detection. Table 2 resumes all the data collected by the different papers.
First, in 1989 Vuoreal et al. described a RPHPLC method with coulometric dual-electrode detection (RPHPLC-CDD) for analyzing tyramine, a naturally trace amine derived from tyrosine, in fish and offal [44]. The dual electrode allowed the authors to remove the interfering compounds in the first cell (thanks to their oxidation) and to detect tyramine in the second in just 5 min for the overall procedure. Five years later, Turberg et al. published a paper [45] showing the determination of ractopamine hydrochloride, an animal feed additive administered to animals for meat production [54], banned in some countries. Extracts from swine, cattle and turkey feed samples were analyzed by RP-HPLC in isocratic elution with CDD as detector (no analytical parameters were reported). One year later, two interesting papers reported the determination of tyrosine and coenzymes in food materials. Particularly, Bernwieser et al. [46] determined o and m-tyrosine in chicken extracts. They performed an isocratic elution on a reversed phase column, after they took advantage of the oxidative/reductive detection mode for the two isomers. The coulometric array detection was carried out at V +900 mV for the reductive form and at −200 mV for the oxidative one. In this way the authors reached high selectivity and sensitivity. Further, this approach was applied by Krach et al. for analyzing the same compounds in shrimps [47] reaching similar LODs (1.9 µg L−1). A paper published in 2000 reported the coupling HPLC with CEAD for investigating the coenzymes Q9 and Q10 in different meat foods (e.g., beef steak, beef heart, herring fillet) [48]. The authors reached good LODs (20 and 30 µg L−1, respectively) and obtained results quite close to those obtained by HPLC-diode array detector (HPLC-DAD).
HPLC-ED has also been successfully used for HAAs determination. They are the product of the combustion reaction of creatine, creatinine, amino acids and sugars: these compounds were formed during the exposure of meat, poultry and fish to high temperatures with a risk to human health [55]. The IARC has classified HAAs as possible or probable carcinogens (group 2A or 2B) [56]. Krach et al. applied a HPLC method in isocratic elution coupled with coulometric array detection for determining some HAAs (i.e., 2-amino-3-methylimidazo [4,5-f]quinoline (IQ); 2-amino-3,8-dimethylimidazo[4,5-I]quinoxaline (MeIQx); 2-amino-3,4,8-trimethyl-imidazo[4,5-f]quinoxaline (4,8-DiMeIQx); 2-amino-3,7,8-trimethyl-imidazo[4,5-f]quinoxaline (7,8-DiMeIQx) in soup cubes [49]. The role of the different cells was exploited by authors for reaching high sensitivity (LODs between 2.5 and 27.5 µg L−1). In fact, some interfering compounds were removed in the first cell because HAAs were oxidized from the second cell to the last one. In 2004 Gerbl et al. proposed an HAAs analytical determination based on HPLC-ED in meat samples [50]. In particular, the multichannel coulometric detector consisted of eight working electrodes in two cell blocks. The samples examined were, in addition to a reference standard solution, a standardized meat extract and real samples purchased at a local fast-food restaurant such as sausage, pork knuckle and ground beef. The reference standard solution consists of a solution of five polar HAAs and five less polar HAAs in concentrations ranging between 0.8 and 2 μg g−1 in methanol. The same compounds were added to the standardized meat extract in concentrations between 50 and 100 ng g−1. The polar amines examined were: 2-amino-1,6-dimethylimidazo[4,5-b]pyridine (DMIP); IQ; 2-amino-3,4-dimethylimidazo[4,5-f]quinoline (MeIQ); MeIQx; 4,8-DiMeIQx; 7,8-DiMeIQx. The least polar HAAs added were: 2-amino-9H-pyrido[2,3-b]indole (AαC); 2-amino-3-methyl-9H-pyrido[2,3-b]indole (MeAαC); 2-amino-1-methyl-6-phenylimidazo[4,5-b]pyridine (PhIP); 3-amino-1,4-dimethyl-5H-pyrido[4,3-b]indole (Trp-P-1); 3-amino-1-methyl-5H-pyrido[4,3-b]indole (Trp-P-2). The standard solution was analyzed with a mobile phase of acetonitrile/acetic acid buffer/distilled water (15:10:75, v/v/v) and with working potentials established at +280, +320, +360, +400, +440, +480, +520 and +560 mV. For the standardized meat extract, the potentials of the eight electrodes were set at values +190, +260, +330, +400, +470, +540, +610 +680 mV. In both cases, the less polar HAAs were not detected due to interference and were therefore discarded from the study. The LODs for DMIP, IQ, MeIQ, MeIQx and 4,8-DiMeIQx were 0.8, 1.4, 2.1, 1.5 and 2.5 ng g−1, respectively. The technique was successfully applied to the real samples mentioned above. In the case of the pork knuckle sample, DMIP concentrations could not be detected due to matrix interference. In general, the highest concentrations were found in the pork knuckle.
Interesting applications regard the determination of electroactive compounds such as cysteine (Cys), L-glutathione (GSH), oxidized glutathione (GSSG) and GSH-oligomers (phytochelatins PCs). Their analysis is possible because these compounds present -SH and -SS- groups in their formula. Potesil et al. managed to separate them by means of RP-HPLC with CEAD (up to 12 cells) [51]: in particular, they found out that GSSG and PCs were detected at V +780 mV whereas Cys and GSH at +680 mV and the LOD were between 3.9 and 27.3 µg L−1. This method was used by authors for assessing the effect of acute toxic contamination on fish tissues due to silver ions, for instance. On the other hand, Bayram et al. followed a similar approach for studying the GSH level in HepG2 cells [52]: a C18 column was used to isocratically elute GSH. Four coulometric cells were used for the detection; the maximum response was obtained at +600 mV with LOD of 0.46 µg L−1.
An analyzed phenolic compound is rosmarinic acid. It shows an excellent antioxidant activity, and it is generally used as an additive in meat products [57]: its determination is possible due to the ortho-hydroxyl groups positioned on the two phenolic rings present in its structure. Juric et al. developed a technique that involves the coupling of HPLC with coulometric detector (Coulochem III) [53]. The latter consists of two electrolytic cells in series, both having a porous graphite working electrode. The matrices used were a reference sample of minced meat heat treated at 200 °C for 15 min, fresh minced meat matured for five days at 4 °C and sausages matured for three days at 4 °C. The working potentials of the two electrolytic cells were chosen. Linear voltammograms with a V ranging between +250 and +650 mV were then recorded: they showed that the oxidative I signal for rosmarinic acid reached its maximum intensity at +500 mV, whereas it reached a plateau between +200 and +500 mV. In the first electrolytic cell the V (E1) was therefore set at +200 mV, whereas in the second the V (E2) was set at +500 mV. The LODs and LOQs obtained for the methodology were 0.33 and 1 ppb, respectively. The samples were analyzed before and after the ripening period: the results obtained show a reduction in the concentration of rosmarinic acid from 20%, in the case of sausage, to 60%, in the case of minced meat.

3.3. Oils, Seeds and Vegetables

These three matrices have been largely studied in different papers where different HPLC-ED procedures have been developed for determining electroactive compounds. Table 3 resumes the data reported in this section.
HPLC coupled with coulometric electrode array detection (CEAD) with 16 working electrodes was used for determining phenolic compounds (i.e., p-hydroxybenzaldehyde, p-coumaric acid, ferulic acid, rutin, and naringenin) in tomatoes (LOD 6 µg L−1) [58] and for analyzing carotenoids (i.e., α-carotene, β-carotene, and lycopene) in salad samples (highest response between +380 and +500 mV) [59]. Phenolic carotenoid and tocopherol compounds were the objects of some studies carried out in the oil matrix [60,61,62,63]. In all cases, the authors focused their attention on the detector response: they found both that the response was linear over three orders of magnitude and that the ED performance was much better than the UV detection. Following the analysis of these papers, the authors agreed that the phenolic investigation could be used for determining the oil adulteration; further, they stated that the HPLC-ED procedure was valid, sensitive and effective for this aim and it could be used as routine method.
Finally, a very recent paper regarded the determination of six strobilurin fungicides residues (azoxystrobin, kresoxim-methyl, dimoxystrobin, picoxystrobin, pyraclostrobin and trifloxystrobin), a group of natural products and mostly contact fungicides with a long half time, in bean [64]: the authors developed an analytical method based on a boron-doped diamond (BDD) electrode with amperometric detection homemade coupled to HPLC with UV-Vis detection. The BDD use gave them some advantages such as low background currents, a wide electrochemical potential window, favorable electron-transfer kinetics, and surface inertness. The amperometric detection was optimized by studying the cyclic voltammetry of each compound investigated in the range 1.0 and 2.0 V: finally, the V was set up at +1.9 V, which was the most sensitive one for the simultaneous determination of such chemicals. With the amperometric detection approach, the authors achieved regression equations for each strobilurin with R-squared (R2) above 0.9972, LODs ranging between 1.37 and 1.57 µg kg−1 and LOQs between 4.15 and 4.77 µg kg−1, recoveries between 62.3 and 95.2% with RSDs between 2.3 and 9.5% and precision below 4.5%.

3.4. Fruits and Fruit Juices

In these matrices, the HPLC-ED is basically used for determining nutritional compounds; Table 4 shows the data. Two interesting examples are from Lebiedzinska’s group: in the first paper the authors compared a developed HPLC-CDD method with a well-known HPLC-UV procedure for determining pyridoxamine, vitamins B1, B6 and B12 in fruit juices [65] and seafood, whereas in the second one, cited above, they developed an HPLC-CDD method for analyzing folic acid (FA) and 5-formyltetrahydrofolate (5-CHO-THF) in fortified fruit juices [66]. In both cases the interfering compounds were oxidized at the first working electrode whereas the target compounds were analyzed at the second electrode. The authors suggested the method for FA and 5-CHO-THF to be valid for routine analysis. Gazdik et al. reported a method for analyzing vitamin C in orange and apples with a LOD of 15.9 µg L−1 [67].
Phenols and polyphenols are a large class of compounds that can be “easily” detected by electrochemical detection. For instance, 36 flavonoids and 27 phenols were analyzed by Achilli et al. by means of gradient elution RP-HPLC coupled with 16 electrodes for an array detection [68,69]. No information on LODs was reported for flavonoids, whereas a LOD of 0.0003 µg L−1 was reported for phenols: the only consideration reported in both papers regarded the suggestion to perform electrochemical cleaning after the analysis for avoiding a reduction in the electrode efficiency. Similar determination was also made by Gamache et al. in fruit and juice reaching LODs ranging between 0.001 and 0.2 µg L−1 [70].
Another matrix in which the coupling between HPLC and CEAD was effective was strawberry. Some authors developed such methods for studying the oxidative degradation of flavonoids, and especially the unknown compound generated during this process [71]. The authors identified the presence of two electro-active groups at +460 and +620 mV, respectively. On this basis, they proposed the first to be a hydroxy or a methoxy substituent on an aromatic ring, and the second to be a compound similar to p-hydroxybenzoic acid. Further, they used HPLC-DAD and HPLC-MS to confirm the compound present in 6 kGy-irradiated food, namely hydroxybenzofuranones.
An Italian group published a paper regarding the determination of some flavonoids such as eriocitrin, hesperidin, quercetin, naringin and narirutin in orange juice by HPLC-CDD [72]. The authors reported that the higher potential values could cause a background I increase because of electrooxidation of possible impurities present, resulting in a decrease in the signal-to-noise ratio (LODs ranging between 11.8 and 793 mg kg−1). It should be noted that the authors worked hard comparing the HPLC-CDD method with the HPLC-UV and HPLC-MS analyses: they stated that these latter methods were more precise and sensitive than the HPLC-CDD one and that the selectivity of HPLC-CDD analysis was comparable to that HPLC-MS and higher than that HPLC-UV.
Finally, an HPLC-CEAD method was carried out for investigating the effect of a pear juice adulteration [73]. In particular, the authors investigated the content of phloretin glycoside, a bioactive compound naturally present in pear and apple fruits and in juices as consequence of the processing conditions [74].
Table 4. HPLC-ED analysis performance in the analysis of different compounds in fruit and juice fruit matrices. The term “N/A” means the information is absent in the paper.
MatrixAnalyteColumnPotential 1Linearity RangeLOD 2Recovery 3RSD 4Ref.
fruit juicesvitamins B1, B6, B12C18+0.85 V2–2800 ng mL−10.0021–9.2 ng mL−196.3–101.31.3–7.3[65]
fruit juicesfolic acidEurospher 100 C18+0.8 V0.06–2.0 mg L−10.04 mg L−178–971.2–1.7[66]
apple and pear juicevitamin CMetachem Polaris C18A RP+0.1 VN/A10 ngN/AN/A[67]
fermented beverages, fruit juicesphenolic compoundsHR 80 C18+0.18 < V < +0.78 VN/AN/AN/A0.70–5.90[68]
tap water, mineral waterphenols, herbicidesHR 80 C18+0.08 < V < +1.2 V0.1–10,000 µg L−10.08–0.45 ng L−196–1051.2–5.5[69]
juice fruitsphenols, flavonoidsM.S. Gel C18+0.06 < V < +0.90 VN/A1–200 ng mL−1N/A1–5[70]
strawberriesphenolsHypersil ODS+0.46, +0.62 VN/AN/AN/AN/A[71]
orange juiceflavonoids, flavones, flavonolsC18−0.5, +0.7, +0.8 V2–250 µg mL−10.13–1.84 µg mL−194–980.4–10[71]
juicesphloretin glycosidesHicarbosphere 3ODS+0.60 VN/AN/AN/AN/A[73]
apple, fruit, purées, juicesphloretin glycosidesHicarbosphere 3ODS+0.60 VN/AN/AN/AN/A[74]
1 Potential of working electrode; 2 LOD: limit of detection; 3 recovery expressed as %; 4 RSD: relative standard deviation, expressed as %.

3.5. Beverages

The beverage matrix is well suited to the determination by means of HPLC-ED. During the last three decades, different papers concerned the use of such coupling for determining nutritional or toxic compound in water [75,76], milk [77,78,79], tea [80,81], beer [82,83], wine [84,85], alcoholic drinks [86] and brandy [87] samples. Table 5 shows the analytical parameters reported in these papers.
Among the different papers related to the water matrix, two papers deserved to be mentioned. In the first paper [75], toxic compounds such as nitro-pesticides (4-nitrophenol, 3-methyl-4-nitrophenol, parathion-methyl, fenitrothion and parathion-ethyl) were analyzed by means of the HPLC-CDD method in water samples without being subjected to a preconcentration step. The interest in this paper regards the nitrophenols’ behavior. In fact, their direct determination was not possible due to the high negative potential needed for the compound reduction. A cell was devoted to the oxygen elimination from the mobile phase because it interfered in the detection, and the second cell allowed the oxidation and the related compound determination. By this method, the authors were able to reach LODs at ppb levels in river and drinking water samples. On the other hand, the second paper [76] focused the attention on the determination of some xenoestrogens such as bisphenol A (BP-A), 2,4-dichlorophenol (2,4-DCP), 4-tert-butylphenol (BP), 4-n-pentylphenol (PP), 4-n-hexylphenol (HexP), 4-n-heptylphenol (HepP), 4-octylphenol (OP), and 4-nonylphenol (NP), by means of HPLC-CEAD preceded by a solid phase extraction (SPE) step as clean-up. Actually, the method was developed by Braunrath et al. for analyzing canned foods [88] but it was adapted by Inoue et al. to drinking water samples; they reached LODs ranging between 0.01 and 0.02 µg L−1.
Milk is considered a very hard matrix to analyze [89] because it is strongly subjected to exogenous compounds. Japanese authors determined nitroxynil in cow milk by HPLC with dual electrode detection [78]. This compound shows a nitro and a phenolic group in its formula: these groups require opposite “high” potential for their reduction/oxidation (−700/+800 mV). Further, the authors used two cells and they combined the guard cell with the first electrode for minimizing the interferences. By this procedure they obtained LOD of 0.7 µg L−1 in commercial milk samples. The same research group analyzed another anthelmintic compound, bromofenofos, by HPLC in isocratic conditions and coulometric dual electrode detection [77]. The compound was determined as its electroactive form, dephosphate bromofenofos, in the second cell of the detector. The authors reached a very good LOD, 0.2 µg L−1 in raw milk samples, and high specificity so that they proposed such method as the routine protocol. An important class of contaminants in milk are antibiotics. An example is the determination of different tetracyclines (TCs) by RP-HPLC-CEAD method [79]. The coulometric array detection is based on four detector cells: the first cell is necessary for removing interferences whereas TCs (i.e., methacycline MTC, tetracycline TC, doxycycline DC, chlortetracycline CTC, oxytetracycline OTC) were analyzed in the other three cells (LODs ranging between 10 and 25 µg L−1).
Tea polyphenols and isoflavones are a class of compounds with high electrochemical behavior (aromatic group and phenolic group). Wu et al. set up a method based on HPLC with an eight-cell detector for analyzing such compounds in different foods [80]. The separation occurred by gradient elution, whereas the detection was carried out by increasing potentials strictly depending on the hydroxy groups present in the molecules (e.g., +350 mV for tri-hydroxyphenols, +400 mV for o- and p-diphenols, and +700 mV for m-diphenol). Another class of phenol investigated were the catechins and their related epimers, a type of natural phenol and antioxidant. Some of them, namely (−)-epigallocatechin gallate (EGCG), (−)-epigallocatechin (EGC), (−)-epicatechingallate (ECG), (−)-epicatechin (EC) and (+)-catechin hydrate (C), were analyzed by Novak et al. in green and black tea samples: RP-HPLC-ED measures were compared with measures performed by square-wave voltammetry (SWV) [81]. The paper focused its attention on the development of the novel method, SWV: the well-validated method RP-HPLC with electrochemical detection (represented by a wall-jet type flow cell consisted of glassy-carbon working electrode at V of +0.7 V) was used as comparison for testing. The authors obtained good LODs and LOQs ranging between 23.23 nM (C) and 100.7 nM (ECG) and 77.43 nM (C) and 335.8 nM (ECG), respectively, as well as recoveries ranging between 83.7 and 105.2% (low matrix effect).
Among the different alcoholic beverages present in the market, beer shows low alcoholic grade (between 0.5% and 20% alcohol in volume ABV, normally present ranging 4–6% ABV). This matrix is a good starter for alcoholic drinks. Coumaroyl-glycerol, indicating the maize and sorghum addition, was determined in beer samples for detecting adulteration: after the SPE clean-up, the sample was analyzed by HPLC in isocratic elution followed by electrode array detector [82]. Phenolic compounds were also analyzed in beer: the authors compared 11 columns with different stationary phases optimizing the best analytical conditions [83].
Wine is another important drink at medium alcoholic grade. Different sensors have been set up during previous decades for analyzing different analytical parameters or flavors [90,91,92]. This review would like to highlight two papers dealing HPLC analysis followed by electrochemical detection [84]. In particular, Larcher et al. determined some phenolic compounds (i.e., 4-ethylphenol, 4-ethylguaiacol, 4-vinylphenol, and 4-vinylguaiacol) due to their presence being a potential cause of bad taste. The authors used an isocratic elution and a coulometric array detection, reaching a LOD of 1.34 µg L−1. The other paper investigated the lignans content in red and white wines by HPLC-CEAD method [93]. The authors determined the best potentials using the hydrodynamic voltammograms and reached LODs ranging between 0.2 and 1.2 µg L−1.
Finally, two papers were published on the determination of different compounds in high-alcoholic-grade drinks, in particular some phenolic acids and aldehydes in distilled alcoholic beverages [86] and fifteen benzoic and cinnamic acid derivatives in brandy samples [87] by means of HPLC followed by coulometric detection. In the first paper, Friedrich and Sontag used dual cells for oxidative/reductive (compounds oxidized at +0.65 V and reduced at 0.0 V, respectively) modes for analyzing 3,4-dihydroxybenzaldehyde, 4-hydroxy-3-methoxy benzoic acid, 4-hydroxy-3,5-dimethoxybenzoic acid, 4-hydroxy-3-methoxy benzaldehyde, and 4-hydoxy-3,5-dimethoxy benzaldehyde in whisky, bourbon, cognac, brandy, rum and calvados samples [86]. They reached LODs ranging between 0.01 and 1 ng with an RSD ranging between 1.2% and 11.2%. The method did not require any sample preparation, whereas the authors stated that only electrode cleaning was needed when the calibration curve slope decreased. The other paper regarded the determination of some phenolic acids (i.e., salicylic acid, benzoic acid, cinnamic acid, veratric acid, gentisic acid, vanillic acid,4-hydroxybenzoic acid, o-coumaric acid, p-coumaric acid, ferulic acid, protocatechuic acid, syringic acid, caffeic acid, sinapic acid and gallic acid) in a brandy sample [87]. The authors compared the performance of a RP-HPLC-ED method with HPLC-UV and HPLC with particle-beam electron-impact mass spectrometry (PB-EI-MS) procedures. Hydrodynamic voltammograms were investigated for each compound for determining the peak potentials (from +260 to 335 mV for the cathodic peak and from +510 to +1450 mV for the anodic peak) for the oxidation and the reduction and oxidation of each phenolic acid. They found very good linearity (0.999 in all the cases) LODs ranging between 3.1 and 140.0 µg L−1; these values are quite similar to those determined by HPLC-PB-EI-MS, 6.0–152.1 µg L−1 (it should be considered that caffeic acid, p-coumaric, acid gallic and acid 4-hydroxybenzoicacid were not analyzed by the MS technique). The authors stated that LODs obtained by LC-PB-EI-MS were about 1000-fold higher than those determined using ED, whereas HPLC-UV was not effective due to the presence of numerous interferences and inadequate sensitivity.

3.6. Honey

Honey is a complex matrix which requires different analytical steps (e.g., extraction processes, liquid–liquid separation, clean-up procedures, etc.) for analyzing its nutritional composition or the contaminants present. On the other hand, the use of ED as a detector for HPLC analysis could be a reasonable opportunity when electroactive compounds are analyzed. In this section, the main papers regarding this determination are reported and in Table 6 the analytical parameters are highlighted. Two examples of this occurrence are described by Fuchs et al. [94] and Jörg et al. [95]. Both researcher groups set up an analytical procedure based on HPLC separation and CDD for analyzing phenolic compounds in honeys. The methodology was the same for both papers: the first cell oxidized the compounds for removing the interferences, whereas the second cell allowed the determination. Fuchs et al. reached LODs between 0.3 and 9.2 ppm, whereas Jörg et al. obtained LODs ranging from 5 to 80 µg L−1. Further, Jörg et al. applied the same procedure for determining methyl-p-hydroxybenzoate, methyl vanillate, methyl syringate, trans-p-methyl coumarate and trans-methyl ferulate, still in honey samples (LODs between 0.1 and 2 µg L−1) [96].
Finally, a paper related to the determination of thiamethoxam residues in honeybees [97] deserved to be cited. In this publication the authors determined such insecticide, class of neonicotinoids, which is highly toxic to honeybees by contact or ingestion, by means of RP-HPLC with a CoulArray electrochemical detector with four electrodes (three set at 100, 125 and 150 mV, and the fourth at 880 mV). The sensitivity detection was improved by a photochemical reaction, otherwise the LOD would have been too high (680 mg L−1). After finding the best voltages (see above), a calibration curve in the range 0.01358–1.358 mg L−1 was obtained with a slope of 0.0014, intercept of 2.1044 and a linear coefficient of 0.9998, whereas LOD, calculated at 2.1 ng g−1, and the recovery, 67.6%, were considered suitable for detecting low thiamethoxam levels in such matrix.

3.7. Aromatic Plants and Other Food Matrices

An example of application in aromatic plants is the study by Cantalapiedra et al. [98]. The authors described the determination of vanillin, eugenol, carvacrol and thymol in aromatic plants (basil, peppermint, cloves and vanilla). The paper focused its attention on the comparison between three types of detectors, an amperometric detector, a coulometric detector and a UV spectrophotometer, coupled to HPLC. The amperometric sensor consisted of a working electrode in glassy carbon with a surface of 7 mm2, a reference electrode in Ag/AgCl and a counter electrode in gold. The flow coulometric sensor consisted of a porous carbon working electrode, a palladium reference electrode and a platinum counter electrode. The mobile phase was chosen according to the response obtained from the chromatographic runs in a pH range between 2.5 and 7: the optimal pH was found to be 4.6 (acetic acid buffer and ammonium acetate) with the addition of methanol as an organic modifier to optimize its adsorption to the solid phase (buffer/methanol 35:65, v/v). The working potentials of the electrochemical cells, both amperometric and coulometric, were determined by injecting the four analytes at different potentials. The voltammograms obtained were studied: the best ratio between signal intensity and noise was reached at the V of +0.925 V for the amperometric detector, whereas it was +0.500 V for the coulometric one. The validation of the method was carried out by analyzing real samples of commercial essences of the aromatic plants mentioned above. The coulometric detector provided a more sensitive response. However, more selective results and lower background noise were obtained with both electrochemical detectors than those observed with the spectrophotometric detector. In Table 7 it could be noted that the LOD and LOQ values achieved by means of electrochemical detectors were considerably lower than those obtained with spectrophotometric detection.
Another compound of interest is resveratrol (3,5′,4-trihydroxy-trans-stilbene), a phytoalexin produced by plants in response to exogenous stress, important for its benefits to human health (antioxidant, anti-inflammatory, anti-aging, therapeutic and preventive properties against tumors, and prevention against cardiovascular diseases) [99,100]. Němcová et al. compared the performance of two detectors coupled to an HPLC system for the resveratrol determination [101]. The first detector was an amperometric sensor, with a working electrode in carbon paste (Carbon Paste Electrode, CPE); the second was a spectrophotometer with a λ at 306 nm. Six samples of common buckwheat and two samples of tartaric buckwheat were analyzed. All samples were ground and subjected to ethanol extraction followed by filtration. The filtrate was concentrated and added with ethanol and filtered again. The solution obtained was used for the analyses. The optimal conditions for the electrochemical determination of trans- and cis-resveratrol were determined by the construction of linear hydrodynamic voltammograms with Britton–Robinson (BR) buffer diluted with acetonitrile (1:1, v/v), in the V range between 0 and 1.4 V and pH at 3, 5 and 7. The voltammograms were obtained by injection of 20 μL of solutions containing the analytes in concentrations of 1 × 10⁻⁴ mol L−1. Table 8 shows the LODs of the two detectors used, both spectrophotometric and amperometric.
The sensitivity of the detectors is comparable with regard to trans-resveratrol, whereas in the case of cis-resveratrol the electrochemical detector has a better sensitivity than the spectrophotometric detector, which induces the isomerization of this compound. However, the relevant difference is found in the selectivity: the CPE was more selective because other electrochemically active substances were absent. Finally, the authors analyzed the trans-resveratrol content in tartaric buckwheat grains (3.43–3.50 mg kg−1) and in common buckwheat grains (0.98–1.68 mg kg−1), and in tartaric leaves (0.19–0.20 mg kg−1) and in those of common buckwheat (1.81–1.82 mg kg−1).
Two officinalis plats were the matrices of Skriniar group’s paper. They determined carnosic acid in rosemary (Rosmarinus officinalis) and sage (Salvia officinalis). This compound, naturally present in these two plants (their dried leaves contain 1.5–2.5% of carnosic acid), is a benzenediol abietane diterpene and is used as an antioxidant preservative in food and nonfood products (extracts of rosemary, E392) [102]. The authors exploited the presence of the benzenediol group for the electrochemical detection, particularly the CDD, and developed a HPLC-CDD method (LOD 1.2–1.4 µg L−1). The same authors made a comparison between this method and the HPLC-UV method: they stated that the electrochemical detection was more effective that the other one
Coenzyme Q10 (CoQ10H2, ubiquinol) in dietary supplements was the target of Tang [103]: he applied a methodology previously set up for analyzing such compounds in human breast milk [104]. He exploited the ubiquinone/ubiquinol reversible redox and the related oxidative reaction at the electrode (LOD was 5 µg L−1). A more detailed paper was published by Kubo et al. in 2008 dealing the determination of ubiquinol-10 and ubiquinone-10 in the Japanese diet by means of HPLC-ED [105]. These two forms (ubiquinol-10 is reduced form and ubiquinone-10 is oxidized form) of the coenzyme Q10, extracted directly with 2-propanol, were analyzed in seventy foodstuffs (i.e., meat, different types of fish and shellfish, fruits, pulses, potatoes, dairy products). The detection was carried out by means of an amperometric electrode at V of 600 mV (vs. Ag/AgCl). Even if the paper was focused on the determination of such forms in the different matrices and the relative calculation of average intake per day, the authors determined the analytical parameters for achieving the best performances. Under the analytical conditions studied (pH, extraction solvent, mobile phase and column), the method was simple and reliable with very interesting data: correlation coefficient (0.999 for both compounds) in the range 0.08–100 µg g−1; LOD of 0.07 µg g−1; recoveries ranging between 87–112% with coefficients of variation (CVs) between 2.2 and 21%, and 97–106% with CVs between 0.9–4.9% for ubiquinol-10 and ubiquinone-10, respectively; good within-day (101–109% and 0.3–9.9%; 106–115% and 0.6–10.7%, respectively) and between-day (101–110% and 2.4–15.4%; 106–114% and 3.0–13.8%, respectively) accuracy and precision.
A HPLC-CEAD method was developed for analyzing some compounds responsible of the beer taste, namely α-acids, β-acids and xanthohumol in hop samples. Kac et al. determined the best electrode potentials for the analysis [106]: below +300 mV no oxidation occurred whereas at +300, +500 and +700 mV the oxidation of the three classes of compounds, α-acids, β-acids and xanthohumol, respectively, occurred with a sensitivity much higher (between nine and twenty times) than this by HPLC-UV method.
Nel 2008 Benová et al. dealt the determination of stilbenes in three varieties of Polygonum cuspidatum [107]. They analyzed the content of resveratrol and its analogs, namely astringin and piceatannol and piceid, by extraction with aqueous ethanol followed by reversed-phase-(RP-)HPLC with coulometric detection. An eight-channel coulometric array detector working at potentials of 200, 300, 400, 500, 600, 700, 800, and 900 mV was used. At each V a chromatogram was obtained: piceatannol was oxidized at 500 mV, astringin and piceid at 600 mV and resveratrol at 700 mV. Under these conditions the authors achieved very good correlation coefficients (r2 > 0.9975) and recoveries (between 90.2 and 95.3% for all the compounds) as well as LODs and LOQs, ranging between 0.008 (resveratrol) and 0.025 mg L−1 (astringin) and between 0.029 (resveratrol) and 0.083 mg L−1 (astringin) respectively, were lower than those obtained by means of HPLC coupled with diode array detection (DAD) (i.e., LOD 0.02 mg L−1 for resveratrol and piceid and 0.32 mg L−1 for astringin). Finally, the authors applied this methodology to different Polygonum cuspidatum varieties (i.e., var. japonica, var. sachalinensis, var. bohemica) for determining the content of the four stilbenes.
Another very interesting paper concerns the determination of the azo dyes, in particular the Sudan dyes. Although the use of Sudan in foods is now banned in many countries, because Sudan dyes are classified as category 3 carcinogens (not classifiable as to its carcinogenicity to humans) by IARC, they are extensively used as powder for giving a natural red appearance to the food and have been found in some products sold in the European countries. The EU fixed a limit at 0.5–1 mg kg−1. Basically, different analytical methodologies are available and reported in literature: recently, multi-wall carbon nanotubes (MWNTs) were used in an ionic liquid-gel-modified electrode for detecting Sudan I, Sudan II, Sudan III, and Sudan IV separated by flow injection analysis (FIA) and HPLC, in soft drinks [108]. Particularly, a glassy carbon electrode was modified by application of a thin gel film of MWNTs. The auxiliary and reference electrodes were Pt wire and Ag/AgCl, respectively. The electrochemical reaction was followed by cyclic voltammetry: the linear regression yield r was >0.99 in the range 10–0.25 ppm, the max peak V of the four compounds were determined at 0.95 V, LODs and LOQs ranged between 0.001–0.025 ppm and 0.005–0.10 ppm, respectively, with recoveries between 93.91 and 104.09%. Finally, the authors reported the determination of the four different Sudan dyes in soft drinks: their conclusions regarded that the amperometric signal was well-defined and peaks well-separated, with no interference from the matrix.
Theisen et al. described a method for analyzing sulfite in food by means of HPLC analysis coupled with a plant sulfite oxidase biosensor (immobilized enzyme reactor, IMER) [109]. This coupling, which was very easy but really interesting, allowed the authors to achieve good analytical parameters for analyzing sulfites in 15 commercially purchased juices such as red grapes and white grapes and fruit juices based on lemon, tomato and peach. This biosensor was compared with a similar one using animal sulfite oxidase: the detection limit (0.01 mg L−1 SO2), linear range (0.04–20 mg L−1 SO2) and stability were superior. Simultaneously, the authors also evaluated the performance of the entire methodology (HPLC-IMER): this was better than that carried out by the International Federation of Fruit Juice Producers (IFU) official method [110], IFU 7a, which was based on the Monier-Williams method optimized for fruit juices, in terms of speed (8 vs. 30 min), sensitivity, specificity and recoveries.
Table 9 resumes all the analytical data reported in the different studies discussed here.

3.8. A Particular Compound: Glyphosate

A compound that can be determined through the coupling of HPLC and electrochemical sensors is glyphosate (Gly), an inhibitor of the metabolic pathway essential for the biosynthesis of essential plant aromatic amino acids. It deserves a special section for the implications related to their toxicity [111]. The use of Gly-based herbicides began around the 1970s, but following the expiration of Monsanto’s patent, several Gly-based formulations were commercialized on a large scale [112]. Gly, widely used due to its low toxicity to humans, is among the products most found in water together with its main metabolite (aminomethylphosphonic acid, AMPA): it is characterized by a half-life in the soil of between 76 and 958 days. However, its use has led to a serious problem of environmental contamination. It has recently been included in group 2A by the International Agency for Research on Cancer (IARC), classifying it as a probable human carcinogen [113]. Due to their chemical structure, Gly and AMPA are available for electrochemical determination. The studies by Coutinho et al. propose a rapid and selective analytical technique that allows their determination in food matrices. The research, conducted between 2007 and 2008, concerned the coupling of HPLC with a coulometric sensor [
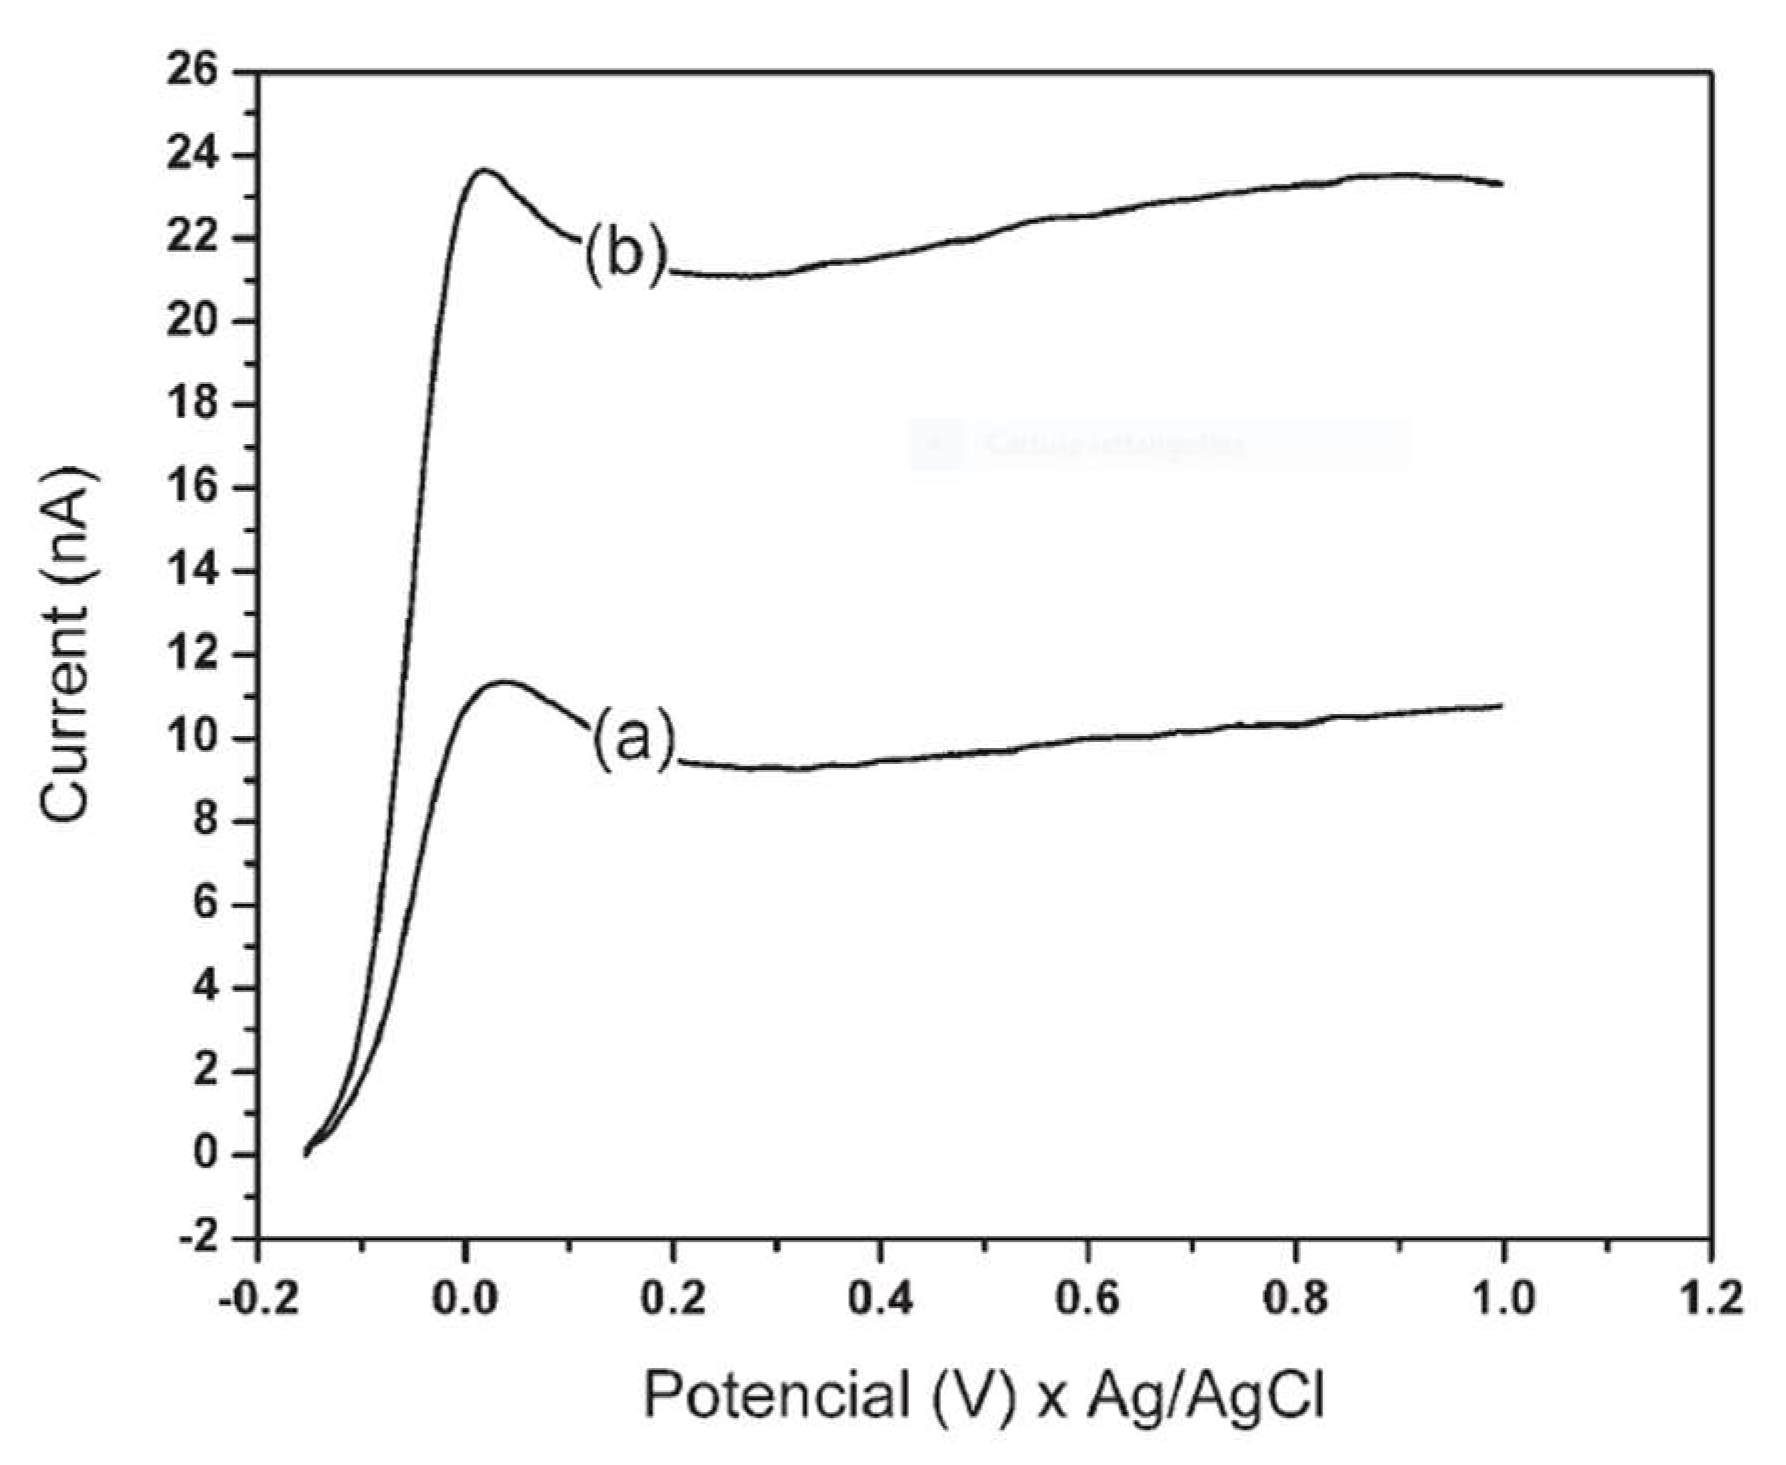
114]. The latter consists of a 60 μm diameter copper microelectrode as a working electrode and an Ag/AgCl reference electrode. This sensor allowed the Gly detection by its complexation with copper (II) thus producing an increase in the anode I, as evidenced in Figure 2. The first step of the study was the optimization of the parameters for the electrochemical detection according to the signal obtained during the construction of voltammograms. These were recorded at a scanning rate of 0.1 V s−1 for three types of mobile phases with three different pH values: an alkaline solution of NaOH 0.1 mol L−1 at pH 13, a phosphate buffer at pH 6.5 and a carbonate buffer at pH 11.4. Figure 7 shows the linear voltammograms obtained with the phosphate buffer.
The comparison between the blank and a Gly sample at known concentration highlighted that in all cases there was a linearity of the signal as a function of the concentration, but the use of phosphate buffer allowed to achieve better sensitivity and precision. The latter was therefore chosen as the mobile phase for subsequent analyzes. Methanol was then added as an organic modifier in order to regulate the elution rate and thus the peak resolution. In addition to the mobile phase, i.e., phosphate buffer 0.03 mol L−1 and methanol (75:25, v/v), the working V was also experimentally determined, established as +0.5 V. Using such parameters, tomato juice was analyzed after spiking with Gly at concentration of 6.8 mg L−1 was added: the recovery was 88%. The LOD calculated that three times the background noise was 0.1 mg L−1. The value is satisfactory as it is lower than the maximum residual limit (MRL) of the Gly content established for food and drinks by the Environmental Protection Agency (EPA). The selectivity gives the coulometric detector a particular advantage: it is increased compared to other detectors thanks to the parameters used, specific for the Gly. Other analytes such as amino acids and organic acids, however, which have the ability to form complexes with copper (II), are not revealed. Other advantages of the technique are the simplicity of sample preparation, which does not require extraction or clean-up procedures, the cost-effectiveness of the detector, speed, as well as derivatization to be necessary [114]. Subsequently, the same authors evaluated the analytical technique on apple juice and grape juice samples. The samples were analyzed following the addition of 6.8 mg L−1 of Gly without clean-up or preconcentration steps: the preparation of the sample involved only centrifugation and filtration of any solid particles [115].
Coutinho et al. continued the study in the following year [116]. They applied the technique for the simultaneous determination of AMPA and Gly. In particular, AMPA determination is useful in order to obtain results that are more in line with the (real) total Gly content. The same technique described in the previous papers was applied with the only difference that, in this case, an electrochemical cell with three electrodes was used. In addition, a stainless-steel counter electrode was used. The working V was also evaluated by recording a voltammogram: it showed that the greatest signal for a standard mixture of Gly and AMPA, was obtained at V of +0.3 V. A sample of mineral water fortified with Gly (8.4 μg mL−1) and AMPA (55.5 μg mL−1) was injected: the chromatogram obtained was clean and the two peaks well resolved. The LODs were found to be 0.038 μg mL−1 for Gly and 0.24 μg mL−1 for AMPA. The technique, with no further preconcentration or clean-up step, was applied to real water samples: concentrations of AMPA and Gly were not revealed.
Table 10 reports the main analytical parameters found.

4. Conclusions

This review shows the state of the art of HPLC-ED coupling and its high potential in the food and environmental determinations. This technique has proved to be adequate for the analysis of various compounds of food/agricultural and environmental interest. The electrodes are connected to an electronic circuit with a powerful amplifier that manages to convert pI or nI in a detectable signal for data acquisition.
The electrochemical detectors prove to be highly competitive with respect to the detectors currently used such as photometric, spectrophotometric and mass spectrometric detectors. In fact, amperometric and coulometric detectors showed better sensitivity values. Furthermore, the use of specific working potentials allows matrix interference to be avoided by almost exclusively determining the analytes of interest. This means that the HPLC-ED has such a selectivity as to allow limitation of the sample preparation and clean-up procedures to a minimum. The technique is therefore quick and simple. In addition, this method offers advantages such as: the possibility of direct analysis, as derivatization is often not necessary; the cost-effectiveness of the instrumentation and the possibility of regenerating the electrodes, which allows numerous analyses in succession.
The authors would like to highlight that, after 15 years from a mini review related to electrochemical detection coupled with high-performance liquid chromatography in pharmaceutical and biomedical analysis, the problems related to the HPLC-ED coupling are almost the same (e.g., first among all, the ED performance in presence of the chromatographic gradient elution) [117]. The authors agree with the paper that coulometric array detectors are increasing their role, and are being used more due to their compatibility with HPLC system and their decreasing prices. Further, another reason is the possibility of using such sensors directly in situ, this will be a big opportunity in the future.

Author Contributions

Conceptualization, M.M. and P.A.; software, A.I.; validation, C.D.F., A.I. and I.N.; formal analysis, M.M.; investigation, M.M.; data curation, C.D.F., F.C. and I.N.; writing—original draft preparation, M.M. and P.A.; writing—review and editing, P.A.; supervision, P.A. All authors have read and agreed to the published version of the manuscript.

Funding

This research received no external funding.

Institutional Review Board Statement

Not applicable.

Data Availability Statement

Data are contained within the article.

Acknowledgments

The authors would like to thank Sergio Passarella for his kind help critically reviewing the papers.

Conflicts of Interest

The authors declare no conflict of interest.

References

  1. LaCourse, M.E.; LaCourse, W.R. Liquid Chromatography: Fundamentals and Instrumentation, 2nd ed.; Elsevier: Amsterdam, The Netherlands, 2017; pp. 417–429. [Google Scholar]
  2. Sekretaryova, A.; Vagin, M.; Volkov, A.; Zozoulenko, I.; Eriksson, M. Evaluation of the electrochemically active surface area of microelectrodes by capacitive and faradaic currents. ChemElectroChem 2019, 6, 4411–4417. [Google Scholar] [CrossRef]
  3. Yashin, Y.L.; Yashin, A.Y. Analysis of food products using high performance liquid chromatography and ion chromatography using electrochemical detectors. J. Anal. Chem. 2004, 59, 1121–1127. [Google Scholar] [CrossRef]
  4. Hulanicki, A.; Glab, S.; Ingman, F. Chemical sensors: Definitions and classification. Pure Appl. Chem. 1991, 63, 1247–1250. [Google Scholar] [CrossRef]
  5. Wolfbeis, O.S. Chemical sensors—Survey and trends. Fresenius J. Anal. Chem. 1990, 337, 522–527. [Google Scholar] [CrossRef]
  6. Lunte, C.E.; Kissinger, P.T.; Shoup, R.E. Difference mode detection with thin-layer dual electrode liquid chromatography/ electrochemistry. Anal. Chem. 1985, 57, 1541–1546. [Google Scholar] [CrossRef]
  7. Roston, D.A.; Kissinger, P.T. Series-dual electrode detector for liquid chromatography. Anal. Chem. 1982, 54, 429–434. [Google Scholar] [CrossRef]
  8. Sontag, G.; Pinto, M.I.; Noronha, J.P.; Burrows, H.D. Analysis of food by high performance liquid chromatography coupled with coulometric detection and related techniques: A review. J. Agric. Food Chem. 2019, 67, 4113–4144. [Google Scholar] [CrossRef]
  9. Ensafi, A.A. An introduction to sensors and biosensors. In Electrochemical Biosensors; Ensafi, A.A., Ed.; Elsevier: Amsterdam, The Netherlands, 2019; pp. 1–10. [Google Scholar]
  10. Curulli, A. Nanomaterials in electrochemical sensing area: Applications and challenges in food analysis. Molecules 2020, 25, 5759. [Google Scholar] [CrossRef]
  11. Bakker, E.; Qin, Y. Electrochemical sensors. Anal. Chem. 2006, 78, 3965–3984. [Google Scholar] [CrossRef] [Green Version]
  12. Park, J.; Nguyen, H.H.; Woubit, A.; Kim, M. Applications of Field-Effect Transistor (FET)–type biosensors. Appl. Sci. Conver. Technol. 2014, 23, 61–71. [Google Scholar] [CrossRef] [Green Version]
  13. Han, J.-W.; Rim, T.; Baek, C.-K.; Meyyappan, M. Chemical gated Field Effect Transistor by hybrid integration of one-dimensional silicon nanowire and two-dimensional tin oxide thin film for low power gas sensor. ACS Appl. Mat. Interfac. 2015, 7, 21263–21269. [Google Scholar] [CrossRef]
  14. Bergveld, P. The impact of MOSFET-based sensors. Sens. Actuator. 1985, 8, 109–127. [Google Scholar] [CrossRef] [Green Version]
  15. Cranny, A.; Harris, N.; White, N. Screen printed potentiometric chloride sensors. Procedia Engineer. 2014, 87, 220–223. [Google Scholar] [CrossRef] [Green Version]
  16. Antuña-Jiménez, D.; Díaz-Díaz, G.; Blanco-López, M.C.; Lobo-Castañón, M.J.; Miranda-Ordieres, A.J.; Tuñón-Blanco, P. Molecularly imprinted electrochemical sensors: Past, present, and future. In Molecularly Imprinted Sensors; Li, S., Ge, Y., Piletsky, S.A., Lunec, J., Eds.; Elsevier: Amsterdam, The Netherlands, 2012; pp. 1–34. [Google Scholar]
  17. Manjakkal, L.; Cvejina, K.; Kulawika, J.; Zaraskaa, K.; Szwagierczaka, D.; Socha, R.P. Fabrication of thick film sensitive RuO2-TiO2 and Ag/AgCl/KCl reference electrodes and their application for pH measurements. Sens. Actuator B Chem. 2014, 204, 57–67. [Google Scholar] [CrossRef]
  18. Revsbech, N.P.; Nielsen, M.; Fapyane, D. Ion selective amperometric biosensors for environmental analysis of nitrate, nitrite and sulfate. Sensors 2020, 20, 4326. [Google Scholar] [CrossRef]
  19. Nardiello, D.; Palermo, C.; Natale, A.; Quinto, M.; Centonze, D. Pulsed amperometric detection at glassy carbon electrodes: A new waveform for sensitive and reproducible determination of electroactive compounds. Anal. Chim. Acta 2015, 894, 1–6. [Google Scholar] [CrossRef]
  20. Gazdík, Z.; Zítka, O.; Řezníček, V.; Adam, V.; Krška, B.; Plšek, J.; Juríková, T.; Šaloun, J.; Babula, P.; Kizek, R. Utilization of HPLC-ED techniques for the screening of functional foods from resources of biodiversity. Agriculture 2009, 55, 80–87. [Google Scholar]
  21. Han, T.; Mattinen, U.; Mousavi, Z.; Bobacka, J. Coulometric response of solid-contact anion-sensitive electrodes. Electrochim. Acta 2021, 367, 137566. [Google Scholar] [CrossRef]
  22. Gründler, P. Chemical Sensors. An Introduction for Scientists and Engineers; Springer: Berlin/Heidelberg, Germany, 2007; pp. 123–132. [Google Scholar]
  23. Mani, V.; Devasenathipathy, R.; Chen, S.M.; Wu, T.-Y.; Kohilarani, K. High-performance electrochemical amperometric sensors for the sensitive determination of phenyl urea herbicides diuron and fenuron. Ionics 2015, 21, 2675–2683. [Google Scholar] [CrossRef]
  24. Honeychurch, K. Review: The application of liquid chromatography electrochemical detection for the determination of drugs of abuse. Separations 2016, 3, 28. [Google Scholar] [CrossRef] [Green Version]
  25. Adeloju, S.B. Amperometry. In Encyclopedia of Analytical Science, 2nd ed.; Worsfold, P., Townshend, A., Poole, C., Eds.; Elsevier: Amsterdam, The Netherlands, 2005; pp. 70–79. [Google Scholar]
  26. Honeychurch, K.C. Design and application of liquid chromatography dual electrode detection. Electrochemistry 2015, 13, 1–20. [Google Scholar]
  27. Matson, W.R.; Langlais, P.; Volicer, I.; Gamache, P.H.; Bird, E.; Mark, K.A. n−Electrode three dimensional liquid chromatography with electrochemical detection of neurotransmitters. Clin. Chem. 1984, 30, 1477–1488. [Google Scholar] [CrossRef]
  28. Banica, F.-G. What are chemical sensors? In Chemical Sensors and Biosensors: Fundamentals and Applications, 1st ed.; Banica, F.-G., Ed.; John Wiley & Sons: Chichester, UK, 2012; pp. 1–20. [Google Scholar]
  29. Thévenot, D.R.; Toth, K.; Durst, R.A.; Wilson, G.S. Electrochemical biosensors: Recommended definitions and classification. Anal. Lett. 2001, 34, 635–659. [Google Scholar] [CrossRef] [Green Version]
  30. Gaudin, V. Receptor-based electrochemical biosensors for the detection of contaminants in food products. In Electrochemical Biosensors; Ensafi, A.A., Ed.; Elsevier: Amsterdam, The Netherlands, 2019; pp. 307–365. [Google Scholar]
  31. Cui, F.; Zhou, Z.; Zhou, H.S. Molecularly imprinted polymers and surface imprinted polymers based electrochemical biosensor for infectious Diseases. Sensors 2020, 20, 996. [Google Scholar] [CrossRef] [Green Version]
  32. Songa, E.A.; Okonkwo, J.O. Recent approaches to improving selectivity and sensitivity of enzyme-based biosensors for organophosphorus pesticides: A review. Talanta 2016, 155, 289–304. [Google Scholar] [CrossRef]
  33. Ito, T.; Ogino, K.; Nagaoka, K.; Takemoto, K.; Nishiyama, R.; Shimizu, Y. Detection of 3-nitrotyrosine in atmospheric environments via a high-performance liquid chromatography-electrochemical detector system. J. Vis. Exp. 2019, 143, e58371. [Google Scholar] [CrossRef] [Green Version]
  34. Welch, L.E.; LaCourse, W.R.; Mead, D.A.; Johnson, D.C.; Hu, T. Comparison of pulsed coulometric detection and potential-sweep pulsed coulometric detection for underivatized amino acids in liquid chromatography. Anal. Chem. 1989, 61, 555–559. [Google Scholar] [CrossRef]
  35. Mögele, R.; Pabel, B.; Galensa, R. Determinaiton of organic acids, amino acids and saccharides by high-performance liquid chromatography and a postcolumn enzyme reactor with amperometric detection. J. Chromatogr. 1992, 591, 165–173. [Google Scholar] [CrossRef]
  36. Long, G.L.; Winefordner, J.D. Limit of detection: A closer look at the IUPAC definition. Anal. Chem. 1983, 55, 712A–724A. [Google Scholar]
  37. Arias De Fuentes, O.; Campanella, L.; Crescentini, G.; Falcioni, A.; Sammartino, M.P.; Tomassetti, M. Flow injection analysis of cholic acids in pharmaceutical preparations using a polymeric membrane ISE as detector. J. Pharm. Biomed. Anal. 2000, 23, 89–98. [Google Scholar] [CrossRef]
  38. Visconti, A.; Sibilia, A.; Palmisano, F. Selective determination of altertoxins by high-performance liquid chromatography with electrochemical detection with dual "in-series" electrodes. J. Chromatogr. 1991, 540, 376–382. [Google Scholar] [CrossRef]
  39. Wiplinger, M. Analyse von Citrinin in Cerealien Mittels HPLC-CEAD Nach Probenvorbereitung Mit ASE. Master Thesis, University of Vienna, Vienna, Austria, 2008. [Google Scholar]
  40. Inoue, K.; Kondo, S.; Yoshie, Y.; Kato, K.; Yoshimura, Y.; Masakazu, H.; Nakazawa, H. Migration of 4-nonylphenol from polyvinyl chloride food packing films into simulants and foods. Food Addit. Contam. 2001, 18, 157–164. [Google Scholar] [CrossRef]
  41. Lebiedzinska, A.; Dabrowaka, M.; Szefer, P.; Marszall, M.L. High performance liquid chromatography method for the determination of folic acid in fortified food products. Toxicol. Mech. Methods 2008, 18, 463–467. [Google Scholar] [CrossRef]
  42. Heperkan, D.; Dazkir, G.S.; Kansu, D.Z.; Guler, F.K. Influence of temperature on citrinin accumulation by Penicillium citrinum and Peniccillium verrucosum in black table olives. Toxin Rev. 2009, 28, 180–186. [Google Scholar] [CrossRef]
  43. Finglas, P.M.; Meer, K.; Molloy, A.; Verhoef, P.; Pietrzik, K.; Powers, H.J.; Straeten, D.; Jägerstad, M.; Varela-Moreiras, G.; Vliet, T.; et al. Research goals for folate and related B vitamin in Europe. Eur. J. Clin. Nutr. 2006, 60, 287–294. [Google Scholar] [CrossRef]
  44. Vuorela, H.; Hinkkanen, R.; Hiltunen, R. Rapid determination of tyramine in fish feed and slaughter offal by HPLC using coulometric detection. Z. Lebensm.-Unters. Forsch. 1989, 189, 434–437. [Google Scholar] [CrossRef]
  45. Turberg, M.F.; Macy, T.D.; Lewis, J.J.; Coleman, M.R. Determination of ractopamine hydrochloride in swine, cattle and turkey feeds by liquid chromatography with coulometric detection. J. AOAC Int. 1994, 77, 840–847. [Google Scholar] [CrossRef]
  46. Bernwieser, I.; Sontag, G.; Solar, S.; Quint, R.M.; Krajnik, P.; Getoff, N. Nachweis der bestrahlung von hühnerfleisch durch bestimmung von o- und m-tyrosin mit HPLC und elektroden array detektor. Ernaḧrung/Nutrition 1995, 19, 159–162. [Google Scholar]
  47. Krach, C.; Sontag, G.; Solar, S.; Getoff, N. HPLC with coulometric array detection. Determination of o- and m-tyrosine for identification of irradiated shrimps. Z. Lebensm. Unters. Forsch. A 1997, 204, 417–419. [Google Scholar] [CrossRef]
  48. Mattila, P.; Lehtonen, M.; Kumpulainen, J. Comparison of in-line connected photo-diode array and electrochemical detectors in high performance liquid chromatography analysis of coenzymes Q9 and Q10 in food materials. J. Agric. Food Chem. 2000, 48, 1229–1233. [Google Scholar] [CrossRef]
  49. Krach, C.; Sontag, G. Determination of heterocyclic aromatic amines in soup cubes by ion pair chromatography with coulometric array detection. Anal. Chim. Acta 2000, 417, 77–83. [Google Scholar] [CrossRef]
  50. Gerbl, U.; Cichna, M.; Zsivkovits, M.; Knasmüller, S.; Sontag, G. Determination of heterocyclic aromatic amines in beef extract, cooked meat and rat urine by liquid chromatography with coulometric electrode array detection. J. Chromatogr. B 2004, 802, 107–113. [Google Scholar] [CrossRef]
  51. Potesil, D.; Petrlova, J.; Adam, V.; Vacek, J.; Klejdus, B.; Zehnalek, J.; Trnkova, L.; Havel, L.; Kizek, R. Simultaneous femtomole determination of cysteine, reduced and oxidized glutathione, and phytochelatin in maize (Zea mays L.) kernels using high performance liquid chromatography with electrochemical detection. J. Chromatogr. A 2005, 1084, 134–144. [Google Scholar] [CrossRef]
  52. Bayram, B.; Rimbach, G.; Frank, J.; Esatbeyoglu, T. Rapid method for glutathione quantitation using high performance liquid chromatography with coulometric electrochemical detection. J. Agric. Food Chem. 2014, 62, 402–408. [Google Scholar] [CrossRef]
  53. Jurič, U.; Slemnik, M.; Škerget, M. The new rapid and accurate analytical HPLC-ECD method for the determination of rosmarinic acid in meat products. J. Food Sci. 2021, 86, 4491–4499. [Google Scholar] [CrossRef]
  54. Aroeira, C.N.; Feddern, V.; Gressler, V.; Molognoni, L.; Daguer, H.; Dalla Costa, O.A.; de Lima, G.J.M.M.; Contreras-Castillo, C.J. Determination of ractopamine residue in tissues and urine from pig fed meat and bone meal. Food Add. Cont. A 2019, 36, 424–433. [Google Scholar] [CrossRef]
  55. Iwasaki, M.; Tsugane, S. Dietary heterocyclic aromatic amine intake and cancer risk: Epidemiological evidence from Japanese studies. Genes Environ. 2021, 43, 33. [Google Scholar] [CrossRef]
  56. WHO. IARC Monographs Evaluate Consumption of Red Meat and Processed Meat; WHO Press: Geneva, Switzerland, 2015; pp. 107–384. [Google Scholar]
  57. Fialová, S.B.; Kello, M.; Coma, M.; Slobodníková, L.; Drobná, E.; Holková, I.; Garajová, M.; Mrva, M.; Zachar, V.; Lukáč, M. Derivatization of rosmarinic acid rnhances its in vitro antitumor, antimicrobial and antiprotozoal properties. Molecules 2019, 24, 1078. [Google Scholar] [CrossRef] [Green Version]
  58. Schindler, M.; Solar, S.; Sontag, G. Phenolic compounds in tomatoes. Natural variations and effect of gamma irradiation. Eur. Food Res. Technol. 2005, 221, 439–445. [Google Scholar] [CrossRef]
  59. Brown, M.J.; Ferruzzi, M.G.; Nguyen, M.L.; Cooper, D.A.; Eldridge, A.L.; Schwartz, S.J.; White, W.S. Carotenoid bioavailability is higher from salads ingested with full-fat than with fat-reduced salad dressings as measured with electrochemical detection. Am. J. Clin. Nutr. 2004, 80, 396–403. [Google Scholar] [CrossRef]
  60. Bernwieser, I.; Sontag, G. Determination of phenolic acids in vegetable oil using HPLC with multielectrode detection. Z. Lebensm.-Unters. Forsch. 1992, 195, 559–651. [Google Scholar] [CrossRef]
  61. Mccabe, D.R.; Acworth, I.N. Determination of synthetic antioxidants using gradient HPLC with electrochemical array detection. Am. Lab. 1998, 30, 18B–18D. [Google Scholar]
  62. Puspitasari-Nienaber, N.L.; Ferruzzi, M.G.; Schwartz, J.S. Simultaneous detection of tocopherols, carotenoids, and chlorophylls in vegetable oils by direct injection C30 RP-HPLC with coulometric array detection. J. Am. Oil Chem. Soc. 2002, 7, 633–640. [Google Scholar] [CrossRef]
  63. Bayram, B.; Esatbeyoglu, T.; Schulze, N.; Ozcelik, B.; Frank, J.; Rimbach, G. Comprehensive analysis of polyphenols in 55 extra virgine olive oils by HPLC-ECD and their correlation with antioxidant activities. Plant Foods Hum. Nutr. 2012, 67, 326–336. [Google Scholar] [CrossRef]
  64. da Silva Nogueira, F.; Araujo, F.M.; De Faria, L.V.; Lisboa, T.P.; Chevitarese Azevedo, G.; Machado Dornellas, R.; Costa Matos, M.A.; Camargo Matos, R. Simultaneous determination of strobilurin fungicides residues in bean samples by HPLC-UV-AD using boron-doped diamond electrode. Talanta 2020, 216, 120957. [Google Scholar] [CrossRef]
  65. Lebiedzinska, A.; Marszall, M.L.; Kuta, J.; Szefer, P. Reversed phase high performance liquid chromatography method with coulometric electrochemical and ultraviolet detection for quantification of vitamin B1 (thiamine), B6 (pyridoxamine, pyridoxal, pyridoxine) and vitamin B12 in animal and plant foods. J. Chromatogr. A 2007, 1173, 71–80. [Google Scholar] [CrossRef]
  66. Breithaupt, D.E. Determination of folic acid by ion-pair RP-HPLC in vitamin-fortified fruit juices after solid-phase extraction. Food Chem. 2001, 74, 521–525. [Google Scholar] [CrossRef]
  67. Gazdik, Z.; Zitka, O.; Petrlova, J.; Adam, V.; Zehnalek, J.; Horna, A.; Reznicek, V.; Beklova, M.; Kizek, R. Determination of vitamin c (ascorbic acid) using high performance liquid chromatography coupled with electrochemical detection. Sensors 2008, 8, 7097–7112. [Google Scholar] [CrossRef] [Green Version]
  68. Achilli, G.; Cellerino, G.P.; Gamache, P.H.; Melzid Èril, G.V. Identification and determination of phenolic constituents in natural beverages and plant extracts by means of a coulometric array system. J. Chromatogr. 1993, 632, 111–117. [Google Scholar] [CrossRef]
  69. Achilli, G.; Cellerino, G.P.; Melzid Èril, G.V.; Bird, S. Simultaneous determination of 27 phenols and herbicides in water by high performance liquid chromatography with multielectrode electrochemical detection. J. Chromatogr. A 1995, 697, 357–362. [Google Scholar] [CrossRef]
  70. Gamache, P.; Ryan, E.; Acworth, I.N. Analysis of phenolic flavonoid compounds in juice beverages using high performance liquid chromatography with coulometric array detection. J. Chromatogr. 1993, 635, 143–150. [Google Scholar] [CrossRef]
  71. Swoboda, F.; Solar, S.; Sontag, G.; Reznicek, G. A potential chemical marker for irradiated strawberries. Ernährung/Nutrition 2007, 31, 12–19. [Google Scholar]
  72. Careri, M.; Elviri, L.; Mangia, A.; Musci, M. Spectrophotometric and coulometric detection in high performance liquid chromatography of flavonoids and optimization of sample treatment for determination of quercetin in orange juice. J. Chromatogr. A 2000, 881, 449–460. [Google Scholar] [CrossRef]
  73. Sontag, G.; Bernwieser, I. HPLC coupled with a coulometric array detector. Determination of phloretin glucoside in juices for detection of adulteration. Dtsch. Lebensmitt. Rundsch. 1994, 90, 72–74. [Google Scholar]
  74. Parpinello, G.P.; Versari, A.; Galassi, S. Phloretin glycosides: Bioactive compounds in apple fruit, purées, and juices. J. Med. Food. 2000, 3, 149–151. [Google Scholar] [CrossRef]
  75. Galeano-Diaz, T.; Guiberteau-Cabanillas, A.; Mora-Diez, N.; Parilla-Vazquez, P.; Salinas-Lopez, F. Rapid sensitive determination of 4-nitrophenol, 3-methyl-4-nitrophenol, 4, 6-dinitro-o-cresol, parathion- methyl, fenitrothion, and parathion-ethyl by liquid chromatography with electrochemical detection. J. Agric. Food Chem. 2000, 48, 4508–4513. [Google Scholar] [CrossRef]
  76. Inoue, K.; Kato, K.; Yoshimura, Y.; Makino, T.; Nakazawa, H. Determination of bisphenol A in human serum by high performance liquid chromatography with multielectrode electrochemical detection. J. Chromatogr. B 2000, 749, 17–23. [Google Scholar] [CrossRef]
  77. Takeba, K.; Itoh, T.; Matsumoto, M.; Nakazawa, H. Determination of dephosphate bromofenofos in milk by liquid chromatography with electrochemical detection. J. AOAC Int. 1994, 77, 904–908. [Google Scholar] [CrossRef]
  78. Takeba, K.; Matsumoto, M.; Nakazawa, H. Determination of nitroxynil in cow milk by high performance liquid chromatography with dual electrode detection. J. Chromatogr. 1992, 596, 67–71. [Google Scholar] [CrossRef]
  79. Zhao, F.; Zhang, X.; Gan, Y. Determination of tetracyclines in ovine milk by high performance liquid chromatography with a coulometric array system. J. Chromatogr. A 2004, 1055, 109–114. [Google Scholar] [CrossRef]
  80. Wu, P.-S.; Yasuda, S.; Tachibana, H.; Yamada, K. Voltage dependency in coulometric analysis of tea polyphenols and isoflavones in foodstuffs. Food Sci. Technol. Res. 2003, 9, 180–184. [Google Scholar] [CrossRef]
  81. Novak, I.; Šeruga, M.; Komorsky-Lovrić, S. Characterisation of catechins in green and black teas using square-wave voltammetry and RP-HPLC-ECD. Food Chem. 2010, 122, 1283–1289. [Google Scholar] [CrossRef]
  82. Bernwieser, I.; Paẗzold, R.; Galensa, R.; Sontag, G. HPLC mit coulometrischer elektroden-array-detektion. Bestimmung von 1-O-trans-p-coumaroylglycerol in sorghumhirse, mais und bier. Z. Lebensm.-Unters. Forsch. 1994, 198, 40–43. [Google Scholar] [CrossRef]
  83. Rehova, L.; Skerikova, V.; Jandera, P. Optimisation of gradient HPLC analysis of phenolic compounds and flavonoids in beer using a CoulArray detector. J. Sep. Sci. 2004, 27, 1345–1359. [Google Scholar] [CrossRef]
  84. Larcher, R.; Nicolini, G.; Bertoldi, D.; Nardin, T. Determination of 4-ethylcatechol in wine by high performance liquid chromatography-coulometric array detection. Anal. Chim. Acta 2008, 609, 235–240. [Google Scholar] [CrossRef]
  85. Nurmi, T.; Heinonen, S.; Mazur, W.; Deyama, T.; Nishibe, S. Lignans in selected wines. Food Chem. 2003, 83, 303–309. [Google Scholar] [CrossRef]
  86. Friedrich, O.; Sontag, G. Dual electrochemical detector for HPLC. Determination of phenolic compounds in distilled alcoholic beverages. Fresenius’ Z. Anal. Chem. 1989, 334, 59–63. [Google Scholar] [CrossRef]
  87. Bocchi, C.; Careri, M.; Grappi, F.; Mangia, A.; Manini, P.; Mori, G. Comparative investigation of UV, electrochemical and particle beam mass spectrometric detection of high performance liquid chromato- graphic determination of benzoic and cinnamic acids and their corresponding phenolic acids. J. Chromatogr. A 1996, 753, 157–170. [Google Scholar] [CrossRef]
  88. Braunrath, R.; Podlipna, D.; Padlesak, S.; Cichna-Markl, M. Determination of bisphenol A in canned foods by immunity affinity chromatography, HPLC and fluorescence detection. J. Agric. Food Chem. 2005, 53, 8911–8917. [Google Scholar] [CrossRef]
  89. Raza, N.; Kim, K.-H. Quantification techniques for important environmental contaminants in milk and dairy products. TrAC 2018, 98, 79–94. [Google Scholar] [CrossRef]
  90. Arribas, A.S.; Martínez-Fernández, M.; Chicharro, M. The role of electroanalytical techniques in analysis of polyphenols in wine. TrAC 2012, 34, 78–96. [Google Scholar] [CrossRef]
  91. Vasilescu, A.; Fanjul-Bolado, P.; Titoiu, A.-M.; Porumb, R.; Epure, P. Progress in electrochemical (bio)sensors for monitoring wine production. Chemosensors 2019, 7, 66. [Google Scholar] [CrossRef] [Green Version]
  92. Hosnedlova, B.; Sochor, J.; Baron, M.; Bjørklund, G.; Kizek, R. Application of nanotechnology based-biosensors in analysis of wine compounds and control of wine quality and safety: A critical review. Crit. Rev. Food Sci. 2020, 60, 3271–3289. [Google Scholar] [CrossRef]
  93. Gerstenmeyer, E. Analyse von Lignanen in rohen und zubereiteten Lebensmitteln. Doctoral Thesis, University of Vienna, Vienna, Austria, 2009. [Google Scholar]
  94. Fuchs, S.; Grünauer, E.; Reich, G.; Sontag, G. Analysis of phenolic acids from honeys by accelerated solvent extraction and HPLC with coulometric dual electrode detection. Ernaḧrung/Nutrition 2012, 36, 299–307. [Google Scholar]
  95. Jörg, E.; Sontag, G. Determination of phenolic acids in honey by HPLC using coulometric dual electrode detection. Dtsch Lebensmitt. Rundsch. 1992, 88, 179–183. [Google Scholar]
  96. Jörg, E.; Sontag, G. Multichannel coulometric detection coupled with liquid chromatography for determination of phenolic esters in honey. J. Chromatogr. 1993, 635, 137–142. [Google Scholar] [CrossRef]
  97. Rancan, M.; Rossi, S.; Sabatini, A.G. Determination of thiamethoxam residues in honeybees by high performance liquid chromatography with an electrochemical detector and post-column photochemical reactor. J. Chromatogr. A 2006, 1123, 60–65. [Google Scholar] [CrossRef]
  98. Cantalapiedra, A.; Gismera, J.; Sevilla, T.; Procopio, J.R. Sensitive and selective determination of phenolic compounds from aromatic plants using an electrochemical detection coupled with HPLC method. Phytochem Anal. 2014, 25, 247–254. [Google Scholar] [CrossRef]
  99. Rauf, A.; Imran, M.; Suleria, H.A.R.; Ahmad, B.; Petersf, D.G.; Mubarak, M.S. A comprehensive review of the health perspectives of resveratrol. Food Funct. 2017, 8, 4284–4305. [Google Scholar] [CrossRef]
  100. Xu, M.; Lian, Z.; Chen, X.; Yao, X.; Lu, C.; Niu, X.; Xu, M.; Zhu, Q. Effects of resveratrol on lipid and protein co-oxidation in fish oil-enriched whey protein isolate emulsions. Food Chem. 2021, 365, 130525. [Google Scholar] [CrossRef]
  101. Němcová, L.; Zima, J.; Barek, J.; Janovska, D. Determination of resveratrol in grains, hulls and leaves of common and tartary buckwheat by HPLC with electrochemical detection at carbon paste electrode. Food Chem. 2011, 126, 374–378. [Google Scholar] [CrossRef]
  102. Birtić, S.; Dussort, P.; François-Xavier, P.; Bily, A.C.; Roller, M. Carnosic acid. Phytochem. 2015, 115, 9–19. [Google Scholar] [CrossRef] [Green Version]
  103. Tang, P.H. Determination of coenzyme Q10 in over-the-counter dietary supplements by high performance liquid chromatography with coulometric detection. J. AOAC Int. 2006, 89, 35–39. [Google Scholar] [CrossRef] [Green Version]
  104. Tang, P.H.; Miles, M.V.; Steele, P.; Davidson, B.S.; Geraghty, S.R.; Morrow, A.I. Determination of coenzyme Q10 in human breast milk by high performance liquid chromatography. Biomed. Chromatogr. 2006, 20, 1336–1343. [Google Scholar] [CrossRef]
  105. Kubo, H.; Fujii, K.; Kawabe, T.; Matsumoto, S.; Kishida, H.; Hosoe, K. Food content of ubiquinol-10 and ubiquinone-10 in the Japanese diet. J. Food Compost. Anal. 2008, 21, 199–210. [Google Scholar] [CrossRef]
  106. Kac, J.; Vovk, T. Sensitive electrochemical detection of α-acids, β-acids and xanthohumol in hops (Humulus lupulus L.). J. Chromatogr. B 2007, 850, 531–537. [Google Scholar] [CrossRef]
  107. Benová, B.; Adam, M.; Onderková, K.; Královský, J.; Krajícek, M. Analysis of selected stilbenes in Polygonum cuspidatum by HPLC coupled with CoulArray detection. J. Sep. Sci. 2008, 31, 2404–2409. [Google Scholar] [CrossRef]
  108. Chailapakul, O.; Wonsawat, W.; Siangproh, W.; Grudpan, K.; Zhao, Y.; Zhu, Z. Analysis of sudan I, sudan II, sudan III, and sudan IV in food by HPLC with electrochemical detection: Comparison of glassy carbon electrode with carbon nanotube-ionic liquid gel modified electrode. Food Chem. 2008, 109, 876–882. [Google Scholar] [CrossRef]
  109. Theisen, S.; Hänsch, R.; Kothe, L.; Leist, U.; Galensa, R. A fast and sensitive HPLC method for sulfite analysis in food based on a plant sulfite oxidase biosensor. Biosens. Bioelectron. 2010, 26, 175–181. [Google Scholar] [CrossRef]
  110. IFU. Method 7a. Sulphur Dioxide; International Fruit and Vegetable Juice Association: Paris, France, 2005. [Google Scholar]
  111. Avino, P.; Notardonato, I.; Russo, M.V. A review of the analytical methods based on chromatography for analyzing glyphosate. In Foods, Pests, Weeds and Diseases in Agricultural Crop and Animal Husbandry Production; Kontogiannatos, D., Kourti, A., Mendes, K.F., Eds.; IntechOpen: London, UK, 2020; 24p. [Google Scholar]
  112. de Castilhos Ghisi, N.; Zuanazzi, N.R.; Fabrin, T.M.C.; Celton Oliveira, E. Glyphosate and its toxicology: A scientometric review. Sci. Total Environ. 2020, 733, 139359. [Google Scholar] [CrossRef]
  113. Bianco, P.M.; Tamburro, R.; Aspriello, S.D. Effetti del glifosato sui mammiferi e gli esseri umani. Il Cesalpino 2019, 47, 30–32. [Google Scholar]
  114. Coutinho, C.F.B.; Coutinho, L.F.M.; Mazo, L.H.; Lancas, F.M. Copper microelectrode as liquid chromatography detector for herbicide glyphosate. Electroanalysis 2007, 19, 1223–1226. [Google Scholar] [CrossRef]
  115. Coutinho, C.F.B.; Coutinho, L.F.M.; Mazo, L.H.; Nixdorf, S.L.; Camarab, C.A.P.; Lancas, F.M. Direct determination of glyphosate using hydrophilic interaction chromatography with coulometric detection at copper microelectrode. Anal. Chim. Acta 2007, 592, 30–35. [Google Scholar] [CrossRef] [PubMed]
  116. Coutinho, C.F.B.; Coutinho, L.F.M.; Mazo, L.H.; Nixdorf, S.L.; Camara, C.A.P. Rapid and direct determination of glyphosate and aminomethylphosphonic acid in water using anion-exchange chromatography with coulometric detection. J. Chromatogr. A 2008, 1208, 246–249. [Google Scholar] [CrossRef] [PubMed]
  117. Wang, C.; Xu, J.; Zhou, G.; Qu, Q.; Yang, G.; Hu, X. Electrochemical detection coupled with High-Performance Liquid Chromatography in pharmaceutical and biomedical analysis: A mini review. Comb. Chem. High Throughput Screen. 2007, 10, 547–554. [Google Scholar] [CrossRef] [PubMed]
Figure 1. Classification of some electrochemical measurements (from ref. [10]).
Analytica 03 00005 g001
Figure 2. Schematic of a single potentiometric chloride sensor composed of a number of screen-printed layers (from ref. [15]).
Analytica 03 00005 g002
Figure 3. Scheme of electrochemical cell. (from ref. [20]).
Analytica 03 00005 g003
Figure 4. Cross section through a dual coulometric electrode showing the placement of working, counter and palladium-hydrogen reference electrodes (from ref. [24]).
Analytica 03 00005 g004
Figure 5. Various receptors for electrochemical biosensors using the Molecularly Imprinted Polymers (MIPs) concept (from ref. [31]).
Analytica 03 00005 g005
Figure 6. Schematic diagram of the HPLC-ECD system (Reprinted with permission from Ref. [33]. Copyright 2019 Journal of Visualized Experiments).
Analytica 03 00005 g006
Figure 7. Linear voltammograms at copper microelectrode in phosphate buffer in the absence (a) and in the presence (b) of glyphosate (Gly) 1.45 mol L−1 (Reprinted with permission from Ref. [114]. Copyright 2007 WILEY-V C H VERLAG GMBH).
Analytica 03 00005 g007
Table 1. HPLC-ED analysis performance in the analysis of different compounds in cereal, rice and wheat matrices. The term “N/A” means the information is absent in the paper.
MatrixAnalyteColumnPotential 1Linearity RangeLOD 2Recovery 3RSD 4Ref.
maize, rice, tomatoesaltertoxinsC18+1.0/−0.1 V0.24–500 ng30 pgN/A3.3–5.5[38]
cereal, rice, wheatcitrinACE 3 C18+0.8 V0.1–25 µg L−11–28.5 µg kg−144–658–20[39]
cooked rice4-nonylphenolCapcell C18+0.67 V10–1000 ng g−11.0 ng g−183.72.5[40]
cereal products, fruit juicesfolic acid, 5-HCO-H4C180.85 V50–5000 µg L−11.3 ng mL−198.0–103.6N/A[41]
1 Potential of working electrode; 2 LOD: limit of detection; 3 recovery expressed as %; 4 RSD: relative standard deviation, expressed as %.
Table 2. HPLC-ED analysis performance in the analysis of different compounds in meat and fish matrices. The term “N/A” means the information is absent in the paper.
MatrixAnalyteColumnPotential 1Linearity RangeLOD 2Recovery 3RSD 4Ref.
fish, slaughter offaltyramineNovapak RP-18+0.4, +0.7 V4.5–452 ng mL−10.5 pg µL−197.6–102.41.6[44]
swine, cattle, and turkey feedsractopamine hydrochlorideIBM C18+0.6 VN/AN/A85–1001.6[45]
chicken meato- and m-tyrosineRP C18+0.9 VN/AN/AN/AN/A[46]
irradiated shrimpso- and m-tyrosineInertsil ODS-2+0.54, +0.62 VN/AN/AN/AN/A[47]
beef steak, beef heart, herring filletcoenzyme Q9 and Q10Vydac 201TP54 RP+0.5 V10–200 ng4–6 ng75–1030.8–5.0[48]
commercial soup cubesheterocyclic aromatic aminesLiChroCart Superspher 60 RP B0.47, 0.54 VN/A0.1–1.1 ng54.8–100.93.2–9.5[49]
beef extract, grilled meat, rat urineheterocyclic aromatic aminesLuna phenyl–hexyl column+0.10, +0.16, +0.35, +0.69 VN/A0.8–2.5 ng g−138.5–78.5N/A[50]
fish tissues 5cysteine, glutathione, phytochelatinsZorbax XDB RP+0.68, +0.78 V0.01–65 µg mL−14.5–238.5 fmol96–1033.2–6.5[51]
HepG2 cellsglutathioneKinetex C18+0.8 V0.01–80 µmol L−115 fmol100.7–104.60.71–9.86[52]
meat productsrosmarinic acidKromasil 100 C18+0.5 V0.06–3 mg kg−10.33 ppb90–1101.10–3.69[53]
1 Potential of working electrode; 2 LOD: Limit of Detection; 3 Recovery expressed as %; 4 RSD: relative standard deviation, expressed as %; 5 method developed for maize kernels and after applied to fish tissues.
Table 3. HPLC-ED analysis performance in the analysis of different compounds in oils, seeds and vegetables matrices. The term “N/A” means the information is absent in the paper.
MatrixAnalyteColumnPotential 1Linearity RangeLOD 2Recovery 3RSD 4Ref.
tomatoesphenolic acidsLiChrospher 60 RP+0.90, 0.325, 0.37, +0.425, +0.45, +0.53 V0.007–12.3 mg L−13–13 µg L−181.7–89.91.6–5.2[58]
saladscarotenoidsC30 Carotenoid+0.38, +0.50 VN/A0.25 pg µL−1N/AN/A[59]
palm oilsphenolic acidsRoSiL C18+0.12 < V < +0.853–20 mg L−115–79 µg L−131.0–123.04.1–53.4[60]
butter, margarinephenolic antioxidantsZorbax SB-C18+0.8 VN/A10–200 pgN/AN/A[61]
vegetable oilstocopherols, carotenoids, chlorophyllsYMCTM C30+0.26, +0.32, +0.38, +0.44, +0.50 V0.01–2.00 µg mL−10.04–20 fmolN/A2.0–7.4[62]
extra virgin olive oilspolyphenolsKinetex C18+0.25, +0.40, +0.50, +0.75 VN/A0.03–1.7 ng mL−1N/AN/A[63]
beansstrobilurin fungicidesC18 RP Zorbax ODS+1.1, +1.9 V5.0–15.0 mg L−11.37–1.57 µg kg−162.3–95.22.3–8.9[64]
1 Potential of working electrode; 2 LOD: limit of detection; 3 recovery expressed as %; 4 RSD: relative standard deviation, expressed as %.
Table 5. HPLC-ED analysis performance in the analysis of different compounds in beverage matrix. The term “N/A” means the information is absent in the paper.
MatrixAnalyteColumnPotential 1Linearity RangeLOD 2Recovery 3RSD 4Ref.
waternitropesticidesNova-Pak C18+0.70 V0.5–20 µg L−10.05–0.20 ppb96–1121–15[75]
waterbisphenol-ACapcell C18+0.43 V0.1–100 ng mL−10.01 ng mL−183.8–98.23.4–6.1[76]
milkdephosphate bromofenofosKaseisorb LC ODS-300–5+0.30, +0.45 V1.0–10.0 ng0.2 ng mL−173.1–82.72.8–8.4[77]
cow milknitroxynilLiChrospher RP18−0.70, +0.20 V1.0–10.0 ng0.7 ng mL−192.0–97.02.2–6.2[78]
ovine milktetracyclinesODS Hypersil+0.66, 0.68, 0.70 V0.05–1 µg mL−112.5–25 ng mL−188.4–95.60.2–4.3[79]
tea, foodstuffstea polyphenols, isoflavonesMightysil RP-18+0.35, +0.40, +0.50, +0.70 V10–1000 ng mL−1N/AN/AN/A[80]
green and black teacatechinsOmniSpher C18+0.372, +0.491 V0.05–7.0 µM23.23–100.7 nM83.7–105.2N/A[81]
beer, maize, sorghum1-O-trans-p-coumaroylglycerolRoSiL C18+0.42 < V < +0.72N/AN/AN/AN/A[82]
beerphenolic compoundsPhenomenex C180.3, 0.6, 0.8, 0.9 V0.005–1 mg L−11–50 µg L−1N/A1.23–1.81[83]
winevolatile phenolsLiChroCART RP18+0.10 < V < +0.700–1520 µg L−11.34 µg L−195–1041.8–4.4[84]
winelignansInertsil ODS-3+0.42 V0–1200 ng mL−10.24–1.2 ng mL−1N/A<5[85]
alcoholic distil.phenolic ligninNova-Pak C18+0.65 VN/A0.3–0.9 ngN/A1.5–9.7[86]
brandybenzoic acids, cinnamic acidsSpherisorb 5-ODS−0.15 < V < +0.500.005–100 ng1–5 pgN/A0.6–3.0[87]
1 Potential of working electrode; 2 LOD: limit of detection; 3 recovery expressed as %; 4 RSD: relative standard deviation, expressed as %.
Table 6. HPLC-ED analysis performance in the analysis of different compounds in honey matrix. The term “N/A” means the information is absent in the paper.
MatrixAnalyteColumnPotential 1Linearity RangeLOD 2Recovery 3RSD 4Ref.
honeyaromatic, arylaliphatic carboxylic acidsRP C18+0.10, +0.75 V0.05–2.4 mg mL−10.3–9.2 ppm87.0–105.11.3–12.2[94]
honeyphenolic compoundsRP C18+0.20 < V < +0.90N/A5–80 µg L−1N/AN/A[95]
honeyphenolic estersRoSiL C18 HL+0.42, +0.58, +0.82 V1–10 µg L−10.1–1.1 µg kg−165.2–79.41.5–6.7[96]
honeybeethiamethoxanRP Luna C18+0.88 V0.01358–1.358 mg L−12.1 ng g−159.9–71.62.68–8.55[97]
1 Potential of working electrode; 2 LOD: limit of detection; 3 recovery expressed as %; 4 RSD: relative standard deviation, expressed as %.
Table 7. LODs and LOQs (µg L−1) of UV, amperometric and coulometric detectors.
AnalyteDetectorLOD 1LOQ 2
vanillinUV1550
amperometric1239
coulometric0.812.7
eugenolUV62207
amperometric9.732
coulometric310
carvacrolUV55183
amperometric1550
coulometric3.110
thymolUV41136
amperometric1757
coulometric1.44.7
1 LOD: limit of detection; 2 LOQ: limit of quantification.
Table 8. LODs (mol L−1) of UV-Vis detector (λ at 306 nm for trans-resveratrol and 286 nm for cis-resveratrol) and amperometric detector.
Detectortrans-Resveratrolcis-Resveratrol
UV-Vis3.2 × 10−86.5 × 10⁻⁸
amperometric3.5 × 10−81.8 × 10⁻⁸
Table 9. HPLC-ED analysis performance in the analysis of different compounds in aromatic plants and other food matrices. The term “N/A” means the information is absent in the paper.
MatrixAnalyteColumnPotential 1Linearity RangeLOD 2Recovery 3RSD 4Ref.
aromatic plantphenolic compoundsLuna C18+0.50 V0.01–10.0 mg L−10.81–17 µg L−198–1050.2–7[98]
grains, hulls, buckwheatresveratrolKromasil C18+1.20 V4 × 10−8–10−4 mol L−13.5 × 10⁻⁸ mol L−1N/AN/A[102]
dietary supplementscoenzymes Q9 and Q10Microsorb-MV C18+0.50 V0.05–8 µg mL−15 ng mL−198.3–100.51.8–4.0[103]
human breast milkcoenzyme Q10Microsorb-MV C18+0.60 V0.06–2.5 µmol L−160 nmol L−199.1–1010.6–4.3[104]
Japanese food dietcoenzyme Q10, oxided form of coenzyme Q10ODS-A303+0.60 V0.08–200 µg g−10.07–0.15 µg g−187.8–1050.6–15.4[105]
hopsα-acids, β-acids, xanthohumolRP C18+0.70 V0.7–4173 µg L−10.1–25 µg L−1N/A9–16.7[106]
Polygonum cuspidatumstilbenesLiChrospher C18+0.50, +0.60, +0.70 V0.029–60 mg L−18–25 µg L−190.2–95.31.3–2.6[107]
soft drinkssudan I, sudan II, sudan III, and sudan IVInertsil ODS-3+0.74 V0.005–25 ppm0.001–0.005 ppm95.7–104.10.71–4.18[108]
fruit juices, winessulfitesCarboPac PA-100+0.20 V0.04–2 mg L−1 SO20.01 mg L−1 SO2N/AN/A[109]
1 Potential of working electrode; 2 LOD: Limit of Detection; 3 Recovery expressed as %; 4 RSD: relative standard deviation, expressed as %.
Table 10. HPLC-ED analysis performance in the analysis of glyphosate (Gly) and aminomethylphosphonic acid (AMPA). The term “N/A” means the information is absent in the paper.
MatrixAnalyteColumnPotential 1Linearity RangeLOD 2Recovery 3RSD 4Ref.
tomato juiceGlyKromasil NH2+0.05 V0.1–34 mg L−10.1 mg L−188N/A[114]
fruit juicesGlyKromasil NH2+0.05 V0.1–34 mg L−10.1 mg L−190–92N/A[115]
waterGly, AMPAZorbax SAX+0.30 V0.1–111 µg L−10.038–0.24 µg L−11001.7–4.6[116]
1 Potential of working electrode; 2 LOD: limit of detection; 3 recovery expressed as %; 4 RSD: relative standard deviation, expressed as %.
Publisher’s Note: MDPI stays neutral with regard to jurisdictional claims in published maps and institutional affiliations.

