
Ion-Channel Antiepileptic Drugs: An Analytical Perspective on the Therapeutic Drug Monitoring (TDM) of Ezogabine, Lacosamide, and Zonisamide


Abstract
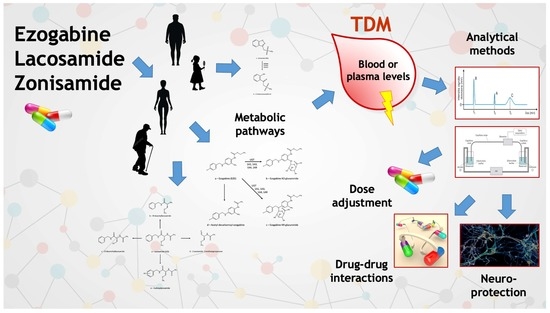
1. Introduction
2. Methods
3. Ion Channel Agents
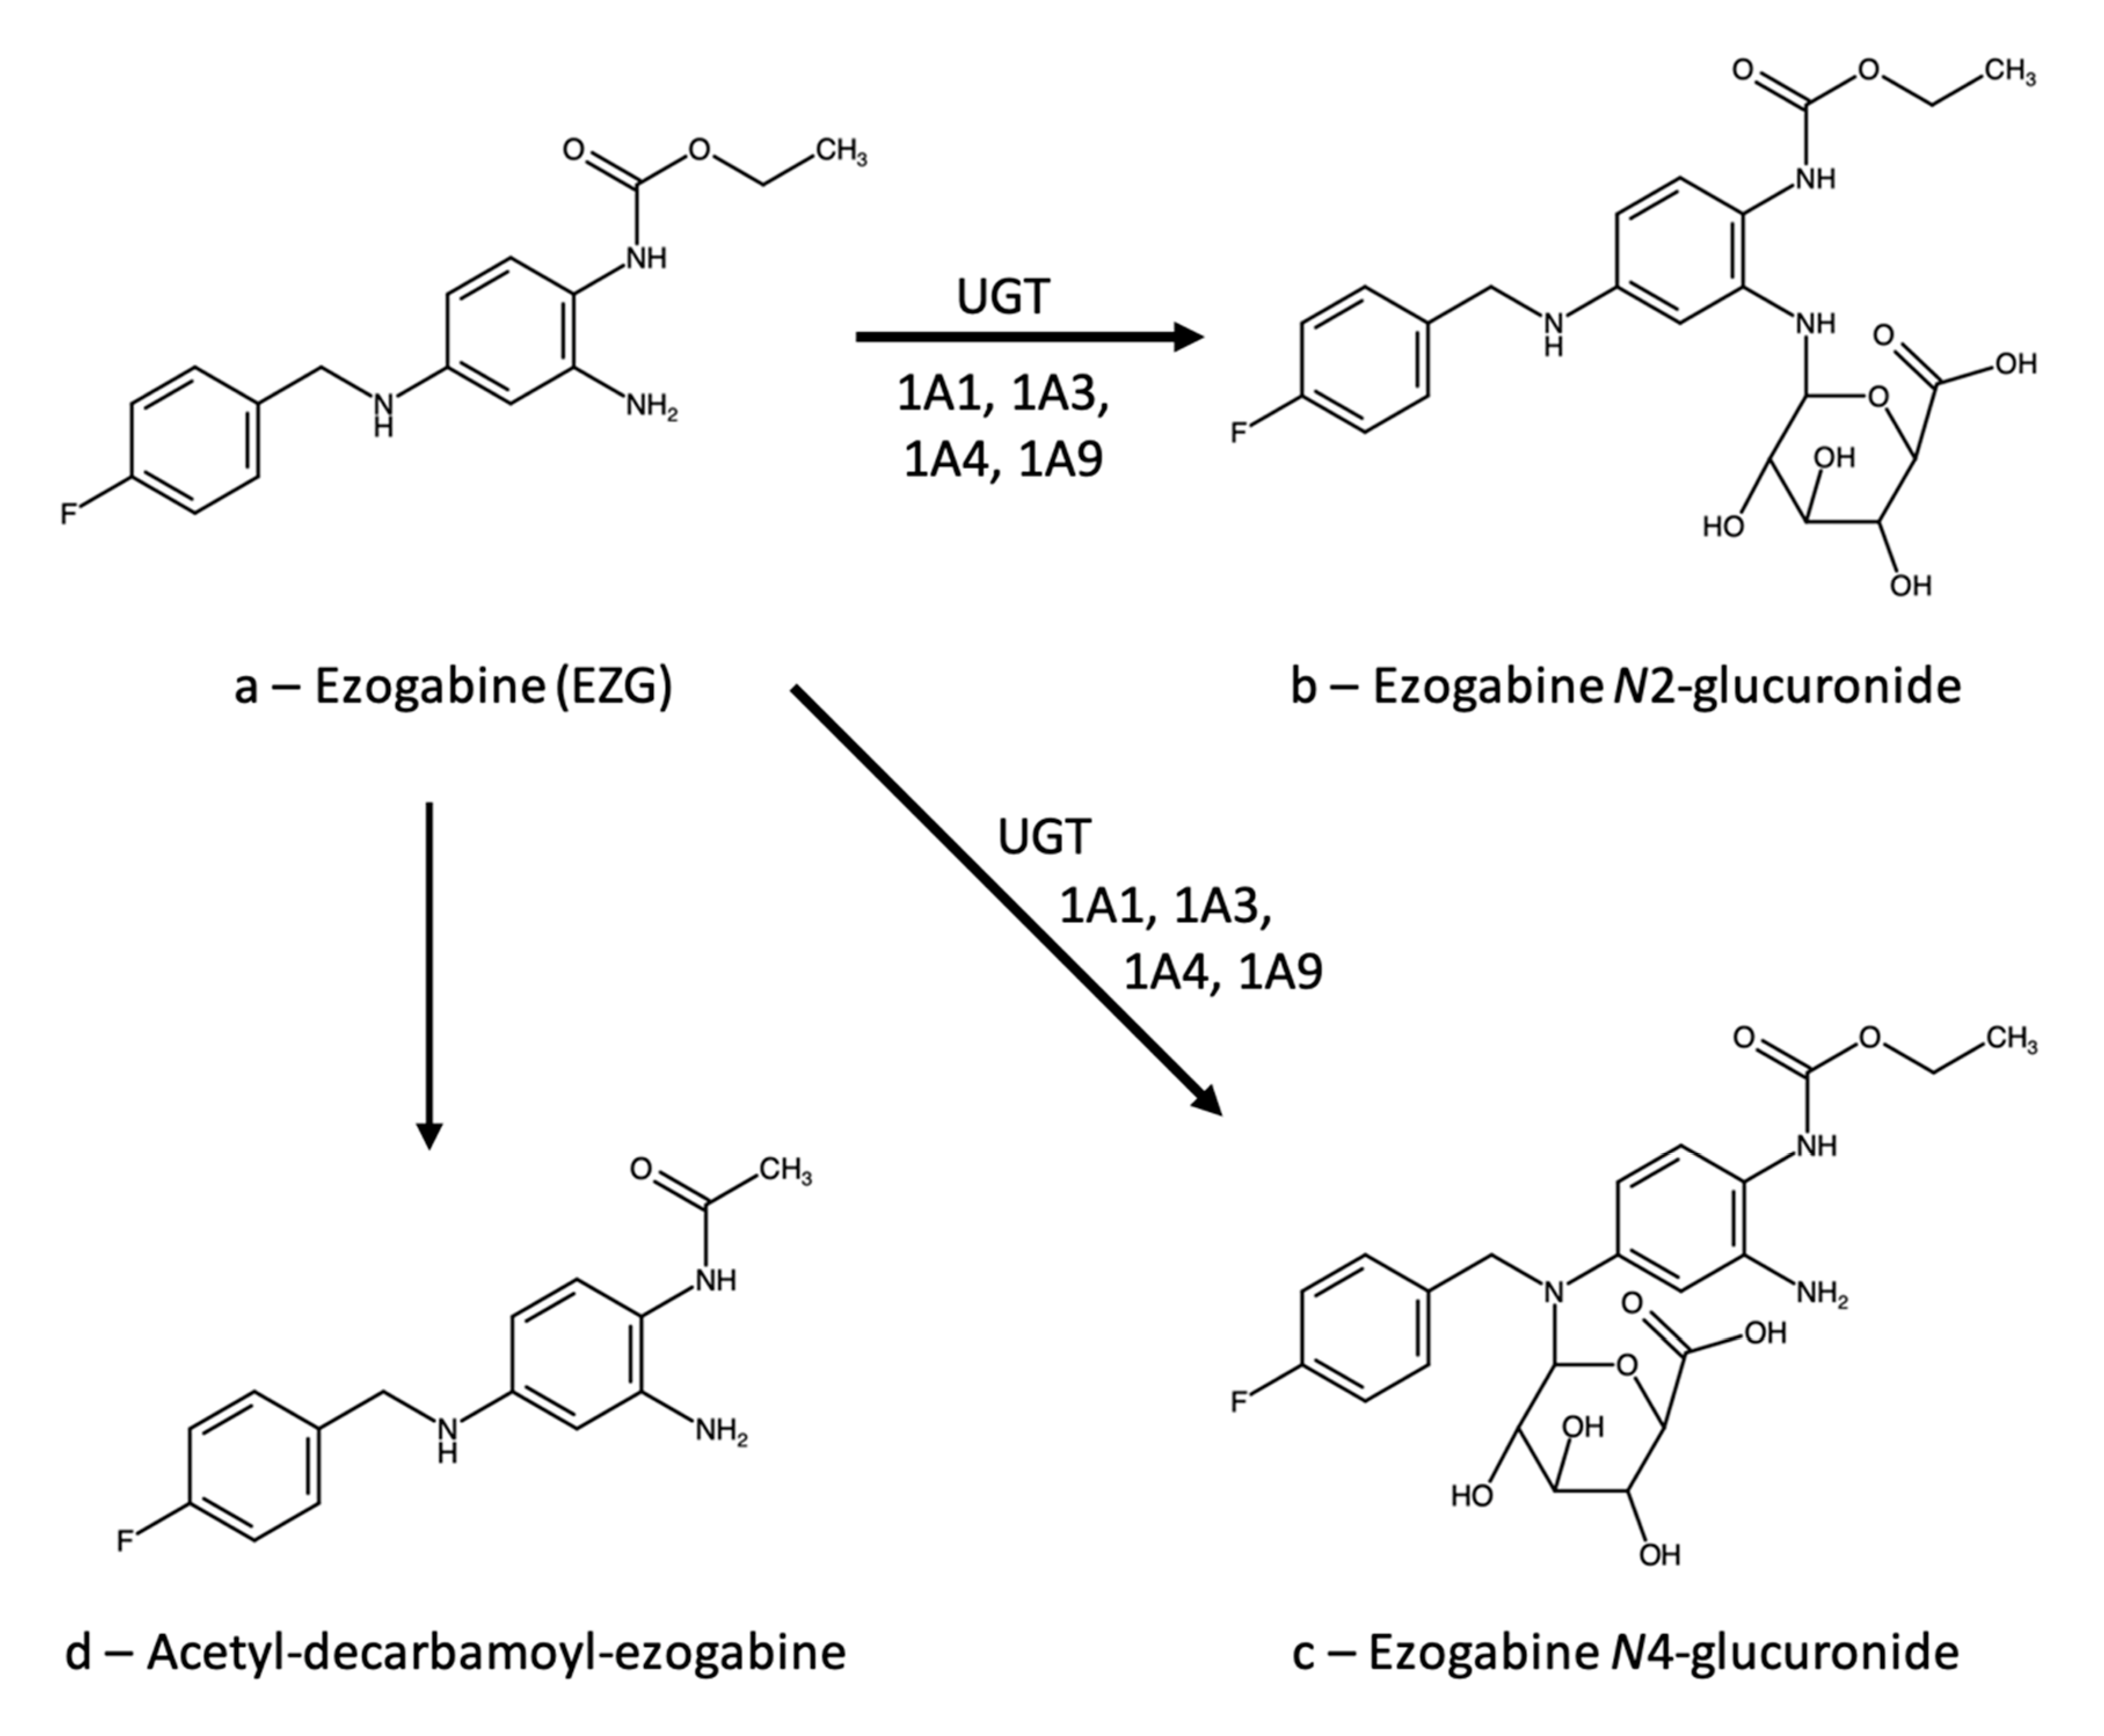
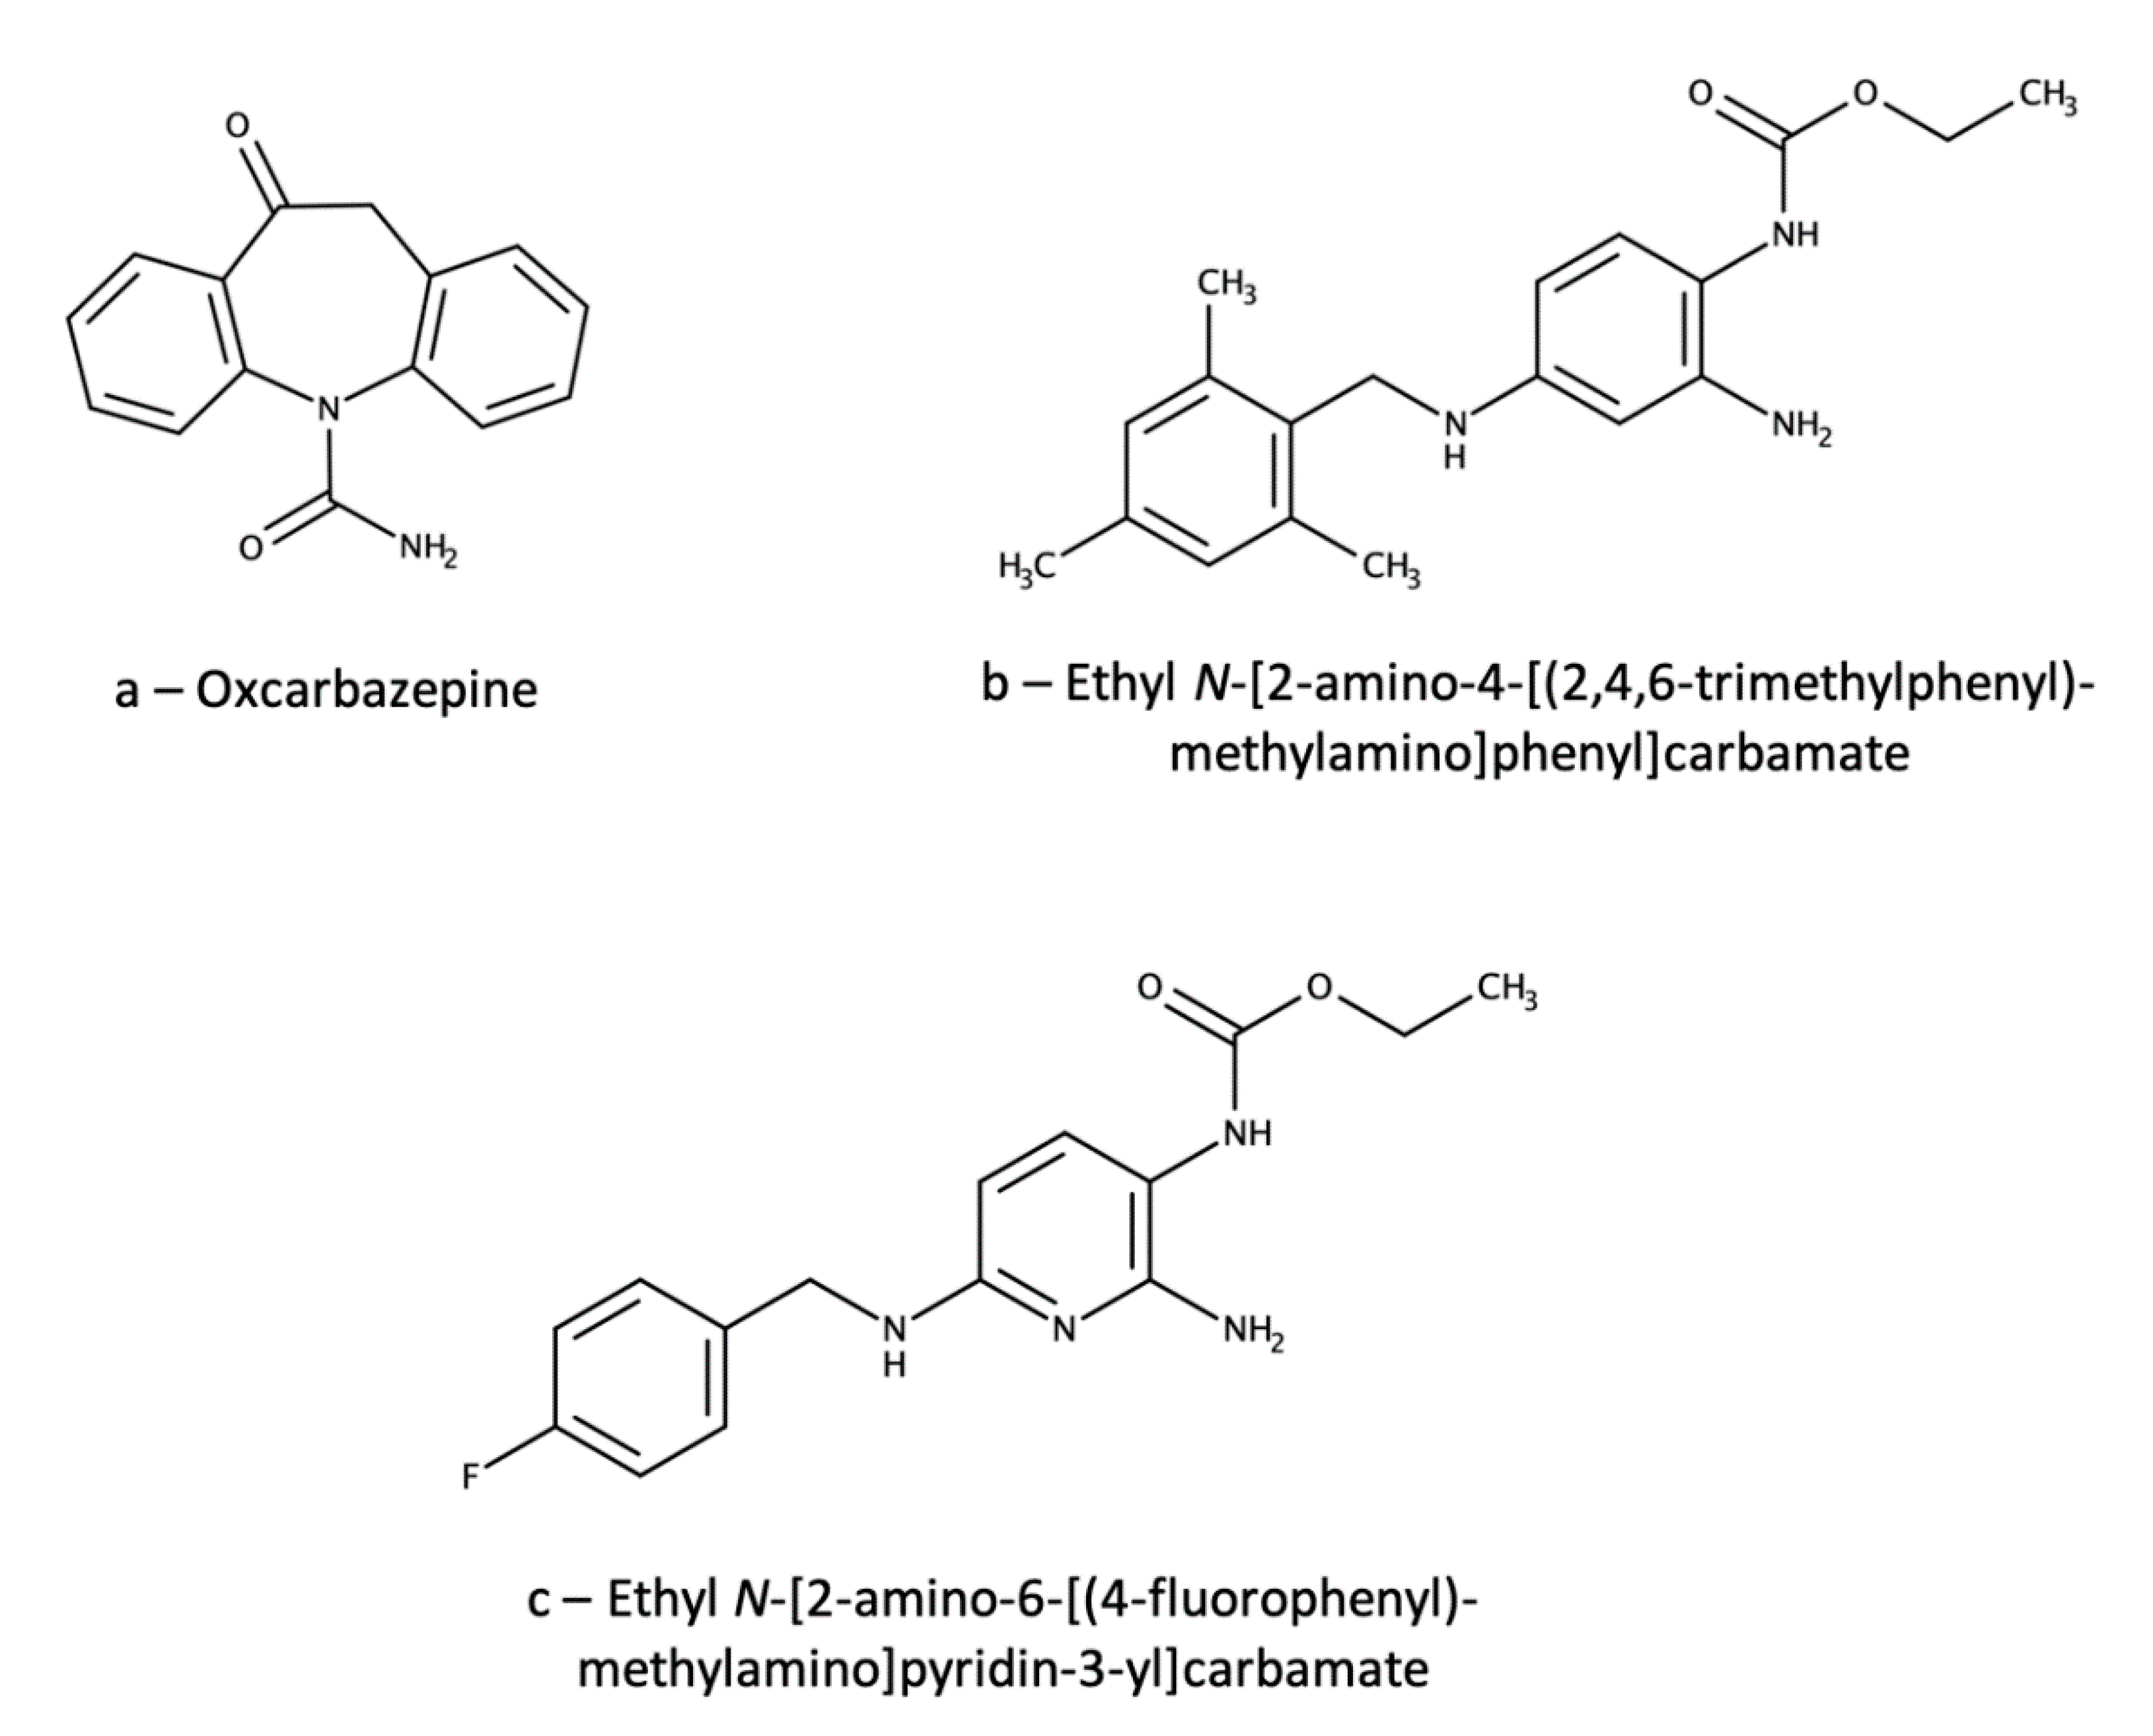
3.1. Ezogabine (Retigabine)
3.1.1. Therapeutic Drug Monitoring
3.1.2. Ezogabine Interactions
Clinically Relevant Data
Data with Low or Uncertain Clinical Relevance, Case Reports
3.1.3. Neuroprotection
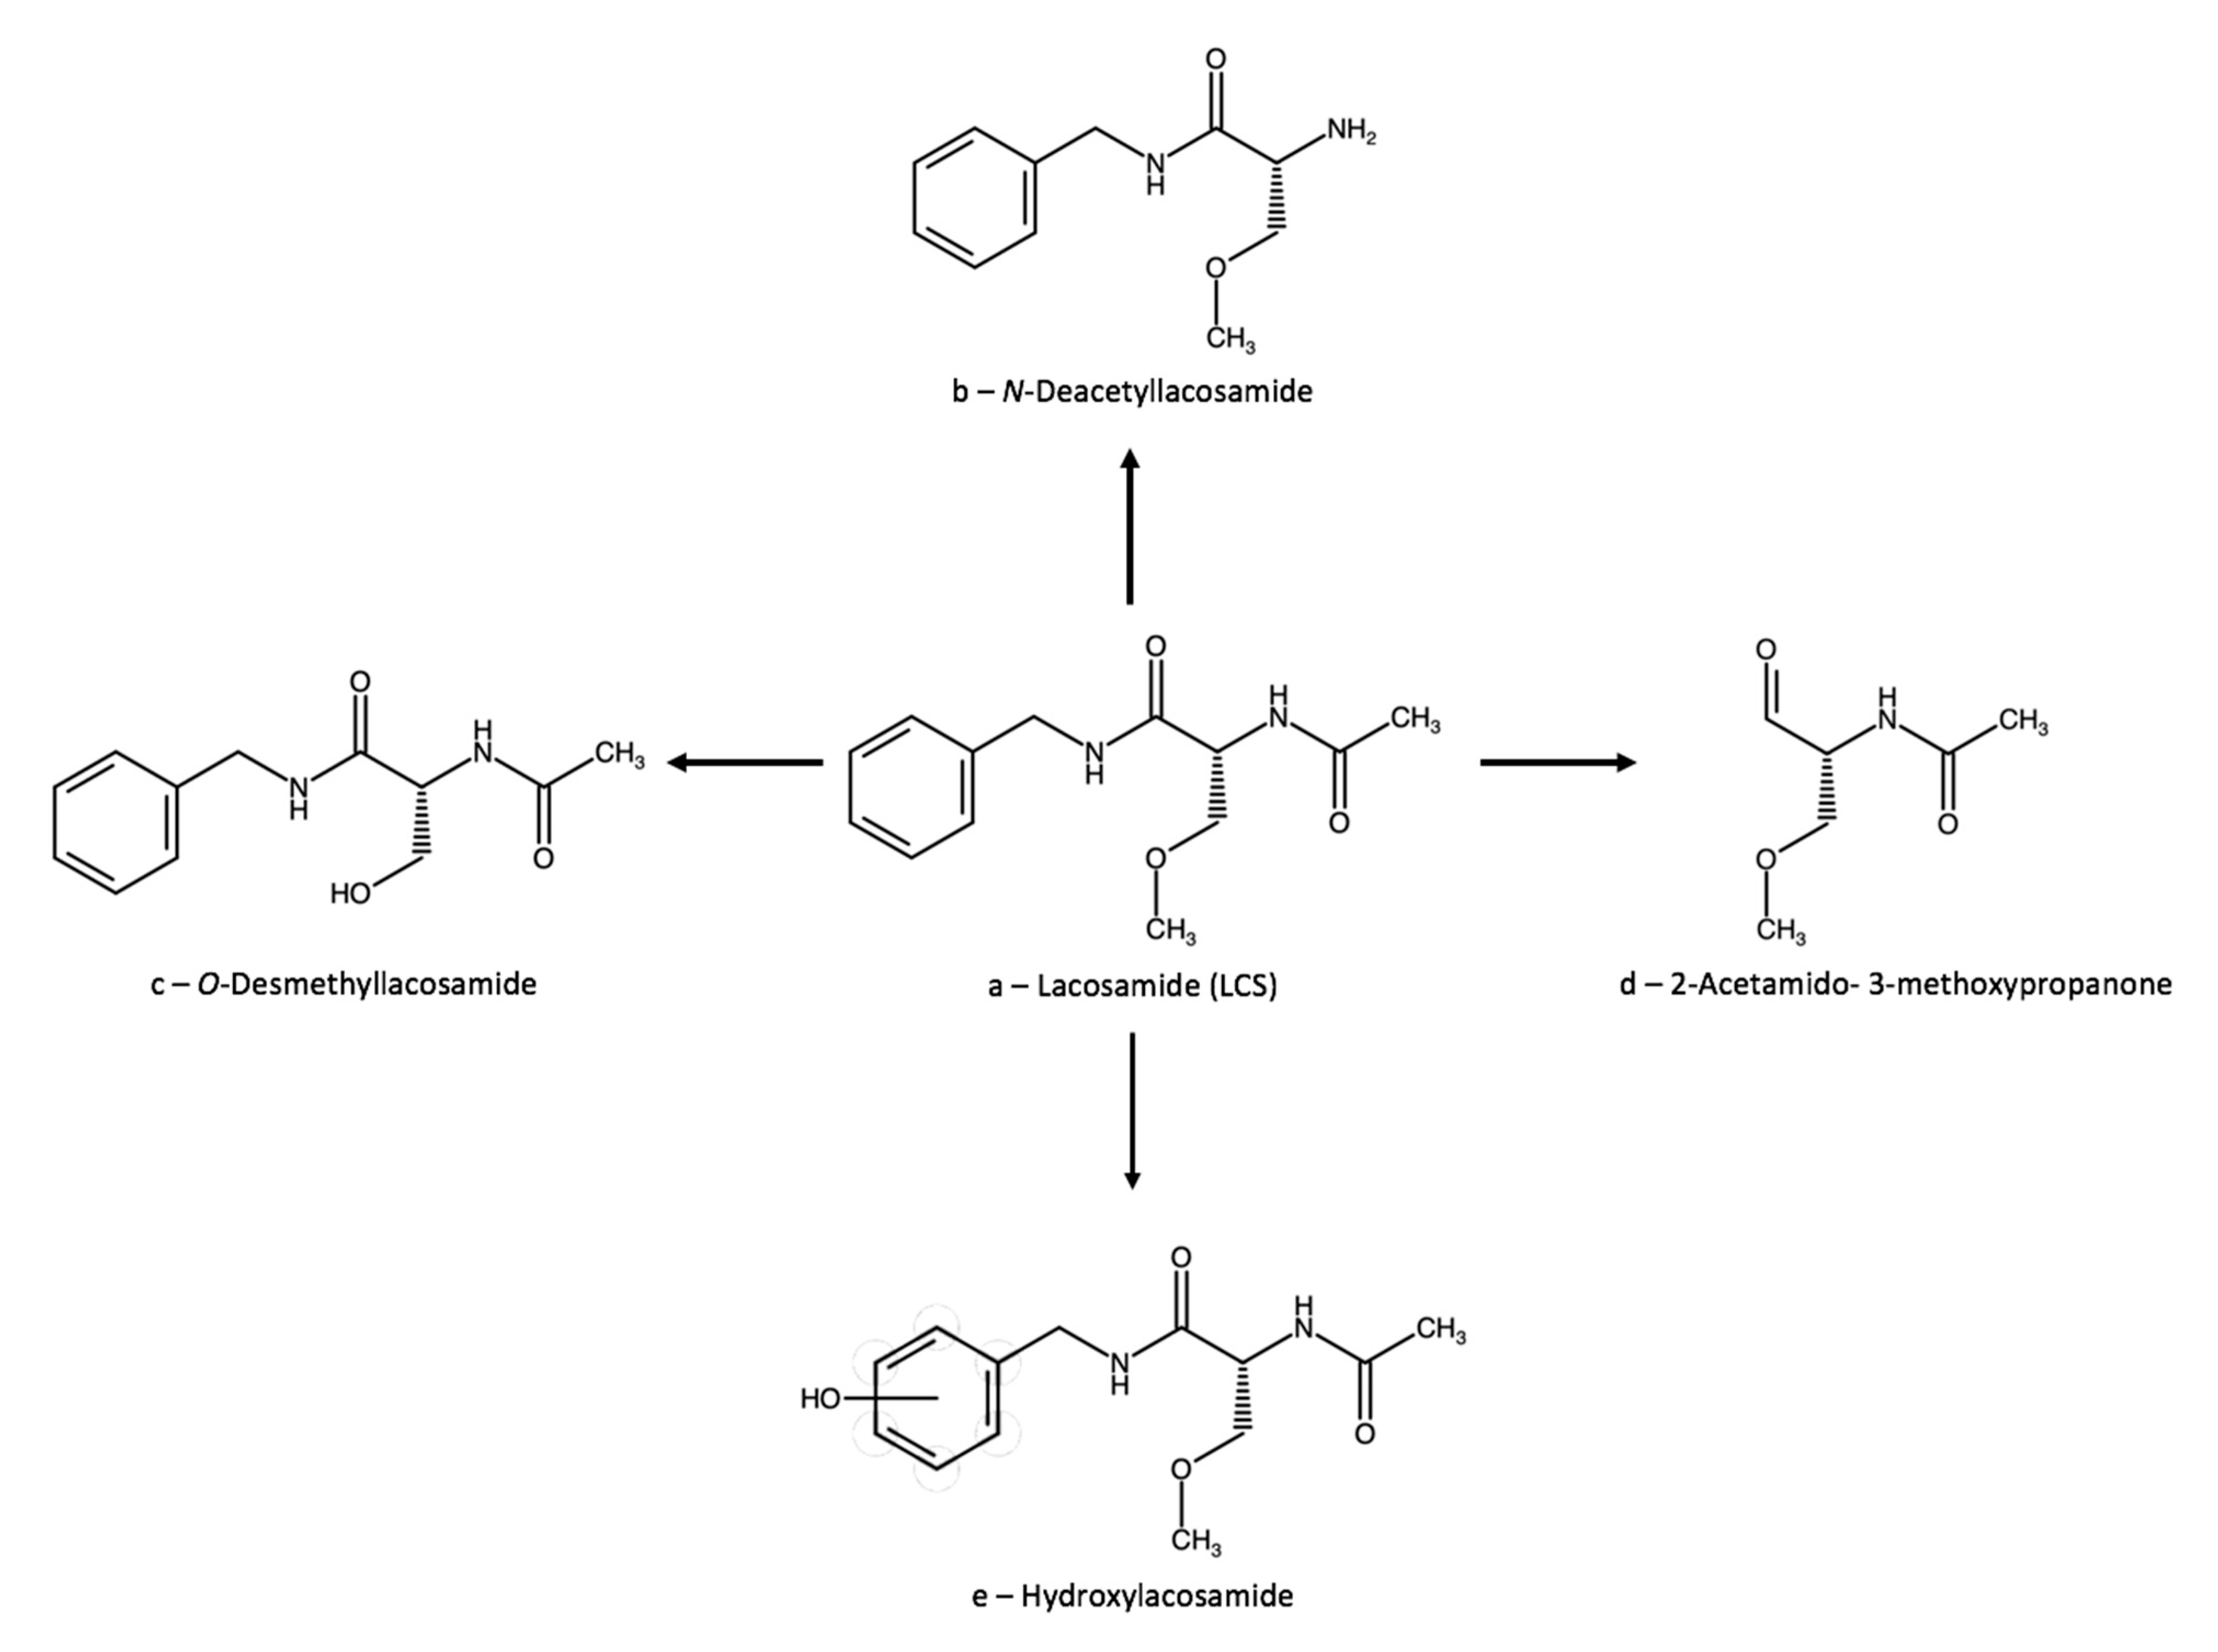
3.2. Lacosamide
3.2.1. Therapeutic Drug Monitoring
Single-Drug Methods
Multi-Drug Methods
3.2.2. Lacosamide Interactions
Clinically Relevant Data
Data with Low or Uncertain Clinical Relevance, Case Reports
3.2.3. Neuroprotection
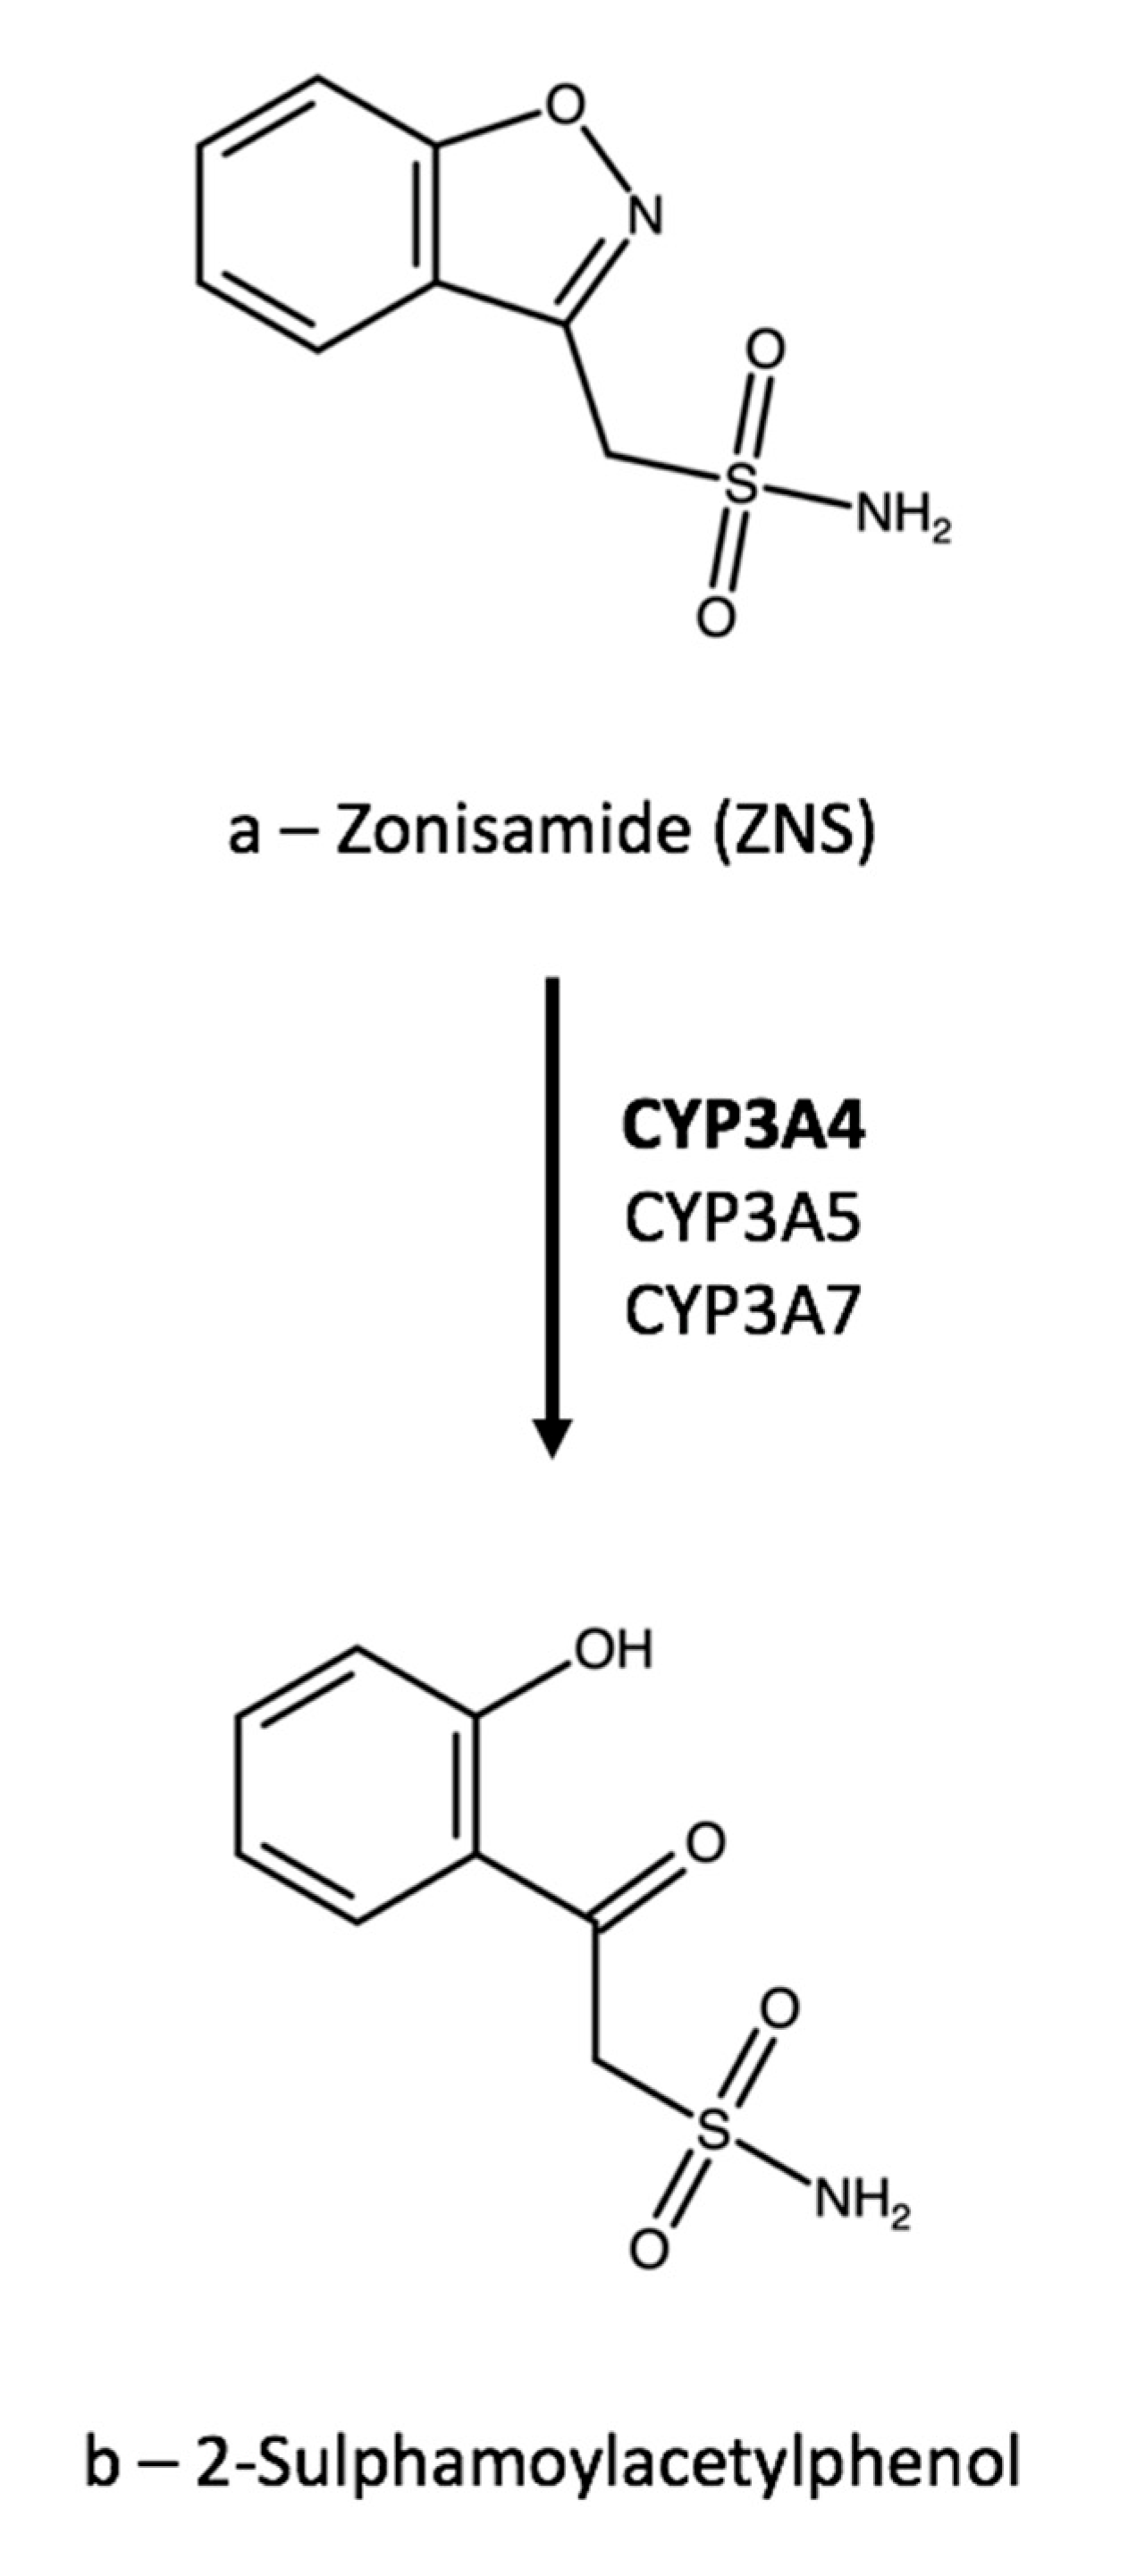
3.3. Zonisamide
3.3.1. Therapeutic Drug Monitoring
Single-Drug Methods
Multi-Drug Methods
3.3.2. Zonisamide Interactions
Clinically Relevant Data
Data with Low or Uncertain Clinical Relevance, Case Reports
3.3.3. Neuroprotection
4. Multi-Drug Methods
5. Conclusions
Author Contributions
Funding
Institutional Review Board Statement
Informed Consent Statement
Data Availability Statement
Conflicts of Interest
References
- World Health Organization. Epilepsy. Available online: http://www.who.int/mediacentre/factsheets/fs999/en/ (accessed on 2 August 2021).
- GBD 2016, Neurology Collaborators. Global, regional, and national burden of neurological disorders, 1990–2016: A systematic analysis for the Global Burden of Disease Study 2016. Lancet Neurol. 2019, 18, 357–375. [Google Scholar] [CrossRef]
- Beghi, E. The Epidemiology of Epilepsy. Neuroepidemiol. 2020, 54, 185–191. [Google Scholar] [CrossRef] [PubMed]
- Jost, J.; Moyano, L.M.; Auditeau, E.; Boumediene, F.; Ratsimbazafy, V.; Preux, P.-M. Interventional programs to improve therapeutic management of people with epilepsy in low– and middle–income countries. Epilepsy Behav. 2018, 80, 337–345. [Google Scholar] [CrossRef]
- Meyer, A.-C.; Dua, T.; Ma, J.; Saxena, S.; Birbeck, G. Global disparities in the epilepsy treatment gap: A systematic review. Bull. World Health Organ. 2010, 88, 260–266. [Google Scholar] [CrossRef] [PubMed]
- Katchanov, J.; Birbeck, G.L. Epilepsy care guidelines for low– and middle– income countries: From WHO mental health GAP to national programs. BMC Med. 2012, 10, 107–113. [Google Scholar] [CrossRef]
- Fiest, K.M.; Sauro, K.M.; Wiebe, S.; Patten, S.B.; Kwon, C.S.; Dykeman, J. Prevalence and incidence of epilepsy: A systematic review and meta–analysis of international studies. Neurology 2017, 88, 296–303. [Google Scholar] [CrossRef]
- Aboul–Enein, M.N.; El–Azzouny, A.A.; Saleh, O.A.; Maklad, Y.A. On chemical structures with potent antiepileptic/anticonvulsant profile. Mini Rev. Med. Chem. 2012, 12, 671–700. [Google Scholar] [CrossRef] [PubMed]
- Goldenberg, M.M. Overview of Drugs Used For Epilepsy and Seizures: Etiology; Diagnosis; and Treatment. Pharm. Ther. 2010, 35, 392–415. [Google Scholar]
- Łukawski, K.; Gryta, P.; Łuszczki, J.; Czuczwar, S.J. Exploring the latest avenues for antiepileptic drug discovery and development. Expert Opin. Drug Dis. 2016, 11, 369–382. [Google Scholar] [CrossRef]
- Lasoñ, W.; Chlebicka, M.; Rejdak, K. Research advances in basic mechanisms of seizures and antiepileptic drug action. Pharmacol. Rep. 2013, 65, 787–801. [Google Scholar] [CrossRef]
- Jacob, S.; Nair, A.B. An Updated Overview on Therapeutic Drug Monitoring of Recent Antiepileptic Drugs. Drugs R. D. 2016, 16, 303–316. [Google Scholar] [CrossRef]
- Patsalos, P.N.; Berry, D.J.; Bourgeois, B.F.D.; Cloyd, J.C.; Glauser, T.A.; Johannessen, S.I.; Leppik, I.E.; Tomson, T.; Perucca, E. Antiepileptic drugs—Best practice guidelines for therapeutic drug monitoring: A position paper by the subcommission on therapeutic drug monitoring, ILAE Commission on Therapeutic Strategies. Epilepsia 2008, 49, 1239–1276. [Google Scholar] [CrossRef]
- Preskorn, S.H. Outliers on the dose–response curve: How to minimize this problem using therapeutic drug monitoring, an underutilized tool in psychiatry. J. Psychiatr. Pract. 2010, 16, 177–182. [Google Scholar] [CrossRef]
- Mandrioli, R.; Mercolini, L.; Saracino, M.A.; Raggi, M.A. Selective serotonin reuptake inhibitors (SSRIs): Therapeutic drug monitoring and pharmacological interactions. Curr. Med. Chem. 2012, 19, 1846–1863. [Google Scholar] [CrossRef]
- Mandrioli, R.; Protti, M.; Mercolini, L. Novel atypical antipsychotics: Metabolism and Therapeutic Drug Monitoring (TDM). Curr. Drug Metab. 2015, 16, 141–151. [Google Scholar] [CrossRef]
- Raggi, M.A.; Mandrioli, R.; Sabbioni, C.; Pucci, V. Atypical antipsychotics: Pharmacokinetics, therapeutic drug monitoring and pharmacological interactions. Curr. Med. Chem. 2004, 11, 279–296. [Google Scholar] [CrossRef]
- Pichini, S.; Papaseit, E.; Joya, X.; Vall, O.; Farré, M.; Garcia-Algar, O.; De Latorre, R. Pharmacokinetics and therapeutic drug monitoring of psychotropic drugs in pediatrics. Ther. Drug Monit. 2009, 31, 283–318. [Google Scholar] [CrossRef]
- Clarke, W.; McMillin, G. Application of TDM, pharmacogenomics and biomarkers for neurological disease pharmacotherapy: Focus on antiepileptic drugs. Pers. Med. 2006, 3, 139–149. [Google Scholar] [CrossRef]
- Mandrioli, R.; Mercolini, L. Metabolism of drugs used in the therapy of seizures: An analytical point of view. Part 1. Curr.Drug Metab. 2017, 18, 735–756. [Google Scholar] [CrossRef]
- Johannessen, S.I.; Tomson, T. Pharmacokinetic variability of newer antiepileptic drugs: When is monitoring needed? Clin. Pharmacokin. 2006, 45, 1061–1075. [Google Scholar] [CrossRef]
- Baumann, P.; Hiemke, C.; Ulrich, S.; Eckermann, G.; Gaertner, I.; Gerlach, M.; Kuss, H.J.; Laux, G.; Müller–Oerlinghausen, B.; Rao, M.L.; et al. Arbeitsgemeinschaft für neuropsychopharmakologie und pharmakopsychiatrie. The AGNP–TDM expert group consensus guidelines: Therapeutic drug monitoring in psychiatry. Pharmacopsychiatry 2004, 37, 243–265. [Google Scholar] [CrossRef] [PubMed]
- Hiemke, C.; Baumann, P.; Bergemann, N.; Conca, A.; Dietmaier, O.; Egberts, K.; Fric, M.; Gerlach, M.; Greiner, C.; Gründer, G.; et al. AGNP consensus guidelines for therapeutic drug monitoring in psychiatry: Update 2011. Pharmacopsychiatry 2011, 44, 195–235. [Google Scholar] [CrossRef] [PubMed]
- Hiemke, C.; Bergemann, N.; Clement, H.W.; Conca, A.; Deckert, J.; Domschke, K.; Eckermann, G.; Egberts, K.; Gerlach, M.; Greiner, C.; et al. Consensus guidelines for therapeutic drug monitoring in neuropsychopharmacology: Update 2017. Pharmacopsychiatry 2018, 51, 9–62. [Google Scholar] [PubMed]
- Scopus Document Search. Available online: https://www.scopus.com/home.uri (accessed on 2 August 2021).
- PubMed. Available online: https://www.ncbi.nlm.nih.gov/pubmed (accessed on 2 August 2021).
- Baftiu, A.; Johannessen Landmark, C.; Nikaj, V.; Neslein, I.-L.; Johannessen, S.I.; Perucca, E. Availability of antiepileptic drugs across Europe. Epilepsia 2015, 56, e191–e197. [Google Scholar] [CrossRef]
- Clark, S.; Antell, A.; Kaufman, K. New antiepileptic medication linked to blue discoloration of the skin and eyes. Ther. Adv. Drug Saf. 2015, 6, 15–19. [Google Scholar] [CrossRef]
- Advance notification of Trobalt® discontinuation. Available online: https://assets.publishing.service.gov.uk/media/57fe4b6640f0b6713800000c/Trobalt_letter.pdf (accessed on 2 August 2021).
- Orhan, G.; Wuttke, T.V.; Nies, A.T.; Schwab, M.; Lerche, H. Retigabine/Ezogabine, a KCNQ/KV7 channel opener: Pharmacological and clinical data. Exp. Opin. Pharmacother. 2012, 13, 1807–1816. [Google Scholar] [CrossRef]
- Hempel, R.; Schupke, H.; McNeilly, P.J.; Heinecke, K.; Kronbach, C.; Grunwald, C.; Zimmermann, G.; Griesinger, C.; Engel, J.; Kronbach, T. Metabolism of retigabine (D–23129), a novel anticonvulsant. Drug Metab. Dispos. 1999, 27, 613–622. [Google Scholar]
- McNeilly, P.J.; Torchin, C.D.; Anderson, L.W.; Kapetanovic, I.M.; Kupferberg, H.J.; Strong, J.M. In vitro glucuronidation of D–23129, a new anticonvulsant, by human liver microsomes and liver slices. Xenobiotica 1997, 27, 431–441. [Google Scholar] [CrossRef]
- Patsalos, P.N.; Berry, D.J. Therapeutic drug monitoring of antiepileptic drugs by use of saliva. Ther. Drug Monit. 2013, 35, 4–29. [Google Scholar] [CrossRef]
- Elkady, E.F.; Aboelwafa, A.A.; Fouad, M.A. Study of gender–related pharmacokinetics of ezogabine in Egyptian volunteers by a validated LC–MS/MS bioanalytical method. J. Adv. Res. 2020, 22, 99–104. [Google Scholar] [CrossRef]
- Knebel, N.G.; Grieb, S.; Leisenheimer, S.; Locher, M. Determination of retigabine and its acetyl metabolite in biological matrices by on–line solid–phase extraction (column switching) liquid chromatography with tandem mass spectrometry. J. Chromatogr. B 2000, 748, 97–111. [Google Scholar] [CrossRef]
- Bu, W.; Nguyen, M.; Xu, C.; Lin, C.-C.; Yeh, L.-T.; Borges, V. Determination of N-acetyl retigabine in dog plasma by LC/MS/MS following off-line μElution 96-well solid phase extraction. J. Chromatogr. B 2007, 852, 465–472. [Google Scholar] [CrossRef]
- Licea Perez, H.; Boram, S.L.; Evans, C.A. Development and validation of a quantitative method for determination of retigabine and its N-acetyl metabolite; overcoming challenges associated with circulating labile N-glucuronide metabolites. Anal. Meth. 2015, 7, 723–735. [Google Scholar] [CrossRef]
- Franco, V.; Baruffi, K.; Gatti, G.; Marchiselli, R.; Fattore, C.; Canevini, M.P.; Crema, F.; Perucca, E. A simple and rapid HPLC–UV method for the determination of retigabine in human plasma. Biomed. Chromatogr. 2018, 32, e4168. [Google Scholar] [CrossRef]
- Tompson, D.J.; Crean, C.S.; Buraglio, M.; Arumugham, T. Lack of effect of ezogabine/retigabine on the pharmacokinetics of digoxin in healthy individuals: Results from a drug–drug interaction study. Clin. Pharmacol. 2014, 6, 149–159. [Google Scholar] [CrossRef]
- Crean, C.S.; Tompson, D.J.; Buraglio, M. The effect of ezogabine on the pharmacokinetics of an oral contraceptive agent. Int. J. Clin. Pharmacol. Ther. 2013, 51, 847–853. [Google Scholar] [CrossRef]
- Ferron, G.M.; Patat, A.; Parks, V.; Rolan, P.; Troy, S. Lack of pharmacokinetic interaction between retigabine and phenobarbital at steady–state in healthy subjects. Clin. Pharmacol. Ther. 2001, 69, P48. [Google Scholar]
- Ferron, G.M.; Patat, A.; Parks, V.; Rolan, P.; Troy, S.M. Lack of pharmacokinetic interaction between retigabine and phenobarbitone at steady–state in healthy subjects. Br. J. Clin. Pharmacol. 2003, 56, 39–45. [Google Scholar] [CrossRef]
- Luszczki, J.J.; Wu, J.Z.; Raszewski, G.; Czuczwar, S.J. Isobolographic characterization of interactions of retigabine with carbamazepine, lamotrigine, and valproate in the mouse maximal electroshock–induced seizure model. N.-S. Arch. Pharmacol. 2009, 379, 163–179. [Google Scholar] [CrossRef]
- Tompson, D.J.; Crean, C.S. The interaction potential of retigabine (ezogabine) with other antiepileptic drugs. Curr. Clin. Pharmacol. 2014, 9, 148–156. [Google Scholar] [CrossRef]
- Ferron, G.M.; Sachdeo, R.; Partiot, A.; Fritz, T.; Althouse, S.; Troy, S. Pharmacokinetic interaction between valproic acid, topiramate, phenytoin or carbamazepine and retigabine in epileptic patients. Clin. Pharmacol. Ther. 2001, 69, P18. [Google Scholar]
- Crean, C.S.; Tompson, D.J. The Effects of Ethanol on the Pharmacokinetics, Pharmacodynamics, Safety, and Tolerability of Ezogabine (Retigabine). Clin. Ther. 2013, 35, 87–93. [Google Scholar] [CrossRef]
- Nodera, H.; Spieker, A.; Sung, M.; Rutkove, S. Neuroprotective effects of Kv7 channel agonist, retigabine, for cisplatin–induced peripheral neuropathy. Neurosci. Lett. 2011, 505, 223–227. [Google Scholar] [CrossRef]
- Mora, G.; Tapia, R. Effects of retigabine on the neurodegeneration and extracellular glutamate changes induced by 4–aminopyridine in rat hippocampus in vivo. Neurochem. Res. 2005, 30, 1557–1565. [Google Scholar] [CrossRef]
- Feng, M.; Crowley, N.A.; Patel, A.; Guo, Y.; Bugni, S.E.; Luscher, B. Reversal of a Treatment–Resistant, Depression–Related Brain State with the Kv7 Channel Opener Retigabine. Neuroscience 2019, 406, 109–125. [Google Scholar] [CrossRef]
- Li, G.-B.; Liu, J.-Y.; Feng, X.-M.; Zhang, B.-L.; Zhang, R.-S. Retigabine attenuates focal cerebral ischemic injury through inhibiting mitochondria–dependent apoptotic pathway. Eur. Rev. Med. Pharmacol. Sci. 2018, 22, 5018–5023. [Google Scholar]
- Zhao, Y.-J.; Nai, Y.; Li, S.-Y.; Zheng, Y.-H. Retigabine protects the blood–brain barrier by regulating tight junctions between cerebral vascular endothelial cells in cerebral ischemia-reperfusion rats. Eur. Rev. Med. Pharmacol. Sci. 2018, 22, 8509–8518. [Google Scholar]
- Sheppard, A.M.; Chen, G.-D.; Salvi, R. Potassium ion channel openers, Maxipost and Retigabine, protect against peripheral salicylate ototoxicity in rats. Hear. Res. 2015, 327, 1–8. [Google Scholar] [CrossRef]
- Pottabathini, R.; Kumar, A.; Bhatnagar, A.; Garg, S. Possible Involvement of Nitric Oxide Modulatory Mechanism in the Protective Effect of Retigabine Against Spinal Nerve Ligation-Induced Neuropathic Pain. Cell. Mol. Neurobiol. 2014, 35, 137–146. [Google Scholar] [CrossRef] [PubMed]
- Peng, Y.-S.; Wu, H.-T.; Lai, Y.-C.; Chen, J.-L.; Yang, Y.-C.; Kuo, C.-C. Inhibition of neuronal Na+ currents by lacosamide: Differential binding affinity and kinetics to different inactivated states. Neuropharmacology 2020, 179, 108266. [Google Scholar] [CrossRef] [PubMed]
- Jo, S.; Bean, B.P. Lacosamide inhibition of Nav1.7 voltage-gated sodium channels: Slow binding to fast-inactivated states. Mol. Pharmacol. 2017, 91, 277–286. [Google Scholar] [CrossRef] [PubMed]
- Limatola, C.; Aronica, E.; Palma, E.; Giallonardo, A.T. A novel action of lacosamide on GABAA currents sets the ground for a synergic interaction with levetiracetam in treatment of epilepsy. Neurobiol. Dis. 2018, 115, 59–68. [Google Scholar]
- Perucca, E.; Yasothan, U.; Clincke, G.; Kirkpatrick, P. Lacosamide. Nature Rev. Drug Disc. 2008, 7, 973–974. [Google Scholar] [CrossRef] [PubMed]
- Moutal, A.; Chew, L.A.; Yang, X.; Wang, Y.; Yeon, S.K.; Telemi, E.; Meroueh, S.; Park, K.D.; Shrinivasan, R.; Gilbraith, K.B.; et al. (S)-lacosamide inhibition of CRMP2 phosphorylation reduces postoperative and neuropathic pain behaviors through distinct classes of sensory neurons identified by constellation pharmacology. Pain 2016, 157, 1448–1463. [Google Scholar] [CrossRef]
- Bentué-Ferrer, D.; Tribut, O.; Verdier, M.-C. Therapeutic drug monitoring of lacosamide Suivi thérapeutique pharmacologique du lacosamide. Therapie 2012, 67, 151–155. [Google Scholar] [CrossRef]
- Gawlik, M.; Skibiaski, R.; Komsta, L. Characterization of Lacosamide Metabolites by UHPLC-ESI-HRMS Method. Acta Chromatogr. 2020, 32, 107–116. [Google Scholar] [CrossRef]
- Schaefer, C.; Cawello, W.; Waitzinger, J.; Elshoff, J.-P. Effect of Age and Sex on Lacosamide Pharmacokinetics in Healthy Adult Subjects and Adults with Focal Epilepsy. Clin. Drug Investig. 2015, 35, 255–265. [Google Scholar] [CrossRef]
- Schultz, L.; Mahmoud, S.H. Is Therapeutic Drug Monitoring of Lacosamide Needed in Patients with Seizures and Epilepsy? Eur. J. Drug Metab. Pharmacokin. 2020, 45, 315–349. [Google Scholar] [CrossRef]
- May, T.W.; Brandt, C.; Helmer, R.; Bien, C.G.; Cawello, W. Comparison of lacosamide concentrations in cerebrospinal fluid and serum in patients with epilepsy. Epilepsia 2015, 56, 1134–1140. [Google Scholar] [CrossRef]
- Yamamoto, Y.; Terada, K.; Araki, Y.; Fukushima, Y.; Imai, K.; Kagawa, Y.; Takahashi, Y. Therapeutic Monitoring of Lacosamide in Japanese Patients With Epilepsy: Clinical Response, Tolerability, and Optimal Therapeutic Range. Ther. Drug Monit. 2020, 42, 754–759. [Google Scholar] [CrossRef]
- Sindhu Devi, M.; Peda Varma, D.; Tulja Rani, G.; Srinivas, N. Liquid chromatographic assay of lacosamide in human plasma using liquidliquid extraction. Int. J. Phar. Pharm. Sci. 2014, 6, 530–533. [Google Scholar]
- Kestelyn, C.; Lastelle, M.; Higuet, N.; Dell’Aiera, S.; Staelens, L.; Boulanger, P.; Boekens, H.; Smith, S. A simple HPLC–UV method for the determination of lacosamide in human plasma. Bioanalysis 2011, 3, 2515–2522. [Google Scholar] [CrossRef]
- Bharwad, K.D.; Shah, P.A.; Shrivastav, P.S.; Sharma, V.S. Selective quantification of lacosamide in human plasma using UPLC–MS/MS: Application to pharmacokinetic study in healthy subjects with different doses. Biomed. Chromatogr. 2020, 34, e4928. [Google Scholar] [CrossRef]
- Brandt, C.; Bien, C.G.; Helmer, R.; May, T.W. Assessment of the correlations of lacosamide concentrations in saliva and serum in patients with epilepsy. Epilepsia 2018, 59, e34–e39. [Google Scholar] [CrossRef]
- Cawello, W.; Bökens, H.; Nickel, B.; Andreas, J.O.; Halabi, A. Tolerability, pharmacokinetics, and bioequivalence of the tablet and syrup formulations of lacosamide in plasma, saliva, and urine: Saliva as a surrogate of pharmacokinetics in the central compartment. Epilepsia 2013, 54, 81–84. [Google Scholar] [CrossRef]
- FDA Guidance for Industry: Bioanalytical Method Validation (2001). Available online: https://www.fda.gov/files/drugs/published/Bioanalytical-Method-Validation-Guidance-for-Industry.pdf (accessed on 10 November 2021).
- Greenaway, C.; Ratnaraj, N.; Sander, J.W.; Patsalos, P.N. Saliva and serum lacosamide concentrations in patients with epilepsy. Epilepsia 2011, 52, 258–263. [Google Scholar] [CrossRef]
- Greenaway, C.; Ratnaraj, N.; Sander, J.W.; Patsalos, P.N. A high–performance liquid chromatography assay to monitor the new antiepileptic drug lacosamide in patients with epilepsy. Ther. Drug Monit. 2010, 32, 448–452. [Google Scholar] [CrossRef]
- Jalakam, S.P.; Tambe, V.S.; Deodhar, M.N.; Prakya, V.; Waghmode, J.; Pawar, P. Direct Chiral HPLC–MS/MS Method for Determination of R–Lacosamide in Human Plasma. Pharm. Chem. J. 2020, 54, 90–97. [Google Scholar] [CrossRef]
- Mouskeftara, T.; Alexandridou, A.; Krokos, A.; Gika, H.; Mastrogianni, O.; Orfanidis, A.; Raikos, N. A Simple Method for the Determination of Lacosamide in Blood by GC-MS. J. Forensic Sci. 2020, 65, 288–294. [Google Scholar] [CrossRef]
- Monfort, A.; Jutras, M.; Martin, B.; Boucoiran, I.; Ferreira, E.; Leclair, G. Simultaneous quantification of 19 analytes in breast milk by liquid chromatography–tandem mass spectrometry (LC-MS/MS). J. Pharm. Biomed. Anal. 2021, 204, 114236. [Google Scholar] [CrossRef]
- Carona, A.; Bicker, J.; Silva, R.; Silva, A.; Santana, I.; Sales, F.; Falcão, A.; Fortuna, A. HPLC method for the determination of antiepileptic drugs in human saliva and its application in therapeutic drug monitoring. J. Pharm. Biomed. Anal. 2021, 197, 113961. [Google Scholar] [CrossRef]
- Gonçalves, J.; Alves, G.; Bicker, J.; Falcão, A.; Fortuna, A. Development and full validation of an innovative HPLC–diode array detection technique to simultaneously quantify lacosamide, levetiracetam and zonisamide in human plasma. Bioanalysis 2018, 10, 541–557. [Google Scholar] [CrossRef]
- Cawello, W.; Stockis, A.; Andreas, J.-O.; Dimova, S. Advances in epilepsy treatment: Lacosamide pharmacokinetic profile. Ann. N.Y. Acad. Sci. 2014, 1329, 18–32. [Google Scholar] [CrossRef]
- Cawello, W.; Mueller-Voessing, C.; Fichtner, A. Pharmacokinetics of lacosamide and omeprazole coadministration in healthy volunteers: Results from a phase I, randomized, crossover trial. Clin. Drug Investig. 2014, 34, 317–325. [Google Scholar] [CrossRef]
- Cawello, W.; Mueller-Voessing, C.; Andreas, J.-O. Effect of lacosamide on the steady-state pharmacokinetics of digoxin: Results from a phase I, multiple-dose, double-blind, randomised, placebo-controlled, crossover trial. Clin. Drug Investig. 2014, 34, 327–334. [Google Scholar] [CrossRef]
- Markoula, S.; Teotonio, R.; Ratnaraj, N.; Duncan, J.S.; Sander, J.W.; Patsalos, P.N. Lacosamide serum concentrations in adult patients with epilepsy: The influence of gender, age, dose, and concomitant antiepileptic drugs. Ther. Drug Monit. 2014, 36, 494–498. [Google Scholar] [CrossRef] [PubMed]
- Contin, M.; Albani, F.; Riva, R.; Candela, C.; Mohamed, S.; Baruzzi, A. Lacosamide therapeutic monitoring in patients with epilepsy: Effect of concomitant antiepileptic drugs. Ther. Drug Monit. 2013, 35, 849–852. [Google Scholar] [CrossRef]
- May, T.W.; Helmer, R.; Bien, C.G.; Brandt, C. Influence of dose and antiepileptic comedication on lacosamide serum concentrations in patients with epilepsy of different ages. Ther. Drug Monit. 2018, 40, 620–627. [Google Scholar] [CrossRef] [PubMed]
- Novy, J.; Patsalos, P.N.; Sander, J.W.; Sisodiya, S.M. Lacosamide neurotoxicity associated with concomitant use of sodium channel–blocking antiepileptic drugs: A pharmacodynamic interaction? Epilepsy Behav. 2011, 20, 20–23. [Google Scholar] [CrossRef]
- Tountopoulou, M.; Weschke, B.; Kaindl, A.M. Lacosamide Lowers Valproate and Levetiracetam Levels. Neuropediatrics 2017, 48, 188–189. [Google Scholar] [CrossRef]
- Chua-Tuan, J.L.; Cao, D.; Iwanicki, J.L.; Hoyte, C.O. Cardiac sodium channel blockade after an intentional ingestion of lacosamide, cyclobenzaprine, and levetiracetam: Case report. Clin. Toxicol. 2015, 53, 565–568. [Google Scholar] [CrossRef]
- Stockis, A.; Van Lier, J.J.; Cawello, W.; Kumke, T.; Eckhardt, K. Lack of effect of lacosamide on the pharmacokinetic and pharmacodynamic profiles of warfarin. Epilepsia 2013, 54, 1161–1166. [Google Scholar] [CrossRef][Green Version]
- Cawello, W.; Rosenkranz, B.; Schmid, B.; Wierich, W. Pharmacodynamic and pharmacokinetic evaluation of coadministration of lacosamide and an oral contraceptive (levonorgestrel plus ethinylestradiol) in healthy female volunteers. Epilepsia 2013, 54, 530–536. [Google Scholar] [CrossRef]
- Cawello, W.; Bonn, R. No pharmacokinetic interaction between lacosamide and valproic acid in healthy volunteers. J. Clin. Pharmacol. 2012, 52, 1739–1748. [Google Scholar] [CrossRef]
- Cawello, W.; Nickel, B.; Eggert-Formella, A. No pharmacokinetic interaction between lacosamide and carbamazepine in healthy volunteers. J. Clin. Pharmacol. 2010, 50, 459–471. [Google Scholar] [CrossRef]
- Lacosamide: New Drug. Refractory partial epilepsy: Optimise existing combinations. Prescrire Int. 2009, 18, 196. [Google Scholar]
- Savran, M.; Ozmen, O.; Erzurumlu, Y.; Savas, H.B.; Asci, S.; Kaynak, M. The Impact of Prophylactic Lacosamide on LPS–Induced Neuroinflammation in Aged Rats. Inflammation 2019, 42, 1913–1924. [Google Scholar] [CrossRef]
- Demiroz, S.; Ur, K.; Ulucan, A.; Bengu, A.S.; Demiralin Ur, F.; Gergin, O.O.; Erdem, S. Neuroprotective effects of lacosamide in experimental traumatic spinal cord injury in rats. Turk. Neurosurg. 2019, 29, 718–723. [Google Scholar] [CrossRef] [PubMed]
- Choi, H.Y.; Park, J.H.; Chen, B.H.; Shin, B.N.; Lee, Y.L.; Kim, I.H.; Cho, J.-H.; Lee, T.-K.; Lee, J.-C.; Won, M.-H.; et al. Increases of Catalase and Glutathione Peroxidase Expressions by Lacosamide Pretreatment Contributes to Neuroprotection Against Experimentally Induced Transient Cerebral Ischemia. Neurochem. Res. 2016, 41, 2380–2390. [Google Scholar] [CrossRef] [PubMed]
- Mazzocchetti, P.; Tantucci, M.; Bastioli, G.; Calabrese, V.; Di Filippo, M.; Tozzi, A.; Calabresi, P.; Costa, C. Lacosamide protects striatal and hippocampal neurons from in vitro ischemia without altering physiological synaptic plasticity. Neuropharmacology 2018, 135, 424–430. [Google Scholar] [CrossRef] [PubMed]
- Excegran Tablets 100 mg & Excegran Powder 20%. Available online: https://web.archive.org/web/20070928063802/http://www.e-search.ne.jp/~jpr/PDF/DAINIP03.PDF (accessed on 2 August 2021).
- Zonegran. Available online: http://www.bellaireneurology.com/seizure/epil_trt_zonegran.html (accessed on 2 August 2021).
- Grover, N.D.; Limaye, R.P.; Gokhale, D.V.; Patil, T.R. Zonisamide: A review of the clinical and experimental evidence for its use in Parkinson’s disease. Indian J. Pharmacol. 2013, 45, 547–555. [Google Scholar] [CrossRef]
- Iwata, Y.; Irie, S.; Uchida, H.; Suzuki, T.; Watanabe, K.; Iwashita, S.; Mimura, M. Effects of zonisamide on tardive dyskinesia: A preliminary open–label trial. J. Neurol. Sci. 2012, 315, 137–140. [Google Scholar] [CrossRef]
- Zonisamide. Martindale: The Complete Drug Reference; Brayfield, A., Ed.; MedicinesComplete: London, UK, 2016. [Google Scholar]
- Leppik, I.E. Zonisamide: Chemistry, mechanism of action, and pharmacokinetics. Seizure 2004, 13 (Suppl. 1), S5–S10. [Google Scholar] [CrossRef]
- Ueda, Y.; Doi, T.; Tokumaru, J.; Willmore, L.J. Effect of zonisamide on molecular regulation of glutamate and GABA transporter proteins during epileptogenesis in rats with hippocampal seizures. Brain Res. Mol. 2003, 116, 1–6. [Google Scholar] [CrossRef]
- Stiff, D.D.; Robicheau, J.T.; Zemaitis, M.A. Reductive metabolism of the anticonvulsant agent zonisamide, a 1,2–benzisoxazole derivative. Xenobiotica 1992, 22, 1–11. [Google Scholar] [CrossRef]
- Mimaki, T. Clinical pharmacology and therapeutic drug monitoring of zonisamide. Ther. Drug Monit. 1998, 20, 593–597. [Google Scholar] [CrossRef]
- Eto, D.; Tanaka, R.; Suzuki, Y.; Sato, Y.; Itoh, H. Comparison of performance characteristics between high–performance liquid chromatography and latex agglutination turbidimetric immunoassay for therapeutic drug monitoring of zonisamide. J. Clin. Lab. Anal. 2019, 33, e22940. [Google Scholar] [CrossRef]
- Lourenço, D.; Sarraguça, M.; Alves, G.; Coutinho, P.; Araujo, A.R.T.S.; Rodrigues, M. A novel HPLC method for the determination of zonisamide in human plasma using microextraction by packed sorbent optimised by experimental design. Anal. Meth. 2017, 9, 5910–5919. [Google Scholar] [CrossRef]
- Makino, K.; Goto, Y.; Sueyasu, M.; Futagami, K.; Kataoka, Y.; Oishi, R. Micellar electrokinetic capillary chromatography for therapeutic drug monitoring of zonisamide. J. Chromatogr. B 1997, 695, 417–425. [Google Scholar] [CrossRef]
- Munshi, R.P.; Gawde, N. Development and Validation of a HPTLC Method to Determine Serum Zonisamide levels for Therapeutic Drug Monitoring in Clinical Settings. Indian J. Pharm. Sci. 2019, 81, 385–389. [Google Scholar] [CrossRef]
- Protti, M.; Sberna, P.M.; Sberna, A.E.; Ferrante, R.; Mandrioli, R.; Mercolini, L. Enhanced urinary stability of peptide hormones and growth factors by dried urine microsampling. J. Pharm. Biomed. Anal. 2021, 204, 114234. [Google Scholar] [CrossRef]
- Mercolini, L.; Mandrioli, R.; Protti, M. Quantitative microsampling for bioanalytical applications related to the SARS–CoV–2 pandemic: Usefulness, benefits and pitfalls. J. Pharm. Biomed. Anal. 2020, 191, 113597. [Google Scholar]
- Protti, M.; Marasca, C.; Cirrincione, M.; Mandrioli, R.; Cavalli, A.; Mercolini, L. Assessment of capillary volumetric blood microsampling for the analysis of central nervous system drugs and metabolites. Analyst 2020, 145, 5744–5753. [Google Scholar] [CrossRef]
- Marasca, C.; Protti, M.; Mandrioli, R.; Atti, A.R.; Armirotti, A.; Cavalli, A.; De Ronchi, D.; Mercolini, L. Whole blood and oral fluid microsampling for the monitoring of patients under treatment with antidepressant drugs. J. Pharm. Biomed. Anal. 2020, 118, 113384. [Google Scholar] [CrossRef]
- Vincze, I.; Rudge, J.; Vásárhelyi, B.; Karvaly, G.B. Analysis of 14 drugs in dried blood microsamples in a single workflow using whole blood and serum calibrators. Bioanalysis 2020, 12, 1243–1261. [Google Scholar] [CrossRef]
- Mandrioli, R.; Mercolini, L.; Protti, M. Blood and plasma volumetric absorptive microsampling (VAMS) coupled to LC–MS/MS for the forensic assessment of cocaine consumption. Molecules 2020, 25, 1046. [Google Scholar] [CrossRef]
- Mercolini, L.; Mandrioli, R.; Protti, M. Tutorial: Volumetric absorptive microsampling (VAMS). Anal. Chim. Acta 2019, 1046, 32–47. [Google Scholar]
- Protti, M.; Sberna, P.M.; Sardella, R.; Vovk, T.; Mercolini, L.; Mandrioli, R. VAMS and StAGE as innovative tools for the enantioselective determination of clenbuterol in urine by LC–MS/MS. J. Pharm. Biomed. Anal. 2021, 195, 113873. [Google Scholar] [CrossRef] [PubMed]
- D’Urso, A.; Cangemi, G.; Barco, S.; Striano, P.; D’avolio, A.; De Grazia, U. LC-MS/MS-Based Quantification of 9 Antiepileptic Drugs From a Dried Sample Spot Device. Ther. Drug Monit. 2019, 41, 331–339. [Google Scholar] [CrossRef]
- Baldelli, S.; Cattaneo, D.; Giodini, L.; Baietto, L.; Di Perri, G.; D’Avolio, A.; Clementi, E. Development and validation of a HPLC-UV method for the quantification of antiepileptic drugs in dried plasma spots. Clin. Chem. Lab. Med. 2015, 53, 435–444. [Google Scholar] [CrossRef] [PubMed]
- Palte, M.J.; Basu, S.S.; Dahlin, J.L.; Gencheva, R.; Mason, D.; Jarolim, P.; Petrides, A.K. Development and validation of an ultra–performance liquid chromatography—tandem mass spectrometry method for the concurrent measurement of gabapentin, lamotrigine, levetiracetam, monohydroxy derivative of oxcarbazepine, and zonisamide concentrations in serum in a clinical setting. Ther. Drug Monit. 2018, 40, 469–476. [Google Scholar]
- Park, D.; Choi, H.; Jang, M.; Chang, H.; Woo, S.; Yang, W. Simultaneous determination of 18 psychoactive agents and 6 metabolites in plasma using LC-MS/MS and application to actual plasma samples from conscription candidates. Forensic Sci. Int. 2018, 288, 283–290. [Google Scholar] [CrossRef]
- Carlow, D.C.; Shi, H.; Schofield, R.C. Simultaneous quantitation of lamotrigine, levetiracetam, 10–hydroxycarbazepine, topiramate, and zonisamide in serum using HPLC-MS/MS. In Clinical Applications of Mass Spectrometry in Drug Analysis (Methods in Molecular Biology series); Garg, U., Ed.; Humana Press: New York, NY, USA, 2016; Volume 1383, pp. 29–37. [Google Scholar]
- Kim, K.-B.; Seo, K.-A.; Kim, S.-E.; Bae, S.K.; Kim, D.-H.; Shin, J.-G. Simple and accurate quantitative analysis of ten antiepileptic drugs in human plasma by liquid chromatography/tandem mass spectrometry. J. Pharm. Biomed. Anal. 2011, 56, 771–777. [Google Scholar] [CrossRef]
- Behbahani, M.; Najafi, F.; Bagheri, S.; Bojdi, M.K.; Salarian, M.; Bagheri, A. Application of surfactant assisted dispersive liquid-liquid microextraction as an efficient sample treatment technique for preconcentration and trace detection of zonisamide and carbamazepine in urine and plasma samples. J. Chromatogr. A 2013, 1308, 25–31. [Google Scholar] [CrossRef]
- Heideloff, C.; Bunch, D.R.; Wang, S. A novel HPLC method for quantification of 10 antiepileptic drugs or metabolites in serum/plasma using a monolithic column. Ther. Drug Monit. 2010, 32, 102–106. [Google Scholar] [CrossRef]
- Contin, M.; Mohamed, S.; Candela, C.; Albani, F.; Riva, R.; Baruzzi, A. Simultaneous HPLC–UV analysis of rufinamide, zonisamide, lamotrigine, oxcarbazepine monohydroxy derivative and felbamate in deproteinized plasma of patients with epilepsy. J. Chromatogr. B 2010, 878, 461–465. [Google Scholar] [CrossRef]
- Greiner–Sosanko, E.; Giannoutsos, S.; Lower, D.R.; Virji, M.A.; Krasowski, M.D. Drug monitoring: Simultaneous analysis of lamotrigine, oxcarbazepine, 10-hydroxycarbazepine, and zonisamide by HPLC–UV and a rapid GC method using a nitrogen–phosphorus detector for levetiracetam. J. Chromatogr. Sci. 2007, 45, 616–622. [Google Scholar] [CrossRef]
- Antonilli, L.; Brusadin, V.; Filipponi, F.; Guglielmi, R.; Nencini, P. Development and validation of an analytical method based on high performance thin layer chromatography for the simultaneous determination of lamotrigine, zonisamide and levetiracetam in human plasma. J. Pharm. Biomed. Anal. 2011, 56, 763–770. [Google Scholar] [CrossRef]
- Ibrahim, F.A.; El–Yazbi, A.F.; Wagih, M.M.; Barary, M.A. Chromatographic determination of zonisamide, topiramate and sulpiride in plasma by a fluorescent ‘turn-on’ chemosensor. Bioanalysis 2017, 9, 1049–1064. [Google Scholar] [CrossRef]
- Okada, Y.; Seo, T.; Ishitsu, T.; Wanibuchi, A.; Hashimoto, N.; Higa, Y.; Nakagawa, K. Population estimation regarding the effects of cytochrome P450 2C19 and 3A5 polymorphisms on zonisamide clearance. Ther. Drug Monit. 2008, 30, 540–543. [Google Scholar] [CrossRef]
- Ragueneau-Majlessi, I.; Levy, R.H.; Brodie, M.; Smith, D.; Shah, J.; Grundy, J.S. Lack of pharmacokinetic interactions between steady-state zonisamide and valproic acid in patients with epilepsy. Clin. Pharmacokin. 2005, 44, 517–523. [Google Scholar] [CrossRef] [PubMed]
- Levy, R.H.; Ragueneau-Majlessi, I.; Brodie, M.J.; Smith, D.F.; Shah, J.; Pan, W.-J. Lack of clinically significant pharmacokinetic interactions between zonisamide and lamotrigine at steady state in patients with epilepsy. Ther. Drug Monit. 2005, 27, 193–198. [Google Scholar] [CrossRef] [PubMed]
- Sills, G.J.; Brodie, M.J. Pharmacokinetics and drug interactions with zonisamide. Epilepsia 2007, 48, 435–441. [Google Scholar] [CrossRef] [PubMed]
- Levy, R.H.; Ragueneau-Majlessi, I.; Garnett, W.R.; Schmerler, M.; Rosenfeld, W.; Shah, J.; Pan, W.-J. Lack of a clinically significant effect of zonisamide on phenytoin steady-state pharmacokinetics in patients with epilepsy. J. Clin. Pharmacol. 2004, 44, 1230–1234. [Google Scholar] [CrossRef]
- Ragueneau-Majlessi, I.; Levy, R.H.; Bergen, D.; Garnett, W.; Rosenfeld, W.; Mather, G.; Shah, J.; Grundy, J.S. Carbamazepine pharmacokinetics are not affected by zonisamide: In vitro mechanistic study and in vivo clinical study in epileptic patients. Epilepsy Res. 2004, 62, 1–11. [Google Scholar] [CrossRef]
- Griffith, S.G.; Dai, Y. Effect of zonisamide on the pharmacokinetics and pharmacodynamics of a combination ethinyl estradiol–norethindrone oral contraceptive in healthy women. Clin. Ther. 2004, 26, 2056–2065. [Google Scholar] [CrossRef]
- Stefanidis, A.; Watt, M.J.; Cowley, M.A.; Oldfield, B.J. Prevention of the adverse effects of olanzapine on lipid metabolism with the antiepileptic zonisamide. Neuropharmacology 2017, 123, 55–66. [Google Scholar] [CrossRef]
- Wallingford, N.M.; Sinnayah, P.; Bymaster, F.P.; Gadde, K.M.; Krishnan, R.K.; McKinney, A.A.; Landbloom, R.P.; Tollefson, G.D.; Cowley, M.A. Zonisamide prevents olanzapine–associated hyperphagia, weight gain, and elevated blood glucose in rats. Neuropsychopharmacology 2008, 33, 2922–2933. [Google Scholar] [CrossRef]
- Binda, C.; Aldeco, M.; Mattevi, A.; Edmondson, D.E. Interactions of monoamine oxidases with the antiepileptic drug zonisamide: Specificity of inhibition and structure of the human monoamine oxidase B complex. J. Med. Chem. 2011, 54, 909–912. [Google Scholar] [CrossRef]
- Hossain, M.M.; Weig, B.; Reuhl, K.; Gearing, M.; Wu, L.J.; Richardson, J.R. The anti–parkinsonian drug zonisamide reduces neuroinflammation: Role of microglial Nav 1.6. Exp. Neurol. 2018, 308, 111–119. [Google Scholar] [CrossRef]
- Sano, H.; Murata, M.; Nambu, A. Zonisamide reduces nigrostriatal dopaminergic neurodegeneration in a mouse genetic model of Parkinson’s disease. J. Neurochem. 2015, 134, 371–381. [Google Scholar] [CrossRef]
- Asanuma, M.; Miyazaki, I.; Diaz-Corrales, F.J.; Kimoto, N.; Kikkawa, Y.; Takeshima, M.; Miyoshi, K.; Murata, M. Neuroprotective effects of zonisamide target astrocyte. Ann. Neurol. 2010, 67, 239–249. [Google Scholar] [CrossRef]
- Kumar, B.; Medhi, B.; Modi, M.; Saikia, B.; Attri, S.V.; Patial, A. A mechanistic approach to explore the neuroprotective potential of zonisamide in seizures. Inflammopharmacology 2018, 26, 1125–1131. [Google Scholar] [CrossRef]
- Costa, C.; Tozzi, A.; Siliquini, S.; Galletti, F.; Cardaioli, G.; Tantucci, M.; Pisani, F.; Calabresi, P. A critical role of NO/cGMP/PKG dependent pathway in hippocampal post-ischemic LTP: Modulation by zonisamide. Neurobiol. Dis. 2011, 44, 185–191. [Google Scholar] [CrossRef]
- Deeb, S.; McKeown, D.A.; Torrance, H.J.; Wylie, F.M.; Logan, B.K.; Scott, K.S. Simultaneous analysis of 22 antiepileptic drugs in postmortem blood, serum and plasma using LC-MS/MS with a focus on their role in forensic cases. J. Anal. Toxicol. 2014, 38, 485–494. [Google Scholar] [CrossRef]
- Patsalos, P.N.; Zugman, M.; Lake, C.; James, A.; Ratnaraj, N.; Sander, J.W. Serum protein binding of 25 antiepileptic drugs in a routine clinical setting: A comparison of free non-protein-bound concentrations. Epilepsia 2017, 58, 1234–1243. [Google Scholar] [CrossRef]
- Mercolini, L.; Saracino, M.A.; Protti, M. Current advances in biosampling for therapeutic drug monitoring of psychiatric CNS drugs. Bioanalysis 2015, 7, 1925–1942. [Google Scholar] [CrossRef]


| Ref. | Technique | Linearity Range, µg/mL | Extraction Yield, % | Precision, RSD % | Accuracy, % | Matrix Effect, % | Carry-Over 1 | IS | Notes |
|---|---|---|---|---|---|---|---|---|---|
| [74] | GC-MS | 1–70 | 91–114 | 4.6–10.1 | - | - | - | Moclobemide | Stability assessed; forensic |
| [75] | LC-MS/MS | 0.001–0.5 | - | 2.4-18.7 | 95-115 | <10.4 | 5.6 | LCS-13C | Stability assessed; breast milk |
| [76] | HPLC-PDA | 1–30 | 78–90 | 4.2–13.0 | 100–102 | n.a. | 10 | Antipyrine | Stability assessed; saliva |
| [77] | HPLC-PDA | 0.5–30 | 73–99 | 2.3–8.8 | 88–108 | n.a. | <5 | Antipyrine | Stability assessed |
| Ref. | Technique | Linearity Range, µg/mL | Extraction Yield, % | Precision, RSD% | Accuracy, % | Matrix Effect, % | Carry-Over 1 | IS | Notes |
|---|---|---|---|---|---|---|---|---|---|
| [113] | LC-MS/MS | 0.4–39.8 | <119 | 1.1–13.8 | 91–116 | 1–5 | - | ZNS-D4,15N | Stability assessed; VAMS |
| [118] | HPLC-UV | 2.4–60 | 84.5 | <15.0 | 85–115 | n.a. | ≅0 | Linezolid | Stability assessed; DPS |
| [119] | UHPLC-MS/MS | 0.1–100 | 101 (mean) | 2.8–11.1 | ≤118 | 4 | Yes 2 | ZNS-13C6 | Stability assessed |
| [120] | LC-MS/MS | 0.025–1 | 104 (mean) | 6.5–7.6 (mean) | 89–91 (mean) | ≤3.9 | - | Topiramate-D12 | |
| [121] | LC-MS/MS | 0.8–80 | - | <7 3 | - | - | - | Clonazepam-D4 | |
| [122] | LC-MS/MS | 1.6–60 | 96–107 | 2.3–9.9 | 88–112 | ≤12 | ≅0 | Valproate-D6 | Stability assessed |
| [77] | HPLC-PDA | 0.5–30 | 73–99 | 2.3–8.8 | 88–108 | n.a. | <5 | Antipyrine | Stability assessed |
| [123] | HPLC-UV | 0.5–300 | ≤97.5 | 6.2–6.9 | 95–96 | n.a. | - | None | |
| [124] | HPLC-UV | 1–99 | 89–109 | 0.3–7.6 | 99 (mean) | n.a. | ≅0 | 5-Ethyl-5-p- tolylbarbituric acid | |
| [125] | HPLC-UV | 2–80 | - | 1.5–9–7 | 100–108 | n.a. | - | Citalopram | |
| [126] | HPLC-UV | 1–40 | - | 0.7–8.2 | 101–104 | n.a. | - | Chloramphenicol | |
| [127] | HPTLC-UV | 3.7–20 | - | 1.5–6.2 3 | - | n.a. | - | None | |
| [128] | HPLC-FL | 0.1–3 | - | 0.9–1.3 | 99–103 | - | - | Sulpiride or topiramate | Stability assessed |
| Analyte | Linearity Range, µg/mL | Extraction Yield, % | Precision, RSD% | Accuracy, % | Matrix Effect, % | Carry-Over 1 | IS | Notes |
|---|---|---|---|---|---|---|---|---|
| Ezogabine | 0.05–10 | 93–102 | 0.8–8.2 | 102–107 | 6–12 | ≅0 | Carbamazepine diol | Stability assessed |
| Lacosamide | 0.5–50 | 99–104 | 1.3–4.5 | 102–107 | 9–10 | ≅0 | Gabapentin-D10 | Stability assessed |
| Zonisamide | 1–50 | 98–104 | 3.1–8.7 | 94–100 | 6–8 | ≅0 | Tolbutamide | Stability assessed |
Publisher’s Note: MDPI stays neutral with regard to jurisdictional claims in published maps and institutional affiliations. |
© 2021 by the authors. Licensee MDPI, Basel, Switzerland. This article is an open access article distributed under the terms and conditions of the Creative Commons Attribution (CC BY) license (https://creativecommons.org/licenses/by/4.0/).
Share and Cite
Mandrioli, R.; Protti, M.; Marincich, L.; Mercolini, L. Ion-Channel Antiepileptic Drugs: An Analytical Perspective on the Therapeutic Drug Monitoring (TDM) of Ezogabine, Lacosamide, and Zonisamide. Analytica 2021, 2, 171-194. https://doi.org/10.3390/analytica2040016
Mandrioli R, Protti M, Marincich L, Mercolini L. Ion-Channel Antiepileptic Drugs: An Analytical Perspective on the Therapeutic Drug Monitoring (TDM) of Ezogabine, Lacosamide, and Zonisamide. Analytica. 2021; 2(4):171-194. https://doi.org/10.3390/analytica2040016
Chicago/Turabian StyleMandrioli, Roberto, Michele Protti, Lorenzo Marincich, and Laura Mercolini. 2021. "Ion-Channel Antiepileptic Drugs: An Analytical Perspective on the Therapeutic Drug Monitoring (TDM) of Ezogabine, Lacosamide, and Zonisamide" Analytica 2, no. 4: 171-194. https://doi.org/10.3390/analytica2040016
APA StyleMandrioli, R., Protti, M., Marincich, L., & Mercolini, L. (2021). Ion-Channel Antiepileptic Drugs: An Analytical Perspective on the Therapeutic Drug Monitoring (TDM) of Ezogabine, Lacosamide, and Zonisamide. Analytica, 2(4), 171-194. https://doi.org/10.3390/analytica2040016