Article

Variations in Female Pelvic Anatomy via MRI: A Retrospective Study at Single Academic Institution

by
Gamal Ghoniem
1,
William Phan
1,
Naila Javaid
1,
Mashrin Lira Chowdhury
1,
Bilal Farhan
1,2,
Muhammed A. Moukhtar Hammad
1,*,
Ahmed Ahmed
3,
David Csuka
1,
Dina Saba
1,
Mohammad Helmy
4 and
Sonia Lee
4
1
Department of Urology, University of California, Irvine, CA 92868, USA
2
Medical Branch (UTMB), University of Texas, Galveston, TX 77555, USA
3
Department of Urology, Aswan University, Aswan 81528, Egypt
4
Department of Radiology, University of California, Irvine, CA 92868, USA
*
Author to whom correspondence should be addressed.
Submission received: 24 June 2025 / Revised: 24 July 2025 / Accepted: 9 September 2025 / Published: 11 September 2025

Abstract

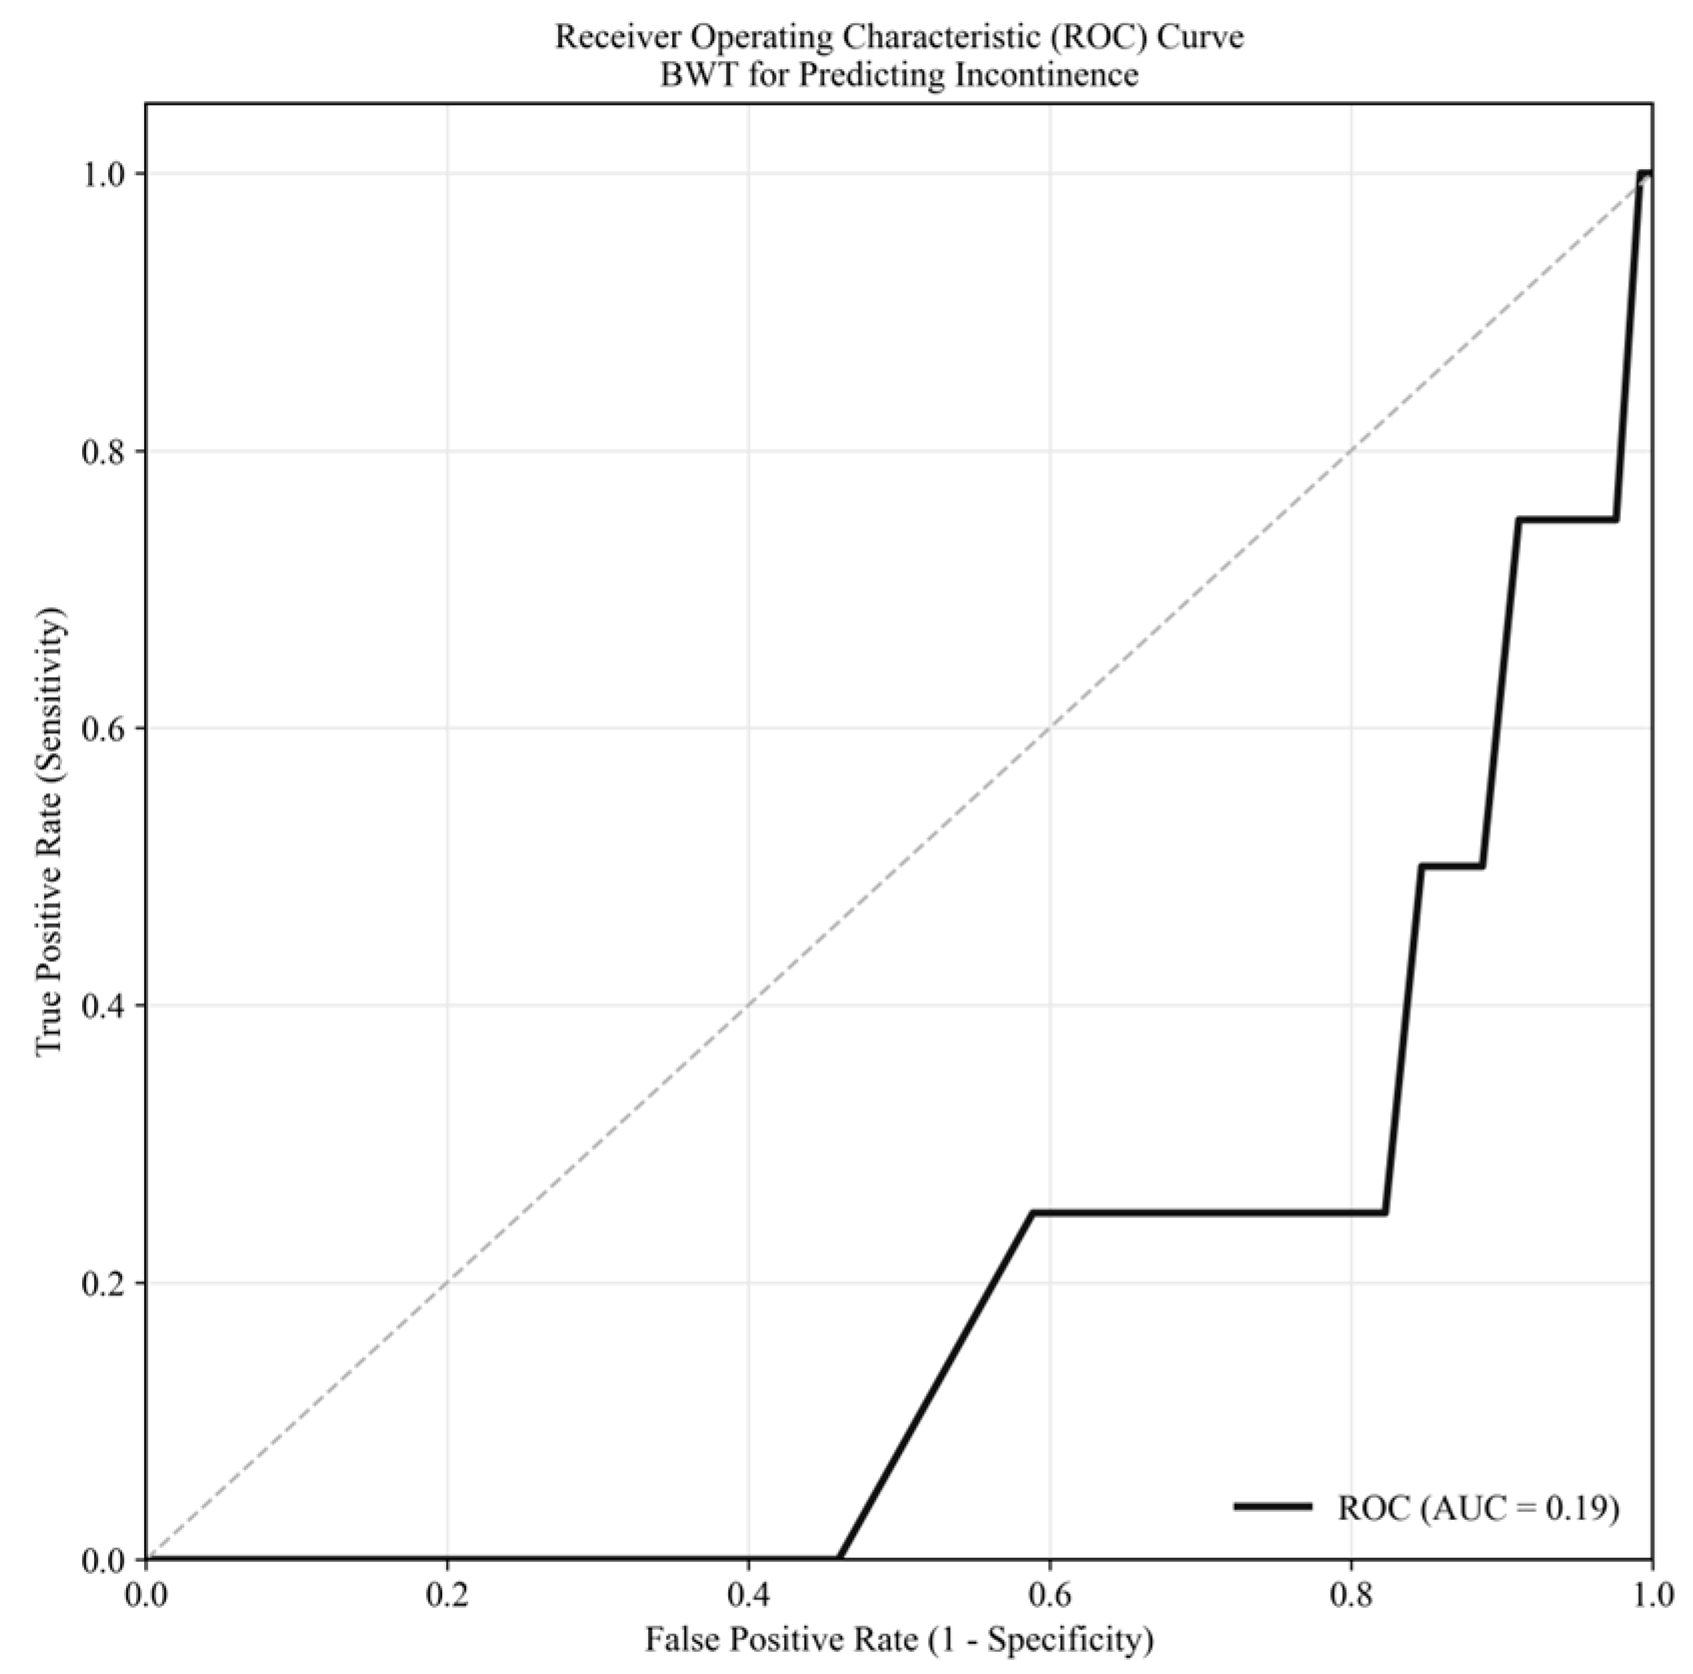
Background/Objectives: Pelvic floor disorders affect up to 30% of adult females in the United States. Misdiagnosis occurs in nearly 45% to 90% of cases. Standardized pelvic anatomical measurements could improve diagnostic accuracy and treatment planning. We aimed to evaluate pelvic anatomical variations using magnetic resonance imaging (MRI). Methods: We analyzed MRI pelvic measurements from 250 women aged 20–90 years. Exclusion criteria included prior pelvic surgery (except hysterectomy), pelvic cancer, and use of alternative imaging modalities. Key measurements included anterior vaginal wall thickness (AVWT), bladder wall thickness (BWT), vaginal epithelium to bladder urothelium (VWBU), urethral length (UL), and inter-ureteral distances. A comprehensive statistical analysis was performed, including corrections for multiple comparisons. Results: While several anatomical measurements were correlated, a comprehensive analysis was performed to identify markers for clinical diagnoses. After applying Bonferroni correction for multiple comparisons, we found no statistically significant association between any of the measured anatomical parameters and a diagnosis of incontinence. Notably, an uncorrected difference in Bladder Wall Thickness (BWT) (p = 0.041) did not hold up to rigorous testing. To further assess its clinical utility, a Receiver Operating Characteristic (ROC) curve analysis for BWT as a predictor of incontinence yielded an aArea Under the Curve (AUC) of 0.19, indicating poor predictive validity. Conclusions: In this cohort, static anatomical measurements derived from MRI, including BWT, do not appear to be reliable markers for incontinence. Our findings suggest that the pathophysiology of this disorder is likely more dependent on functional or dynamic factors rather than simple static anatomical variations. Future research should focus on standardizing dynamic imaging parameters to better assess pelvic floor function.

1. Introduction

Pelvic floor disorders (PFDs) affect a significant number of women throughout the world, causing varying degrees of impairment and interfering with their overall quality of life. Some of the most common PFDs include urinary incontinence (UI), stress urinary incontinence (SUI), overactive bladder syndrome (OAB), pelvic organ prolapse (POP), and anal incontinence (AI), representing a significant health issue that affects 25 to 30% of adult females [1]. The lifetime prevalence risk for women over the age of 50 is estimated to increase by 46% by 2050 [1,2,3]. It also contributes significantly to healthcare expenditures in the United States, costing an estimated USD 300 million between 2005 and 2006. The National Institute of Child Health and Human Development (NICHD) has projected a significant increase in the number of women undergoing surgery to correct PFDs, to rise by 47% from about 210,000 in 2010 to 310,000 by 2050 [4].
The need for more detailed anatomy grows with interest in designing and using new modalities for treatments targeting bladder innervation. Clinical examinations, signs, and symptoms alone are insufficient to diagnose pelvic floor disorders, contrary to conventional practice. This method is believed to result in under or inaccurate diagnosis in 45 to 90% of cases leading to surgical approaches in 30% [5]. However, doctors and researchers still disagree on the best methods for imaging tests, radiologic guidelines, and differences in the pelvic organs of those with PFD [6].
Transvaginal ultrasonography is typically used to evaluate the lower genito-urinary tract. Artifacts prevent the differentiation of critical pelvic structures, such as the morphological layers of the urethra, using conventional ultrasound techniques. In addition, ultrasonography is of limited diagnostic use in assessing OAB, including BWT in cases of detrusor overactivity. However, it remains the gold standard for examining pelvic organs [7].
MRI can identify the abnormalities of different vaginal levels of support, as described by DeLancy et al. [8]. A 15 min pelvic MRI in a female patient with POP during rest and straining can identify multi-compartment anatomical disorders and be a valuable tool for complex pre-operative planning. However, it cannot identify lower urinary tract dysfunction, requiring more invasive testing like urodynamics.
Beyond functional disorders, Magnetic Resonance Imaging (MRI) is a cornerstone in the evaluation of various gynecologic pathologies due to its superior soft-tissue contrast. Its high diagnostic accuracy is particularly valuable in complex cases, such as differentiating and staging uterine malignancies. For instance, a recent study on uterine sarcoma demonstrated that MRI has a high sensitivity (87.5%) for diagnosis, comparable to expert-level ultrasound, and plays a crucial role in surgical decision-making [9]. While its utility in oncologic gynecology is well-established, its application to functional disorders like PFDs is still evolving.
Recently, there has been more interest in targeted therapy for OAB. There is a need to define the precisely targeted area better. Most bladder nerve supply is located at the sub-trigonal area and the proximal urethra [10].
Clinical evaluations and MR usage were compared with surgical outcomes in one research study. Comparable diagnosis rates were seen for disorders of the anterior and posterior compartments, at 82.5% and 80%, respectively. The most significant discordance was reported in the middle compartment, where only 65 percent of MRI data matched [11]. El Sayed et al. did a thorough critical literature review of pelvic floor MRI techniques recommended by the European Society of Urogenital Radiology (ESUR) and the European Society of Gastrointestinal and Abdominal Radiology (ESGAR) [12]. Using standardized reference lines to evaluate pelvic dysfunction remains one of the most significant obstacles in imaging and accurate diagnoses, the researcher stated. Nevertheless, according to a second extensive survey, only about half of all doctors know the most recent radiology recommendations, resulting in a wide variety of clinical practices [13].
In addition to adhering to standardized imaging modalities and reference lines, it is crucial to recognize anomalies in the female pelvis that contribute to OAB and other dysfunctions. Kupec et al. discovered a substantial difference in urethral length (UL) between those with SUI and OAB and those with neither condition. Individuals with OAB had considerably longer urethral measures [14,15]. In contrast, the urethral length (UL) measures of patients with pelvic dysfunction are much shorter in several other investigations. In contrast, other studies showed no changes in UL [16].
Further research has confirmed the relationship between UL and incontinence. Anatomical UL is associated with urodynamic parameters associated with SUI and is correlated with functional UL, the length of the continence zone, the length of the continence zone/functional UL ratio, the Valsalva and cough leak point pressures, and maximal urethral closure pressure [17]. This suggests that patients with short UL are more likely to develop stress incontinence, which is related to overall UL.
Vaginal wall thickness (VWT) and prolapse could diagnose an OAB or assess the risk of developing this disorder. It is essential to recognize that our knowledge of the link between VWT and POP/OAB is incomplete, and other factors like muscle tone and neurological function could play a role.
Certain anatomical variations, such as UL and VWT, have been associated with conditions frequently seen in the OAB population, such as urinary incontinence and prolapse of pelvic organs. MRI may offer more accurate and standardized approaches to pelvic floor disorders. This study aims to quantify static pelvic anatomical parameters on MRI in women with and without pelvic floor disorders to identify potential imaging biomarkers of dysfunction.

2. Materials and Methods

Following institutional review board (IRB) approval, we retrospectively reviewed 250 de-identified medical records and imaging reports of women who visited the University of California, Irvine Medical Center between January 2018 and December 2022. Patients underwent a magnetic resonance imaging (MRI) evaluation of their pelvis. Records were excluded if the patient was male, under the age of 18, had a history of pelvic surgery other than hysterectomy, had a history of cancer in their pelvic region, or had pelvic measurements achieved through any other imaging modality. Records were excluded if the patient was male, under the age of 18, had a history of pelvic surgery other than hysterectomy, had a history of cancer in their pelvic region, or had pelvic measurements achieved using any other imaging modality other than MRI.
The pelvic organ measurements were recorded by radiology technicians and read by board-certified radiologists. All pelvic organ measurements were recorded by radiology technicians and subsequently reviewed and finalized by a single, board-certified radiologist to ensure consistency across all measurements. In accordance with standard clinical practice for pelvic MRI, all scans were performed using standard pelvic phased-array coils with the patient in the supine position at rest, and measurements were derived from T2-weighted images. For instance, anterior vaginal wall thickness (AVWT) and urethral length (UL) were measured on mid-sagittal images, with AVWT defined as the thickness at the midpoint of the anterior vaginal wall from the internal vaginal mucosa to the external bladder wall interface. Other measurements were taken on axial or coronal planes; vaginal wall to bladder urothelium (VWBU) was defined as the shortest distance separating the vaginal epithelium and the bladder urothelium in the trigonal area, while distances involving the inter-ureteral mounds were measured by identifying the peaks of the ureteric ridges at the bladder base as primary landmarks. While these standard measurement protocols were followed, specific technical details such as scanner field strength (e.g., 1.5T, 3T) and exact sequence parameters were not consistently available in the de-identified clinical reports used for this retrospective analysis. Data recorded included anterior vaginal wall thickness, vaginal epithelium to bladder urothelium, BWT, urethral length to distal end of external urinary sphincter, urethral length, inter-ureteral mounds, inter-ureteral mounds to neck, and urethral width, expressed in millimeters (mm). Patient demographic information was collected, including age, race, and body mass index (BMI). Clinical diagnoses were obtained from the electronic medical record, based on International Classification of Diseases (ICD-10) codes and specialist documentation from the time of imaging. Diagnoses pertaining to the reproductive organs and urinary tract were noted, including hysterectomy, prolapse of any pelvic organs, general incontinence, stress incontinence, urge incontinence, and mixed incontinence.
Initial descriptive statistics were generated using IBM SPSS Statistics, version 26.0. The subsequent re-analysis, including multiple comparison corrections and ROC analysis, was performed using Python (version 3.9) with the pandas, statsmodels, and scikit-learn libraries. Correlation analyses were used to analyze the relationships between continuous variables. To control for the Type I error rate across the 84 statistical comparisons performed, Bonferroni correction was applied. A p-value of less than 0.0006 (0.05/84) was considered statistically significant. To evaluate the clinical utility of BWT as a predictive marker for incontinence, a Receiver Operating Characteristic (ROC) curve analysis was performed. The Area Under the Curve (AUC) was calculated to assess the model’s discriminatory power. Cases that had measurements outside of the acceptable range of values were excluded from the analysis as potential outliers (Supplementary Table S1). All analyses were calculated with a 95 percent confidence interval and considered statistically significant with a p-value < 0.05.

3. Results

Spearman’s correlation analysis was performed to assess the relationships between all anatomical measurements (Table 1). After applying Bonferroni correction across all 84 statistical tests performed in this study, two correlations remained statistically significant. A strong, positive correlation was found between anterior vaginal wall thickness (AVWT) and vaginal wall to bladder urothelium (VWBU) (rs = 0.542, uncorrected p < 0.001). There was also a weak to moderate positive correlation between inter-ureteral mounds and inter-ureteral mounds to neck (rs = 0.358, uncorrected p < 0.001). Other previously reported correlations were not statistically significant after this rigorous correction. For example, the weak positive trend between VWBU and bladder wall thickness (BWT) was not significant (rs = 0.233, uncorrected p = 0.001).

3.1. Incontinence

On initial analysis, bladder walls appeared thinner for those with incontinence (2.3 ± 0.5 mm) compared to those without (3.2 ± 0.9 mm), with an uncorrected p-value of 0.041 (Figure 1). However, after applying Bonferroni correction for multiple comparisons, this difference was not statistically significant. No other anatomical measurements showed a significant association with a diagnosis of incontinence. The descriptive statistics for all measurements stratified by diagnosis are presented in Table 2. To further evaluate the clinical utility of BWT as a potential diagnostic marker, a Receiver Operating Characteristic (ROC) curve analysis was performed (Figure 2). The analysis resulted in an Area Under the Curve (AUC) of 0.19, indicating that BWT has poor predictive validity for incontinence in this patient cohort.

3.2. Age and Race

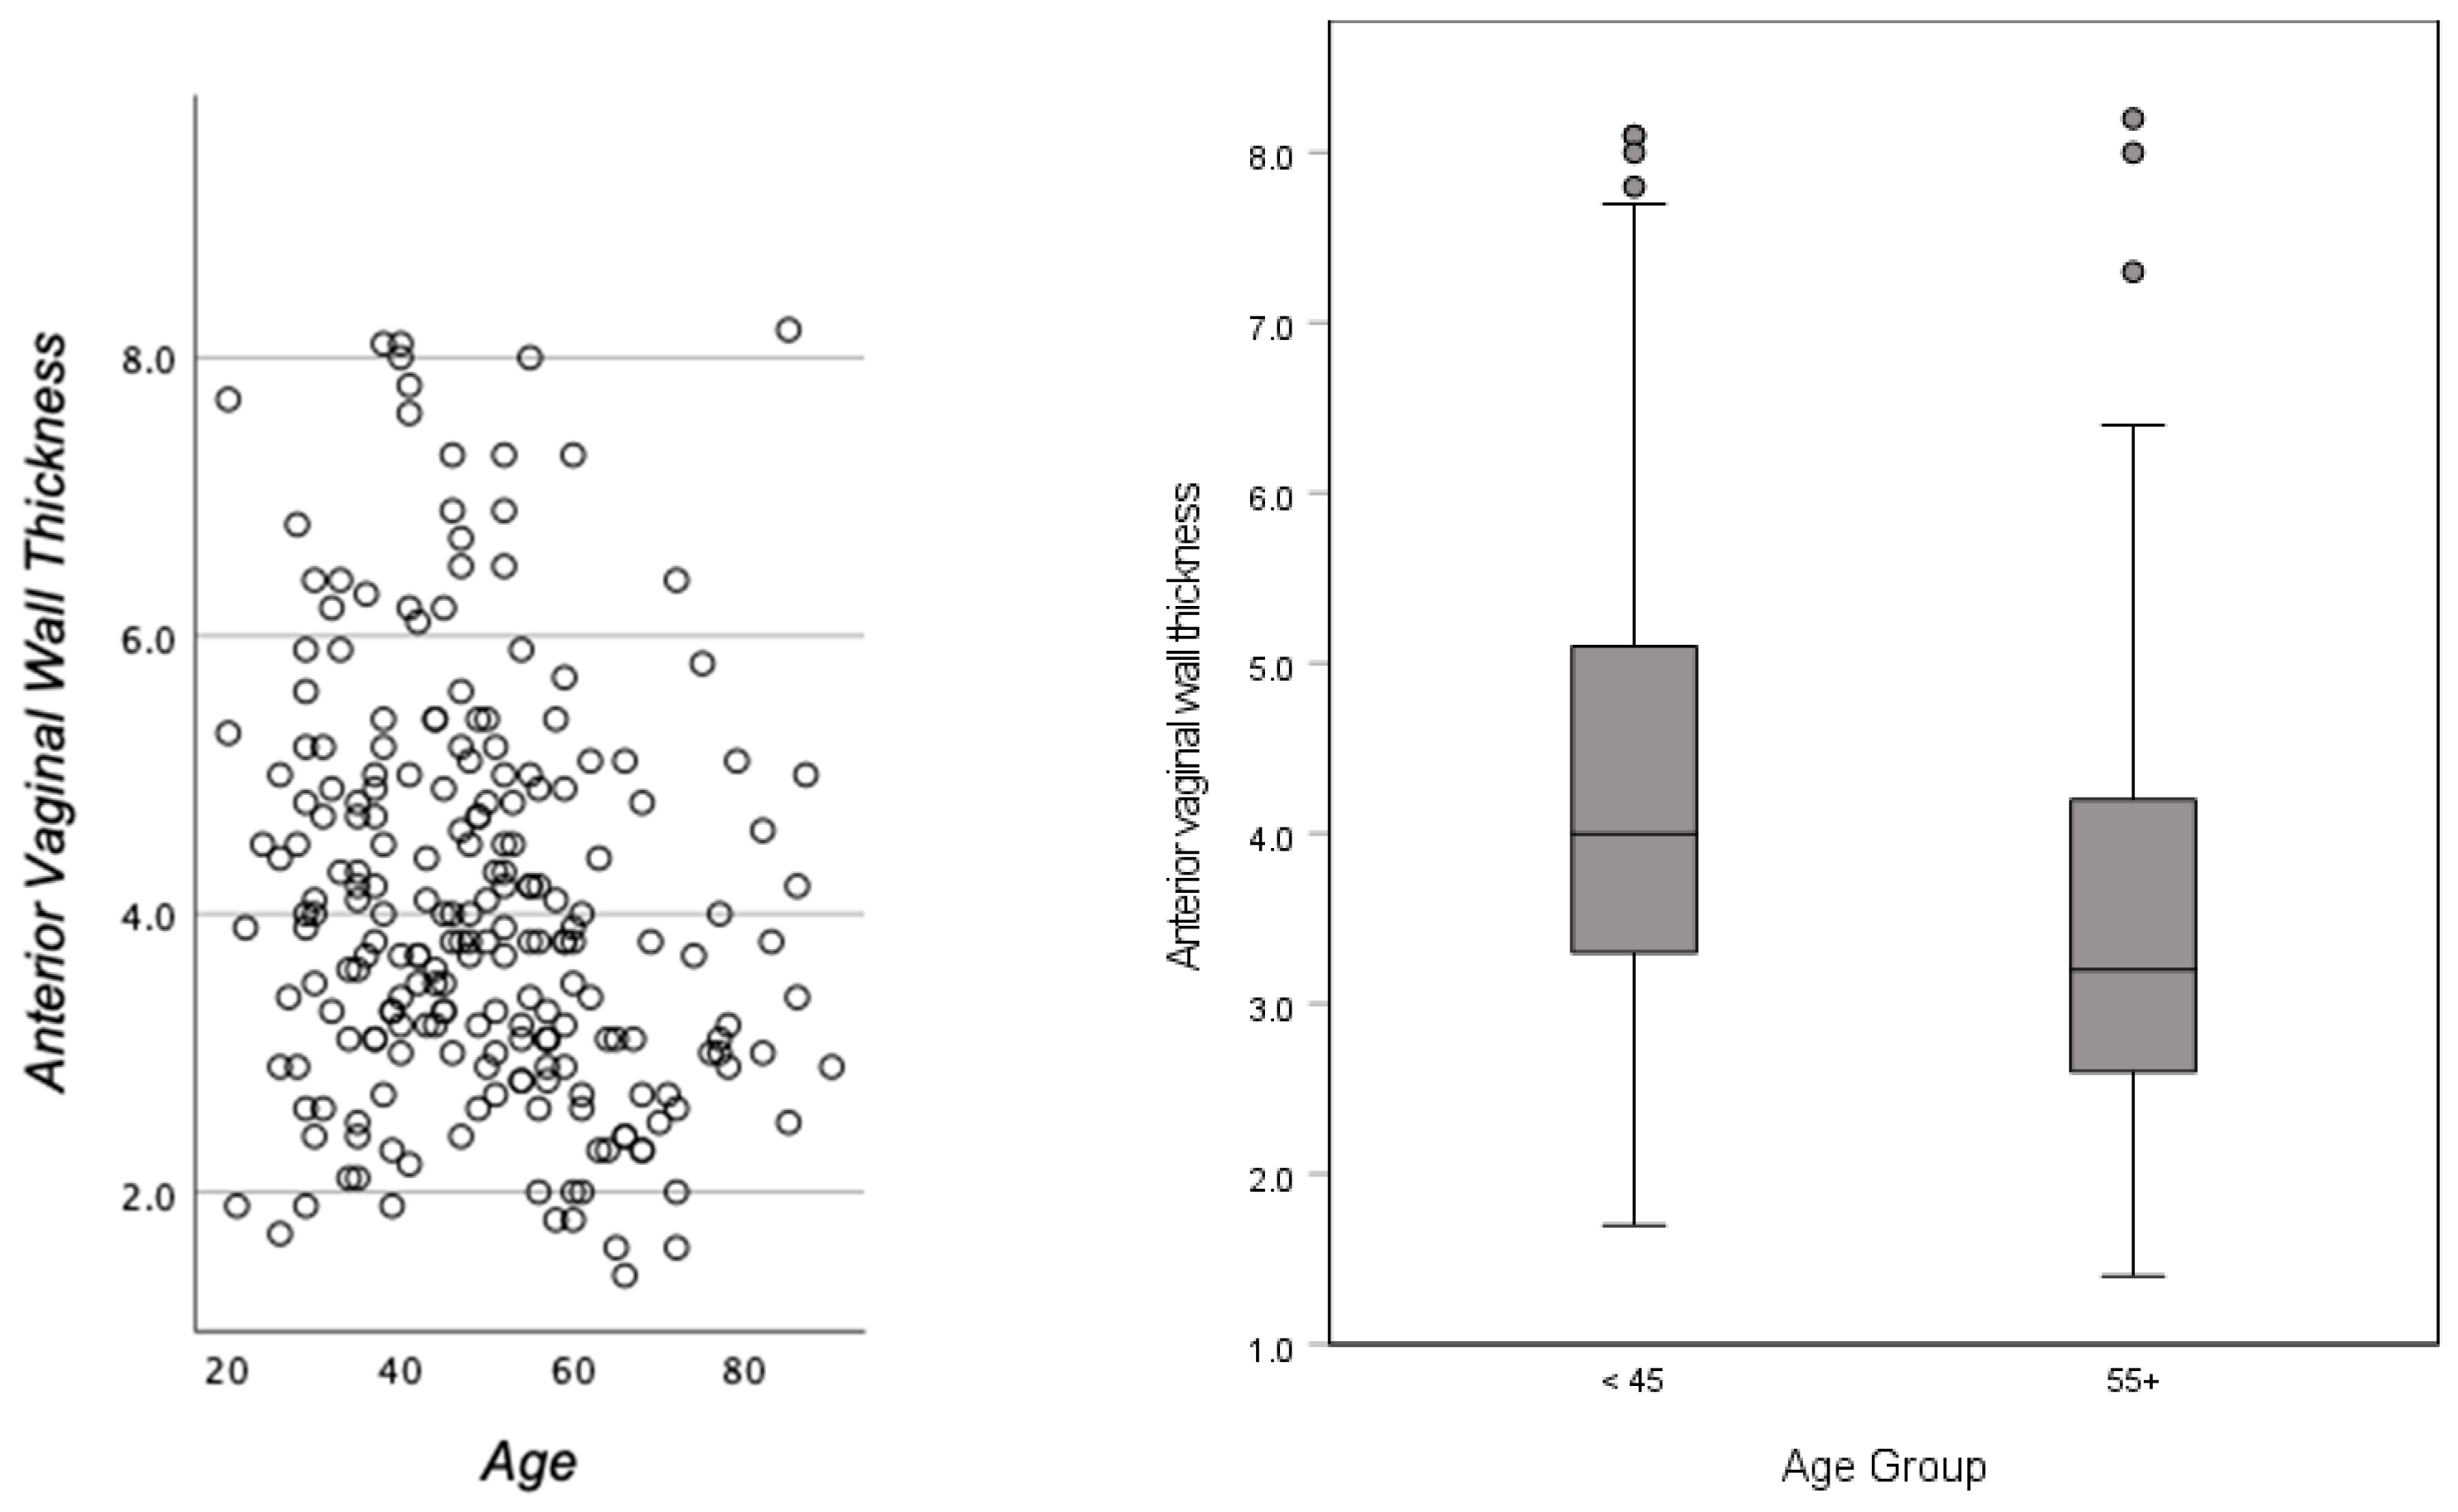
The relationships between anatomical measurements and patient demographics were also explored (Table 3). A trend was observed where anterior vaginal wall thickness (AVWT) appeared to decrease with age (Figure 3). For instance, the mean AVWT was greater in those <45 years of age (4.3 ± 1.5 mm) compared to those >65 years (3.6 ± 1.4 mm). However, this difference was not statistically significant after Bonferroni correction (uncorrected p = 0.002). Similarly, a trend was observed in urethral length to sphincter across different racial groups, but this difference was also not statistically significant after Bonferroni correction (uncorrected p = 0.016). As detailed in Table 3, no other comparisons between anatomical measurements and demographic characteristics yielded statistically significant results.

4. Discussion

This study quantified a large sample of pelvic measurements within a normal range, including AVWT, vaginal wall to bladder urothelium, BWT, urethral length to sphincter, UL, inter-ureteral mounds, inter-ureteral mounds to neck, and urethral width; compared measurements; and sought to find relationships between those measurements and common pelvic disorders. The strong positive correlation between AVWT and VWBU aligns with Hsu et al.’s findings [18] who demonstrated that vaginal thickness significantly contributes to pelvic support and overall continence mechanisms [18]. After applying Bonferroni correction across all 84 statistical tests performed in this study, this was one of only two correlations that remained statistically significant.
On initial analysis, bladder walls appeared thinner for those with incontinence compared to those without; however, this difference was not statistically significant after applying Bonferroni correction. To further evaluate the clinical utility of BWT as a potential diagnostic marker, a Receiver Operating Characteristic (ROC) curve analysis was performed. The analysis resulted in an Area Under the Curve (AUC) of 0.19, indicating that BWT has poor predictive validity for incontinence in this patient cohort. Our analysis found that no anatomical measurements were significantly associated with any pelvic disorders or demographic factors after rigorous statistical correction. Measurements were not associated with any other pelvic disorders. There were no significant differences in UL, urethral width, inter-ureteral mounds, or inter-ureteral mounds to neck measurements by patient age, BMI, race, hysterectomy, prolapse, or any form of incontinence.
No differences in UL, VWT, or AVWT found among women with pelvic dysfunction, with and without PFDs challenges previous findings by Mothes et al., who reported shorter UL as a predictor of stress urinary incontinence [17]. This discrepancy highlights the critical importance of correcting for multiple comparisons in studies with many variables, as it is possible that some previously reported associations in the literature may not hold up to this level of statistical rigor.
Similarly, while trends were observed, there were no strong statistically significant differences in most measurements per demographic characteristics of the participants. This conflicts with the findings of Da Silva Lara et al., who noted age-related changes in vaginal anatomy that might predispose older women to pelvic dysfunction [19]. The lack of a strong, statistically significant anatomical change with age in our data may help explain why we did not find a clear link to a functional disorder like incontinence, suggesting that the relationship between anatomical aging and functional decline is not simple or linear. Ultimately, the primary contribution of our study is its robust negative finding. The lack of any significant association between 8 different anatomical measurements and incontinence after rigorous statistical correction, combined with the definitive ROC analysis showing BWT has no predictive value (AUC = 0.19), provides strong evidence against the utility of simple, static anatomical markers for this functional disorder. This suggests that the clinical and research focus should perhaps shift away from identifying a single anatomical measurement on resting MRI and towards methods that can assess dynamic pelvic floor function, neuromuscular integrity, or tissue properties. Racial differences observed in UL to sphincter measurements highlight an area for further investigation, particularly in understanding the genetic factors that might contribute to these disparities.
Our findings further support the integration of MRI into routine clinical practice for its non-invasive nature and ability to provide detailed anatomical information. Yet, limitations in standardizing MRI interpretation, as highlighted by El Sayed et al., remain a barrier to widespread adoption [12].
This study quantified a large sample of pelvic measurements within a normal range including AVWT, vaginal wall to bladder urothelium, BWT, urethral length to sphincter, UL, inter-ureteral mounds, inter-ureteral mounds to neck, and urethral width, compared measurements and sought to find relationships between those measurements and common pelvic disorders. Decreasing AVWT was associated with decreasing vaginal wall to bladder urothelium and UL measurements. Decreasing vaginal wall to bladder urothelium measurements were also associated with decreasing BWT. The strong positive correlation between AVWT and VWBU aligns with findings by Hsu et al., [18] who demonstrated that vaginal thickness significantly contributes to pelvic support and overall continence mechanisms [18].
BWT was the only pelvic morphological measurement associated with incontinence. BWT was thinner among participants with incontinence compared to those without, aligning with studies that emphasized the diagnostic role of bladder wall abnormalities in detecting detrusor overactivity [20].
Measurements were not associated with any other pelvic disorders. AVWT, however, declined with age while UL to sphincter measurements significantly varied by race with Caucasian women having the smallest UL to sphincter measurements than other races. There were no significant differences in UL, urethral width, inter-ureteral mounds, or inter-ureteral mounds to neck measurements by patient age, BMI, race, hysterectomy, prolapse, incontinence, stress incontinence, urge incontinence, mixed incontinence, or fibroid diagnoses.
No differences in UL, VWT, or AVWT found among women with pelvic dysfunction, with and without PFDs challenges previous findings by Mothes et al., who reported shorter UL as a predictor of stress urinary incontinence [17]. However, AVWT was found to be related to vaginal wall to bladder urothelium measurements, which were associated with BWT measurements in the study population. While shorter UL and increasing VWT has been associated with SUI, this study could only confirm its association with BWT.
Additionally, even though differences in AVWT, vaginal wall to bladder, and UL to sphincter measurements varied per age and race, there were no strong differences in most measurements per demographic characteristics of the participants. This conflicts with the findings of Da Silva Lara et al., who noted age-related changes in vaginal anatomy that might predispose older women to pelvic dysfunction [19]. Racial differences observed in UL to sphincter measurements highlight an area for further investigation, particularly in understanding the genetic factors that might contribute to these disparities.
Our results further underline the need for standardized imaging protocols and reference lines in pelvic diagnostics. The discordance between the findings of this study and prior research, particularly regarding UL and AVWT, suggests that inter-observer variability and differences in imaging techniques may significantly impact outcomes. Future studies should focus on multi-center collaborations to validate these findings and explore longitudinal changes in pelvic measurements.
Moreover, this study raises important questions about the clinical thresholds for anatomical measurements that predict the progression of PFDs. Establishing such thresholds could guide early interventions and improve patient outcomes. The utility of BWT as a diagnostic marker for incontinence warrants further exploration in larger cohorts with diverse demographics.

Limitations

The retrospective nature and single-center design of this study limit its generalizability. In addition, propensity score analyses were not performed to balance potential confounders between groups, which should be considered in future investigations. Furthermore, this study could not confirm the differences in AVWT in menopause patients with prolapse [19]. While the initial measurements were performed by various technicians, several quality control measures were in place. All technicians were trained on a standardized measurement protocol, and their work was periodically verified through random sample reviews by expert MRI radiologists. To ensure final consistency across the entire dataset, all measurements were then reviewed and finalized by a single, board-certified radiologist. Despite these measures, a formal analysis of inter-rater reliability, such as the Intraclass Correlation Coefficient (ICC), was not performed. Our analysis showed that the data were not Missing Completely at Random (MCAR); for instance, the missingness of certain measurements was significantly related to patient age (p = 0.016) and BMI (p = 0.035). Addressing these limitations in future research is crucial to refining diagnostic and therapeutic approaches for PFDs.

5. Conclusions

The primary aim of this research was to evaluate the precise anatomical relationships in the pelvic region and detect variations in measurements in different conditions to aid with the development of ways to improve targeted therapies. However, our robust analysis found no significant association between static MRI-derived anatomical measurements and incontinence in our cohort. The poor predictive validity of BWT, as demonstrated by our ROC analysis, suggests that static anatomy alone is insufficient for diagnosing this functional disorder. Future research should focus on dynamic imaging or neuromuscular assessments to better understand the pathophysiology of PFDs.

Supplementary Materials

The following supporting information can be downloaded at: https://www.mdpi.com/article/10.3390/uro5030018/s1, Table S1: Study range of anatomical measurement values considered to be within a normal range.

Author Contributions

Conceptualization, G.G., B.F., M.A.M.H. and A.A.; methodology, W.P., N.J., M.L.C. and D.C.; software, W.P., D.C., M.H. and S.L.; validation, G.G., W.P., N.J. and M.A.M.H.; formal analysis, M.L.C., B.F. and D.S.; investigation, N.J., M.A.M.H., D.S. and M.H.; resources, G.G., A.A. and S.L.; data curation, W.P., D.C. and M.L.C.; writing—original draft preparation, M.A.M.H., W.P. and N.J.; writing—review and editing, G.G., B.F., M.H. and S.L.; visualization, M.L.C., D.C. and D.S.; supervision, G.G., A.A. and M.A.M.H.; project administration, G.G., B.F. and D.S. All authors have read and agreed to the published version of the manuscript.

Funding

This research received no external funding.

Institutional Review Board Statement

The study was conducted in accordance with the Declaration of Helsinki and approved by the University of California, Irvine Institutional Review Board—IRB for human studies titled Advanced Abdominal Imaging Inter-reader reliability and Accuracy Improvement Project 20184714 with approval on 4 March 2019, renewed on 10 January 2025.

Informed Consent Statement

Informed consent was obtained from all subjects involved in the study.

Data Availability Statement

Data are available upon request from the corresponding author.

Conflicts of Interest

The authors declare no conflicts of interest.

Abbreviations

The following abbreviations are used in this manuscript:
AVWTANTERIOR VAGINAL WALL THICKNESS
BWTBladder Wall Thickness
VWBUVaginal Epithelium to Bladder Urothelium
ULUrethral Length
MRIMagnetic Resonance Imaging
PFDPelvic Floor Disorder
UIUrinary Incontinence
SUIStress Urinary Incontinence
OABOveractive Bladder
POPPelvic Organ Prolapse
AIAnal Incontinence
ESUREuropean Society of Urogenital Radiology
ESGAREuropean Society of Gastrointestinal and Abdominal Radiology
NICHDNational Institute of Child Health and Human Development
IRBInstitutional Review Board
BMIBody Mass Index
SDStandard Deviation
CIConfidence Interval
MMMillimeter

References

  1. Hsu, Y.; Chen, L.; Delancey, J.O.L.; Ashton-Miller, J.A. Vaginal Thickness, Cross-Sectional Area, and Perimeter in Women With and Those Without Prolapse. Obstet. Gynecol. 2005, 105, 1012–1017. [Google Scholar] [CrossRef] [PubMed]
  2. Panayi, D.C.; Khullar, V.; Fernando, R.; Digesu, G.A.; Tekkis, P. Vaginal wall thickness is related to the degree of vaginal prolapse. Ultrasound Obstet. Gynecol. 2009, 34, 58–59. [Google Scholar] [CrossRef]
  3. Bray, R.; Derpapas, A.; Fernando, R.; Khullar, V.; Panayi, D.C. Does the vaginal wall become thinner as prolapse grade increases? Int. Urogynecol. J. 2017, 28, 397–402. [Google Scholar] [CrossRef] [PubMed]
  4. Wu, J.M.; Kawasaki, A.; Hundley, A.F.; Dieter, A.A.; Myers, E.R.; Sung, V.W. Predicting the number of women who will undergo incontinence and prolapse surgery, 2010 to 2050. Am. J. Obstet. Gynecol. 2011, 205, 230.e1–230.e5. [Google Scholar] [CrossRef] [PubMed]
  5. Olsen, A.; Smith, V.; Bergstrom, J.; Colling, J.; Clark, A. Epidemiology of surgically managed pelvic organ prolapse and urinary incontinence. Obstet. Gynecol. 1997, 89, 501–506. [Google Scholar] [CrossRef] [PubMed]
  6. Ghoniem, G.M.; Shoukry, M.S.; Yang, A.; Mostwin, J. Imaging for urogynecology, including new modalities. Int. Urogynecol. J. 1992, 3, 212–221. [Google Scholar] [CrossRef]
  7. Rachaneni, S.; McCooty, S.; Middleton, L.J.; Parker, V.L.; Daniels, J.P.; Coomarasamy, A.; Verghese, T.S.; Balogun, M.; Goranitis, I.; Barton, P.; et al. Bladder ultrasound for diagnosing detrusor overactivity: Test accuracy study and economic evaluation. Health Technol. Assess. 2016, 20, 1–150. [Google Scholar] [CrossRef] [PubMed]
  8. DeLancey, J.O.L. What’s new in the functional anatomy of pelvic organ prolapse? Curr. Opin. Obstet. Gynecol. 2016, 28, 420–429. [Google Scholar] [CrossRef] [PubMed]
  9. Nguyen, X.L.; Huynh, Q.H.; Nguyen, P.N. Assessing the Clinical Characteristics and the Role of Imaging Modalities in Uterine Sarcoma: A Single-Center Retrospective Study From Vietnam. J. Clin. Ultrasound 2025. Epub ahead of print. [Google Scholar] [CrossRef] [PubMed]
  10. Spradling, K.; Khoyilar, C.; Abedi, G.; Okhunov, Z.; Wikenheiser, J.; Yoon, R.; Huang, J.; Youssef, R.F.; Ghoniem, G.; Landman, J. Redefining the Autonomic Nerve Distribution of the Bladder Using 3-Dimensional Image Reconstruction. J. Urol. 2015, 194, 1661–1667. [Google Scholar] [CrossRef] [PubMed]
  11. Zenebe, C.B.; Chanie, W.F.; Aregawi, A.B.; Andargie, T.M.; Mihret, M.S. The effect of women’s body mass index on pelvic organ prolapse: A systematic review and meta analysis. Reprod. Health 2021, 18, 45. [Google Scholar] [CrossRef] [PubMed]
  12. El Sayed, R.F.; Alt, C.D.; Maccioni, F.; Meissnitzer, M.; Masselli, G.; Manganaro, L.; Vinci, V.; Weishaupt, D. Magnetic resonance imaging of pelvic floor dysfunction—Joint recommendations of the ESUR and ESGAR Pelvic Floor Working Group. Eur. Radiol. 2017, 27, 2067–2085. [Google Scholar] [CrossRef] [PubMed]
  13. Talbott, J.M.V.; Yi, J.; Butterfield, R.J.; Wasson, M. Five Year Prevalence of Pelvic Organ Prolapse After Vaginal Hysterectomy with Prophylactic Apical Support. J. Gynecol. Surg. 2021, 37, 127–131. [Google Scholar] [CrossRef]
  14. Kupec, T.; Pecks, U.; Gräf, C.M.; Stickeler, E.; Meinhold-Heerlein, I.; Najjari, L. Size Does Not Make the Difference: 3D/4D Transperineal Sonographic Measurements of the Female Urethra in the Assessment of Urinary Incontinence Subtypes. Biomed Res. Int. 2016, 2016, 1810352. [Google Scholar] [CrossRef] [PubMed]
  15. Skorupska, K.; Wawrysiuk, S.; Bogusiewicz, M.; Miotła, P.; Winkler, I.; Kwiatkowska, A.; Rechberger, T. Impact of Hysterectomy on Quality of Life, Urinary Incontinence, Sexual Functions and Urethral Length. J. Clin. Med. 2021, 10, 3608. [Google Scholar] [CrossRef] [PubMed]
  16. Fugett, J.; Phillips, L.; Tobin, E.; Whitbrook, E.; Bennett, H.; Shrout, J.; Coad, J.E. Selective bladder denervation for overactive bladder (OAB) syndrome: From concept to healing outcomes using the ovine model. Neurourol. Urodyn. 2018, 37, 2097–2105. [Google Scholar] [CrossRef] [PubMed]
  17. Mothes, A.R.; Mothes, H.K.; Kather, A.; Altendorf-Hofmann, A.; Radosa, M.P.; Radosa, J.C.; Runnebaum, I.B. Inverse correlation between urethral length and continence before and after native tissue pelvic floor reconstruction. Sci. Rep. 2021, 11, 22011. [Google Scholar] [CrossRef] [PubMed]
  18. Hsu, Y.; Summers, A.; Hussain, H.K.; Guire, K.E.; Delancey, J.O.L. Levator plate angle in women with pelvic organ prolapse compared to women with normal support using dynamic MR imaging. Am. J. Obstet. Gynecol. 2006, 194, 1427–1433. [Google Scholar] [CrossRef] [PubMed]
  19. Da Silva Lara, L.A.; Da Silva, A.R.; Rosa-e-Silva, J.C.; Chaud, F.; Silva-de-Sá, M.F.; Meireles E Silva, A.R.; De Sá Rosa-e-Silva, A.C.J. Menopause Leading to Increased Vaginal Wall Thickness in Women with Genital Prolapse: Impact on Sexual Response. J. Sex. Med. 2009, 6, 3097–3110. [Google Scholar] [CrossRef] [PubMed]
  20. Chess-Williams, R.; Sellers, D.J. Pathophysiological Mechanisms Involved in Overactive Bladder/Detrusor Overactivity. Curr. Bladder Dysfunct. Rep. 2023, 18, 79–88. [Google Scholar] [CrossRef]
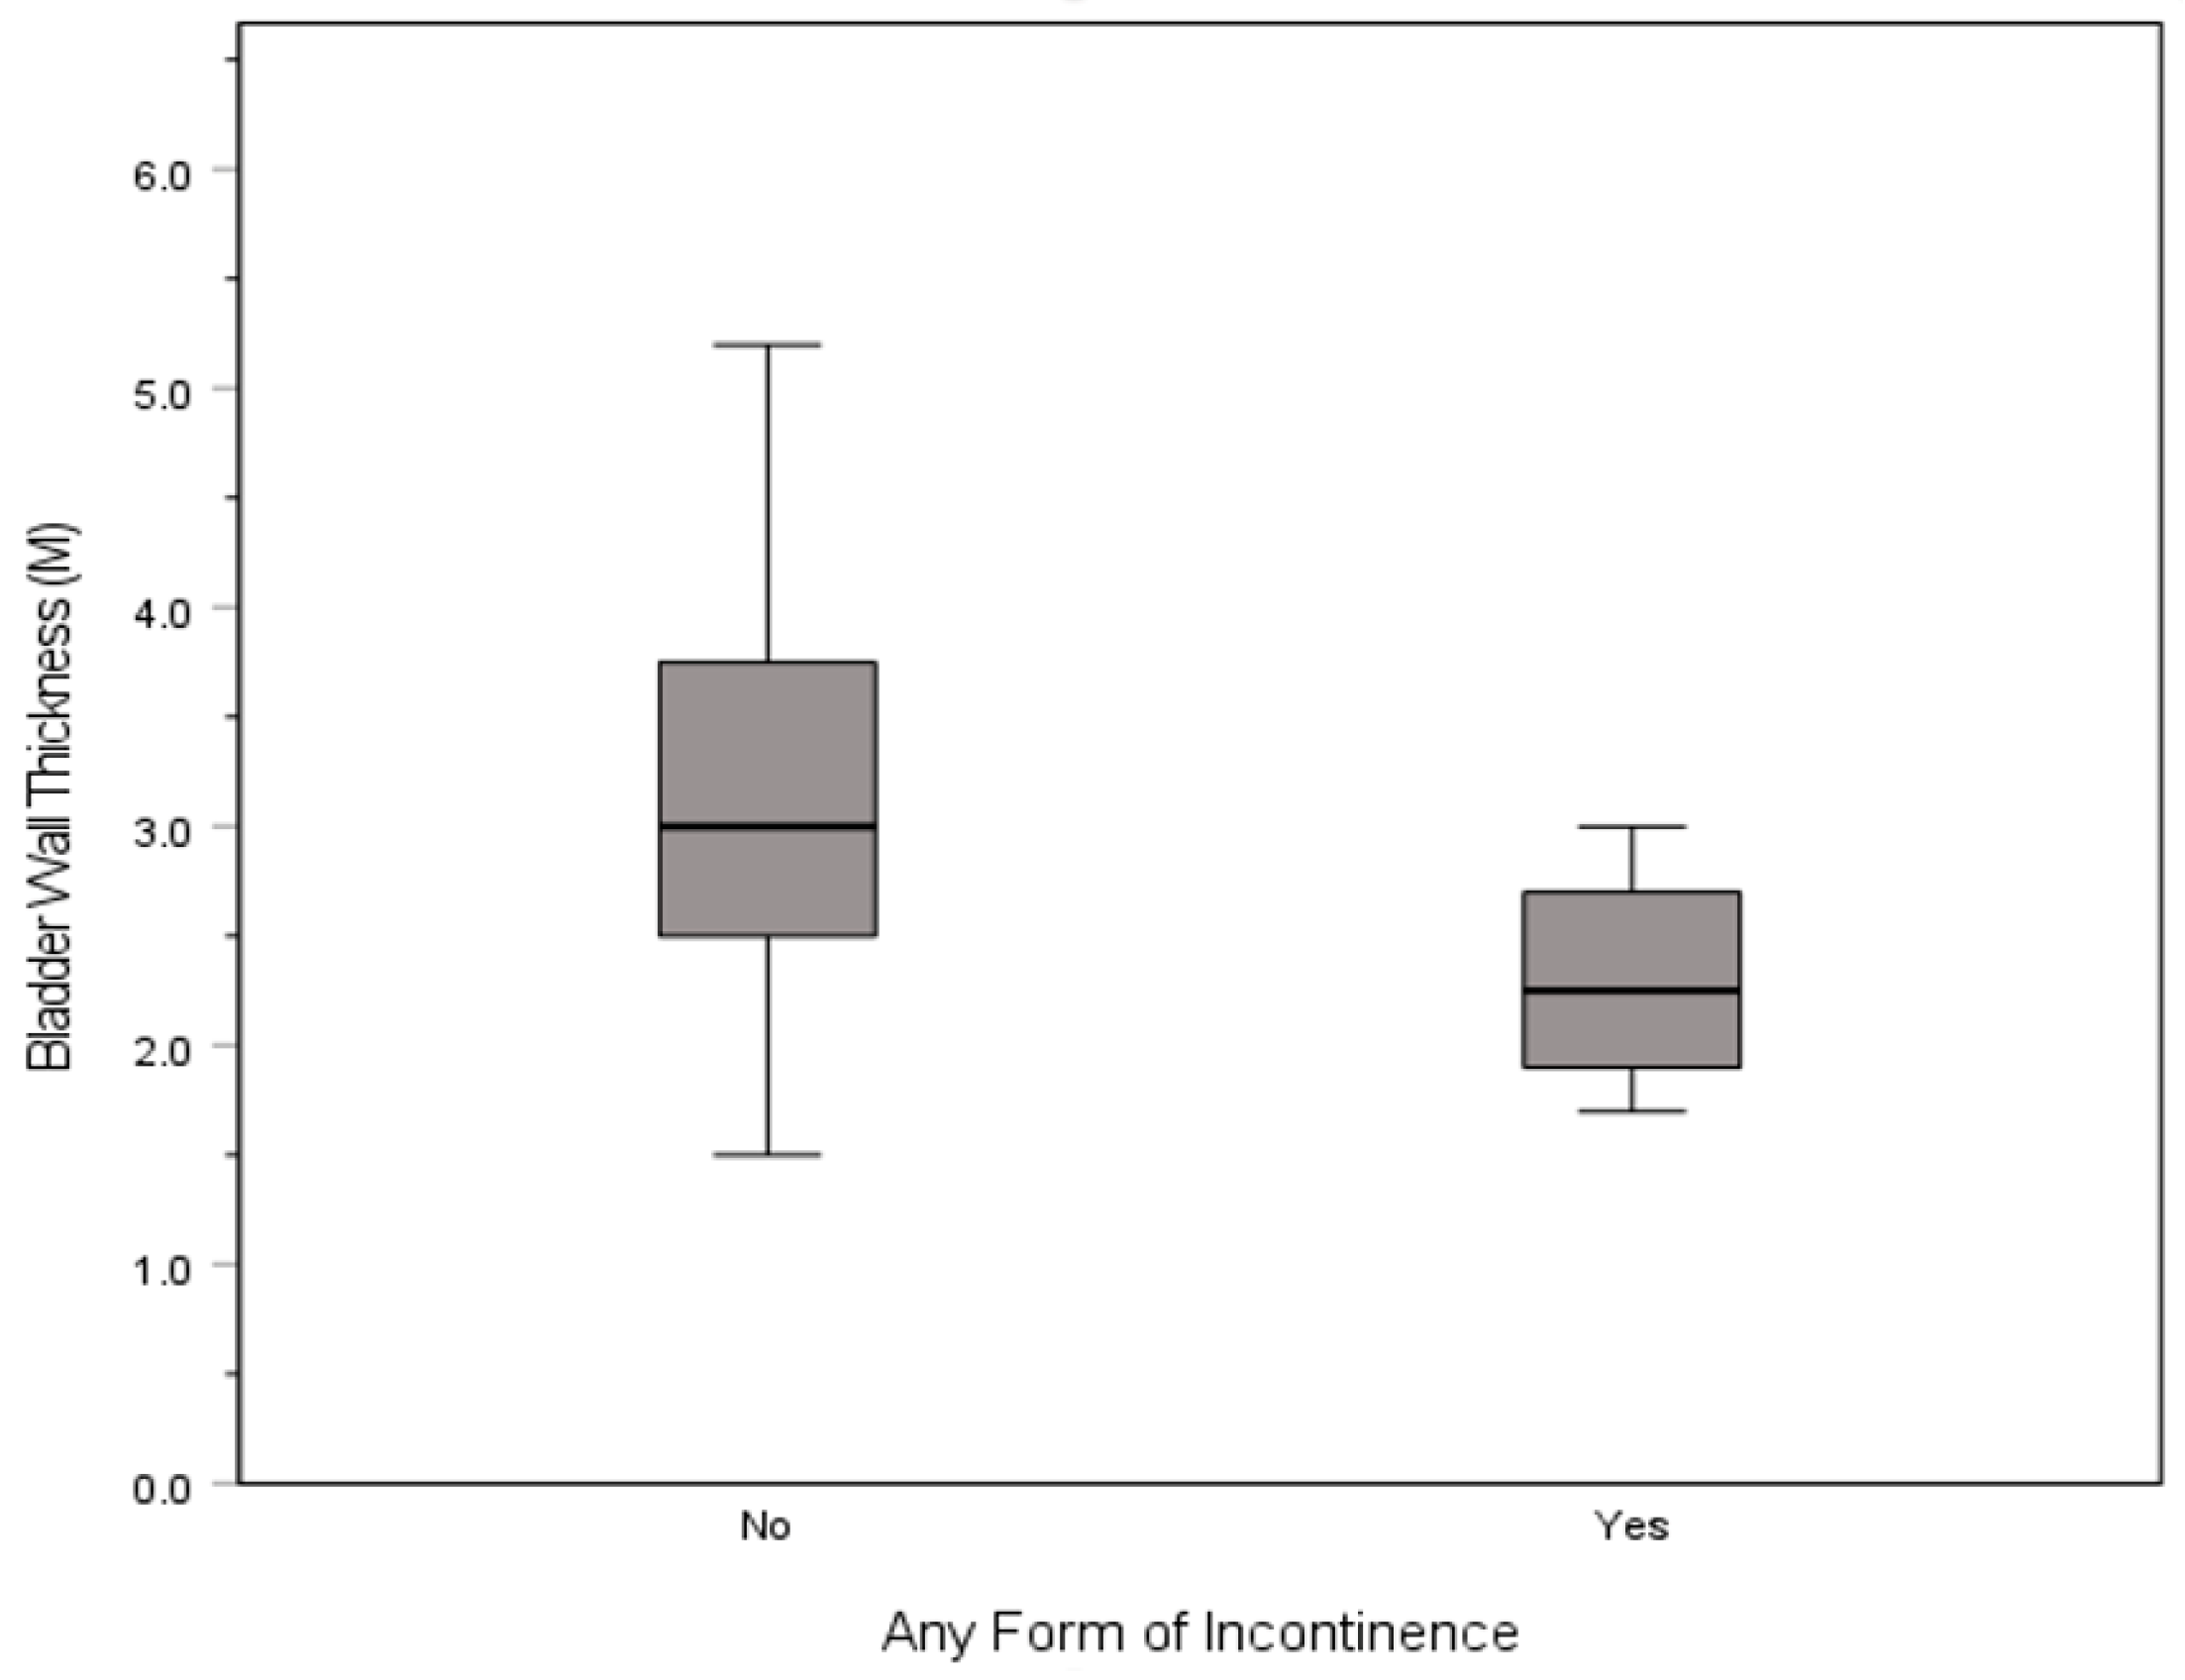
Figure 1. Distribution of bladder wall thickness for participants with and without any form of incontinence.
Uro 05 00018 g001
Figure 2. Receiver operating characteristic (ROC) curve for bladder wall thickness (BWT) predicting urinary incontinence; the solid black line shows the ROC and the gray dashed diagonal indicates chance performance (AUC = 0.19).
Uro 05 00018 g002
Figure 3. Relationship between Anterior Vaginal Wall Thickness (AVWT) and age. The left panel shows a scatter plot of AVWT versus patient age. The right panel shows the distribution of AVWT for different age groups.
Uro 05 00018 g003
Table 1. Spearman’s correlation table. Spearman’s correlation analysis of pelvic anatomical measurements. After applying Bonferroni correction, statistically significant positive correlations were identified between anterior vaginal wall thickness (AVWT) and vaginal wall to bladder urothelium (VWBU) (rs = 0.542), and between inter-ureteral mounds and inter-ureteral mounds to neck (rs = 0.358). No other correlations were statistically significant.
12345678
1. Anterior vaginal wall thickness
2. Vaginal wall to bladder urothelium0.542
3. Urethral length0.1430.078
4. Urethral width0.0790.0640.045
5. Bladder wall thickness0.0850.2330.0730.034
6. Urethral length to sphincter0.2460.2070.214−0.2900.602
7. Ureter mounds0.0670.005−0.1450.039−0.116−0.118
8. Inter-ureteral mounds to neck0.1380.017−0.0850.248−0.046−0.3220.358
Table 2. Pelvic morphological measurements by diagnosis.
Anterior Vaginal Wall ThicknessVaginal Wall to Bladder UrotheliumUrethral LengthUrethral WidthBladder Wall ThicknessUrethral Length to SphincterInter-Ureteral MoundsInter-Ureteral to Neck
Category
Overall CohortM (SD)4.1 (1.5)9.7 (3.5)33.2 (5.9)9.6 (2.8)3.1 (0.8)26.1 (3.6)31.9 (7.5)14.8 (5.9)
N22123117411420412114112
IQR1.94.86.74.01.24.210.79.2
HysterectomyM (SD)4.0 (1.2)9.4 (3.2)34.3 (5.6)9.5 (2.8)3.0 (0.9)26.4 (-)30.8 (7.2)14.9 (5.9)
N444735244113030
IQR1.53.88.33.71.30.09.89.6
ProlapseM (SD)4.6 (1.1)9.7 (3.1)35.4 (5.2)8.1 (4.3)3.1 (0.8)23.8 (1.1)31.0 (6.4)14.9 (3.6)
N910958244
IQR0.94.47.72.91.10.84.03.9
Incontinence, anyM (SD)5.1 (1.6)11.3 (3.7)33.4 (6.2)9.6 (3.3)2.3 (0.5) 31.0 (4.9)14.8 (4.3)
N9111174055
IQR0.95.57.13.80.5 3.01.2
FibroidM (SD)4.2 (1.5)10.0 (3.4)33.2 (6.5)8.9 (3.5)3.0 (0.8)27.1 (4.3)32.8 (8.0)13.9 (5.9)
N737860316773531
IQR1.75.08.05.61.07.111.07.7
Table 3. Pelvic morphological measurements by patient demographic characteristics.
Anterior Vaginal Wall ThicknessVaginal Wall to Bladder UrotheliumUrethral LengthUrethral WidthBladder Wall ThicknessUrethral Length to SphincterInter-Ureteral MoundsInter-Ureteral Mounds to Neck
CategoryStatistic
Overall CohortM (SD)4.1 (1.5)9.7 (3.5)33.2 (5.9)9.6 (2.8)3.1 (0.8)26.1 (3.6)31.9 (7.5)14.8 (5.9)
N22123117411420412114112
IQR1.94.86.74.01.24.210.79.2
Age Group
<45M (SD)4.3 (1.5)10.1 (3.5)33.3 (6.0)10.0 (2.8)3.0 (0.8)23.7 (1.5)31.7 (8.6)13.8 (5.6)
N9510379509054442
IQR1.85.06.24.11.21.611.97.6
>65M (SD)3.6 (1.4)9.0 (3.3)32.3 (6.3)9.2 (2.9)3.2 (0.9)27.5 (3.9)32.2 (7.2)15.7 (6.1)
N788060387144950
IQR1.64.57.03.71.22.410.39.2
BMI Group
<18.5M (SD)3.8 (1.0)8.5 (3.0)32.0 (3.7)9.4 (3.0)3.0 (0.8)27.0 (5.7)33.9 (9.3)13.0 (4.6)
N11108610288
IQR0.45.14.64.41.44.016.84.3
18.5–24.9M (SD)3.9 (1.4)9.4 (3.6)32.6 (6.3)9.4 (2.8)3.0 (0.8)26.6 (4.4)33.6 (7.2)14.1 (5.7)
N909372498464946
IQR1.65.37.23.71.15.910.78.3
25.0–29.9M (SD)4.2 (1.5)9.8 (3.1)34.7 (5.4)9.8 (3.2)3.1 (0.9)24.7 (1.7)30.3 (7.4)15.1 (6.2)
N717253326333232
IQR2.03.87.74.21.21.711.09.8
30+M (SD)4.3 (1.6)10.4 (3.8)33.1 (6.1)9.7 (2.4)3.2 (0.9)25.7 (-)29.9 (7.2)16.5 (6.3)
N475439264512526
IQR1.85.25.23.21.40.09.910.5
Race
AsianM (SD)4.1 (1.2)10.2 (3.6)34.0 (6.8)10.1 (2.4)3.3 (0.8)25.2 (3.5)32.0 (6.5)13.1 (6.2)
N454638214042322
IQR1.94.56.94.31.22.48.09.3
BlackM (SD)5.0 (1.6)11.3 (2.9)37.1 (2.4)7.2 (0.7)2.9 (0.6) 32.2 (10.2)16.2 (4.7)
N1010848023
IQR1.63.92.50.80.7 7.24.2
HispanicM (SD)4.4 (1.8)10.9 (3.8)33.2 (4.8)8.9 (3.3)2.8 (0.7) 30.3 (7.3)14.5 (5.8)
N323927143001617
IQR2.45.75.74.91.1 8.29.1
WhiteM (SD)3.9 (1.4)9.1 (3.2)32.8 (6.2)9.6 (2.8)3.1 (0.9)24.7 (1.9)32.3 (8.4)15.7 (6.1)
N109112856110566058
IQR1.83.76.83.51.32.813.89.1
OtherM (SD)3.8 (1.3)8.8 (3.6)33.2 (5.3)9.9 (2.3)3.5 (0.8)32.0 (1.5)30.1 (4.2)14.1 (6.0)
N15159713266
IQR1.05.27.62.81.21.16.18.5
Disclaimer/Publisher’s Note: The statements, opinions and data contained in all publications are solely those of the individual author(s) and contributor(s) and not of MDPI and/or the editor(s). MDPI and/or the editor(s) disclaim responsibility for any injury to people or property resulting from any ideas, methods, instructions or products referred to in the content.