Article

Evaporation Behavior of Water in Confined Nanochannels Using Molecular Dynamics Simulation

Department of Mechanical and Industrial Engineering, University of New Haven, West Haven, CT 06516, USA
*
Author to whom correspondence should be addressed.
J. Nucl. Eng. 2025, 6(4), 43; https://doi.org/10.3390/jne6040043
Submission received: 14 August 2025 / Revised: 7 October 2025 / Accepted: 15 October 2025 / Published: 23 October 2025

Abstract

This study presents a molecular dynamics (MD) investigation of water evaporation in copper nanochannels, with a focus on accurately modeling copper–water interactions through forcefield calibration. The TIP4P/2005 water model was coupled with the Modified Embedded Atom Method (MEAM) for copper, and the oxygen–copper Lennard–Jones (LJ) parameters were systematically tuned to match experimentally reported water contact angles (WCAs) on Cu (111) surfaces. Contact angles were extracted from simulation trajectories using a robust five-step protocol involving 2D kernel density estimation, adaptive thresholding, circle fitting, and mean squared error (MSE) validation. The optimized forcefield demonstrated strong agreement with experimental WCA values (50.2°–82.3°), enabling predictive control of wetting behavior by varying ε in the range 0.20–0.28 kcal/mol. Using this validated parameterization, we explored nanoscale evaporation in copper channels under varying thermal loads (300–600 K). The results reveal a clear temperature-dependent transition from interfacial-layer evaporation to bulk-phase vaporization, with evaporation onset and rate governed by the interplay between copper–water adhesion and thermal disruption of hydrogen bonding. These findings provide atomistically resolved insights into wetting and evaporation in metallic nanochannels, offering a calibrated framework for simulating phase-change heat transfer in advanced thermal management systems.

Graphical Abstract

1. Introduction

Recent advances in computational modeling and molecular-scale simulations have greatly improved our understanding of heat and mass transfer in modern energy and thermal management systems. These developments have influenced a wide range of fields, including nuclear energy [1,2,3,4,5,6,7,8,9,10,11,12], microelectronics cooling [13,14,15,16,17], aerospace thermal protection [18,19,20,21,22], and advanced manufacturing. In each of these areas, efficient phase-change processes and precise control of interfacial heat transfer are essential for maintaining performance, reliability, and safety. Nanoscale evaporation is particularly important in systems where fluids are confined to extremely small spaces [23,24,25,26,27,28], such as microchannels [17,29,30], thin-film heat pipes, and nanostructured surfaces. At these scales, traditional continuum-based models break down because surface interactions, molecular layering, and non-equilibrium effects dominate physics. Understanding how confinement, temperature, and surface chemistry influence evaporation and condensation requires atomistic insight that only molecular dynamics (MD) simulations can provide [13,28,31,32,33,34,35].
Molecular simulations using detailed water models such as TIP4P/2005 [36,37,38] capture the effects of hydrogen bonding, dipole orientation, and surface affinity, revealing how water behaves differently when restricted to nanometer-scale environments. Under confinement, water forms layered structures near solid walls, and its density, diffusion, and hydrogen-bonding characteristics can deviate significantly from bulk behavior. These effects strongly influence the rate and mechanism of evaporation, making nanoscale modeling crucial for accurate thermal design. While extensive research has been carried out on water interacting with carbon-based materials such as graphene and carbon nanotubes [39,40,41,42,43,44], relatively few studies have examined metal–water interfaces [13,45,46,47,48,49,50] despite their importance in heat exchangers, cooling systems, and electronic components. Copper plays a critical role in these systems because of its high thermal conductivity and widespread industrial use. However, accurate modeling of copper–water interaction remains challenging due to uncertainties in van der Waals interaction parameters, which directly affect predictions of surface wettability and evaporation behavior.
To address this issue, the present study focuses on developing a robust and experimentally validated copper–water interaction model for molecular dynamics simulations. The Lennard–Jones (LJ) parameters governing oxygen–copper interactions are systematically calibrated by adjusting the energy parameter (ε) until the simulated water contact angle (WCA) matches experimental observations for copper surfaces under ambient conditions. This process involves advanced image analysis techniques, including 2D density mapping, interface detection through adaptive thresholding, and geometric fitting to determine the droplet curvature with high precision.
Once validated, the calibrated forcefield is applied to study nanoscale evaporation in a copper channel. The simulation setup includes distinct reservoir, channel, and vapor regions, allowing direct observation of how liquid structure, interfacial behavior, and vapor formation evolve with temperature. Simulations are performed across a wide temperature range (300–600 K) to capture transitions from interfacial-layer evaporation to bulk vaporization.
This two-stage approach—first ensuring accurate interfacial representation through forcefield calibration and then applying it to study nanoconfined evaporation—provides a reliable foundation for understanding phase-change phenomena in metallic systems. The insights gained from this study are broadly relevant to nuclear reactor cooling, microelectronics heat dissipation, thermal management in aerospace systems, and next-generation compact heat exchangers, where efficient nanoscale evaporation is critical for achieving high thermal performance and safety.

2. Copper–Water Interaction Forcefield Estimation

Accurate representation of water–metal interactions is essential for capturing realistic interfacial phenomena in molecular dynamics (MD) simulations. This is particularly critical for processes such as evaporation, wetting, and capillarity in nanoconfined systems, where deviations in the forcefield can significantly alter predicted contact angles, interfacial energies, and phase-change kinetics. In this work, the cross-interactions between the TIP4P/2005 water model and a copper substrate were parameterized by systematically tuning Lennard–Jones (LJ) parameters to reproduce experimentally reported wetting behavior of copper surfaces, especially matching with the water contact angle (WCA) of copper.

2.1. Model Construction

The copper substrate was generated using the open-source tool Atomsk [51], constructing a 10 nm × 10 nm × 1 nm slab with an FCC (111) crystal structure and a lattice constant of 3.615 Å [52,53,54,55,56]. This thickness was sufficient to mimic a semi-infinite solid while minimizing computational cost. The (111) surface was chosen in accordance with prior copper–water wetting studies. The water phase consisted of a pre-equilibrated 5 nm × 5 nm × 5 nm TIP4P/2005 water block. A vertical separation of 0.15 nm was maintained between the water block and copper surface to prevent atomic overlap during initialization [57]. Periodic boundary conditions were applied in the x, y, and z directions, with a simulation box height of 15 nm to avoid spurious interactions between periodic images along z as shown in Figure 1.

2.2. Forcefields and Interactions

Water–water interactions were modeled using the special pair style implementation of TIP4P potential in LAMMPS development version (17 April 2024) [58]. Oxygen–oxygen LJ parameters were set to ε O O = 0.1852  kcal/mol and σ O O = 3.1589   , while hydrogen–hydrogen and oxygen–hydrogen LJ interactions were set to zero, as per the TIP4P/2005 specification. Long-range electrostatics were treated using the PPPM/tip4p solver [37] with an accuracy of 10−4. Bond lengths ( r O H = 0.9572   ) and bond angles ( H O H = 104.52 ° ) within water molecules were constrained using the SHAKE algorithm [59,60] with a tolerance of 10−4, ensuring minimal intramolecular distortion. Copper–copper interactions were described using the Modified Embedded Atom Method (MEAM) potential [61,62,63,64]. Cross-interactions between oxygen and copper were represented by an LJ potential with σ O C u = 3.1 and a variable ε O C u tuned during parameterization, while hydrogen–copper LJ terms were set to zero.

2.3. Simulation Protocol

Initial atomic velocities were assigned from a Maxwell–Boltzmann distribution at 300 K and rescaled to match the target temperature. Separate Nosé–Hoover thermostats (relaxation time 500 fs) were applied to water and copper atoms. To prevent rigid-body drift, atoms in the bottom most layer of the copper slab were restrained using a harmonic spring ( k = 5 k c a l / m o l / 2 ). Each simulation consisted of a 500 ps equilibration run followed by a 500 ps production run, both using a 1 fs timestep. Atomic configurations were saved every 500 steps for post-processing and trajectory analysis.

2.4. Contact Angle Estimation Protocol

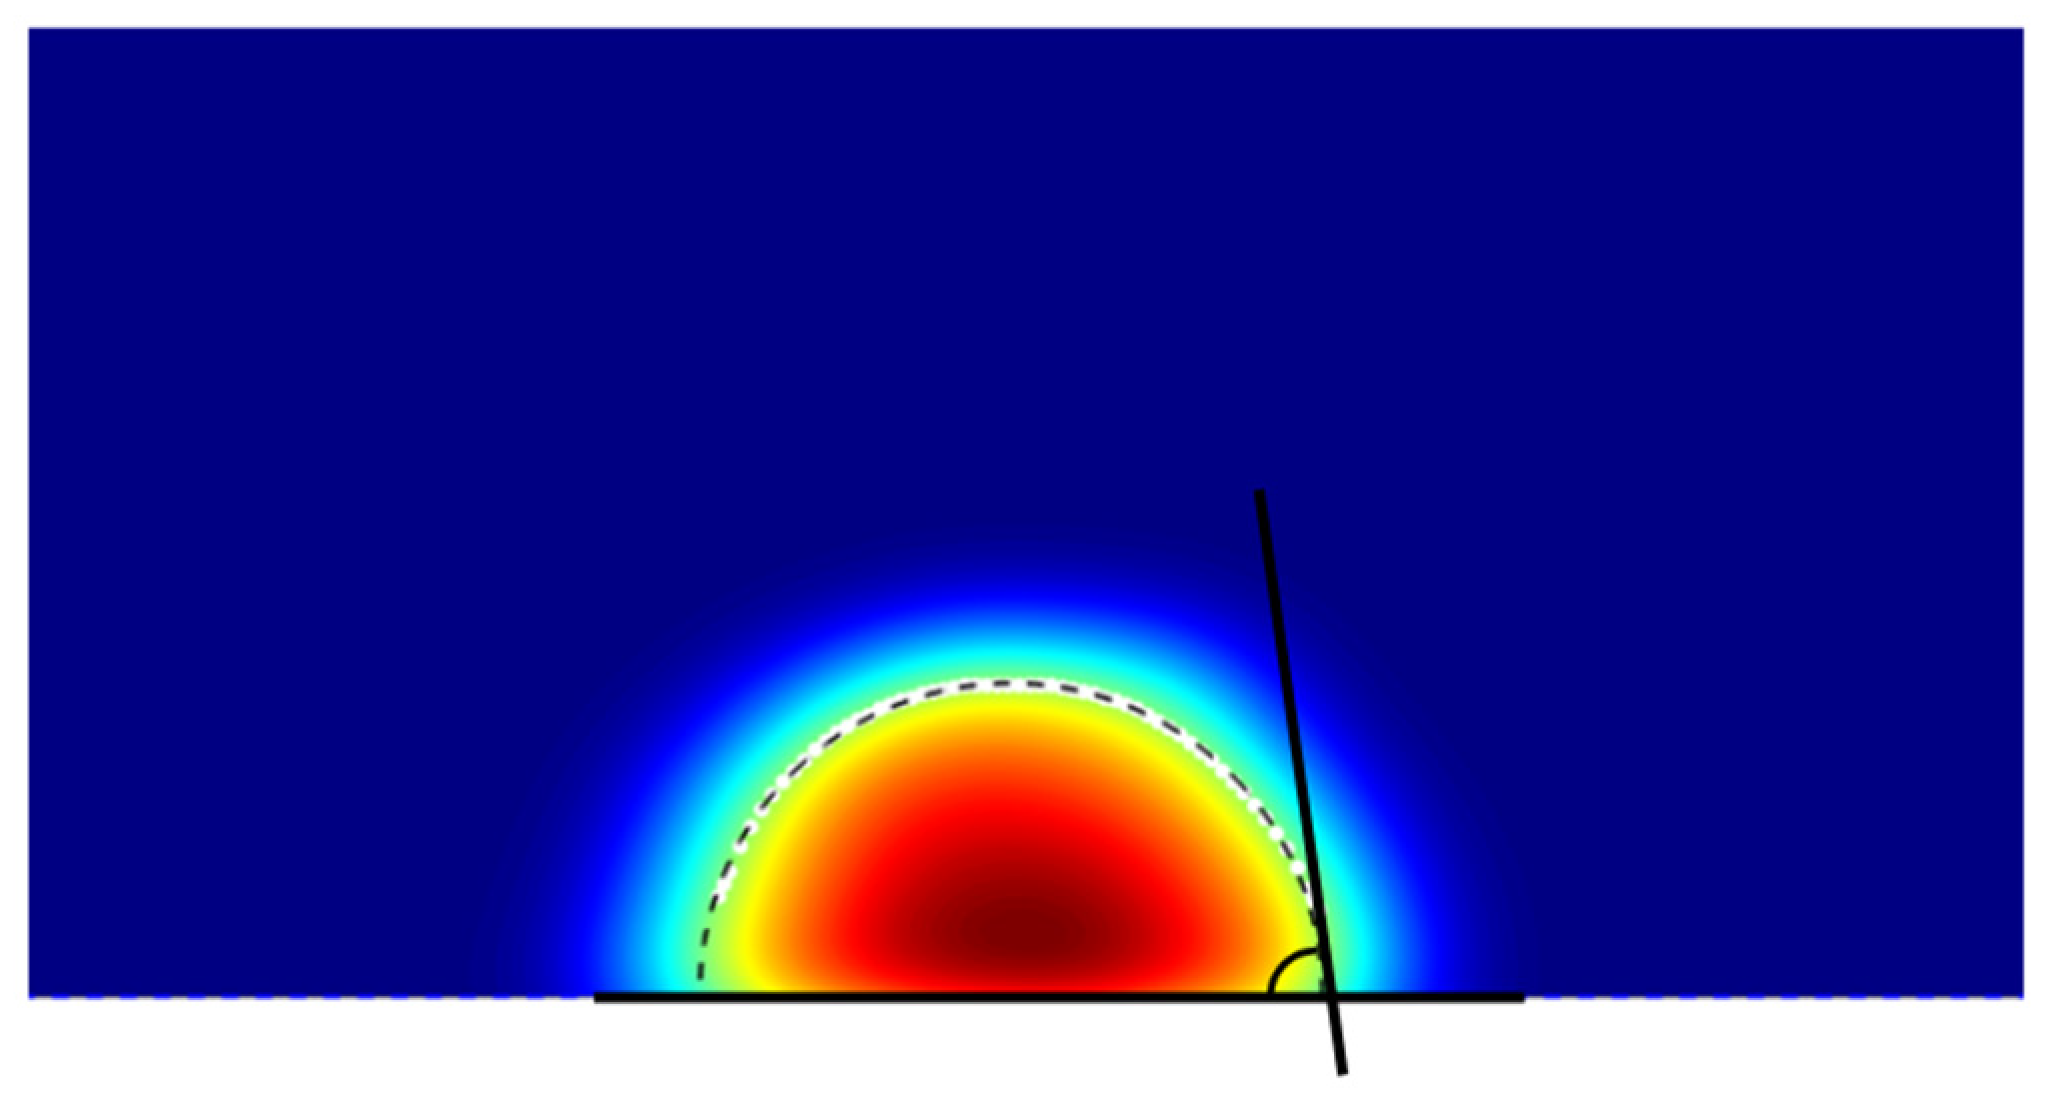
The contact angle was determined from the two-dimensional (2D) density profile of the liquid along the x–z plane. The profile was segmented into regions approaching the solid surface to identify the zone where the liquid density changes sharply, corresponding to the liquid–vapor interface. The spatial location of this interface was used to extract the droplet contour. A circle (or arc) was then fitted to the contour, and the contact angle was calculated from the angle between the tangent to the fitted curve at the solid–liquid intersection point and the horizontal surface line, following the method described in [65].
Step 1: Density Field Construction from Oxygen Atom Positions
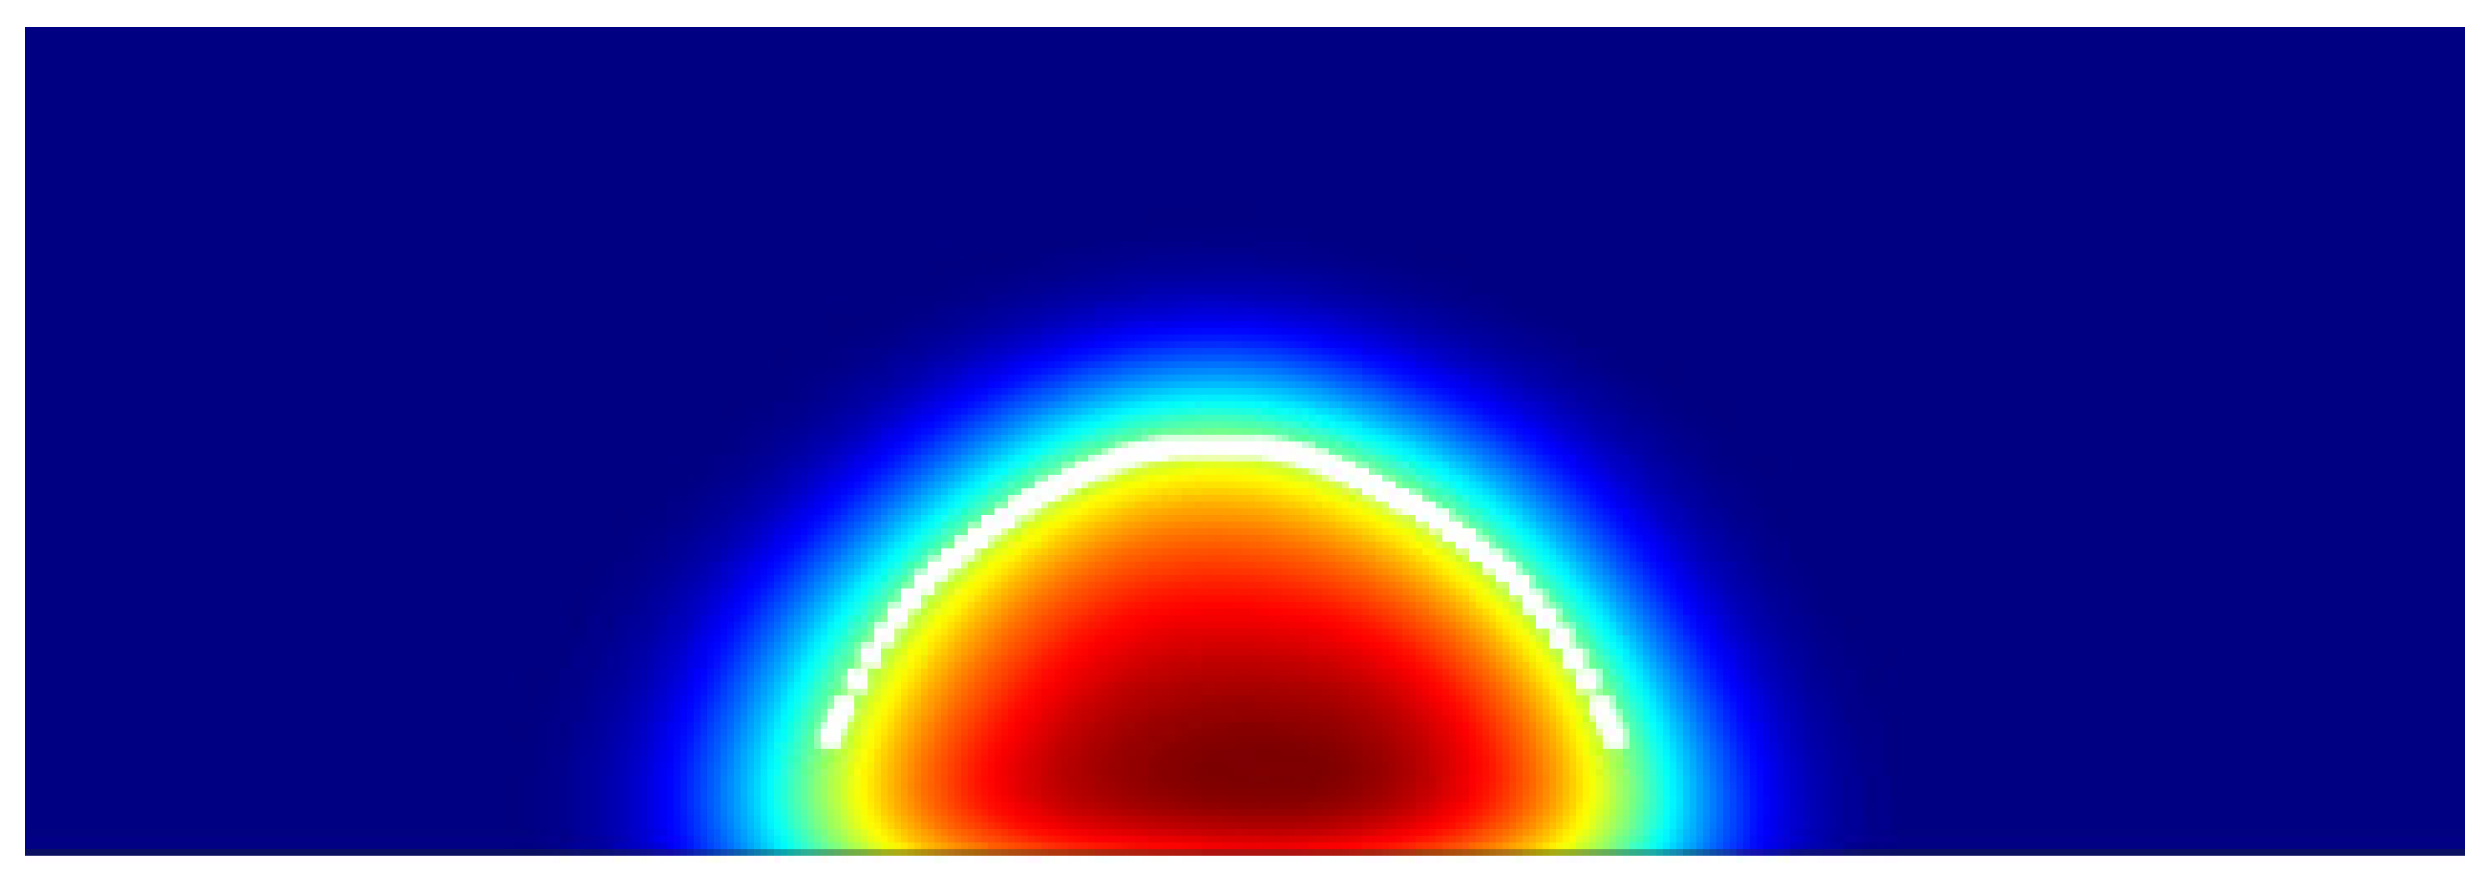
A custom Python (3.12.0) script was developed to perform 2D kernel density estimation (KDE) [66,67] on a frame-by-frame basis, using oxygen atom positions extracted from the molecular dynamics trajectory in XYZ format. For each frame, only oxygen atoms were selected, and their x and z coordinates were used for density calculation. The coordinates were interpolated onto a uniform grid with 1 Å spacing, and a Gaussian KDE (bandwidth = 0.4 Å) was applied to obtain a smooth, continuous density field from the discrete atomic positions. This procedure yielded a 2D density map as shown in Figure 2 for each frame, which was saved as an individual CSV file for subsequent analysis.
Step 2: Interface Extraction via Adaptive Density Thresholding
The csv files are then used to plot the density of water atoms over X-Z planes using MATLAB (2025) [68]. The script begins by loading all CSV files, each containing a two-dimensional density field sampled from a uniform grid with a spacing of 1 Å. For each frame, the density matrix is cropped to focus on the area of interest. To differentiate between liquid and vapor in the density map, a global threshold, i.e., t = 0.5 [69] is calculated dynamically using Bernsen’s method [70]
t = 1 2 ( max ρ i j + min ρ i j )
When the condition ρ i j > t holds true, this produces a binary mask, where the pixel is classified as “liquid” and records X and Z axis points along the interface. This heuristic method automatically adapts to changes in overall density between frames, ensuring that the extraction of interfaces remains reliable even with varying droplets. A simple moving average is applied to smooth these points, yielding x s , z s for robust fitting and noise reduction.
Step 3: Circle Fitting of the Liquid–Vapor Interface
An algebraic Least-Squares Circle Fitting [71] is performed on the smoothed points as shown in the Figure 3, and to determine the best matches this smooth interface, by solving the linear system:
( x s x c ) 2 + ( z s z c ) 2 = R 2
Linearizing by expanding each term and rearranging yields the linear system
x s z s 1 a b c = ( x s 2 + z s 2 )
This can be taken as A p = b , whereas, A = x s z s 1 ,   p = a b c ,   a n d   b = ( x s 2 + z s 2 ) .
So that the circle parameters are:
x c = a 2 ,     z c = b 2   ,     R = a 2 + b 2 4 c
Step 4: Accuracy Assessment of Circle Fit Using MSE
A Mean Squared Error [72] test is performed to determine the accuracy of circle fitting over the liquid–vapor interface. MSE is calculated by taking the average of the squared residuals, where the residual is the difference between the predicted value and the actual value for each data point in each frame. MSE is calculated as follows [73]:
M S E = 1 N   i = 1 N ( x i s m o o t h x c ) 2 + ( z i s m o o t h z c ) 2 R 2
A small MSE, specifically one that is lower than 10 2 , indicates that the interface is accurately represented by a circle or arc [73].
Step 5: Contact Angle Calculation from Fitted Geometry
Here, i = 1,2 N , signifying the number of frames, which can significantly aid in determining the contact angle. Scientifically, the script creates a horizontal reference line along the Z axis and a tangent line to the arc from the reference line and estimates the angle between these two lines using the expression
θ = 90 ° arctan z c o n t a c t z c R 2 z c o n t a c t z c 2
Hence, the angle formed between these two lines is referred to as the contact angle of the solid–liquid interface as shown in the Figure 4. We use this method to estimate the contact angle for each frame and calculate the average along with the standard deviation of the contact angle.
In this study, the wetting behavior of copper surfaces was systematically investigated by varying the Lennard–Jones (LJ) interaction strength parameter ( ε O C u ) between the oxygen sites of TIP4P/2005 water molecules and copper atoms. The ε value was initially varied from 0.10 to 0.80 kcal/mol in increments of 0.05 kcal/mol to capture the overall hydrophilic–hydrophobic transition. As ε O C u increased, the interaction between water and copper strengthened, resulting in greater droplet spreading and a pronounced reduction in the measured contact angle. This transition is clearly illustrated in Figure 5, which shows a steep decline in contact angle with increasing ε O C u , shifting the surface behavior from hydrophobic to strongly hydrophilic.
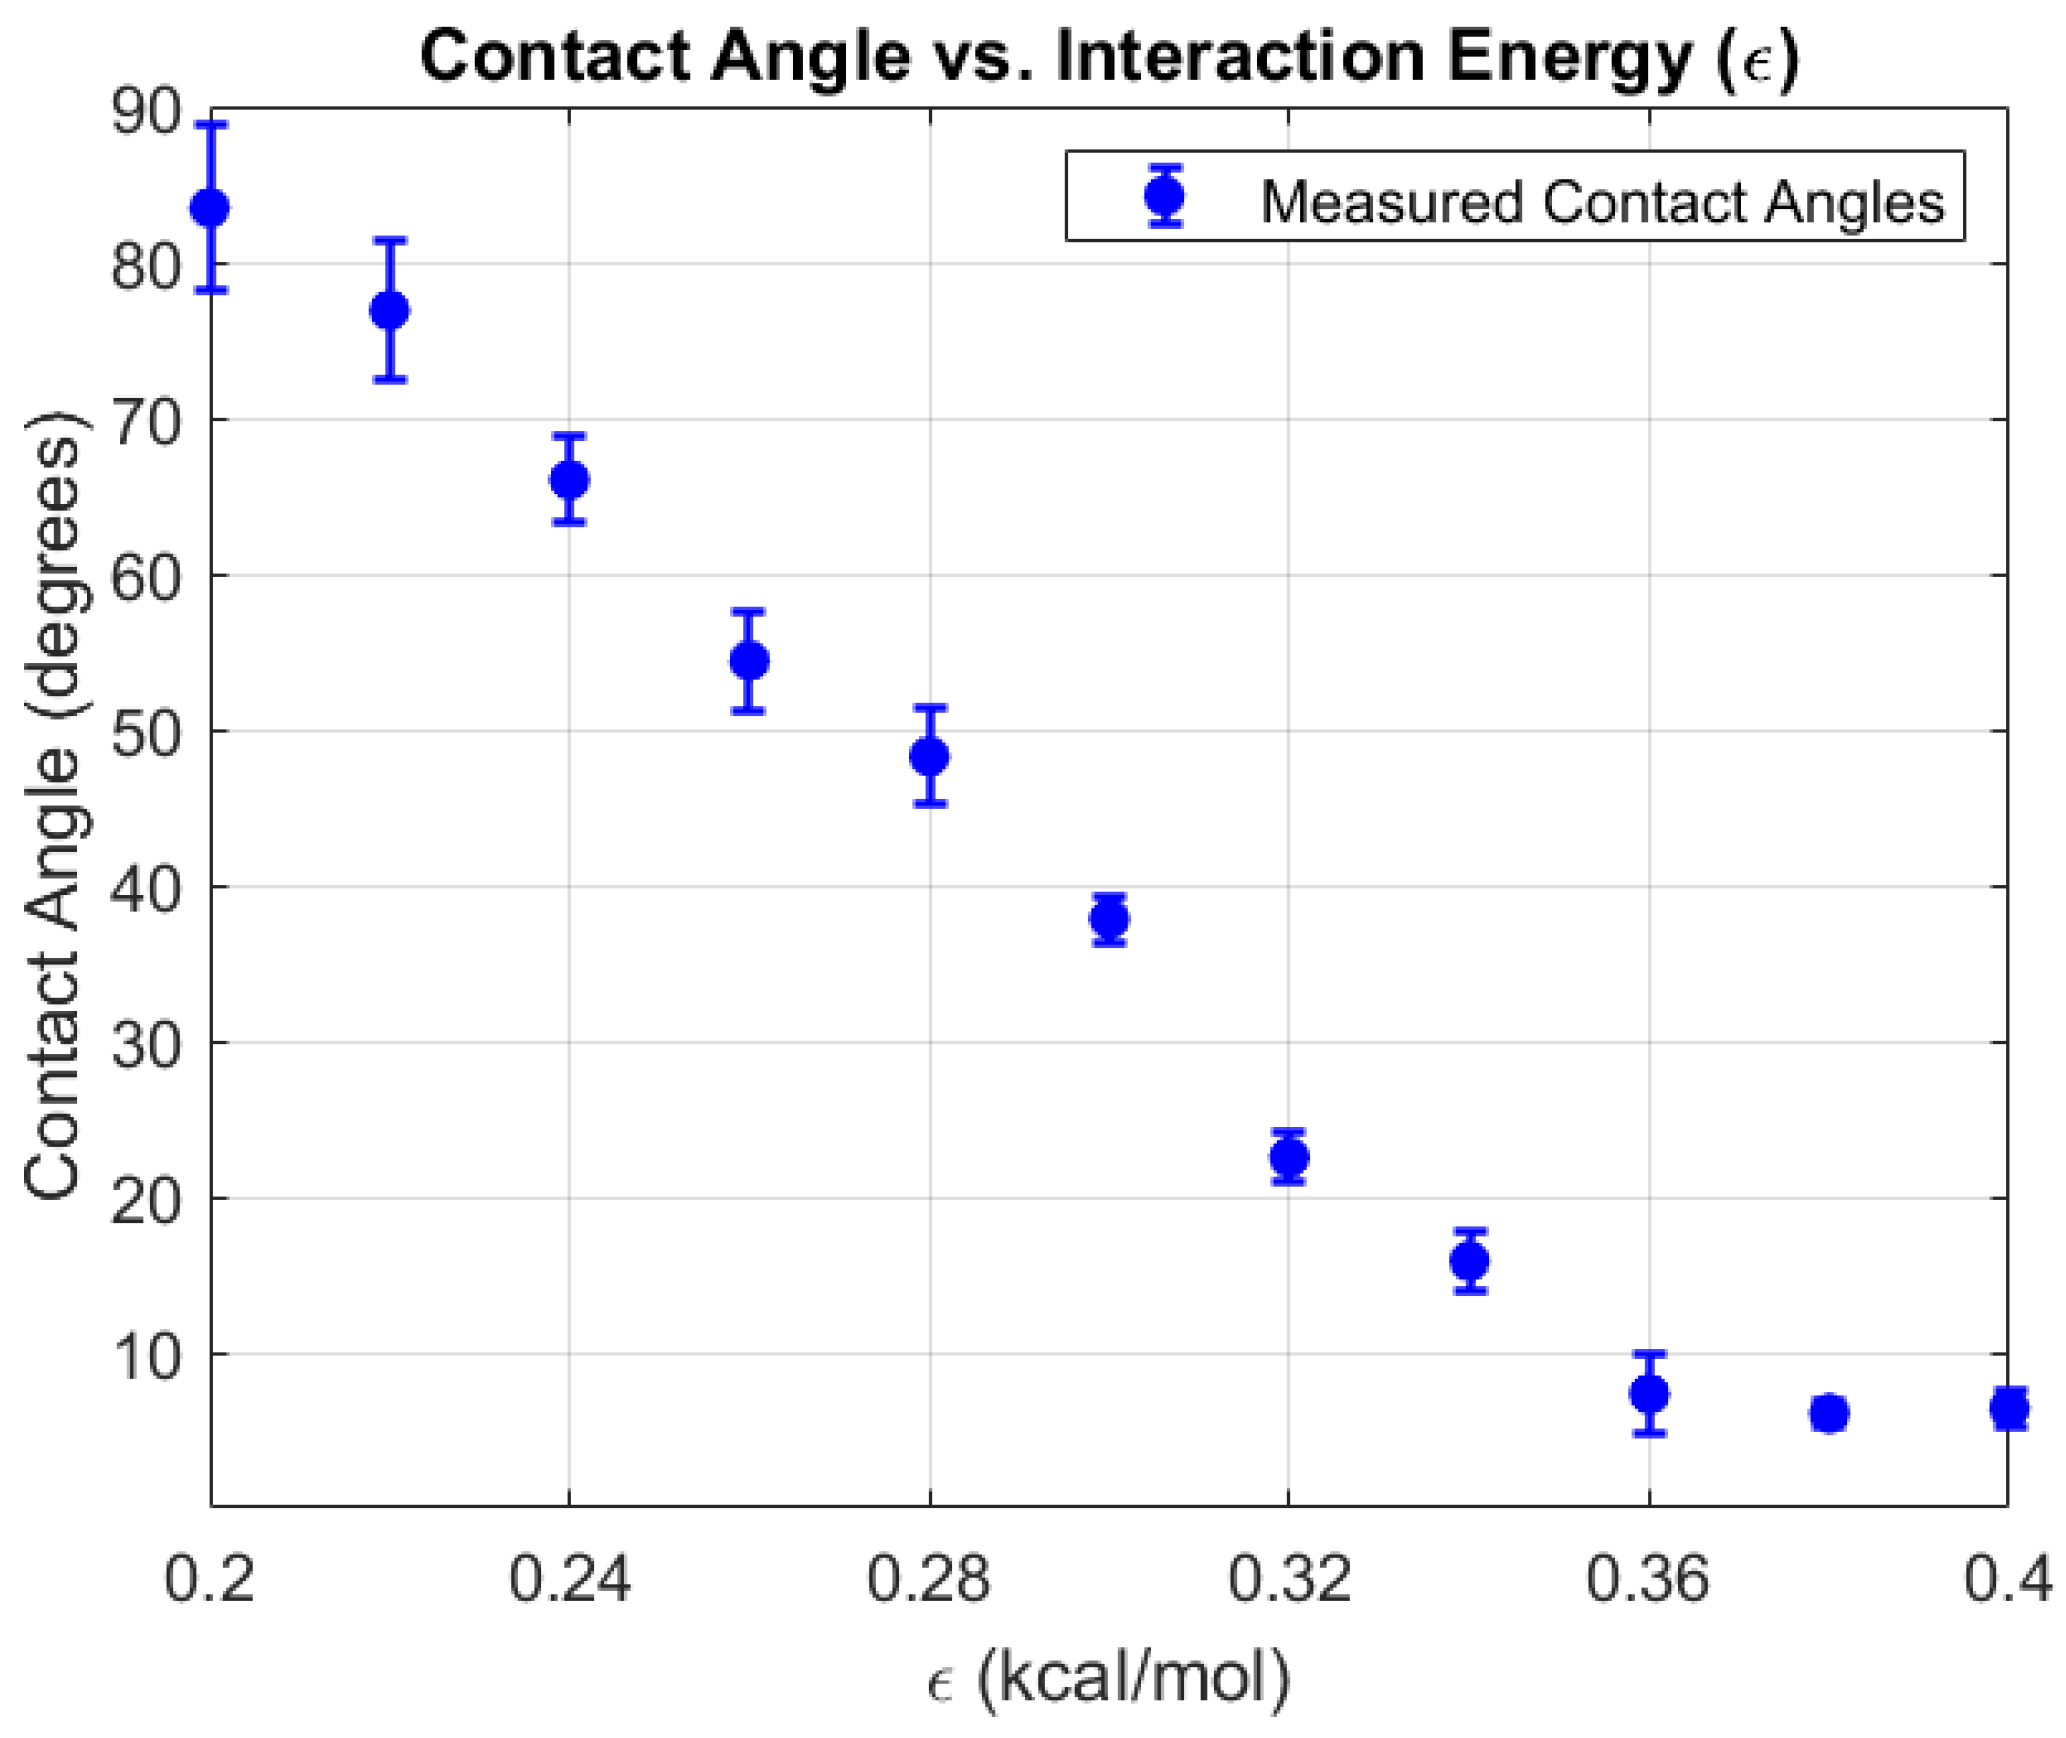
To resolve finer changes in the hydrophilic regime, ε O C u was further varied from 0.20 to 0.40 kcal/mol in smaller increments of 0.02 kcal/mol. The results, presented in Figure 6, reveal a consistent and monotonic decrease in contact angle with increasing ε O C u . At lower ε O C u values, droplets retained higher contact angles, indicative of limited wetting. As ε O C u increased, enhanced attractive interactions between water oxygen atoms and copper atoms caused droplets to spread more extensively, reducing the contact angle to below 10 ° at the highest tested values.
Overall, these results demonstrate a clear and tunable relationship between the LJ energy parameter ε and the wetting properties of copper surfaces. By adjusting ε O C u , the simulated copper–water interface can be driven from a non-wetting state to complete wetting, offering precise control over interfacial behavior. This tunability provides a valuable framework for calibrating forcefield parameters to match experimental observations and for predicting wetting phenomena in nanoscale applications involving copper–water systems.

2.5. Validation to Experimental WCA:

To validate the forcefield parameterization, we performed a fine-grained sweep of the Lennard–Jones energy parameter ( ε O C u ) for the oxygen–copper interaction in the range 0.20–0.30 kcal/mol, using increments of 0.02 kcal/mol. This range was chosen to encompass experimentally reported water contact angles (WCAs) for copper surfaces in air, which typically lie between 50.2° and 82.3°. The simulation results revealed a clear and monotonic trend: as ε O C u increased, the attractive interaction between water and copper strengthened, promoting droplet spreading and reducing the contact angle. Simulated WCA values ranged from 83.48° at ε O C u = 0.20 kcal/mol to 37.83° at ε O C u = 0.30 kcal/mol. Within the narrower range of ε O C u = 0.20–0.28 kcal/mol, the predicted contact angles closely matched experimental values, with deviations well within a few degrees (Table 1).
This agreement underscores the accuracy of the chosen forcefield in reproducing macroscopic wetting behavior from atomistic simulations. Importantly, the close correspondence between simulation and experiment suggests that tuning ε can be an effective strategy for bridging the gap between molecular-scale modeling and real-world surface wettability measurements. By calibrating the interaction strength in this manner, our simulations can capture not only the qualitative hydrophilic–hydrophobic transition but also quantitatively match observed wetting characteristics of copper surfaces under ambient conditions. Overall, this validation provides strong evidence that the parameterized oxygen–copper interaction in our TIP4P/2005–Cu (111) model can accurately reproduce experimentally observed wetting behavior, thereby increasing confidence in its predictive capability for nanoscale interfacial studies.

3. Nanochannel Evaporation Studies

To investigate nanoscale evaporation mechanisms under confinement, we constructed a copper–water nanochannel system as shown schematically in Figure 7. The geometry was designed to emulate a liquid reservoir feeding a sequential series of narrow channels, which then transitioned into vapor collection regions. This allowed spatially resolved tracking of evaporation onset, propagation, and vapor transport.
The copper walls were modeled using the Modified Embedded Atom Method (MEAM) potential to capture many-body metallic bonding effects and realistic elastic response. Water molecules were represented by the TIP4P/2005 model, which was chosen for its high fidelity in reproducing thermophysical properties and hydrogen-bond structure. Long-range electrostatics were treated using the PPPM/tip4p solver with a target accuracy of 10−4, ensuring accurate handling of Coulomb interactions. The water–copper cross-interaction was described via a Lennard–Jones potential with parameters ( ε O C u = 0.25 kcal/mol, σ = 3.10 Å), consistent with our wetting calibration studies, ensuring that adhesion strength reflected the experimentally observed hydrophilic behavior of copper.

3.1. Materials and Methods for Nanochannel Evaporation

The simulation box dimensions were 4.25 nm × 3.2535 nm × 25 nm in x, y, and z. The dimension along x-axis (4.25 nm) is chosen to resemble a 2 nm channel width with a 1 nm copper plate on either side. It is difficult to precisely model the copper into 1 nm while respecting the lattice structure face-centered cubic (fcc) 111. Hence, an additional 0.25 nm will appear in the x-axis, making a total of 4.25 nm. In the y-axis, at least 3 times the cutoff radius (0.85 nm) is the minimum preferred to avoid periodic image interaction artifacts. Due to this, we chose a value greater than 3 nm, which turned out to be 3.2535 nm to keep the lattice structure arrangement without gaps across the periodic boundary conditions (PBCs). Periodic boundary conditions were applied along all directions. The channel interior was subdivided into physically distinct regions: Reservoir (liquid inlet), Seven sequential channel sections (Channel 1–7), Five vapor regions (Vapor 1–5), and Cooling region downstream. Each region’s spatial extent in the z-direction is labeled in Figure 7. The geometry ensured a controlled progression from liquid-dominated flow near the inlet to vapor-dominated flow near the outlet, enabling temperature-dependent mapping of evaporation behavior. Water molecules were initially positioned as a pre-equilibrated block, with a small gap away from the copper walls to prevent atom overlap. Copper atoms were tethered via a weak spring with respect to their initial positions to prevent rigid body drift, and SHAKE constraints were applied to water molecules to preserve TIP4P/2005 geometry.
Thermal control was implemented using region-specific Langevin thermostats: Reservoir and inlet channels (1–3) maintained at 300 K to supply stable liquid. Mid-channel and vapor regions (4–7, Vapor 1–5) thermostated to target evaporation temperatures of 300, 350, 400, 450, 500, 550 and 600 K depending on the case. Cooling section maintained at 300 K to mimic heat removal. A 1 fs integration timestep was used. The simulation length was 1,000,000 steps (1 ns), sufficient to capture both transient and quasi-steady evaporation stages.
Dynamic groups tracked water molecules in each spatial region every 10 steps. Key metrics included: number of molecules per region, copper and water temperatures, potential and total energies, evaporation curves smoothed with a moving-average filter considering 50 values. MATLAB (2025) post-processing generated temporal depletion and accumulation plots, highlighting the migration of water molecules from liquid-filled channels into vapor regions.

3.2. Results and Discussion

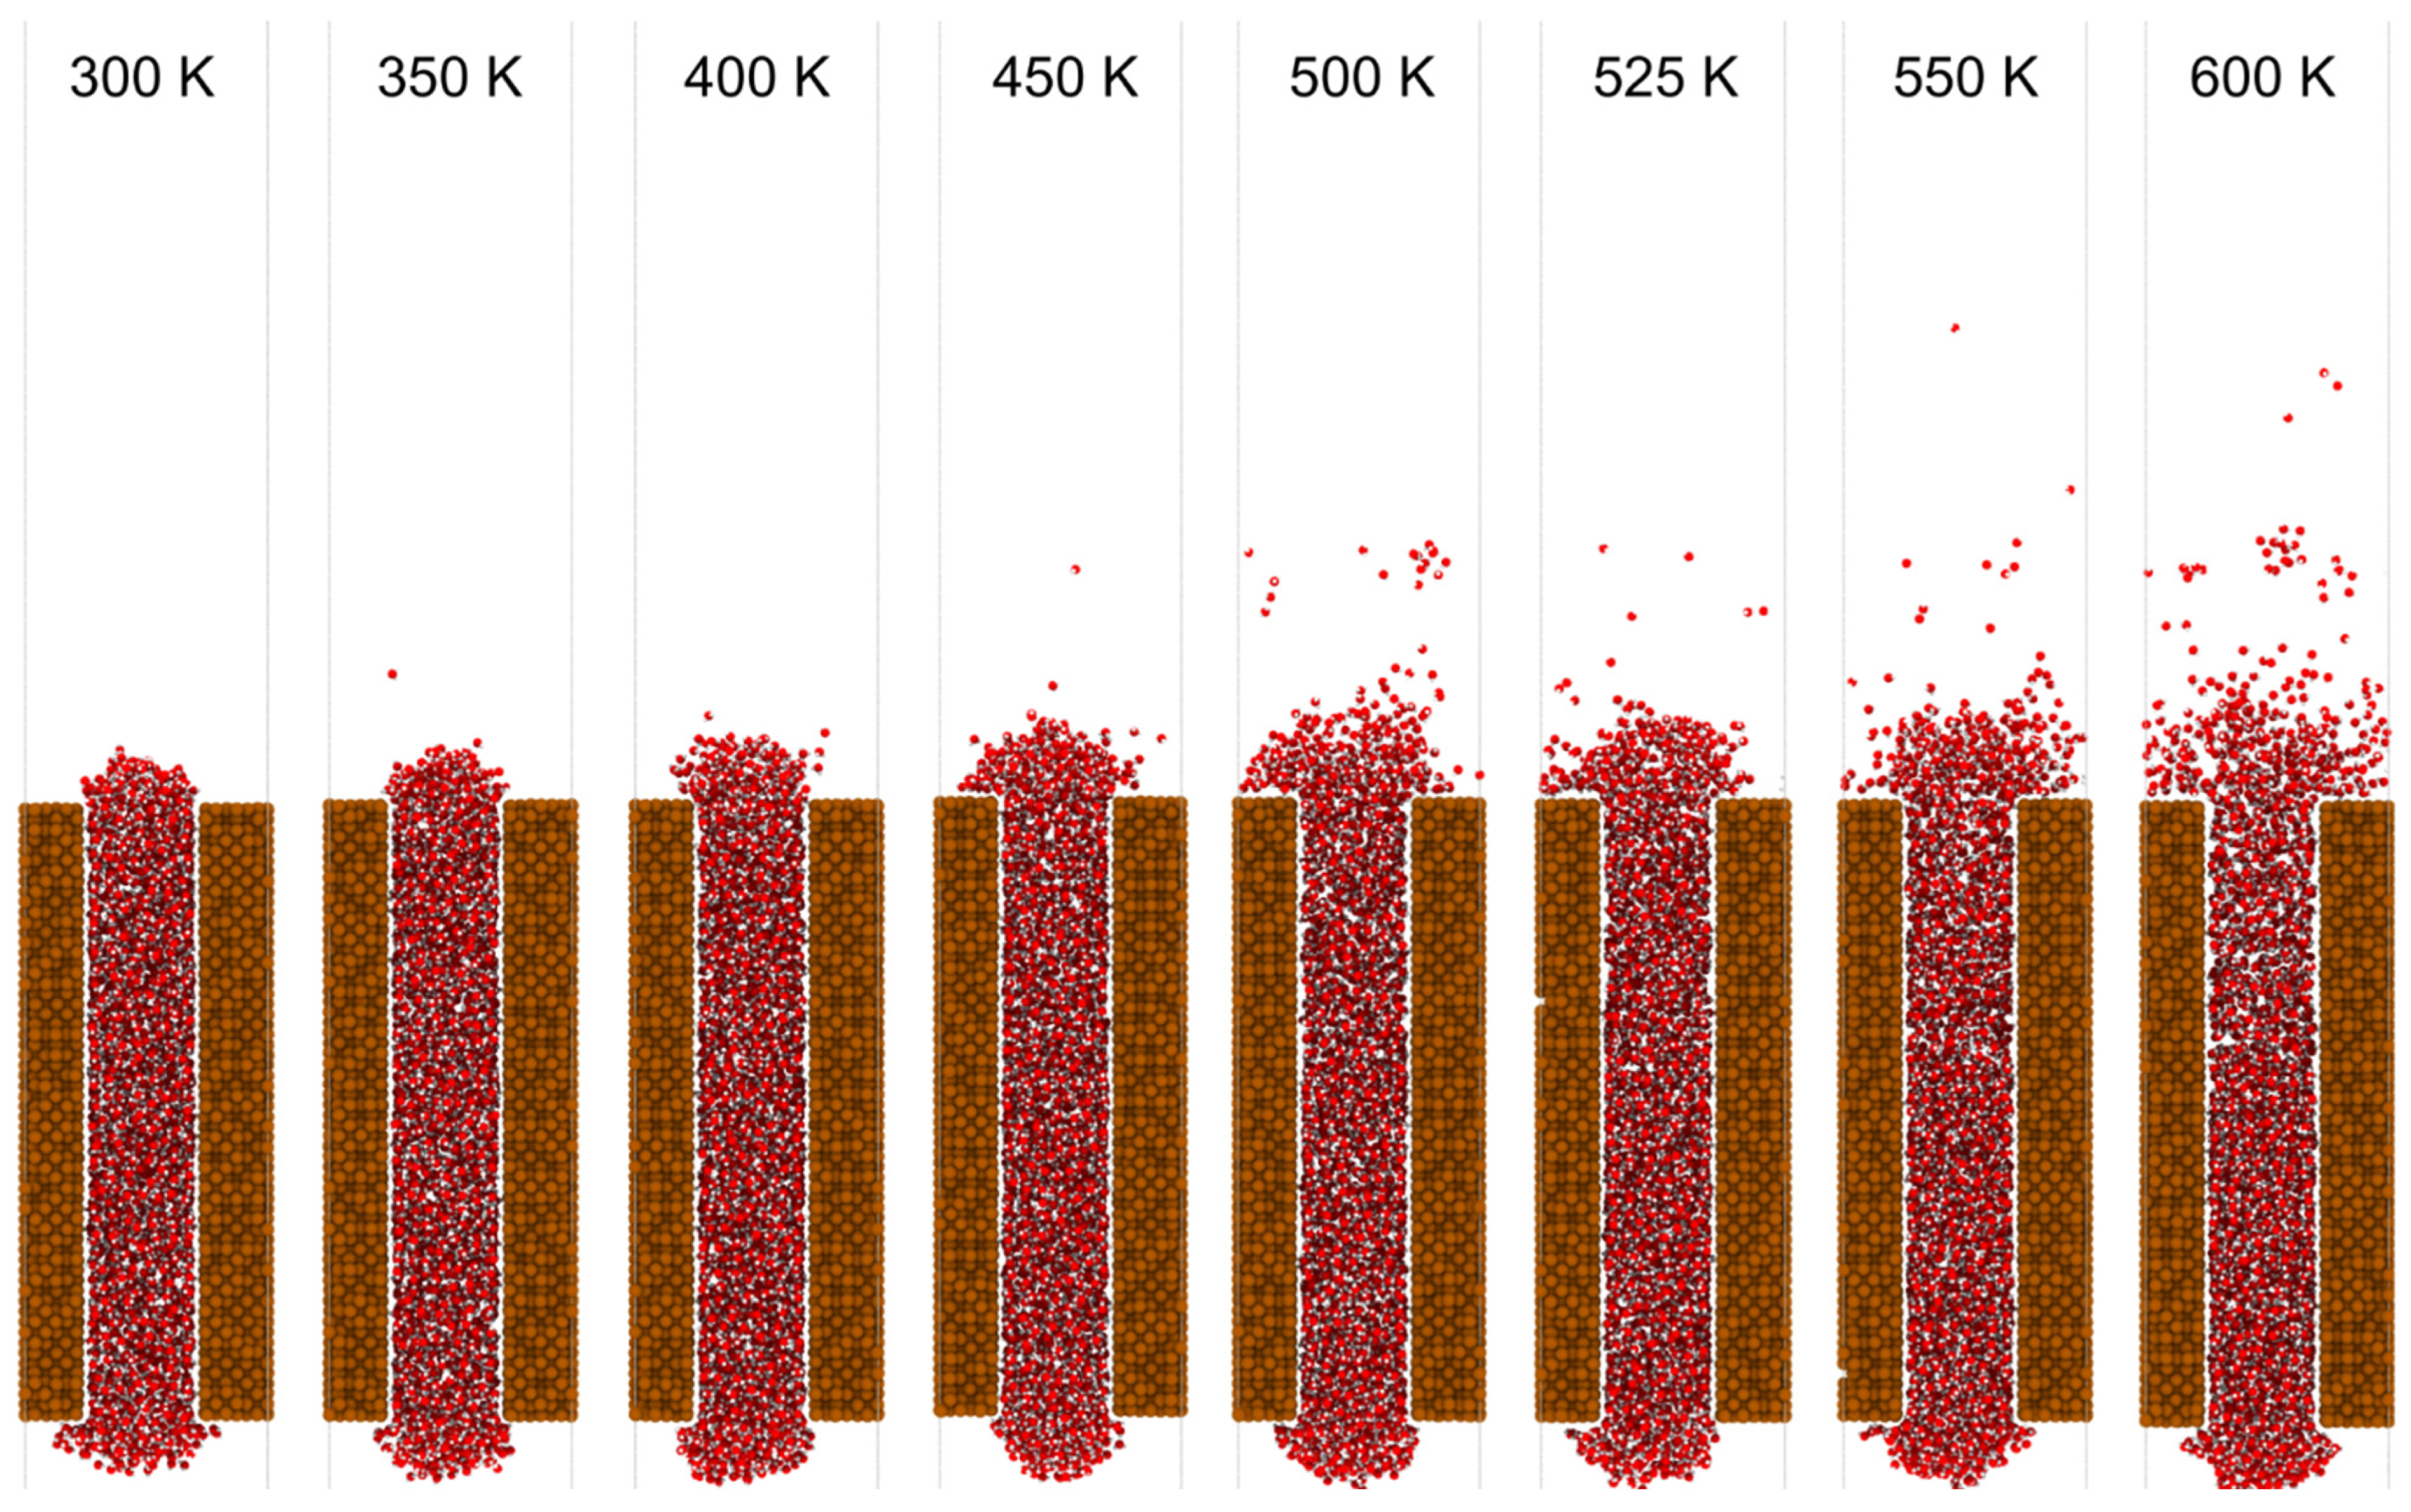
Figure 7 presents a schematic of the molecular dynamics simulation setup. The copper walls (brown) confine the water phase (oxygen in red, hydrogen in white), with spatial segmentation into reservoir, channels, and vapor regions. The color-coded segmentation (blue for cooler inlet sections, red for heated mid-to-outlet sections) facilitates independent temperature control, simulating localized heating scenarios as found in micro-evaporators and nuclear microchannel heat exchangers. Figure 8 provides representative snapshots of water confined in the nanochannel for system temperatures of 300 K, 400 K, 500 K, and 600 K. At 300 K, the liquid column remains intact, with minimal vapor-phase molecules above the interface. By 400 K, localized evaporation becomes visible near the heated sections, with the vapor front expanding downstream. At 500 K, the vapor phase occupies a substantial portion of the channel’s upper regions, and at 600 K, rapid boiling-like behavior is observed, with dispersed vapor molecules filling the downstream vapor regions. The qualitative transition from surface-layer evaporation to bulk-phase vaporization is evident.
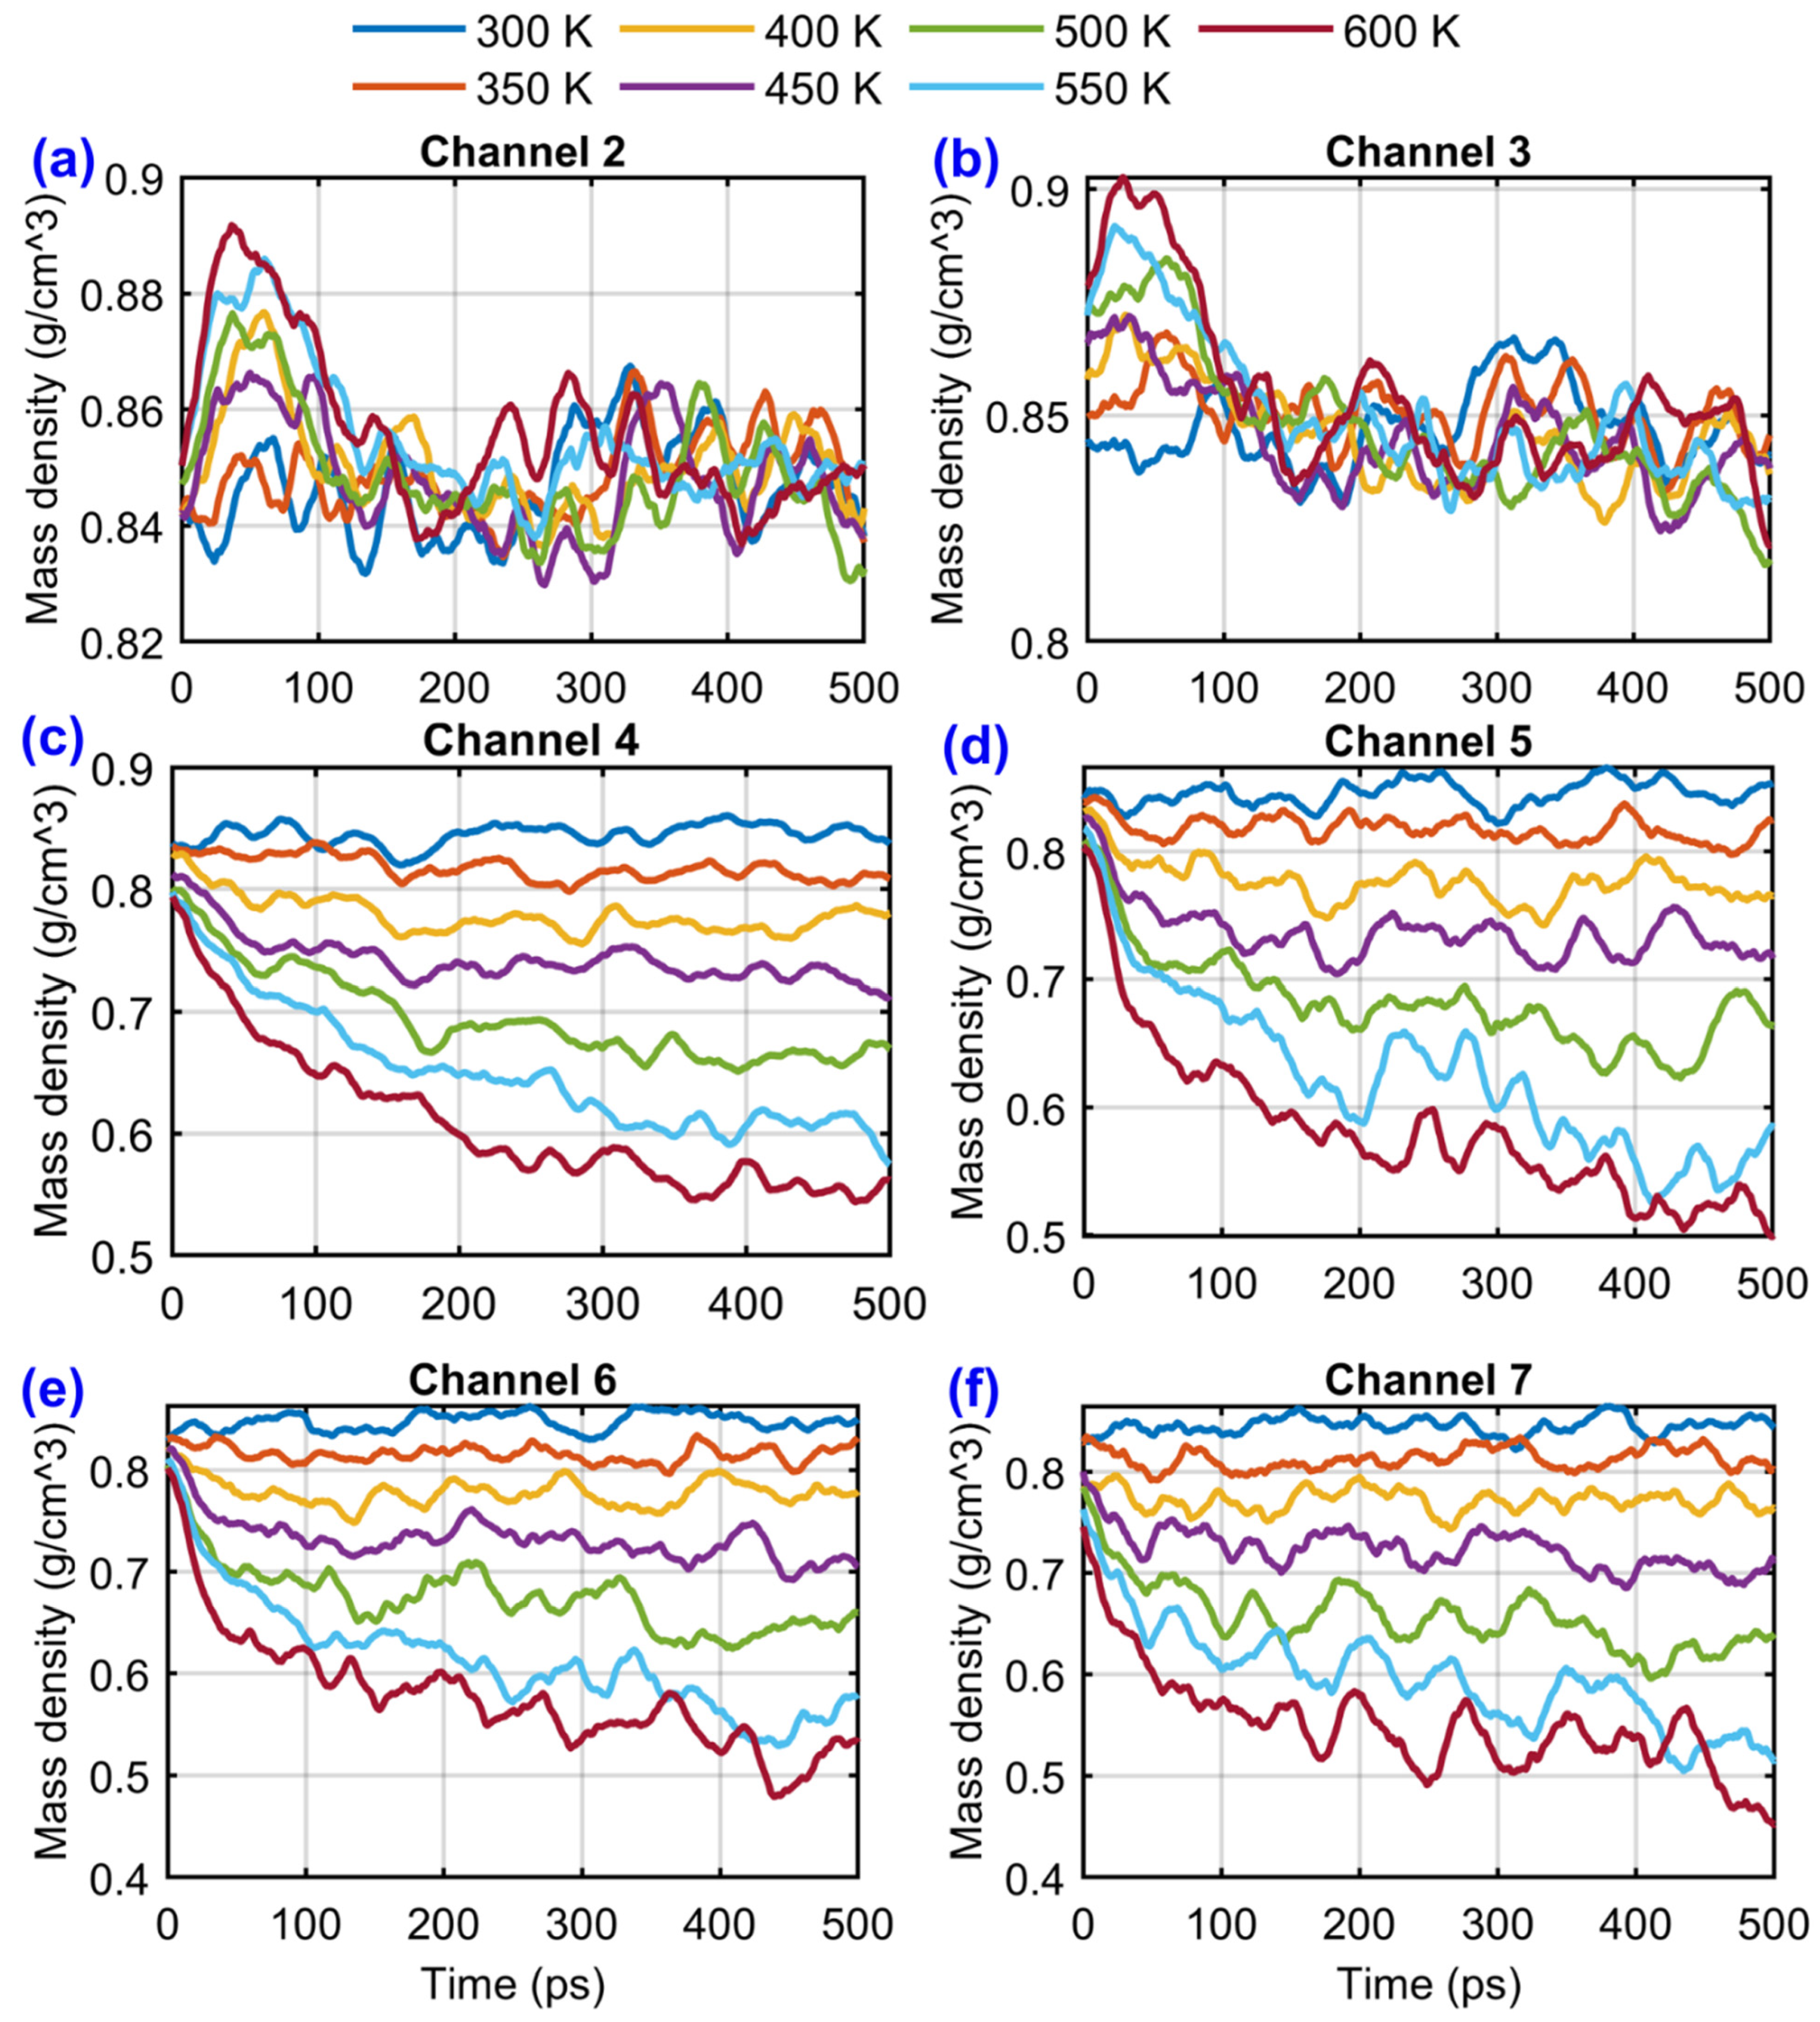
The temporal evolution of the channel densities (Figure 9 and Figure 10) reveals a clear temperature-dependent evaporation behavior along the channel length. At low temperatures (300–400 K), the confined liquid water remains relatively stable, showing minimal density fluctuations and no observable drying in any of the channel sections. The small oscillations observed are attributed to local structural reorganization and thermal density fluctuations, typical of nanoscale confinement.
When the system temperature rises to 450 K and above, a distinct downward trend in density becomes evident, especially in the downstream regions (Channel 5–7). This trend reflects the onset of sustained evaporation, where water molecules near the channel exit acquire sufficient kinetic energy to escape into the adjacent vapor regions. The gradients observed across channels indicate a spatially nonuniform depletion, consistent with a receding liquid–vapor interface.
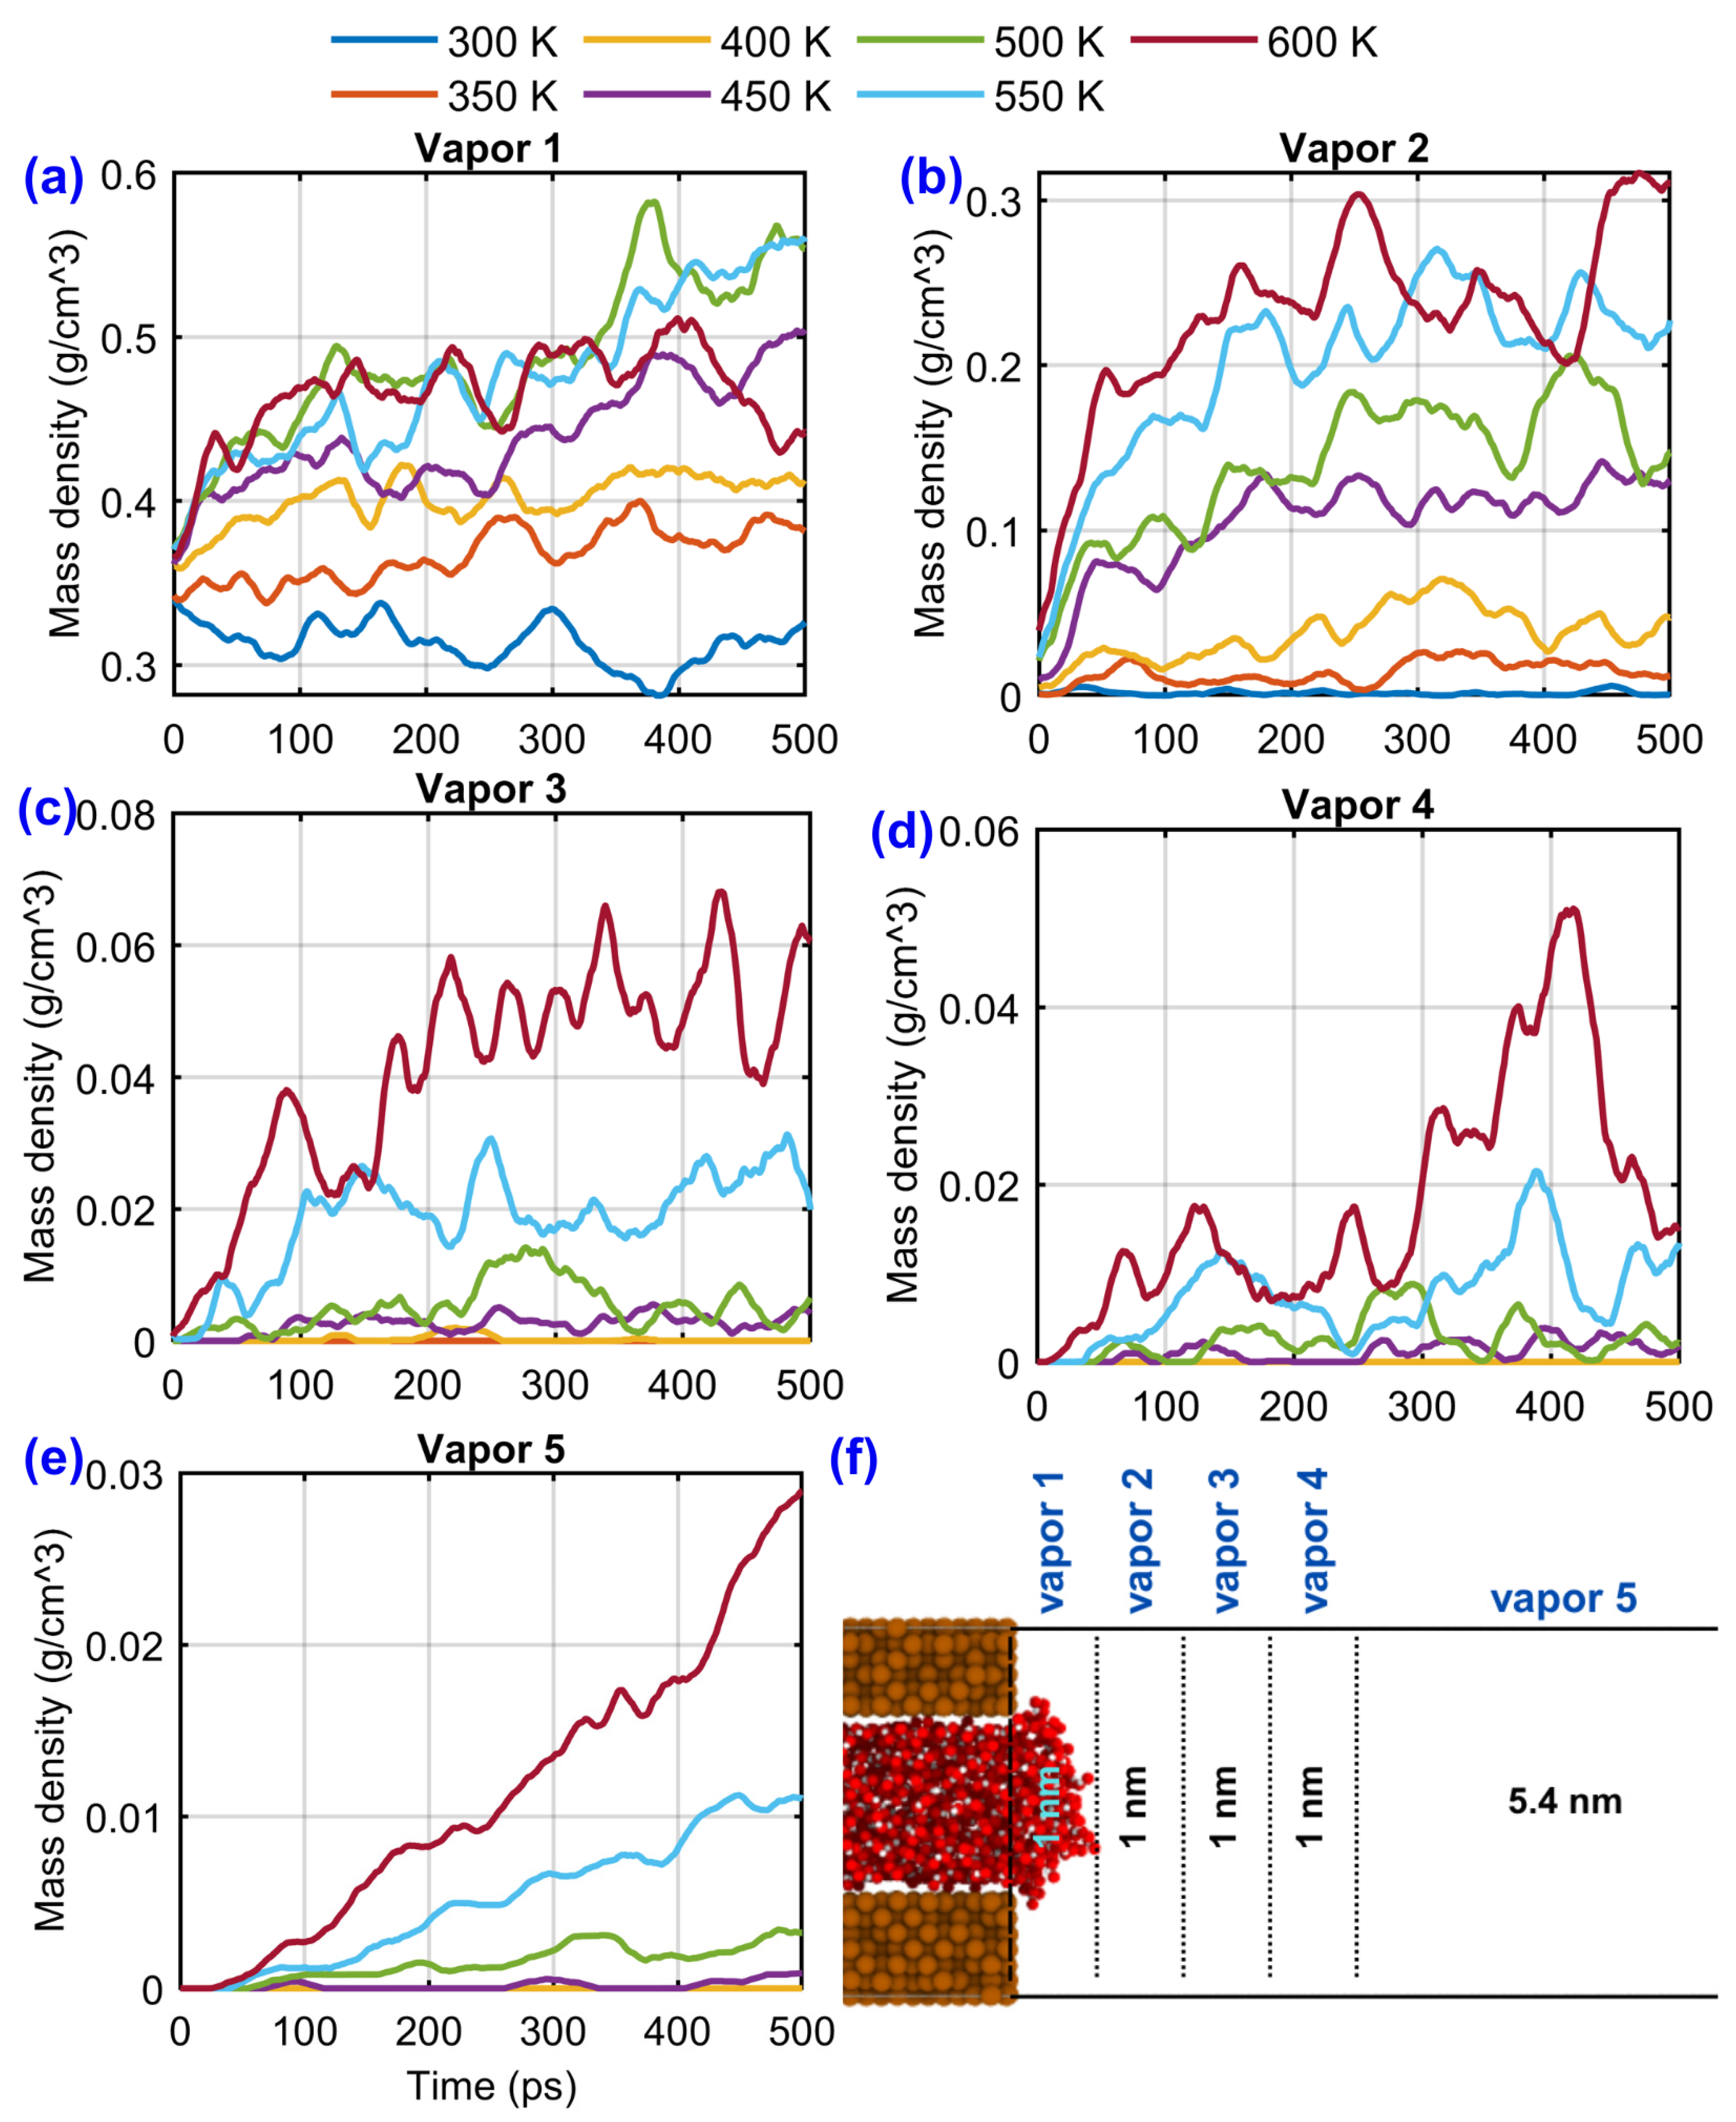
At 600 K, the depletion is most significant: the density in Channel 7 drops from ~0.8 g/cm3 at the start to below 0.5 g/cm3 within 400 ps. This suggests rapid phase change and thinning of the liquid film near the exit, which corresponds to the sharp increase in vapor densities reported in Figure 10 (vapor regions). The upstream channels (2–4), however, maintain higher densities, confirming that the primary evaporation front is localized near the outlet and propagates backward as temperature increases.
Overall, these results demonstrate that the nanoscale evaporation process initiates at the liquid–vapor interface and strengthens with increasing temperature, resulting in a measurable density gradient along the channel. The combination of channel depletion (Figure 9) and vapor density growth (Figure 10)
The spatial density distributions provide a clear picture of how the liquid–vapor interface evolves and how the evaporation process modifies the phase structure over time. At the start of the simulation (Figure 11a), all systems show nearly uniform liquid densities (~0.84–0.86 g cm−3) within the channel regions (Channel 1–7) and negligible densities in the vapor regions. This uniformity confirms that the systems were initialized with fully filled channels and a near-vacuum vapor domain, establishing a consistent baseline across all temperatures. By the end of the simulation (Figure 11b), a pronounced temperature dependence emerges. For low-temperature systems (300–400 K), the liquid densities remain largely unchanged throughout the channel, and the vapor densities stay close to zero—indicating that evaporation is minimal under these conditions. At moderate temperatures (450–500 K), the densities begin to show a gradual decline along the channel, particularly from Channel 4 onward, accompanied by measurable increases in the vapor regions, signifying the onset of interfacial evaporation.
At high temperatures (550–600 K), the density gradients steepen dramatically. The downstream channels (Channel 6–7) exhibit a substantial reduction in density (to ~0.5 g cm−3 or lower), while the vapor regions (Vapor 1–3) attain significantly higher mean densities, reflecting strong vapor accumulation. This pattern confirms that the evaporation front advances progressively from the outlet toward the channel interior with increasing temperature. These results reveal a distinct thermally driven phase redistribution: higher temperatures lead to continuous mass transfer from the liquid-filled channels into the vapor domain, reducing channel densities and enriching the vapor phase. The density gradients along the channel and into the vapor region thus serve as a direct signature of the evaporation intensity and its spatial localization.
The evolution of the total evaporation rate provides direct insight into the intensity and dynamics of phase change occurring within the nanochannel. As shown in Figure 12, the evaporation rate exhibits a strong dependence on temperature and time, with distinct transient and quasi-steady stages. At the early stages of simulation (t < 100 ps), all systems display an initial surge in evaporation rate, corresponding to the rapid adjustment of the liquid–vapor interface following system equilibration. The magnitude of this initial peak increases with temperature, from nearly negligible at 300–350 K to approximately 0.08–0.09 ng/s at 600 K, indicating the strong temperature-driven enhancement of molecular escape from the liquid phase.
Beyond ~100 ps, the evaporation rate progressively declines and fluctuates around small steady-state values. These oscillations reflect the dynamic balance between evaporation and condensation events at the interface. For temperatures ≤ 400 K, the rate remains close to zero throughout, implying negligible net evaporation and a stable confined liquid phase. In contrast, at higher temperatures (≥500 K), the rate remains consistently positive, confirming a sustained mass flux from the liquid to the vapor region.
Notably, the 600 K system exhibits a pronounced decay after the initial peak, reaching a quasi-steady regime near 0.01 ng/s after 150 ps. This behavior suggests that much of the easily accessible surface water evaporates rapidly, followed by a slower evaporation process controlled by diffusion and interfacial stability. The 550 K and 500 K cases show similar, though less intense, trends. These results demonstrate that evaporation within the nanochannel is highly transient and strongly temperature dependent. The early-time peaks signify the initial interfacial response, while the later steady-state rates quantify the sustained mass transfer driving vapor accumulation in the adjoining regions. Combined with the spatial density analyses, this temporal behavior confirms that elevated temperatures accelerate evaporation and promote more extensive liquid depletion near the channel outlet.
The observed temperature-dependent evaporation rates can be explained by competition between cohesive hydrogen-bond networks within TIP4P/2005 water and adhesive interactions with the copper wall. At low T, cohesive forces dominate, maintaining molecular layering near the wall and suppressing vapor formation. As T rises, thermal agitation disrupts hydrogen bonding and overcomes adhesion, enabling rapid molecular escape into the vapor phase. The spatial segmentation of the channel further reveals that evaporation onset is not uniform. In moderately heated cases (400–500 K), evaporation initiates downstream of the initial contact with heated walls, suggesting a finite thermal penetration depth before sufficient molecular excitation occurs. In highly heated cases (600 K), the entire heated section contributes to vapor generation, consistent with a boiling-like transition where bulk kinetic energy exceeds cohesive energy.

4. Conclusions

We created and tested a copper–water interaction model for TIP4P/2005 water on a Cu (111) surface, adjusting the oxygen–copper Lennard–Jones energy parameter so that the simulated water contact angles matched experimental values. The validated model showed that increasing ε lowers the contact angle, allowing precise control of surface wetting as it transitions from water-repelling (hydrophobic) to water-attracting (hydrophilic). When we used this model in nanochannel evaporation simulations, we found that evaporation strongly depends on temperature: at low temperatures, strong water–copper attraction and hydrogen bonding keep water from evaporating, but at higher temperatures, evaporation becomes rapid and can resemble boiling. Dividing the channel into different regions revealed that evaporation does not start everywhere at once, but mainly begins in heated areas. This study provides a dependable forcefield model for simulating copper–water interactions and a detailed framework for understanding and controlling nanoscale evaporation in metallic channels. The results are useful for designing advanced cooling systems such as microreactors, micro-evaporators, and compact heat exchangers, and they also provide high-quality data for larger-scale models and machine learning tools.

Author Contributions

Conceptualization, S.Y.; Methodology, S.Y. and M.M.; Software, S.Y.; Validation, S.Y., M.M. and J.M.; Formal Analysis, S.Y., M.M., J.M. and M.T.; Investigation, S.Y.; Resources, S.Y.; Data Curation, S.Y.; Writing—Original Draft Preparation, S.Y.; Writing—Review and Editing, S.Y., M.M., J.M. and M.T.; Visualization, S.Y., Project Administration, S.Y.; Funding Acquisition, S.Y.; Supervision, S.Y. All authors have read and agreed to the published version of the manuscript.

Funding

This research was partly funded by the U.S. Nuclear Regulatory Commission (NRC) Graduate Fellowship Program under award number 31310023M0029. The article processing charge (APC) was also funded by this NRC award.

Data Availability Statement

All input scripts, LAMMPS data files, and post-processing tools used in this study are available from the corresponding author upon reasonable request.

Acknowledgments

The authors gratefully acknowledge the computational resources provided by the University of New Haven. The statements, findings, conclusions, and recommendations are those of the authors and do not necessarily reflect the views of the University of New Haven or the U.S. Nuclear Regulatory Commission.

Conflicts of Interest

The authors declare no conflicts of interest.

References

  1. Xu, Y.; Cai, Y.; Song, L. Condition Assessment of Nuclear Power Plant Equipment Based on Machine Learning Methods: A Review. Nucl. Technol. 2023, 209, 929–962. [Google Scholar] [CrossRef]
  2. Wang, Y.-J. A Structure-Based Machine Learning Approach for Spatiotemporal Fluctuations in Nuclear Thermal Fluids. Ph.D. Thesis, Massachusetts Institute of Technology, Cambridge, MA, USA, 2024. [Google Scholar]
  3. Song, H.; Liu, X.; Song, M. Comparative Study of Data-Driven and Model-Driven Approaches in Prediction of Nuclear Power Plants Operating Parameters. Appl. Energy 2023, 341, 121077. [Google Scholar] [CrossRef]
  4. Pavone, A.; Merlo, A.; Kwak, S.; Svensson, J. Machine Learning and Bayesian Inference in Nuclear Fusion Research: An Overview. Plasma Phys. Control. Fusion 2023, 65, 053001. [Google Scholar] [CrossRef]
  5. Jinia, A.J.; Clarke, S.D.; Moran, J.M.; Pozzi, S.A. Intelligent Radiation: A Review of Machine Learning Applications in Nuclear and Radiological Sciences. Ann. Nucl. Energy 2024, 201, 110444. [Google Scholar] [CrossRef]
  6. Hong, L.-Z.; Gong, H.-L.; Ji, H.-J.; Lu, J.-L.; Li, H.; Li, Q. Optimizing Near-Carbon-Free Nuclear Energy Systems: Advances in Reactor Operation Digital Twin through Hybrid Machine Learning Algorithms for Parameter Identification and State Estimation. Nucl. Sci. Tech. 2024, 35, 135. [Google Scholar] [CrossRef]
  7. Gong, H.; Cheng, S.; Chen, Z.; Li, Q. Data-Enabled Physics-Informed Machine Learning for Reduced-Order Modeling Digital Twin: Application to Nuclear Reactor Physics. Nucl. Sci. Eng. 2022, 196, 668–693. [Google Scholar] [CrossRef]
  8. Boehnlein, A.; Diefenthaler, M.; Sato, N.; Schram, M.; Ziegler, V.; Fanelli, C.; Hjorth-Jensen, M.; Horn, T.; Kuchera, M.P.; Lee, D.; et al. Colloquium: Machine Learning in Nuclear Physics. Rev. Mod. Phys. 2022, 94, 031003. [Google Scholar] [CrossRef]
  9. Adumene, S.; Islam, R.; Amin, M.T.; Nitonye, S.; Yazdi, M.; Johnson, K.T. Advances in Nuclear Power System Design and Fault-Based Condition Monitoring towards Safety of Nuclear-Powered Ships. Ocean Eng. 2022, 251, 111156. [Google Scholar] [CrossRef]
  10. Sandhu, H.K.; Bodda, S.S.; Gupta, A. A Future with Machine Learning: Review of Condition Assessment of Structures and Mechanical Systems in Nuclear Facilities. Energies 2023, 16, 2628. [Google Scholar] [CrossRef]
  11. Qi, S.; Han, B.; Zhu, X.; Yang, B.-W.; Xing, T.; Liu, A.; Liu, S. Machine Learning in Critical Heat Flux Studies in Nuclear Systems: A Detailed Review. Prog. Nucl. Energy 2025, 179, 105535. [Google Scholar] [CrossRef]
  12. Morgan, D.; Pilania, G.; Couet, A.; Uberuaga, B.P.; Sun, C.; Li, J. Machine Learning in Nuclear Materials Research. Curr. Opin. Solid State Mater. Sci. 2022, 26, 100975. [Google Scholar] [CrossRef]
  13. Ahmadi, G.; Jahangiri, A.; Ameri, M. The Effects of Transferred Heat and Wall Material on Thermal Behavior of a Nano-Grooved Micro-Heat Pipe, Molecular Dynamics Simulation. Eng. Anal. Bound. Elem. 2024, 160, 1–13. [Google Scholar] [CrossRef]
  14. Tian, W.; He, S.; Liu, Z.; Liu, W. Experimental Investigation of a Miniature Loop Heat Pipe with Eccentric Evaporator for Cooling Electronics. Appl. Therm. Eng. 2019, 159, 113982. [Google Scholar] [CrossRef]
  15. Liang, K.; Li, Z.; Chen, M.; Jiang, H. Comparisons between Heat Pipe, Thermoelectric System, and Vapour Compression Refrigeration System for Electronics Cooling. Appl. Therm. Eng. 2019, 146, 260–267. [Google Scholar] [CrossRef]
  16. Chen, G.; Tang, Y.; Wan, Z.; Zhong, G.; Tang, H.; Zeng, J. Heat Transfer Characteristic of an Ultra-Thin Flat Plate Heat Pipe with Surface-Functional Wicks for Cooling Electronics. Int. Commun. Heat Mass Transf. 2019, 100, 12–19. [Google Scholar] [CrossRef]
  17. Kong, D.; Kim, Y.; Kang, M.; Song, E.; Hong, Y.; Kim, H.S.; Rah, K.J.; Choi, H.G.; Agonafer, D.; Lee, H. A Holistic Approach to Thermal-Hydraulic Design of 3D Manifold Microchannel Heat Sinks for Energy-Efficient Cooling. Case Stud. Therm. Eng. 2021, 28, 101583. [Google Scholar] [CrossRef]
  18. Ritz, F.; Peterson, C.E. Multi-Mission Radioisotope Thermoelectric Generator (MMRTG) Program Overview. In Proceedings of the 2004 IEEE Aerospace Conference Proceedings (IEEE Cat. No. 04TH8720), Big Sky, MT, USA, 6–13 March 2004; IEEE: Big Sky, MT, USA, 2004; Volume 5, pp. 2950–2957. [Google Scholar]
  19. Sun, V.Z.; Sholes, S.; Stack, K.M.; Farley, K.; Del Sesto, T.; Kronyak, R.; Pyrzak, G.; Welch, R.; Lange, R. Evolution of the Mars 2020 Perseverance Rover’s Strategic Planning Process. In Proceedings of the 2024 IEEE Aerospace Conference, Big Sky, MT, USA, 2–9 March 2024; IEEE: Big Sky, MT, USA, 2024; pp. 1–16. [Google Scholar]
  20. Weaver, A.; DeMichael, T.; Woytach, J.; Fleurial, J.-P.; Birch, J.; Davis, S. The next Generation Radioisotope Thermoelectric Generator–Power for Future Deep Space Missions. In Proceedings of the 2023 IEEE Aerospace Conference, Big Sky, MT, USA, 4–11 March 2023; IEEE: Big Sky, MT, USA, 2023; pp. 1–9. [Google Scholar]
  21. Matthes, C.S.; Woerner, D.F.; Hendricks, T.J.; Fleurial, J.-P.; Oxnevad, K.I.; Barklay, C.D.; Zakrajsek, J.F. Next-Generation Radioisotope Thermoelectric Generator Study. In Proceedings of the 2018 IEEE Aerospace Conference, Big Sky, MT, USA, 3–10 March 2018; IEEE: Big Sky, MT, USA, 2018; pp. 1–9. [Google Scholar]
  22. Narayanan, V.; Liburdy, J.; Pence, D. Thermal Applications of Microchannel Flows. Encycl. Aerosp. Eng. 2010, 1–15. [Google Scholar] [CrossRef]
  23. Stauber, J.M.; Wilson, S.K.; Duffy, B.R.; Sefiane, K. Evaporation of Droplets on Strongly Hydrophobic Substrates. Langmuir 2015, 31, 3653–3660. [Google Scholar] [CrossRef]
  24. Zhang, J.; Borg, M.K.; Ritos, K.; Reese, J.M. Electrowetting Controls the Deposit Patterns of Evaporated Salt Water Nanodroplets. Langmuir 2016, 32, 1542–1549. [Google Scholar] [CrossRef]
  25. Plawsky, J.L.; Ojha, M.; Chatterjee, A.; Wayner, P.C. Review of the Effects of Surface Topography, Surface Chemistry, and Fluid Physics on Evaporation at the Contact Line. Chem. Eng. Commun. 2008, 196, 658–696. [Google Scholar] [CrossRef]
  26. Wang, B.-B.; Wang, X.-D.; Duan, Y.-Y.; Chen, M. Molecular Dynamics Simulation on Evaporation of Water and Aqueous Droplets in the Presence of Electric Field. Int. J. Heat Mass Transf. 2014, 73, 533–541. [Google Scholar] [CrossRef]
  27. Okuno, Y.; Minagawa, M.; Matsumoto, H.; Tanioka, A. Simulation Study on the Influence of an Electric Field on Water Evaporation. J. Mol. Struct. Theochem 2009, 904, 83–90. [Google Scholar] [CrossRef]
  28. Yesudasan, S. Thermal Dynamics of Heat Pipes with Sub-Critical Nanopores. arXiv 2024. [Google Scholar] [CrossRef]
  29. Yd, S.; Maroo, S.C. A New Algorithm for Contact Angle Estimation in Molecular Dynamics Simulations. In Proceedings of the ASME 2015 13th International Conference on Nanochannels, Microchannels, and Minichannels, San Francisco, CA, USA, 6–9 July 2015. [Google Scholar]
  30. Aboubakri, A.; Yanik, C.; Akkuş, Y.; Koşar, A.; Sadaghiani, A.K. Numerical and Experimental Investigation on Evaporation of Water Droplet on Surfaces With Mixed Wettability. In Proceedings of the ASME 2020 18th International Conference on Nanochannels, Microchannels, and Minichannels Collocated with the ASME 2020 Heat Transfer Summer Conference and the ASME 2020 Fluids Engineering Division Summer Meeting, Virtual, Online, 13–15 July 2020; American Society of Mechanical Engineers Digital Collection: New York, NY, USA, 2020. [Google Scholar]
  31. Zheng, R.-H.; Guan, W.-Z.; Zhang, S.-C.; Wei, W.-M. Water at Interfaces Investigated by Neural Network-Based Molecular Dynamics Simulation. J. Phys. Chem. C 2024, 128, 18082–18092. [Google Scholar] [CrossRef]
  32. Salarnia, M.; Toghraie, D.; Fazilati, M.A.; Mehmandoust, B.; Pirmoradian, M. The Effects of Different Nanoparticles on Physical and Thermal Properties of Water in a Copper Oscillating Heat Pipe via Molecular Dynamics Simulation. J. Taiwan Inst. Chem. Eng. 2023, 143, 104721. [Google Scholar] [CrossRef]
  33. Loche, P.; Bonthuis, D.J.; Netz, R.R. Molecular Dynamics Simulations of the Evaporation of Hydrated Ions from Aqueous Solution. Commun. Chem. 2022, 5, 55. [Google Scholar] [CrossRef] [PubMed]
  34. Skarbalius, G.; Džiugys, A.; Misiulis, E.; Navakas, R.; Vilkinis, P.; Šereika, J.; Pedišius, N. Molecular Dynamics Study on Water Flow Behaviour inside Planar Nanochannel Using Different Temperature Control Strategies. Energies 2021, 14, 6843. [Google Scholar] [CrossRef]
  35. Shahmardi, A.; Tammisola, O.; Chinappi, M.; Brandt, L. Effects of Surface Nanostructure and Wettability on Pool Boiling: A Molecular Dynamics Study. Int. J. Therm. Sci. 2021, 167, 106980. [Google Scholar] [CrossRef]
  36. Sakamaki, R.; Sum, A.K.; Narumi, T.; Ohmura, R.; Yasuoka, K. Thermodynamic Properties of Methane/Water Interface Predicted by Molecular Dynamics Simulations. J. Chem. Phys. 2011, 134, 144702. [Google Scholar] [CrossRef]
  37. Abascal, J.L.; Vega, C. A General Purpose Model for the Condensed Phases of Water: TIP4P/2005. J. Chem. Phys. 2005, 123, 234505. [Google Scholar] [CrossRef]
  38. Jorgensen, W.L.; Chandrasekhar, J.; Madura, J.D.; Impey, R.W.; Klein, M.L. Comparison of Simple Potential Functions for Simulating Liquid Water. J. Chem. Phys. 1983, 79, 926–935. [Google Scholar] [CrossRef]
  39. Misyura, S.Y.; Andryushchenko, V.A.; Morozov, V.S.; Smovzh, D.V. The Effect of Textured Surface on Graphene Wettability and Droplet Evaporation. J. Mater. Sci. 2022, 57, 1850–1862. [Google Scholar] [CrossRef]
  40. Lim, E.; Hong, X.; Tan, M.K.; Yu, H.; Wu, H.; Hung, Y.M. Distinctive Evaporation Characteristics of Water and Ethanol on Graphene Nanostructured Surfaces. Int. J. Heat Mass Transf. 2022, 183, 122174. [Google Scholar] [CrossRef]
  41. Chen, X.; Zhu, Y.-B.; Yu, H.; Liu, J.Z.; Easton, C.D.; Wang, Z.; Hu, Y.; Xie, Z.; Wu, H.-A.; Zhang, X.; et al. Ultrafast Water Evaporation through Graphene Membranes with Subnanometer Pores for Desalination. J. Membr. Sci. 2021, 621, 118934. [Google Scholar] [CrossRef]
  42. Gan, J.S.; Yu, H.; Tan, M.K.; Soh, A.K.; Wu, H.A.; Hung, Y.M. Performance Enhancement of Graphene-Coated Micro Heat Pipes for Light-Emitting Diode Cooling. Int. J. Heat Mass Transf. 2020, 154, 119687. [Google Scholar] [CrossRef]
  43. Jaikumar, A.; Rishi, A.; Gupta, A.; Kandlikar, S.G. Microscale Morphology Effects of Copper–Graphene Oxide Coatings on Pool Boiling Characteristics. J. Heat Transf. 2017, 139, 111509. [Google Scholar] [CrossRef]
  44. Wei, N.; Lv, C.; Xu, Z. Wetting of Graphene Oxide: A Molecular Dynamics Study. Langmuir 2014, 30, 3572–3578. [Google Scholar] [CrossRef]
  45. Pihlajamäki, A.; Matus, M.F.; Malola, S.; Häkkinen, H. GraphBNC: Machine Learning-Aided Prediction of Interactions Between Metal Nanoclusters and Blood Proteins. Adv. Mater. 2024, 36, 2407046. [Google Scholar] [CrossRef]
  46. Groß, A.; Sakong, S. Ab Initio Simulations of Water/Metal Interfaces. Chem. Rev. 2022, 122, 10746–10776. [Google Scholar] [CrossRef]
  47. Li, P.; Huang, J.; Hu, Y.; Chen, S. Establishment of the Potential of Zero Charge of Metals in Aqueous Solutions: Different Faces of Water Revealed by Ab Initio Molecular Dynamics Simulations. J. Phys. Chem. C 2021, 125, 3972–3979. [Google Scholar] [CrossRef]
  48. Carrasco, J.; Hodgson, A.; Michaelides, A. A Molecular Perspective of Water at Metal Interfaces. Nat. Mater. 2012, 11, 667–674. [Google Scholar] [CrossRef]
  49. Zhu, S.-B. Interactions of Water, Ions, and Atoms with Metal Surfaces. Surf. Sci. 1995, 329, 276–284. [Google Scholar] [CrossRef]
  50. Zhu, S.-B.; Philpott, M.R. Interaction of Water with Metal Surfaces. J. Chem. Phys. 1994, 100, 6961–6968. [Google Scholar] [CrossRef]
  51. Hirel, P. Atomsk: A Tool for Manipulating and Converting Atomic Data Files. Comput. Phys. Commun. 2015, 197, 212–219. [Google Scholar] [CrossRef]
  52. Straumanis, M.E.; Yu, L.S. Lattice Parameters, Densities, Expansion Coefficients and Perfection of Structure of Cu and of Cu–In α Phase. Found. Crystallogr. 1969, 25, 676–682. [Google Scholar] [CrossRef]
  53. Sinha, S.K. Lattice Dynamics of Copper. Phys. Rev. 1966, 143, 422–433. [Google Scholar] [CrossRef]
  54. Jona, F.; Marcus, P.M. Structural Properties of Copper. Phys. Rev. B 2001, 63, 094113. [Google Scholar] [CrossRef]
  55. Davis, H.L.; Faulkner, J.S.; Joy, H.W. Calculation of the Band Structure for Copper as a Function of Lattice Spacing. Phys. Rev. 1968, 167, 601–607. [Google Scholar] [CrossRef]
  56. Davey, W.P. Precision Measurements of the Lattice Constants of Twelve Common Metals. Phys. Rev. 1925, 25, 753–761. [Google Scholar] [CrossRef]
  57. YD, S.; Maroo, S.C. Origin of Surface-Driven Passive Liquid Flows. Langmuir 2016, 32, 8593–8597. [Google Scholar] [CrossRef]
  58. Thompson, A.P.; Aktulga, H.M.; Berger, R.; Bolintineanu, D.S.; Brown, W.M.; Crozier, P.S.; In’t Veld, P.J.; Kohlmeyer, A.; Moore, S.G.; Nguyen, T.D. LAMMPS-a Flexible Simulation Tool for Particle-Based Materials Modeling at the Atomic, Meso, and Continuum Scales. Comput. Phys. Commun. 2022, 271, 108171. [Google Scholar] [CrossRef]
  59. Hammonds, K.D.; Ryckaert, J.-P. On the Convergence of the SHAKE Algorithm. Comput. Phys. Commun. 1991, 62, 336–351. [Google Scholar] [CrossRef]
  60. Andersen, H.C. Rattle: A “Velocity” Version of the Shake Algorithm for Molecular Dynamics Calculations. J. Comput. Phys. 1983, 52, 24–34. [Google Scholar] [CrossRef]
  61. Lee, B.-J.; Ko, W.-S.; Kim, H.-K.; Kim, E.-H. The Modified Embedded-Atom Method Interatomic Potentials and Recent Progress in Atomistic Simulations. Calphad 2010, 34, 510–522. [Google Scholar] [CrossRef]
  62. Lee, B.-J.; Baskes, M.I. Second Nearest-Neighbor Modified Embedded-Atom-Method Potential. Phys. Rev. B 2000, 62, 8564–8567. [Google Scholar] [CrossRef]
  63. Baskes, M.I. Determination of Modified Embedded Atom Method Parameters for Nickel. Mater. Chem. Phys. 1997, 50, 152–158. [Google Scholar] [CrossRef]
  64. Baskes, M.I. Modified Embedded-Atom Potentials for Cubic Materials and Impurities. Phys. Rev. B 1992, 46, 2727–2742. [Google Scholar] [CrossRef]
  65. Shi, B.; Dhir, V.K. Molecular Dynamics Simulation of the Contact Angle of Liquids on Solid Surfaces. J. Chem. Phys. 2009, 130, 034705. [Google Scholar] [CrossRef]
  66. Węglarczyk, S. Kernel Density Estimation and Its Application. In Proceedings of the ITM Web of Conferences, Aviemore, Scotland, 2–3 May 2018; EDP Sciences: Les Ulis, France; Volume 23, p. 00037. [Google Scholar]
  67. Chen, Y.-C. A Tutorial on Kernel Density Estimation and Recent Advances. Biostat. Epidemiol. 2017, 1, 161–187. [Google Scholar] [CrossRef]
  68. Elhorst, J.P. Matlab Software for Spatial Panels. Int. Reg. Sci. Rev. 2014, 37, 389–405. [Google Scholar] [CrossRef]
  69. Chen, Y.-C. Molecular Dynamics Study of Phase Change and Interfacial Behavior in Nanoconfined Argon. Master’s Thesis, Southern Methodist University, Dallas, TX, USA, 2025. [Google Scholar]
  70. Eyupoglu, C. Implementation of Bernsen’s Locally Adaptive Binarization Method for Gray Scale Images. Online J. Sci. Technol. 2017, 7, 68–72. [Google Scholar]
  71. Chernov, N.; Lesort, C. Least Squares Fitting of Circles. J. Math. Imaging Vis. 2005, 23, 239–252. [Google Scholar] [CrossRef]
  72. Bickel, P.J.; Doksum, K.A. Mathematical Statistics: Basic Ideas and Selected Topics; Volumes I-II Package; Chapman and Hall/CRC: Boca Raton, FL, USA, 2015. [Google Scholar]
  73. James, G.; Witten, D.; Hastie, T.; Tibshirani, R. An Introduction to Statistical Learning; Springer Texts in Statistics; Springer: New York, NY, USA, 2013; ISBN 978-1-4614-7137-0. [Google Scholar]
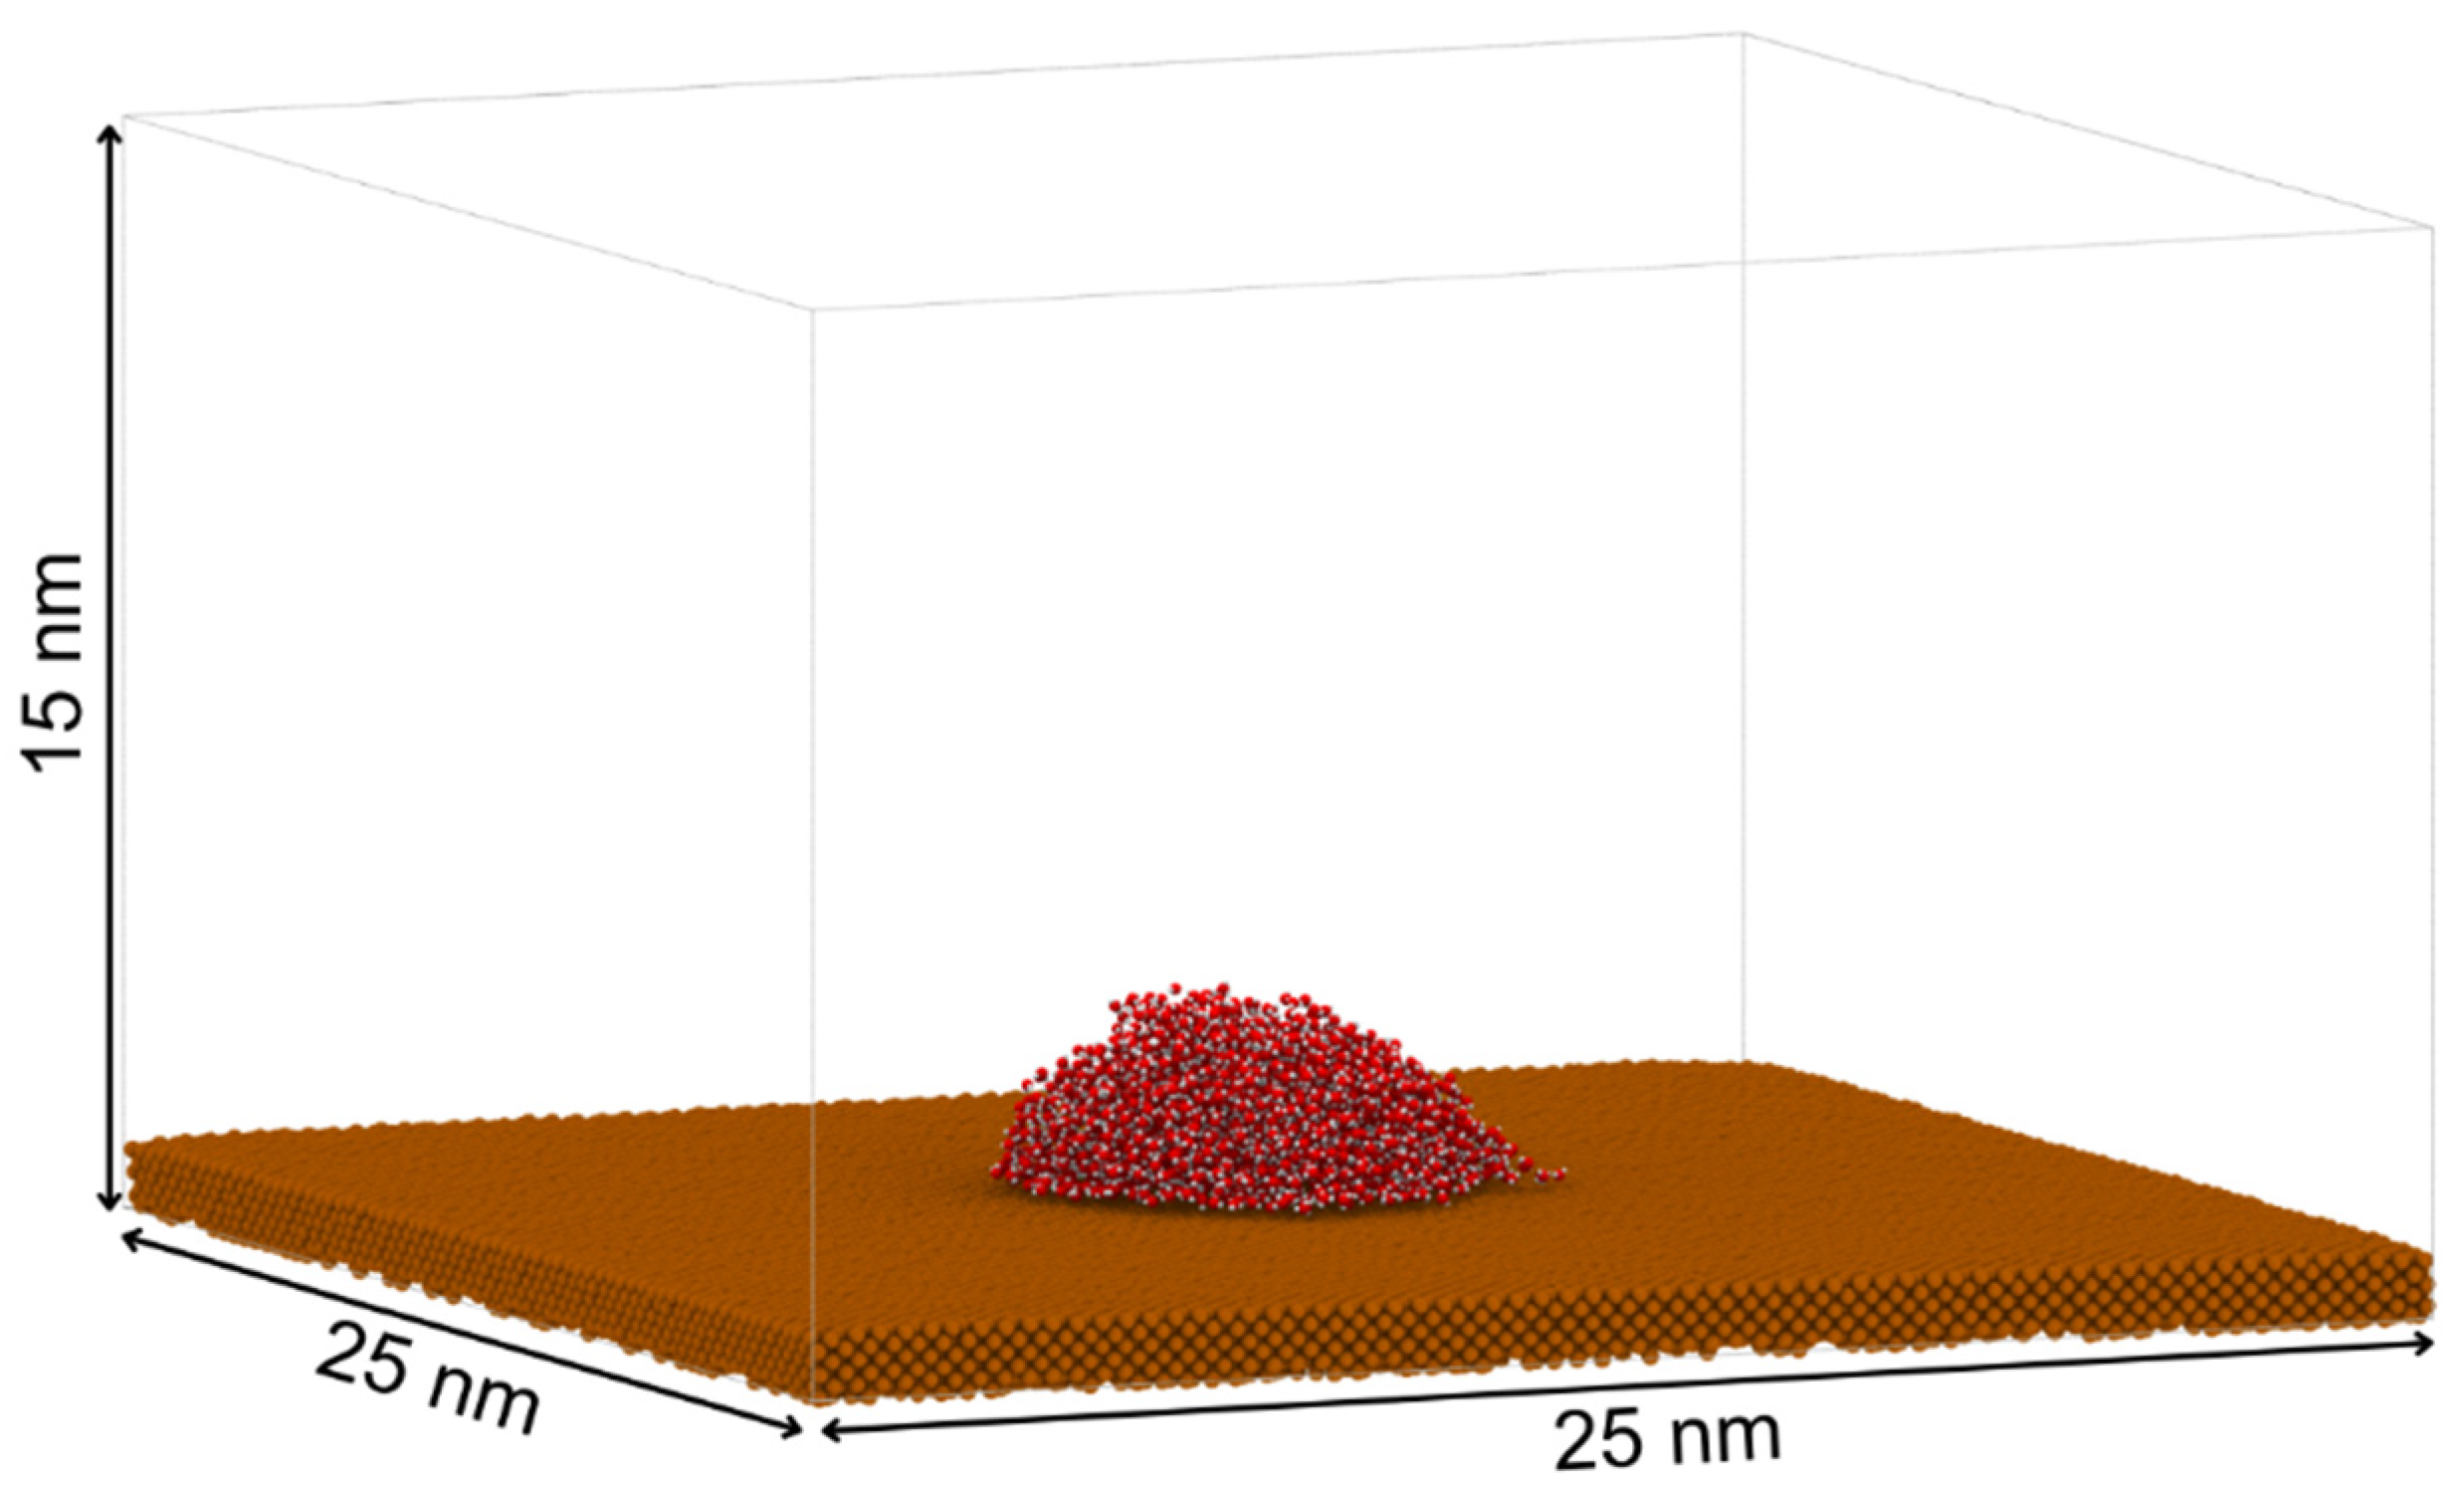
Figure 1. Equilibrated configuration of a 5 nm × 5 nm × 5 nm TIP4P/2005 water droplet placed on a 1 nm thick copper substrate (25 nm × 25 nm) within a simulation box of 15 nm height.
Jne 06 00043 g001
Figure 2. Visualization of the liquid–vapor interface obtained by applying a density threshold (step 2) to a two-dimensional density map for the selected simulation frame, highlighting the phase boundary in the droplet profile. The red region in the center corresponds to higher density of water and the blue region in the outside of droplet shows vapor region.
Jne 06 00043 g002
Figure 3. Two-dimensional density map of a droplet showing the liquid–vapor interface (black dashed line) extracted using a density threshold, enabling precise determination of the droplet’s contact angle. The red region in the center corresponds to higher density of water and the blue region in the outside of droplet shows vapor region.
Jne 06 00043 g003
Figure 4. Determination of droplet contact angle from the two-dimensional density map by fitting a tangent line to the liquid–vapor interface (black dashed line) at the contact point with the surface. The red region in the center corresponds to higher density of water and the blue region in the outside of droplet shows vapor region.
Jne 06 00043 g004
Figure 5. Measured water contact angle on a copper surface as a function of interaction energy ( ε O C u ). The results show a sharp decrease in contact angle with increasing ε O C u , indicating a transition from hydrophobic to highly hydrophilic behavior at higher interaction strengths.
Jne 06 00043 g005
Figure 6. Variation in water contact angle on a copper surface as a function of interaction energy (ε) obtained from molecular dynamics simulations. Higher interaction energies result in stronger wetting behavior, as indicated by the decreasing contact angle.
Jne 06 00043 g006
Figure 7. Schematic representation of the molecular dynamics simulation setup for water confined in a copper nanochannel using the TIP4P/2005 water model. The system consists of a 2 nm reservoir, seven sequential channel sections (blue: channels 1–3; red: channels 4–7), and five vapor regions, followed by a cooling region. The copper walls are shown in brown, and water molecules are shown in red/white. The spatial divisions (in nm) indicate the lengths of each region used for analysis of transport and phase behavior.
Jne 06 00043 g007
Figure 8. Snapshots of molecular dynamics simulations showing water confined in a copper nanochannel at temperatures ranging from 300 K to 600 K. As the temperature increases, the extent of evaporation and vapor-phase water molecules (red) above the liquid column becomes more pronounced.
Jne 06 00043 g008
Figure 9. (af) Variation in water mass density within Channels 2–7 as a function of simulation time for seven system temperatures (300–600 K). The density curves are smoothed using a 20 ps moving average. At lower temperatures (300–400 K), the density remains nearly constant, close to the equilibrium liquid density of confined water (~0.85–0.88 g/cm3), showing negligible evaporation. As the temperature increases beyond 450 K, the liquid density exhibits a monotonic decline, especially pronounced in Channels 5–7, which are closer to the vapor outlet—indicating progressive evaporation and liquid depletion in those regions. At the highest temperatures (550–600 K), the rapid decrease in density during the first 100–150 ps corresponds to vigorous evaporation near the interface, followed by gradual stabilization at lower steady-state values.
Jne 06 00043 g009
Figure 10. (ae) Mass density of water in the five vapor sub-regions (Vapor 1–5) as a function of simulation time for seven temperatures (300–600 K; legend). Curves are moving-averaged with a window of 2.5   p s . Densities near the channel exit (Vapor 1) are highest and rise more quickly, while regions farther from the outlet (Vapor 3–5) remain more rarefied except at the highest temperatures, where the density grows steadily (notably at 600 K). (f) Schematic of the domain showing the channel outlet (Channel 6–7) and the vapor partitions used for analysis: Vapors 1–4 are 1 nm thick slabs immediately outside the outlet; Vapor 5 spans the remaining far-field region (~5.4 nm). Dashed lines mark sub-region boundaries.
Jne 06 00043 g010
Figure 11. Mean mass density distribution across liquid and vapor regions at different temperatures. (a) Mean density averaged over the initial 50 frames (early simulation stage). (b) Mean density averaged over the final 50 frames (steady-state stage). Each curve represents a different system temperature ranging from 300 K to 600 K.
Jne 06 00043 g011
Figure 12. Temporal evolution of total evaporation rate within the channel at different temperatures. Instantaneous mass evaporation rate (in ng/s) computed from the time derivative of total water molecules inside the channel region for seven temperatures (300–600 K). The curves are smoothed over a 20 ps window for clarity.
Jne 06 00043 g012
Table 1. Comparison between simulation and experimental contact angles for different ε values.
Eps (kcal/mol)Contact Angle (°)Std. Dev. (°)Experimental WCA (°)
0.283.485.2882.3
0.2276.914.51
0.2466.012.72
0.2654.423.250.2
0.2848.273.11
Disclaimer/Publisher’s Note: The statements, opinions and data contained in all publications are solely those of the individual author(s) and contributor(s) and not of MDPI and/or the editor(s). MDPI and/or the editor(s) disclaim responsibility for any injury to people or property resulting from any ideas, methods, instructions or products referred to in the content.