1. Introduction
The two-phase flow phenomenon is prevalent in power, petroleum, chemical, and other industrial processes [
1], especially in nuclear power plants. Major equipment like nuclear reactors and steam generators often exhibit two-phase flow [
2]. In conventional light water reactors, a loss of coolant accident (LOCA), typically caused by a pipe rupture, is a baseline design accident [
3]. During an accident, depressurization, vaporization, or flashover may cause bubbles to form in the reactor core, degrading heat transfer in the fuel elements. Plate fuel elements typically have coolant channels with a gap thickness of 1–3 mm [
4]. These channels exhibit distinct thermo-hydraulic characteristics due to the narrow channel effect [
5].
Researchers have extensively studied bubble behavior through experiments and simulations. Milad studied the flow of cavitation bubbles in cylindrical narrow gaps during rapid expansion and collapse using the volume of fluid (VOF) method [
6]. Zhang and Zhou conducted gas injection experiments in various solutions to measure individual bubble drag coefficients [
7]. Cerqueira modeled the free rise of bubbles in water [
8] but did not consider the effect of the friction of the walls on the bubbles.
In order to study the bubble motion characteristics in a narrow channel, this paper presents experimental measurements of a single bubble’s ascent in static water over a rectangular region with varying gap dimensions. We also discuss the effect of the injection flow rate and gap distance on bubble parameters (trajectory, shape, velocity). A two-dimensional VOF model coupled with a porous medium model was used to simulate bubble rise velocity. This model includes Darcy’s law to account for inner wall friction. Computational results align with experimental findings, demonstrating the simulation method’s feasibility.
2. Experimental Equipment and Methods
As shown in
Figure 1, this paper presents an experimental platform designed to visualize bubble motion behavior in a gas–liquid system. The main components of the experimental platform are a syringe pump, a narrow channel, a high-speed camera system, and a lighting system. To facilitate the visualization of bubble motion, the narrow channel is made of transparent plexiglass, with three different gap spacings of 100 mm × 200 mm × 2 mm, 100 mm × 200 mm × 3 mm, and 100 mm × 200 mm × 5 mm. The gas flow rate is controlled by adjusting the advancement speed of the syringe pump and ultimately, the gas escapes from the injection needle (with an inner diameter of 1 mm) at the center of the bottom of the narrow channel to generate bubbles.
In this experiment, water served as the liquid phase and air as the gas phase. As shown in
Table 1, a syringe pump is utilized as the gas delivery system, which allows for the setting of gas injection flow rates. The gas injection velocity can be calculated based on the pipe and needle diameter. The following working condition experiments were carried out by varying the conditions of gap distance and the gas injection flow rate. A high-speed video camera captured bubble growth at an acquisition rate of 250 fps. The captured images were transferred to a computer via data transmission and analyzed using digital image processing methods to obtain the instantaneous speed, trajectory, and other parameters of bubble movement.
3. Analysis of Experimental Data
To obtain characteristic parameters such as bubble speed, aspect ratio, and trajectory, post-processing of the captured bubble images is necessary. The steps include (1) background removal, which subtracts the background image from the bubble image without bubble flow; (2) denoising using Gaussian filtering to eliminate random noise; (3) binarization by selecting an appropriate threshold to separate the bubble region from the background; and (4) extraction of characteristic parameters such as the bubble silhouette and center using image recognition software.
The geometric center of the bubble can be determined by averaging the coordinates of all pixel points that belong to the same bubble in the binarized image. The coordinates of the geometric center are calculated using the following formula:
where
and
are the horizontal and vertical coordinates of each pixel in the bubble region, respectively; N is the total number of pixels in the bubble region; Ω is the set of pixels in the same bubble; and
and
are the horizontal and vertical coordinates of the bubble center, respectively. The bubble deforms as it rises in water, and the degree of deformation is evaluated using the aspect ratio, which is the ratio of the long axis to the short axis of the bubble.
Here, the length of the long axis () is the longest distance between points at the edge of the bubble and the length of the short axis () is the distance between two points where a line perpendicular to the long axis intersects the bubble’s edge. For a round bubble, E (aspect ratio) is one. Thus, the closer E is to one, the closer the bubble is to a circle and the less deformed it is; a larger E indicates more significant deformation.
Finally, the bubble rise velocity is considered. In two-phase flow systems, bubble velocity is a key parameter in studying bubble motion. It is calculated by the following equation:
where
is the horizontal component of bubble velocity,
is the vertical component of bubble velocity,
is the overall bubble velocity,
and
are the horizontal and vertical coordinates of the bubble center at time
t, and
and
are the coordinates at time
, respectively.
4. Numerical Modeling and Methods
The wavefront tracking method, level set method, and volume of fluid (VOF) method are the three main approaches currently used to study gas–liquid multiphase flow problems at sharp interfaces [
9]. The VOF method is accepted by many scholars due to its interface capturing ability, small numerical dissipation, and high efficiency [
10,
11]; therefore, the VOF method is used in this study.
4.1. Conservation Equations
The following assumptions are made: (1) two-phase flow occurs under isothermal and adiabatic conditions; (2) the gas and liquid phases are incompressible Newtonian fluids; (3) the two-phase flow system, separated by the gas–liquid interface, is considered a single-phase flow system. The equations for the conservation of mass and momentum are as follows:
where
is the fluid density,
and
are the distances of motion in the i and j directions,
and
are the velocity vectors in the i and j directions,
is the pressure,
is the dynamic viscosity,
is the gravitational acceleration, and
is the volume force.
In the VOF model, different fluids share a common set of governing equations. A phase volume fraction function
is introduced to track the phase interface. The volume fraction equation is expressed as
The continuous surface tension model (CFS) proposed by Brackbill et al. [
12] is used to describe the surface tension at the gas–liquid interface, translating it into a volumetric force that controls the volume.
where
is the coefficient of surface tension and
is the surface curvature.
is an additional gap wall friction source term, which can be described by Poiseuille’s law [
13].
where
is the gap size; the additional gap-averaged pressure drop in the narrow gap is linearly related to the gap-averaged velocity. In the numerical simulation, Darcy’s law [
14] calculates the gap wall friction, considering the similarity between the narrow gap wall resistance and the porous medium wall resistance. Darcy’s law equation for porous media resistance is as follows:
where
is the viscous resistance. By comparing the equations above, the flow of bubbles in a narrow channel can be considered as a two-dimensional flow in a porous medium, whereby the viscous resistance in the narrow channel
is equal to
The viscous resistance value can be adjusted by to adjust the value of viscous resistance, which can simulate the behavior of bubbles with different gap thicknesses.
4.2. Conditions of the Simulation
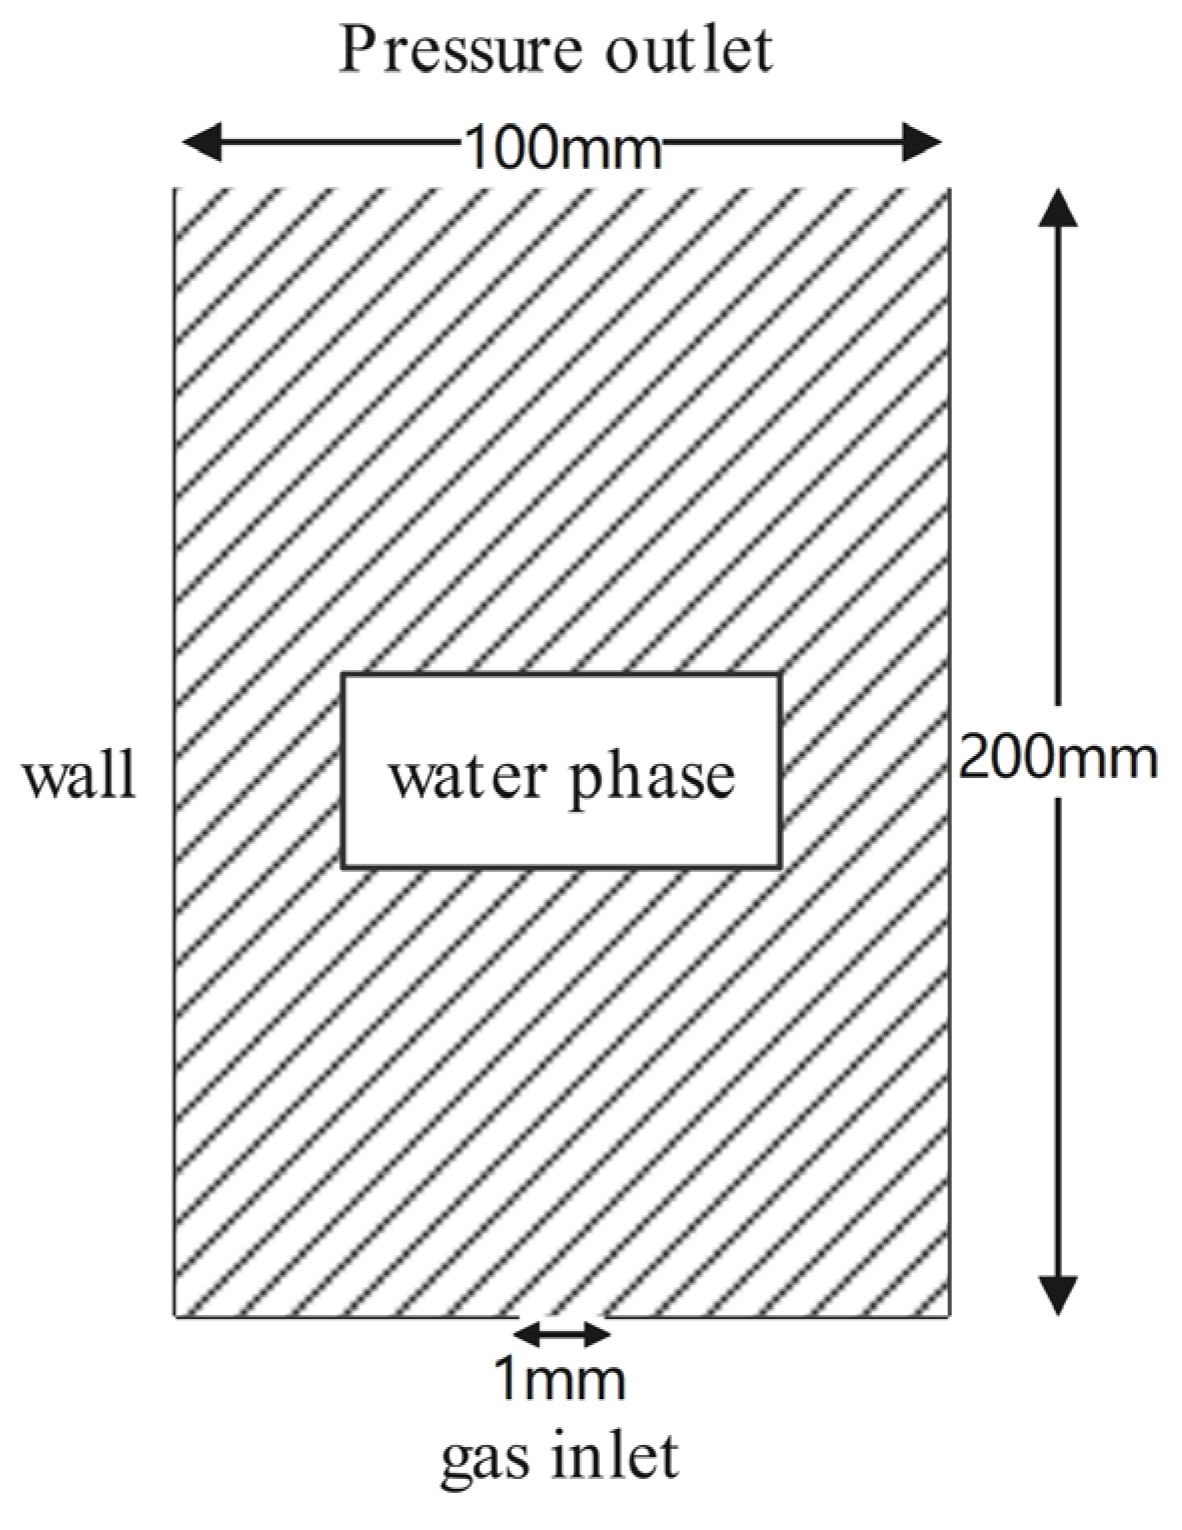
As shown in
Figure 2, the computational domain of the simulated fluid is a two-dimensional rectangular flow area with a height of 200 mm and a width of 100 mm. The entire fluid domain is filled with water (ρ = 998 kg/m
3, μ = 0.001 Pa·s, σ = 0.072 N/m). The top of the fluid domain features a pressure outlet in contact with the atmosphere, the bottom has a velocity inlet with an injection needle width of 1 mm, and the rest of the domain consists of non-slip walls. The simulated grid adopts a quadrilateral grid, with each grid sized at 0.2 mm × 0.2 mm, and the total grid nodes in the entire fluid domain reaches 140,000. The bubble rises in stationary water. Since the Reynolds number of the unit grid is relatively small, a laminar flow model is chosen here. The SIMPLE algorithm was applied to solve the equations. An explicit geometric reconstruction scheme was used to solve the volume fraction equation. The numerical residual is 0.001, and the time step is 0.0001 s.
4.3. Mesh Independence Verification
To minimize the impact of mesh quantity on simulation results, mesh independence verification was conducted. Under the conditions of a 3 mm gap and a gas injection rate of 2.8 mL/min, the stable velocity achieved by a single rising bubble was used as a reference. Numerical simulations were performed to calculate bubble velocity using different grid nodes. As shown in
Figure 3, when the mesh quantity reached around 140,000, the variation in calculation results slowed down as the mesh quantity increased, with a relative error of less than 3%. Therefore, to save computational resources while considering calculation accuracy, a mesh quantity of 140,000 was chosen for the simulation calculations.
5. Results and Discussion
5.1. Comparison of Simulation and Experimental Results
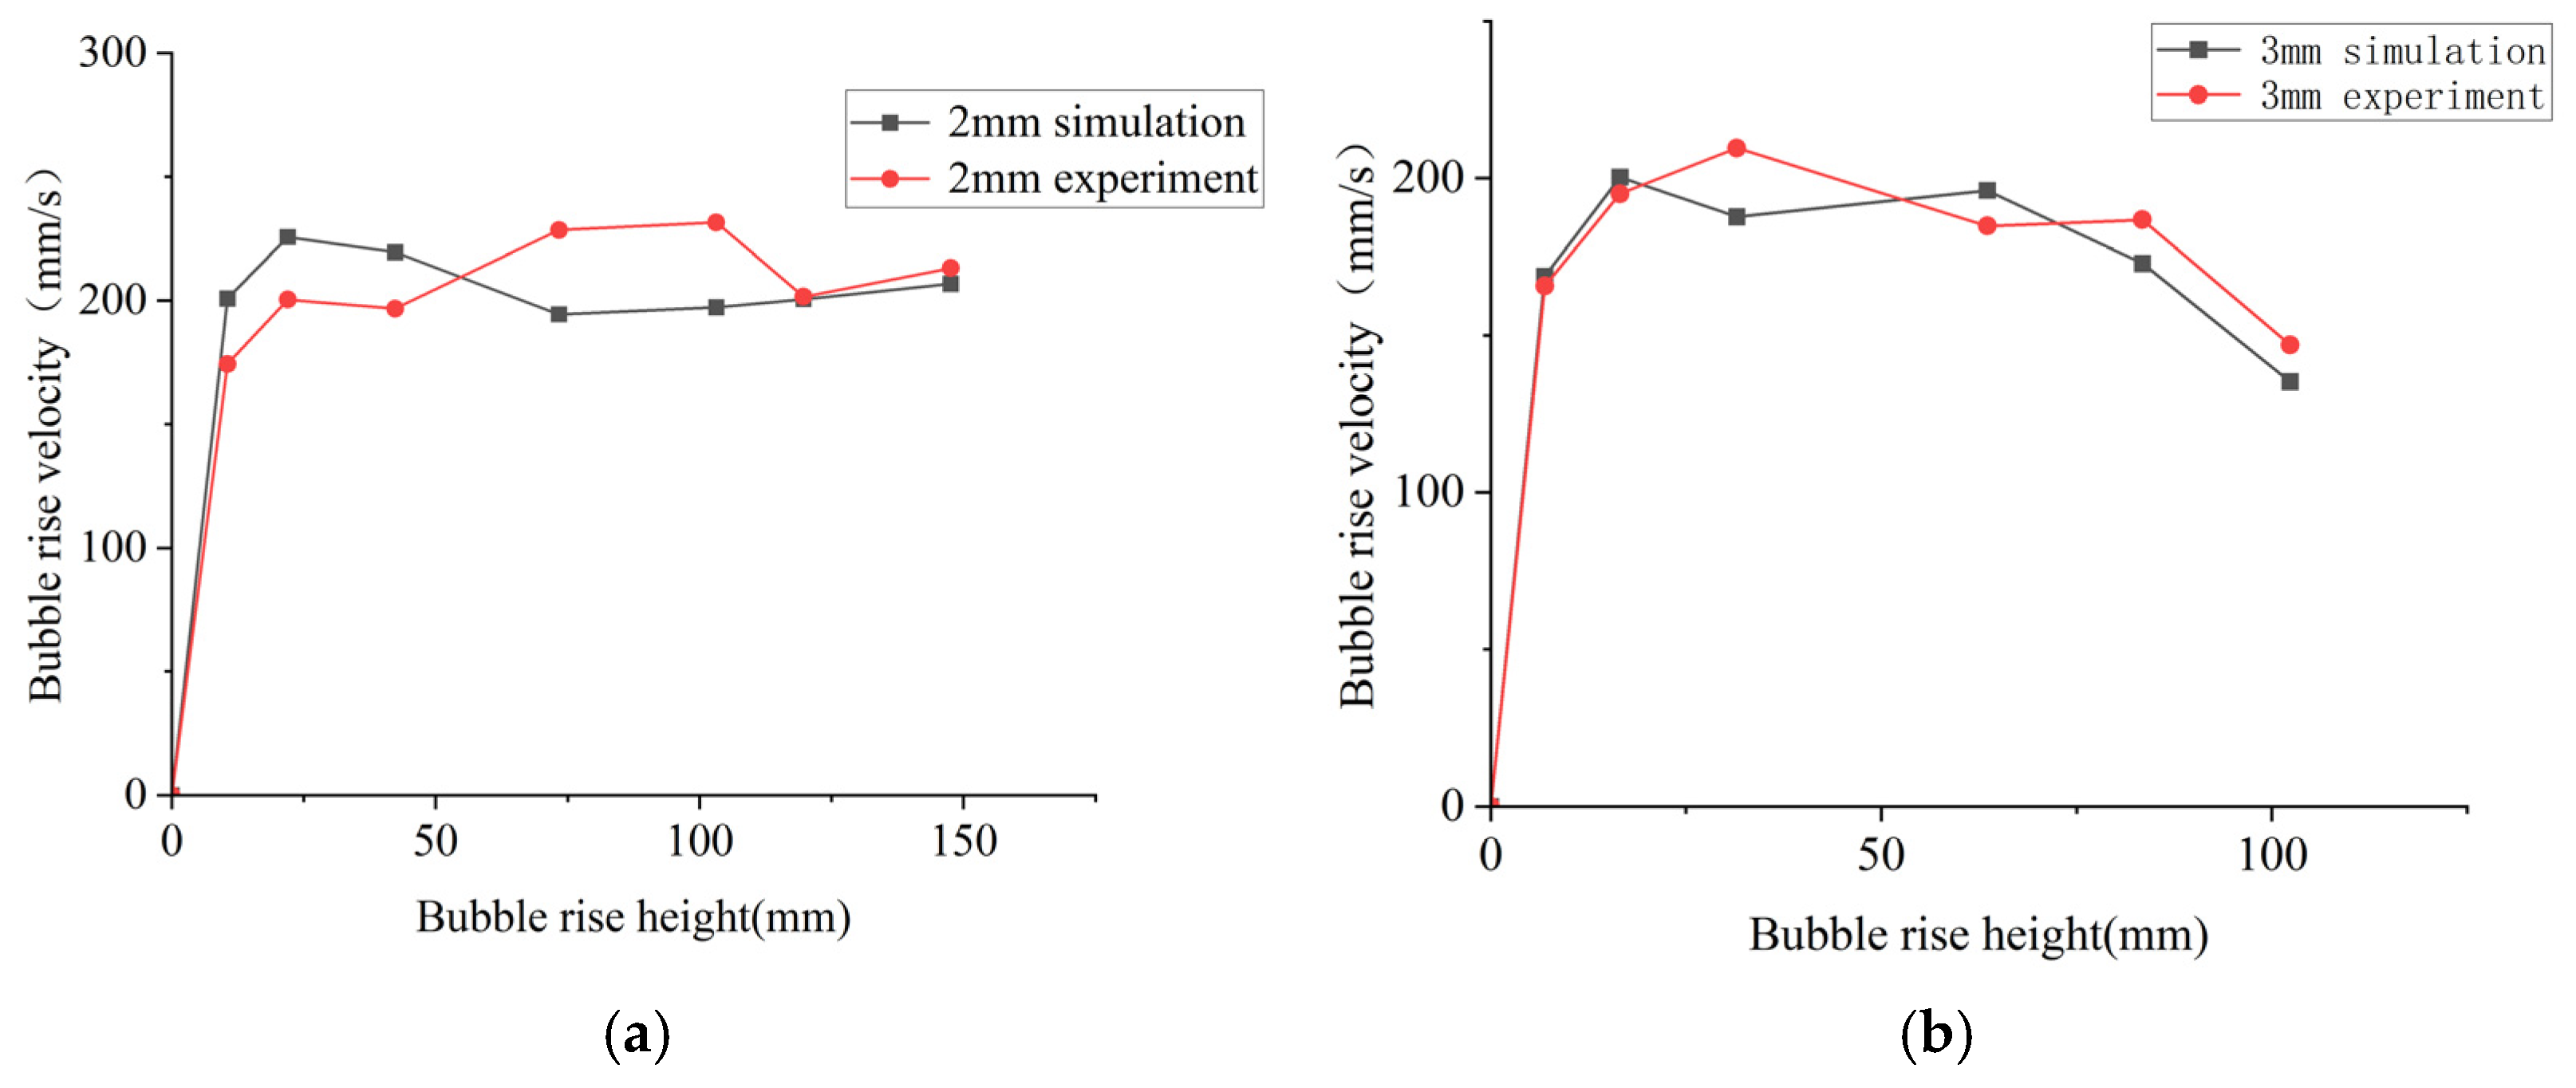
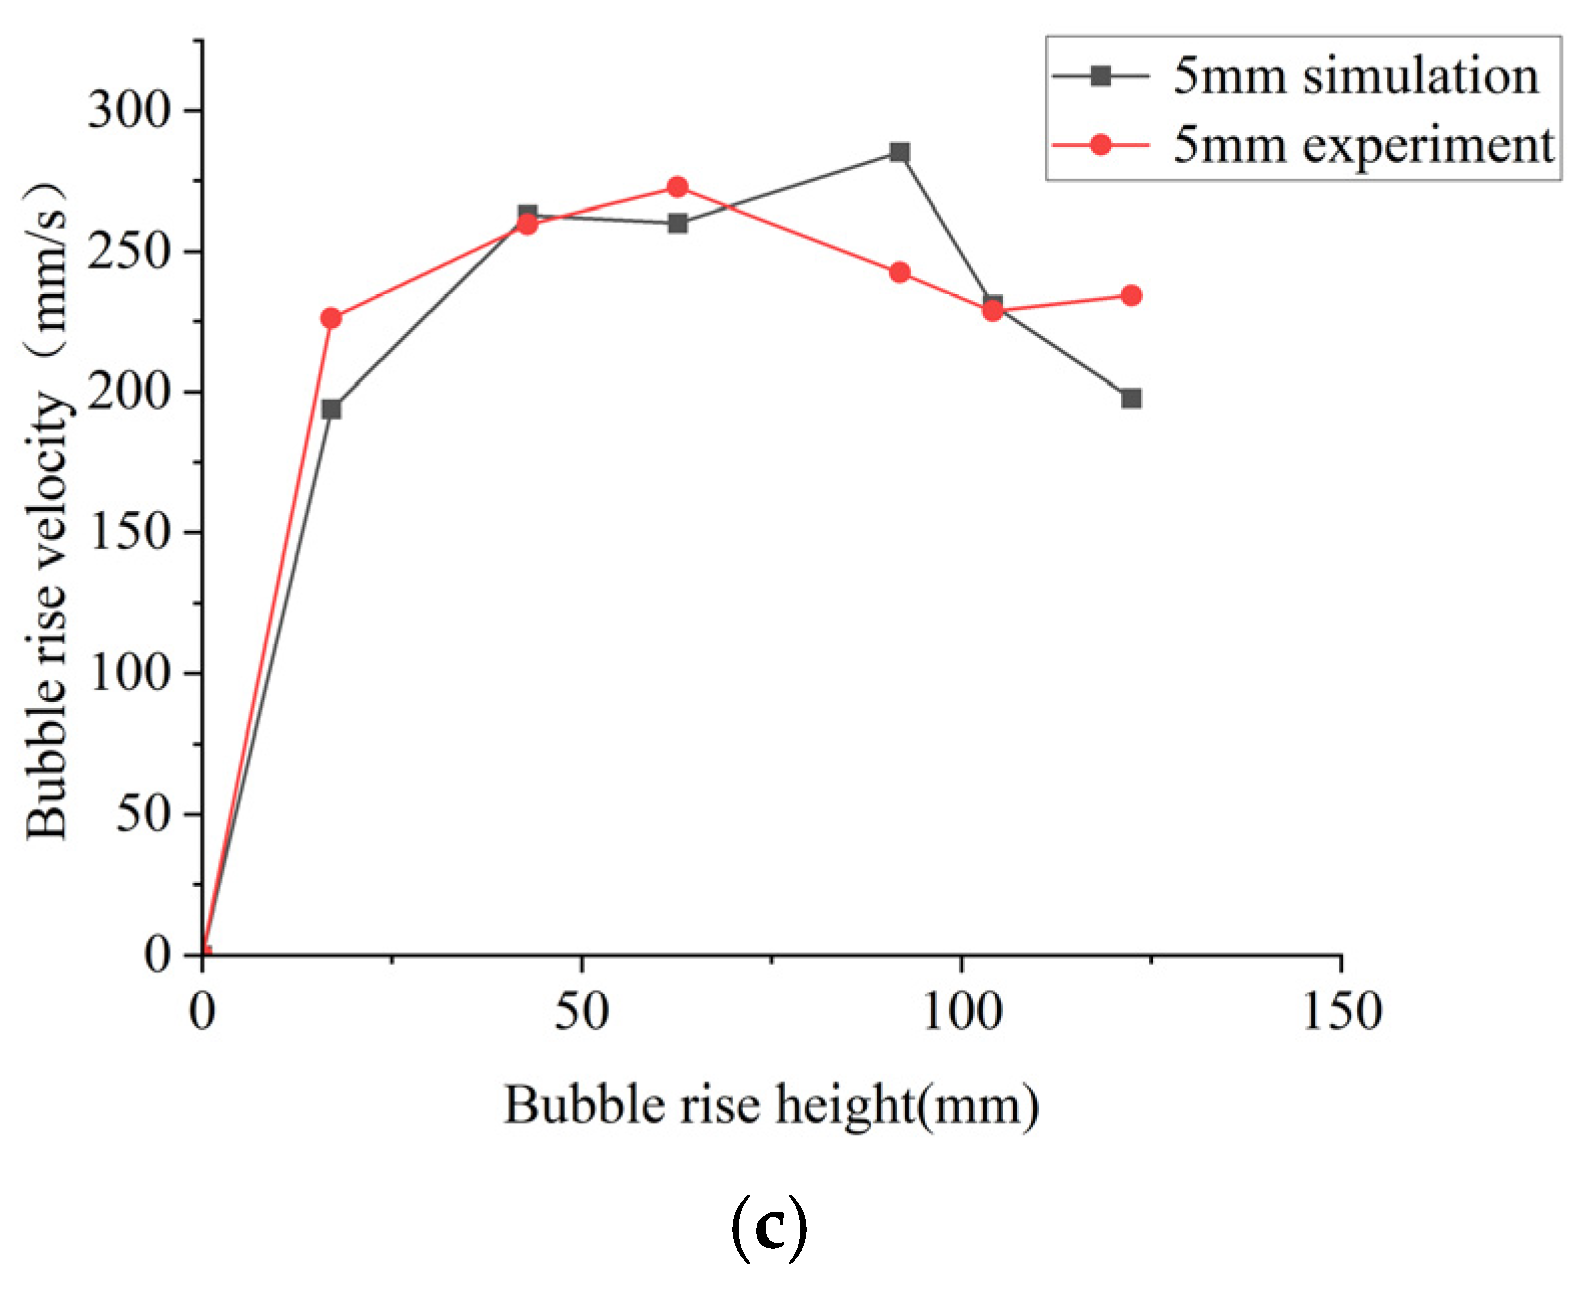
In this section, three different gap conditions (2 mm, 3 mm, and 5 mm) are simulated with a gas injection rate of 5.7 mL/min. The comparison of the calculated results with the experiments is shown in
Figure 4. The simulated bubble velocity agrees well with the experimental results, with a maximum error of about 17%.
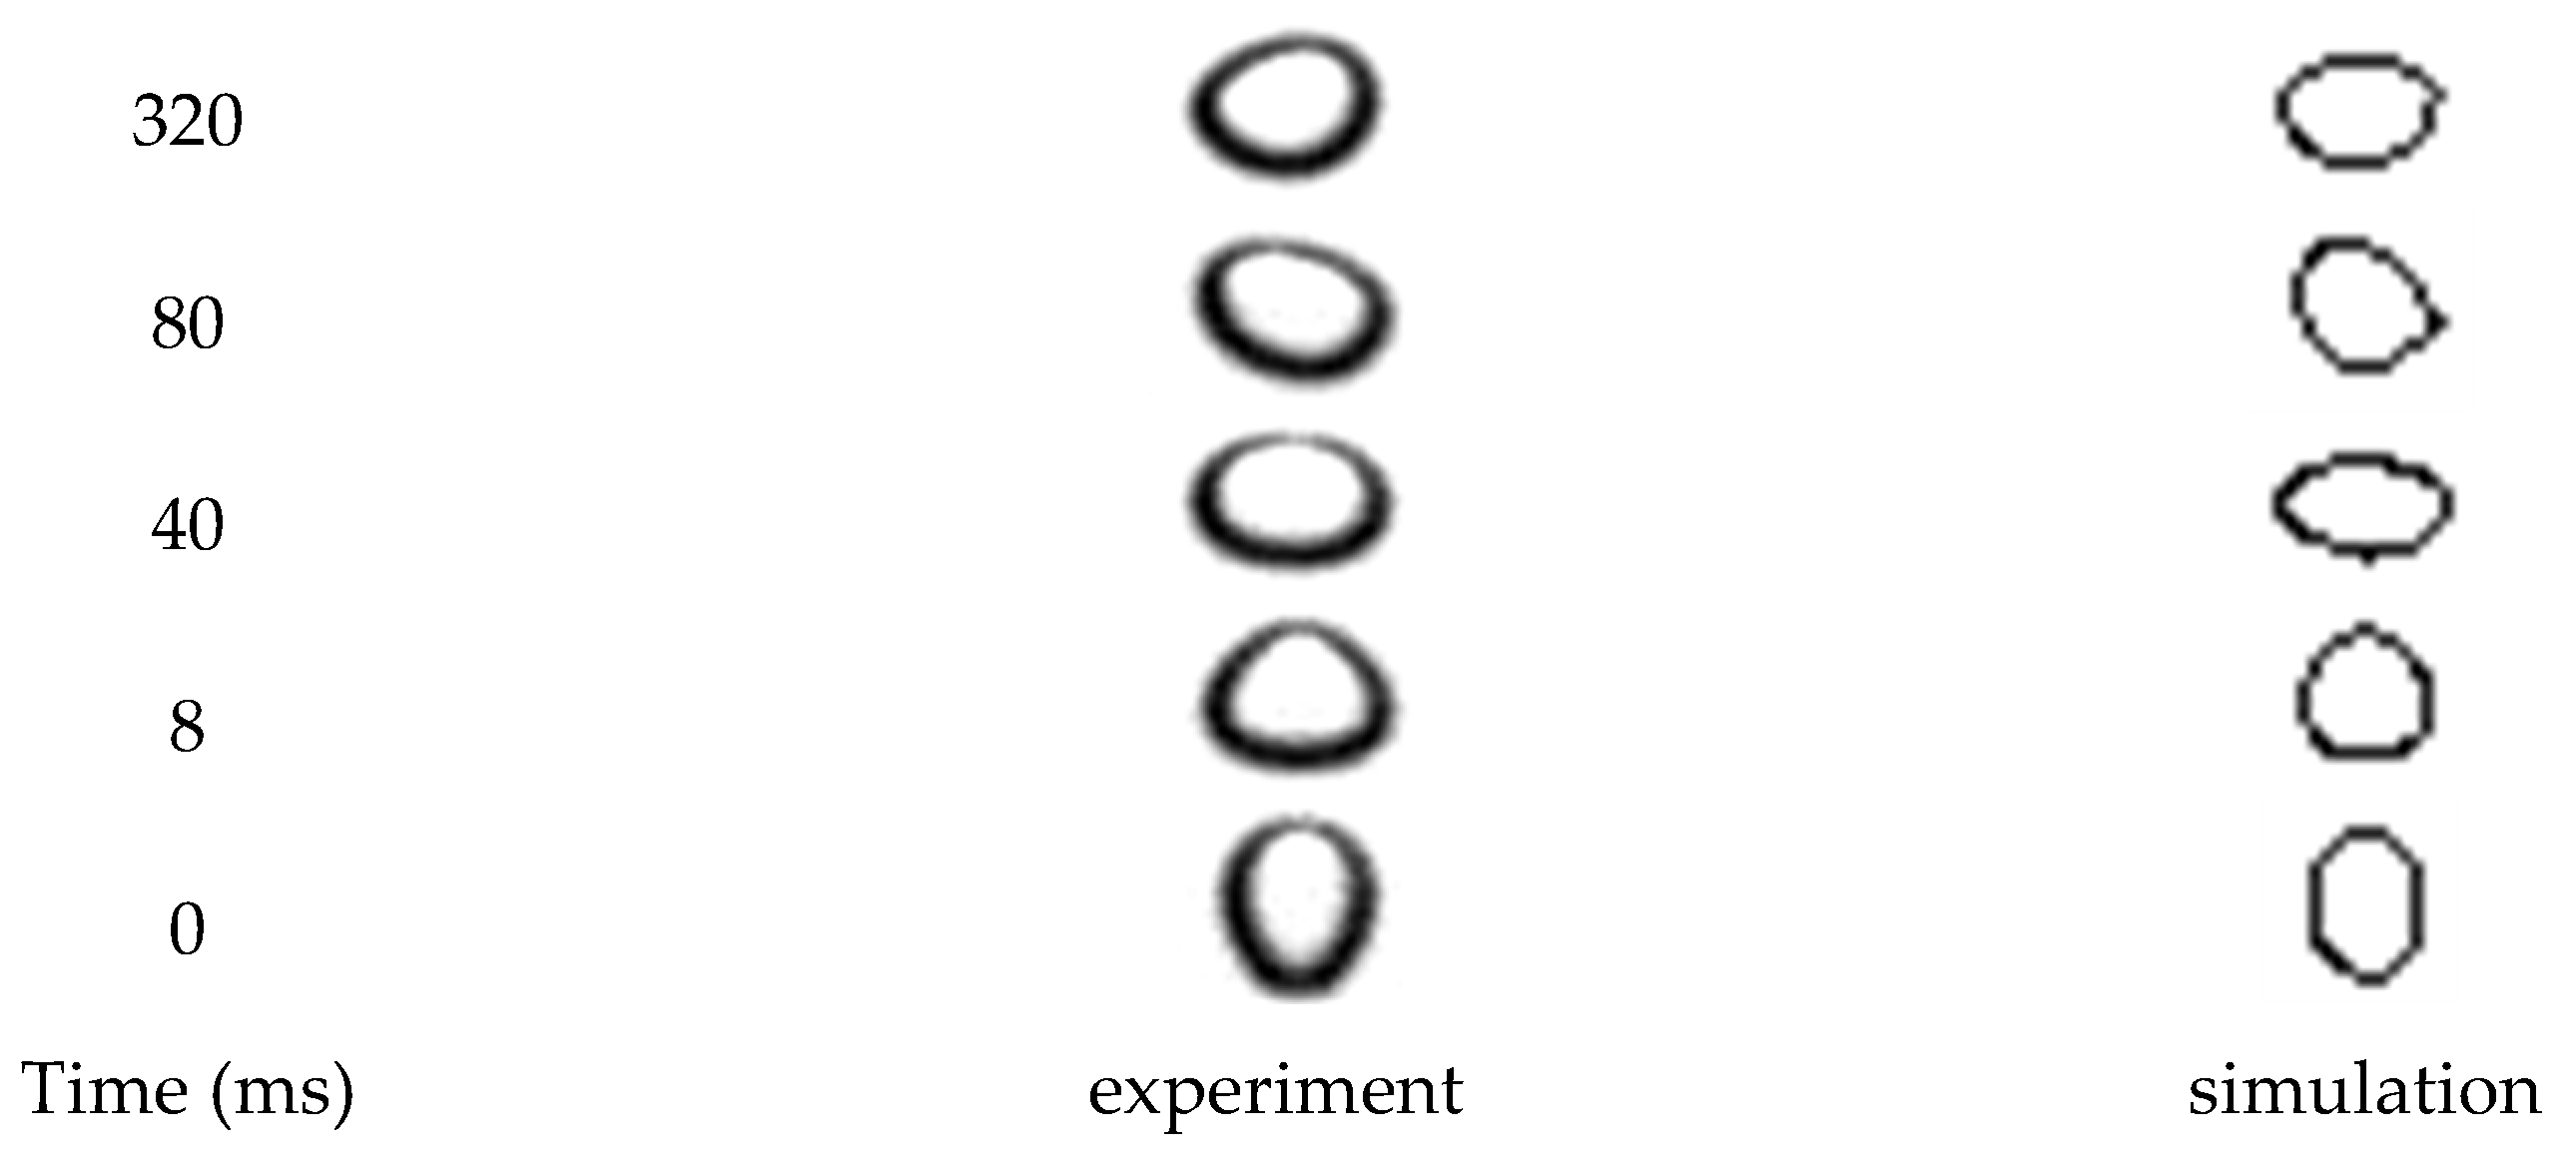
Figure 5 shows the comparison of bubble shapes at different moments under the 3 mm gap condition. In the narrow gap channel, the stronger surface tension causes the stratified flow in the annular flow to disappear, making the liquid film in the annular flow more uniform. Additionally, due to spatial constraints, the bubbles elongate upward or downward into a flat oval shape [
15]. These results prove the feasibility of the model.
5.2. Effect of Gas Injection Rate on Bubbles at Different Gaps
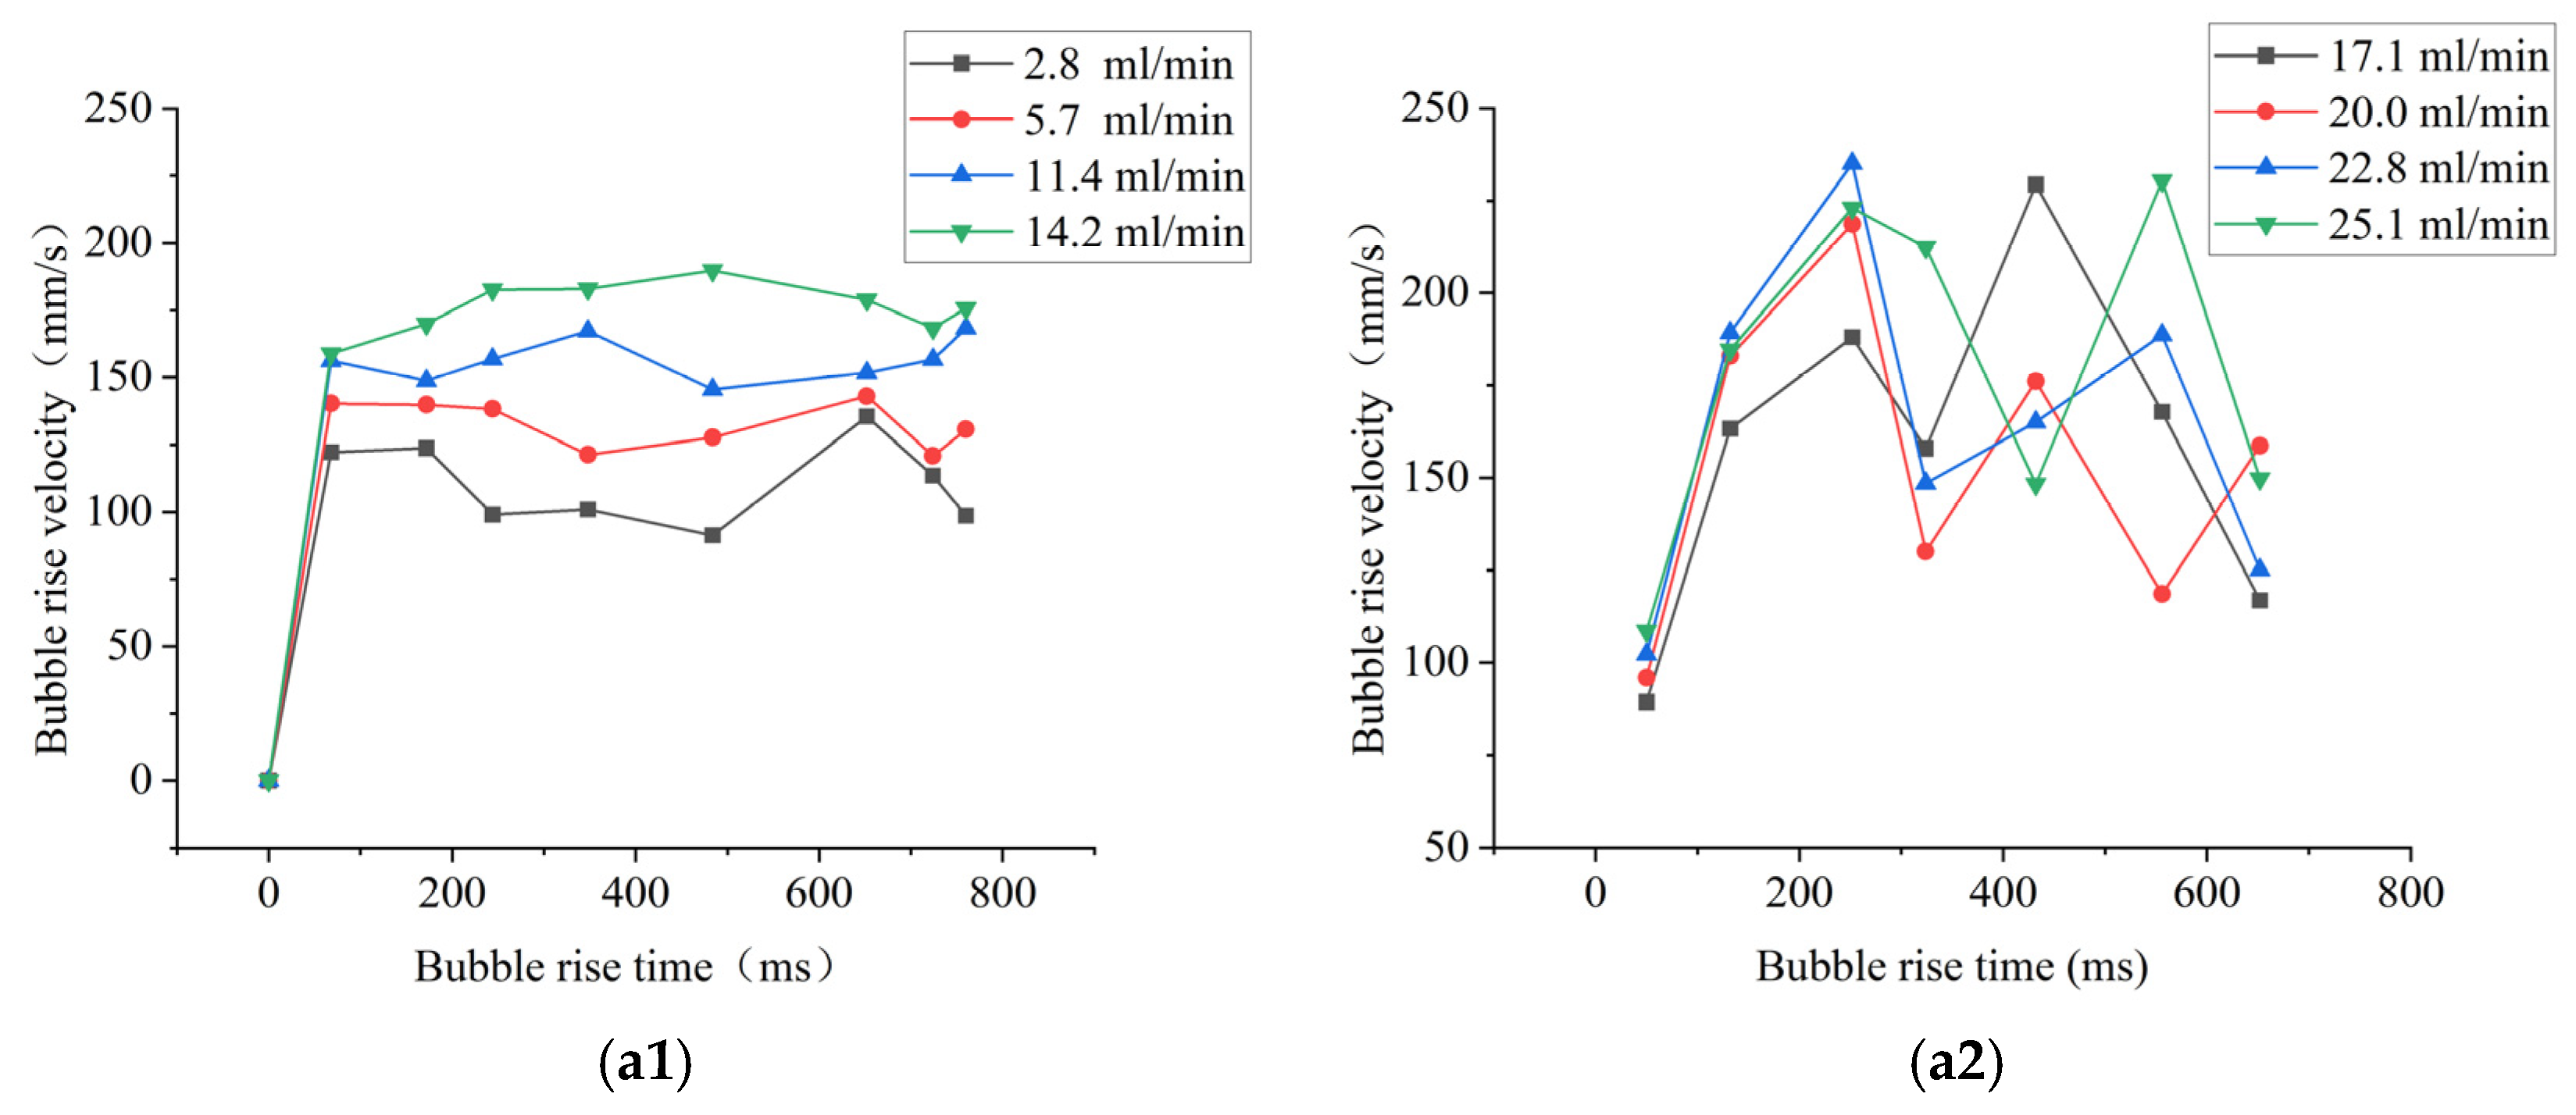
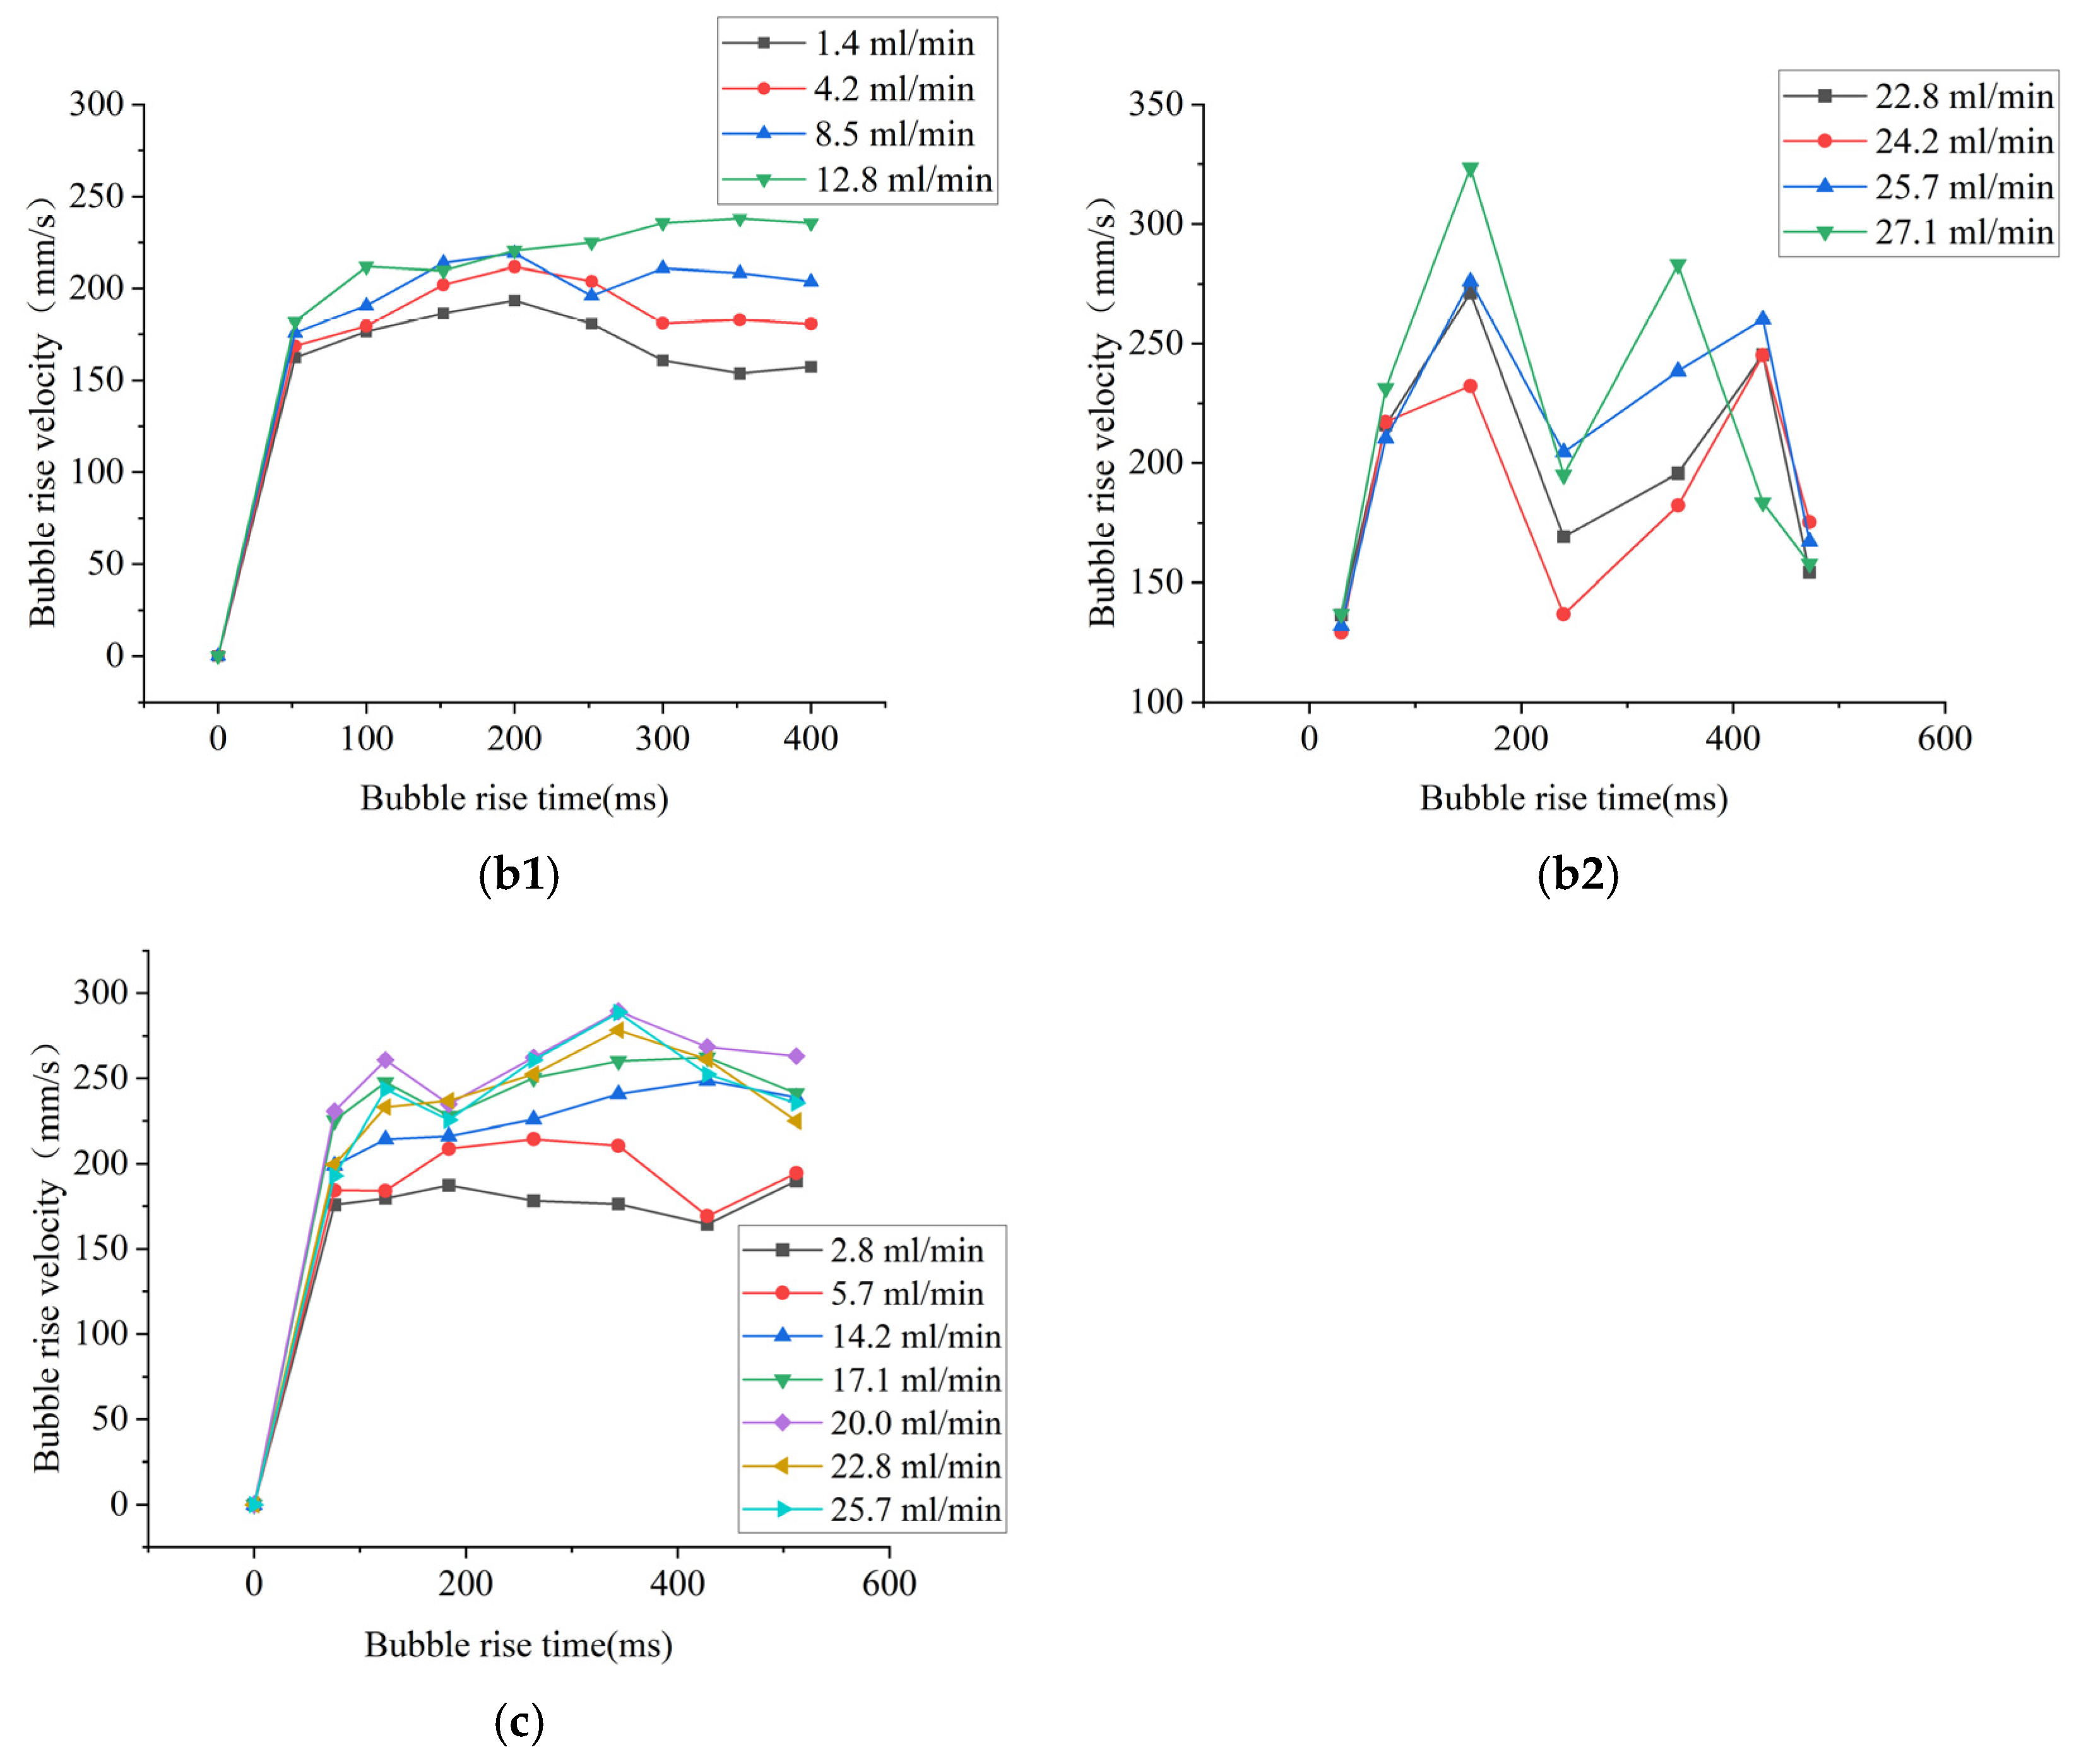
Figure 6(a1,b1) show the change in bubble velocity under different low gas injection rate conditions. The maximum gas injection rate varies with different gap distances; the larger the gap, the higher the final velocity of the bubble. The figure indicates that as the bubble rises from the bottom, it initially accelerates and then stabilizes at a value with periodic fluctuations after about 100 ms. At this stage, the bubble’s velocity change over time becomes regular. This pattern of initial acceleration followed by stabilization aligns with Celata’s experimental results [
16].
When the gas injection rate is relatively high, bubble velocity changes drastically over time.
Figure 6(b1,b2) show that at higher gas injection rates, the velocity fluctuations of bubbles during the ascent are significant. This occurs because the bubble detachment frequency increases, causing new bubbles to be affected by the tail flow of preceding bubbles. Consequently, the bubbles no longer rise individually and may collide with each other, leading to larger fluctuations in rising speed.
The air injection thresholds for narrow channels vary with different gap distances. With a 2 mm gap, the bubble rise rate fluctuates when the injection rate exceeds 17.1 mL/min. With a 3 mm gap, the bubble rising speed fluctuates when the injection rate exceeds 22.8 mL/min. The smaller the gap, the greater the bubble’s effect on the fluid, affecting the next rising bubble, as shown in
Figure 6c. With a 5 mm gap, bubbles rise regularly and individually without interaction, resulting in no significant fluctuations in the rising speed.
5.3. Effect of Different Gaps on Bubbles
During the process of rising, the shape of a bubble may change. In this experiment, most of the bubble shapes are elliptical or circular. Therefore, the shape of the bubble can be defined using Formula (2). The values of “al” and “bs” in the aspect ratio calculation formula should be obtained, as shown in
Figure 7.
The degree of bubble deformation within narrow channels varies with different gap sizes.
Figure 8 shows that the aspect ratio of bubbles with a 3 mm gap is around 1.2, while bubbles with a 5 mm gap have aspect ratios fluctuating between 1.1 and 1.6. Bubbles in narrower gaps are less likely to deform.
As bubbles rise in a narrow channel with a smaller gap, the flow of water and the gas–liquid interface fit more closely. The pressure generated by the water flow is perpendicular to the gas–liquid interface and points to the center of the bubble. This inhibits the degree of bubble deformation during the rising process [
17]. Therefore, the shape characteristics of bubbles are significantly affected by the narrow channel gap.
The motion trajectory of a bubble can be determined based on its geometric centroid at different moments. The centroid of the bubble is obtained through image processing and calculations using Formula (1).
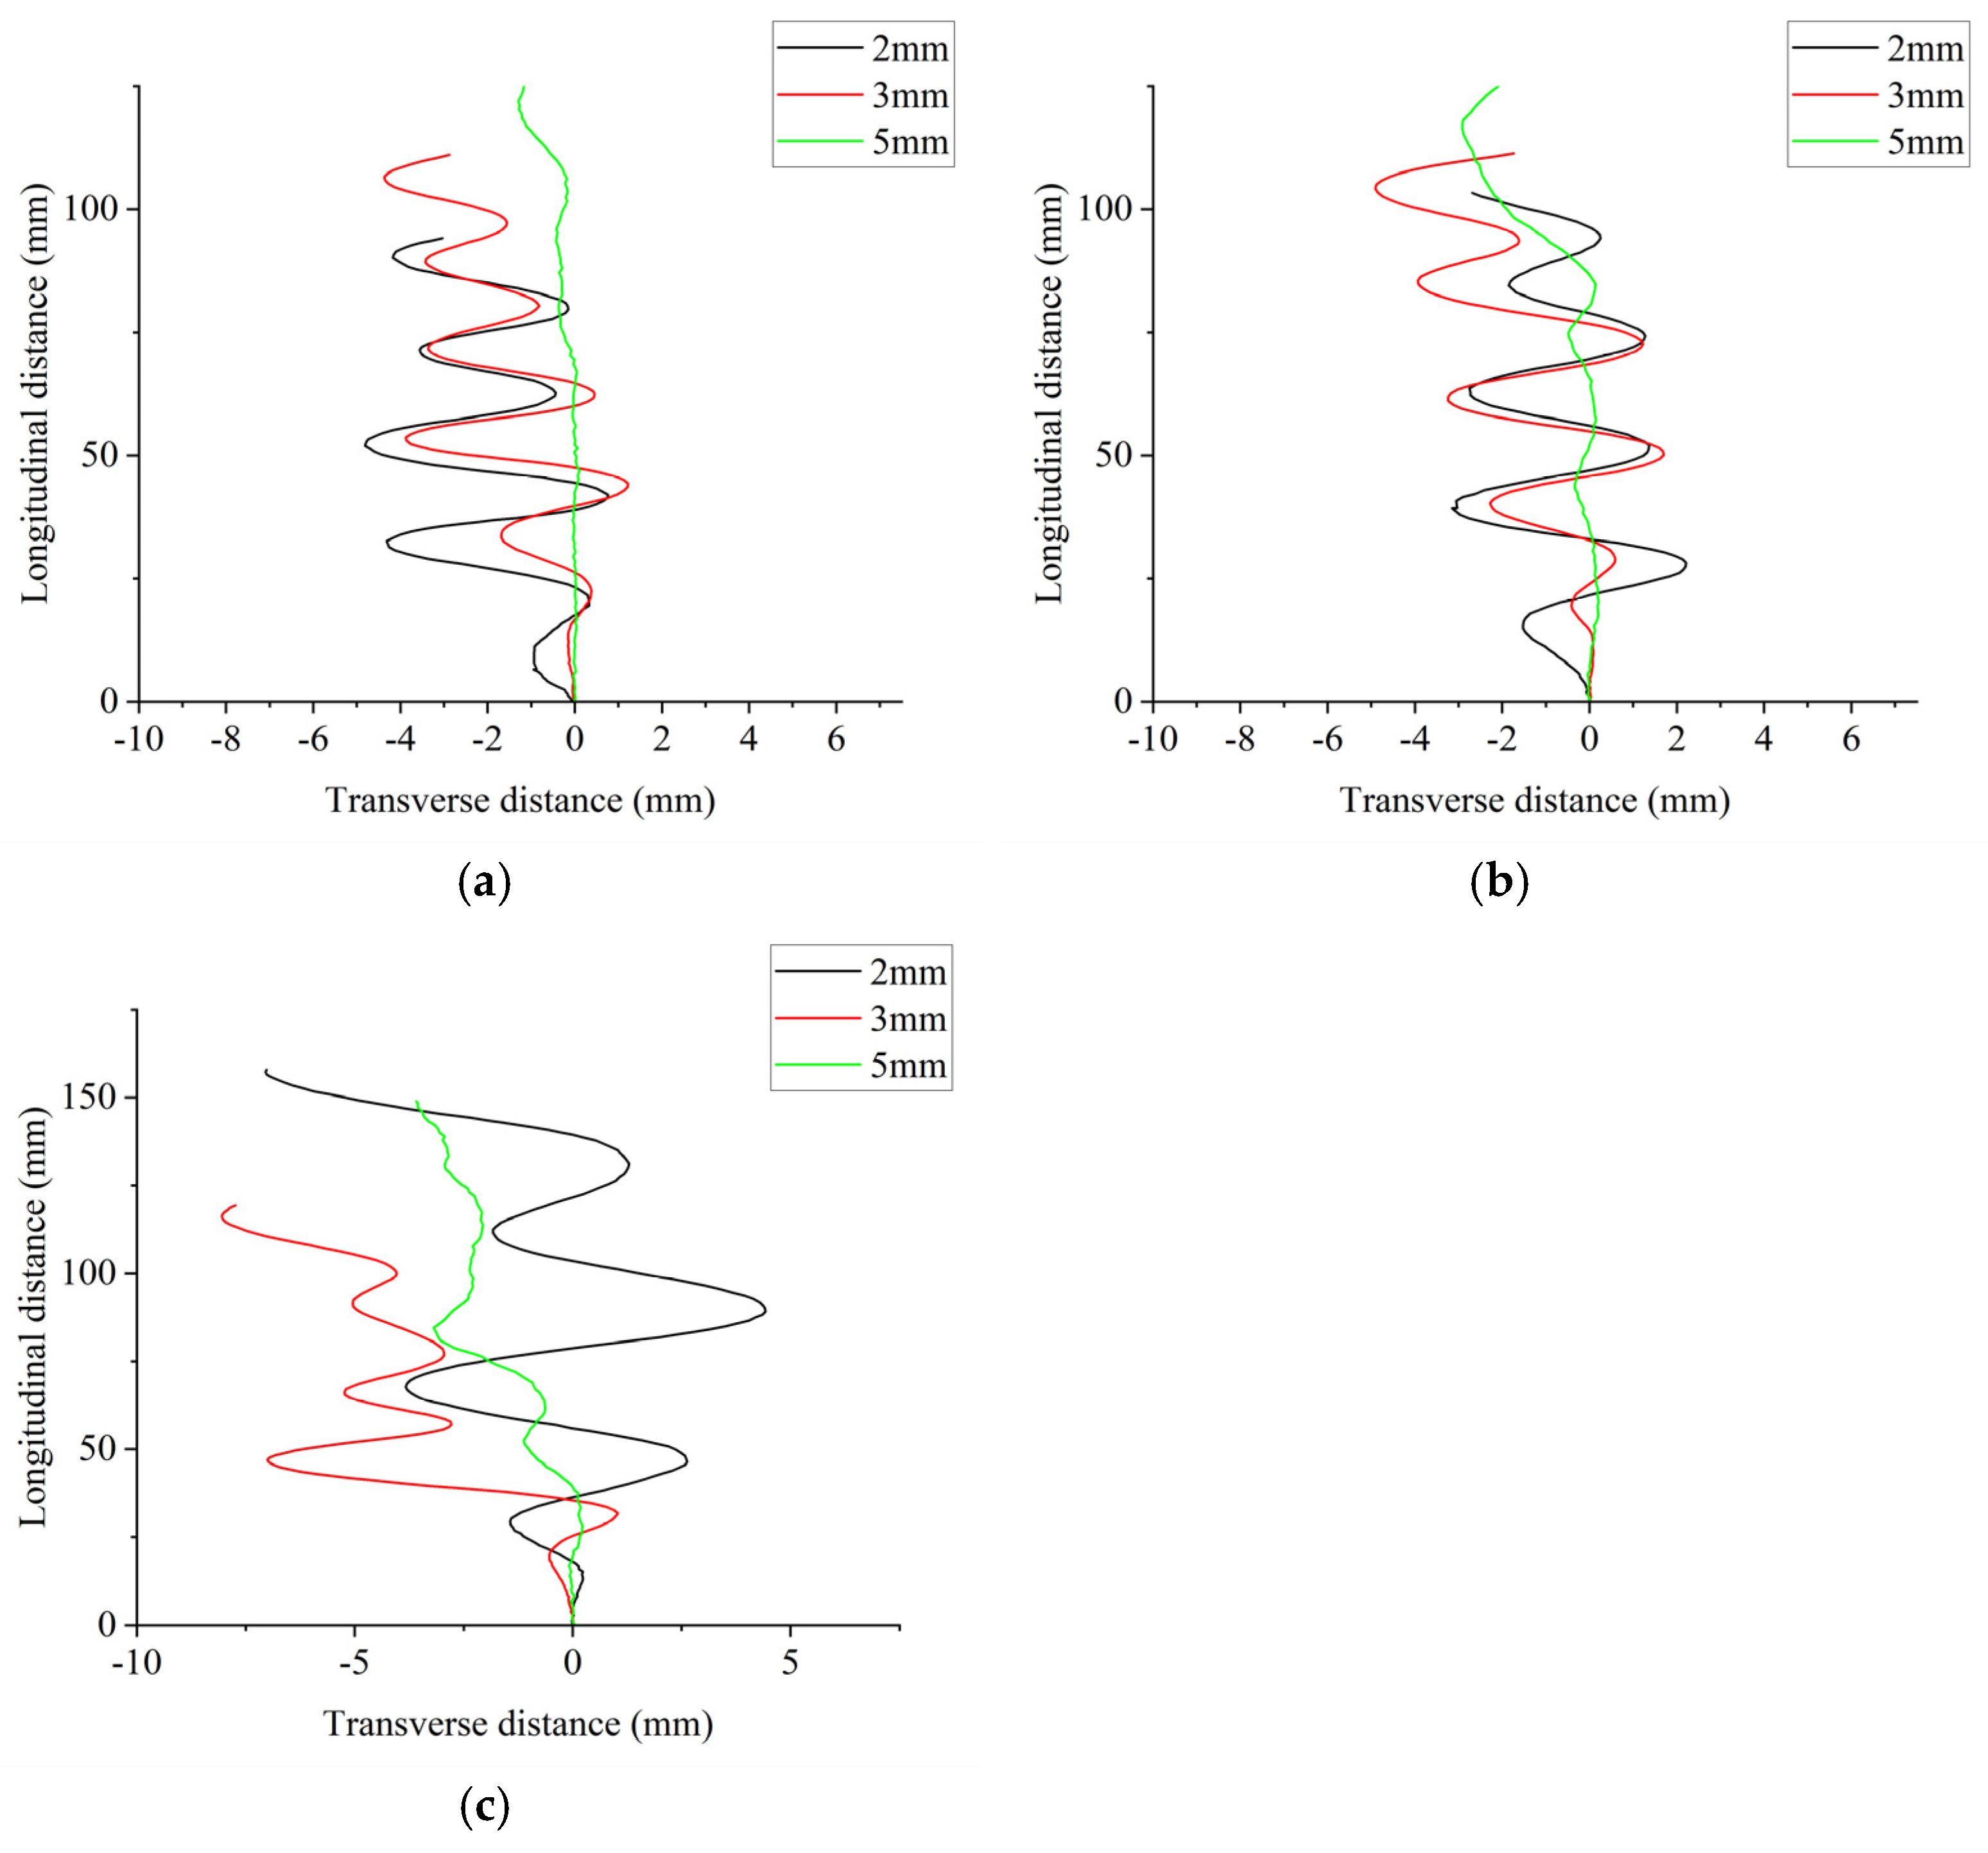
Figure 9 shows the bubble motion trajectories under different narrow channel gap distances. In channels with 2 mm and 3 mm gaps, bubbles deviate from the vertical rise soon after release and then move in a zigzag pattern, forming sinusoidal oscillations. This is consistent with the experimental results of Zhen in reference [
18]. In contrast, bubbles in a 5 mm gap channel rise in a straight line; in comparison with
Figure 9c, it can be observed that as the gas injection flow rate increases, the trajectories of the bubbles all exhibit a shift. This is consistent with the experimental results of Thiago Sirino in reference [
19].
The shapes of bubbles generated in different gaps vary, affecting their rising trajectories.
Figure 10 shows that bubbles with a 5 mm gap change between circular, elliptical, and semicircular shapes. These bubbles have symmetrical spherical surfaces during ascent, balancing left and right forces, making them less likely to shift. Additionally, bubbles in the 5 mm gap can partially deform to cancel out fluid disturbances. In contrast, bubbles in 2 mm and 3 mm gaps are restricted by the walls and dominated by surface tension, maintaining an elliptical shape. These bubbles are more prone to trajectory offsets due to fluid perturbations during ascent.
6. Conclusions
This paper experimentally investigates and simulates the rising dynamics of a single bubble in a narrow channel. By varying the gap distance and gas injection rate, different bubble motion phenomena are produced, and the behavior of the bubble rising process is studied and summarized as follows:
- (1)
The numerical simulation of bubble rise velocity under different gap spacings is performed using the coupled VOF model and porous medium model. The results show a minimal difference compared to experimental results, with a maximum error of about 17%.
- (2)
When the gas injection flow rate is below 14.2 mL/min, the bubble rise velocity is proportional to the injection rate and stabilizes at approximately 100 ms. Conversely, when the gas injection rate exceeds 14.2 mL/min, the interaction between bubbles increases under working conditions of 2 mm and 3 mm, resulting in more pronounced oscillations in the bubble rise velocity.
- (3)
The smaller the gap distance, the greater the wall’s limiting effect on the bubbles. When the gap distance is less than 3 mm, the aspect ratio of bubbles stabilizes at about 1.2, forming a flat ellipse. When the gap distance is 5 mm, the shape of the bubble varies between circular, semicircular, and elliptical shapes.
- (4)
The rising trajectory of a bubble is closely related to the forces acting on it in the water, which are influenced by the bubble’s shape. When the gap distance is less than 3 mm, the resulting flat elliptical bubbles are easily disturbed and rise in a zigzag pattern. When the gap distance is 5 mm, the symmetrical round bubbles are more likely to rise in a straight line.
Author Contributions
Writing—original draft: B.T.; investigation: B.T.; conceptualization: S.W.; supervision: S.W.; writing—review and editing: S.W.; funding acquisition: F.L.; Formal analysis: F.L. and F.N.; project administration: F.N. All authors have read and agreed to the published version of the manuscript.
Funding
This research is supported by the National Key R&D Program of China (2022YFB1902503), the National Natural Science Foundation of Hebei Province (A2023502011), and the Fundamental Research Funds for the Central Universities (2023MS050).
Data Availability Statement
The original contributions presented in the study are included in the article, further inquiries can be directed to the corresponding author.
Conflicts of Interest
The authors declare no conflicts of interest.
References
- Taş, S. A comprehensive review of numerical and experimental research on the thermalhydraulics of two-phase flows in vertical rod bundles. Int. J. Heat Mass Transf. 2024, 221, 125053. [Google Scholar] [CrossRef]
- Passoni, S.; Mereu, R.; Bucci, M. Integrating machine learning and image processing forvoid fraction estimation in two-phase flow through corrugated channels. Int. J. Multiph. Flow 2024, 177, 104871. [Google Scholar] [CrossRef]
- Gao, H.; Zhang, X. Analyzing RD-14 device breaching experiments with RELAP5. Nucl. Sci. Eng. 2003, 2, 118–122. [Google Scholar]
- Wang, Z. The Flow and Heat Transfer Characteristics for Low Flow Rate Flow under Rolling Motion Conditions. Ph.D. Thesis, Harbin Engineering University, Harbin, China, 2013. [Google Scholar]
- Gerlach, D.; Alleborn, N.; Buwa, V.; Durst, F. Numerical simulation of periodic bubble formation at a submerged orifice with constant gas flow rate. Chem. Eng. Sci. 2007, 62, 2109–2125. [Google Scholar] [CrossRef]
- Mohammadzadeh, M.; Li, F.; Ohl, C.D. Shearing flow from transient bubble oscillations in narrow gaps. Phys. Rev. Fluids 2017, 2, 014301. [Google Scholar] [CrossRef]
- Zhang, C.; Zhou, D.; Sa, R.; Wu, Q. Investigation of single bubble rising velocity in LBE by transparent liquids similarity experiments. Prog. Nucl. Energy 2018, 108, 204–213. [Google Scholar] [CrossRef]
- Cerqueira RF, L.; Paladino, E.E. Experimental study of the flow structure around Taylor bubbles in the presence of dispersed bubbles. Int. J. Multiph. Flow 2020, 133, 103450. [Google Scholar] [CrossRef]
- Tryggvason, G.; Scardovelli, R.; Zaleski, S. Direct Numerical Simulations of Gas–Liquid Multiphase Flows; Cambridge University Press: Cambridge, UK, 2011; p. 105. [Google Scholar]
- Hirt, C.W.; Nichols, B.D. Volume of fluid (VOF) method for the dynamics of free boundaries. J. Comput. Phys. 1981, 39, 201–225. [Google Scholar] [CrossRef]
- Tomiyama, A.; Zun, I.; Sou, A.; Sakaguchi, T. Numerical analysis of bubble motion with the VOF method. Nucl. Eng. Des. 1993, 141, 69–82. [Google Scholar] [CrossRef]
- Brackbill, J.U.; Kothe, D.B.; Zemach, C. A continuum method for modeling surface tension. J. Comput. Phys. 1992, 100, 335–354. [Google Scholar] [CrossRef]
- Wang, X.; Klaasen, B.; Degrève, J.; Mahulkar, A.; Heynderickx, G.; Reyniers, M.F.; Blanpain, B.; Verhaeghe, F. Volume-of-fluid simulations of bubble dynamics in a vertical Hele-Shaw cell. Phys. Fluids 2016, 28, 053304. [Google Scholar] [CrossRef]
- Whitaker, S. Flow in porous media I: A theoretical derivation of Darcy’s law. Transp. Porous Media 1986, 1, 3–25. [Google Scholar] [CrossRef]
- Wu, Z.; Sundén, B. Heat transfer correlations for elongated bubbly flow in flow boiling micro/minichannels. Heat Transf. Eng. 2016, 37, 985–993. [Google Scholar] [CrossRef]
- Tomiyama, A.; Celata, G.P.; Hosokawa, S.; Yoshida, S. Terminal velocity of single bubbles in surface tension force dominant regime. Int. J. Multiph. Flow 2002, 28, 1497–1519. [Google Scholar] [CrossRef]
- Huang, Y. Numerical Study of Bubble Behavior in Vertical Rectangular Narrow Channel. Ph.D. Thesis, Harbin Engineering University, Harbin, China, 2014. [Google Scholar]
- Jian, Z.; Xiang, S.; Li, R.; Jiang, Z.; Qin, L.; Zhang, X. Wall effect on single bubble rising in a Hele–Shaw cell. Phys. Fluids 2024, 36, 032132. [Google Scholar] [CrossRef]
- Sirino, T.; Machado, V.; Mancilla, E.; Morales, R.E. Dynamics of single bubbles rising in confined square and rectangular channels. Int. J. Multiph. Flow 2022, 157, 104257. [Google Scholar] [CrossRef]
| Disclaimer/Publisher’s Note: The statements, opinions and data contained in all publications are solely those of the individual author(s) and contributor(s) and not of MDPI and/or the editor(s). MDPI and/or the editor(s) disclaim responsibility for any injury to people or property resulting from any ideas, methods, instructions or products referred to in the content. |
© 2024 by the authors. Licensee MDPI, Basel, Switzerland. This article is an open access article distributed under the terms and conditions of the Creative Commons Attribution (CC BY) license (https://creativecommons.org/licenses/by/4.0/).

