Abstract
Maternal mortality ratios in sub-Saharan Africa remain high and worrisome. Moreover, maternal health indicators have remained poor despite large efforts in the last two decades. This study assesses maternal mortality patterns by age and country. The demographic and health survey data were used for the study. Based on the results, countries with the lowest adult female mortality rate include Senegal, Comoros, Rwanda, Mauritania, Sao Tome and Principe, Gambia, and Ethiopia. In addition, Chad (44.7%), Niger (38.7%), the Congo Democratic Republic (34.8%), Nigeria (34.2%), Mauritania (32.0%), Senegal (29.2%), Liberia (28.8%), Benin (27.8%), and Guinea (27.5%), respectively, reported the highest female deaths that are pregnancy-related. Overall, Lesotho (1024; 95% CI: 731–1318), Liberia (913; 95% CI: 638–1189), Chad (860; 95% CI: 728–993), Congo Democratic Republic (846; 95% CI: 690–1003), Sierra Leone (796; 95% CI: 632–960) and Guinea (724; 95% CI: 531–916) had the leading pregnancy-related mortality ratio per 100,000 live births. The study found that the patterns of death vary across different countries. There is a need for concerted efforts to reduce pregnancy-related deaths in sub-Saharan countries.
1. Background
Maternal mortality is a key public health concern, particularly in developing countries. In 2017, an estimated 810 women died from preventable causes associated with pregnancy and childbirth, with 94% of all maternal mortality occurring in resource-poor settings [1]. South Asia and sub-Saharan Africa (SSA) account for about 86% of maternal deaths worldwide [1]. SSA countries record the highest number of maternal deaths annually, with a maternal mortality ratio (MMR) of 553 deaths per 100,000 live births, which is over 50 times higher than the MMR for high-income countries with 11 deaths per 100,000 live births [2]. The burden of maternal deaths in the SSA region shows the inequities in access to maternal health services and the socioeconomic disparities between high-income and low-income countries.
The risk of maternal death remains high in low-income countries, as 1 in 45 women die from pregnancy-related causes, compared with 1 in 5400 in high-income countries. [1,2]. Women in the SSA region have the highest risk of maternal death at 1 in 38 [1,2]. Furthermore, women in low-income countries have a significantly higher fertility rate than women in high-income countries, making the risk of death due to pregnancy higher [1]. Additionally, the risk of complications from pregnancy and delivery is higher for adolescent and young mothers, respectively [1].
The number of maternal deaths has declined substantially worldwide in the past two decades, with SSA countries achieving about a 39% reduction between 2000 and 2017 [2]. Despite the substantial reduction in maternal deaths in the SSA region, the current burden remains worrisome. Research-based evidence from SSA countries shows that the highest number of deaths occur during the antepartum, intrapartum, and postpartum periods [3]. About 31% occurs during pregnancy, 36% during childbirth or the first week, and 33% happen between the first week and one year after termination of pregnancy [4].
Multiple studies conducted in the SSA countries have found obstetrical hemorrhage, eclampsia, and hypertensive conditions during pregnancy to be major causes of maternal deaths [5,6,7]. A recent systematic review found obstetrical hemorrhage, hypertensive conditions during pregnancy, non-obstetric complications, and infections related to pregnancy as the main causes of maternal deaths in SSA countries [5]. Similarly, another study reported haemorrhage and hypertensive conditions to account for about 40% of maternal deaths [8]. Among adolescents in low- and middle-income countries (LMICs), the main causes of maternal deaths were obstetrical hemorrhage, hypertensive conditions during pregnancy, and infections associated with pregnancy [9].
The Third Sustainable Development Goal (SDG 3.1) targets reduced maternal mortality and reduces the maternal mortality ratio (MMR) to 70 deaths for every 100,000 live births by 2030 [10]. To reduce maternal mortality in SSA countries, understanding the pattern and burden in various SSA countries is crucial. Therefore, we explore maternal mortality prevalence and patterns in SSA countries. The findings from this study would help policymakers implement health programs to reduce maternal mortality in SSA countries.
2. Methods
Data Source
We used 2006 to 2021, SSA countries’ Demographic and Health Surveys (DHS) data [11,12,13]. A multistage cluster stratified sampling strategy is used by DHS to gather data. The respondents were divided into groups according to their geographic location, which was typically determined by their place of residence: urban versus rural, using the stratification method. The population was divided into first-level strata, second-level strata, etc. using a multi-level stratified approach. Geographic location and urban or rural status were used to determine the DHS’s two levels of stratification. The following countries were examined in the study: Angola, Cameroon, Benin, Congo Democratic Republic Burkina Faso, Burundi, Egypt, Eritrea, Chad, Comoros, Nigeria, Congo, Cote d’Ivoire, Ethiopia, Gabon, Gambia, Liberia, Togo, Uganda, Guinea, Kenya, Lesotho, Madagascar, Morocco, Mozambique, Namibia, Malawi, Mali, Niger, Rwanda, Senegal, Sierra Leone, Sao Tome and Principe, South Africa, Tanzania, Zambia, Zimbabwe.
Since 1984, these surveys have been conducted every five years in more than 85 countries worldwide. One key advantage of DHS is the sampling approach to data collection, which is consistent across countries and enables results to be compared between countries. Even though the DHS was created to supplement the demographic, family planning, and fertility data collected by the World Fertility Surveys (WFSs) and Contraceptive Prevalence Surveys (CPSs), it has quickly evolved into the most significant base of population investigation for the monitoring of population health trends, particularly in areas with limited resources. The DHS collects data on immunizations, maternal and infant mortality, domestic violence, fertility, female genital mutilation, communicable and non-communicable diseases, nutrition, water and sanitation, lifestyle, family planning, and other health-related issues. The DHS is successful in gathering high-quality data by providing adequate interviewer training, nationwide coverage, uniform data collection tools, and methodological approaches to issues that are easy for legislators and decision-makers to understand. Using information from the DHS, epidemiologic studies can be conducted to determine prevalence, movements, and disparities. Details about DHS have been reported previously [14].
3. Selection and Measurement of Variables
3.1. Outcome
- Adult female mortality rate: the adult female mortality rate over the seven-year period prior to the survey, expressed as a percentage of 1000 women-years of exposure.
- Female deaths that are pregnancy-related: the percentage of all female adult deaths that are pregnancy-related, including those from accidents or violence during pregnancy, delivery, and the two months following delivery.
- Pregnancy-related mortality rate: this is expressed as the number of deaths from pregnancy in the seven years prior to the survey, per 1000 woman-years of exposure.
- Pregnancy-related mortality ratio: the pregnancy-related mortality ratio is calculated as the age-adjusted pregnancy-related mortality rate multiplied by 100 divided by the age-adjusted general fertility rate, and it is expressed as the number of pregnancies lost during the seven years prior to the survey per 100,000 live births.
- Lifetime risk of pregnancy-related death: calculated as 1-(1-PRMR) TFR, where TFR is the total fertility rate for the seven years prior to the survey, is the lifetime risk of pregnancy-related death.
3.2. Explanatory Variable
The patterns of women’s mortality were disaggregated by age (years): 15–19, 20–24, 25–29, 30–34, 35–39, 40–44, 45–49.
3.3. Analytical Approach
With the aid of the Stata survey module (‘svy’), all sampling weights, clustering, and stratification were taken into account. The prevalence was evaluated using percentages. An analysis of forest plots was used to determine the variation in pregnancy-related mortality between the countries. The weighted effect size (w*es) for each country’s prevalence in the forest plot was also calculated. To determine how heterogeneous a country is, we used the Q-test, which is comparable to the t-test. Using the same weights as those used in the pooling procedure, we also calculated this as the sum of squares of the variances between the effects in each individual study and the overall effect for all countries. With k-1 degrees of freedom, Q has a chi-square distribution (k being the total number of countries). Our null hypothesis is that all countries are equal. We reject the null hypothesis at the level of 5% significance. Stata 14.0 was used to conduct the analysis (StataCorp, College Station, TX, USA).
3.4. Ethical Approval and Informed Consent
Public domain datasets based on populations that had been anonymized were examined in this study. MEASURE DHS/ICF International granted the authors permission to use the data. The DHS Program adheres to all applicable standards for protecting respondents’ personal information. ICF International ensures that the survey complies with the requirements of the Human Subjects Protection Act of the US Department of Health and Human Services. Before conducting the surveys, the DHS team received approval from the National Health Research Ethics Committees of several countries. For this investigation, no additional authorizations were required. Check out this link for more information on our data and ethical standards: http://goo.gl/ny8T6X (accessed on 5 January 2023).
4. Results
Table 1 shows that the adult female mortality rate was higher among older women aged 30 years and older across many countries. Countries with the lowest adult female mortality rate include Senegal (1.5 per 1000 women-years of exposure), the Comoros (1.58 per 1000 women-years of exposure), Rwanda (1.88 per 1000 women-years of exposure), Mauritania (2.4 per 1000 women-years of exposure), Sao Tome and Principe (2.52 per 1000 women-years of exposure), Gambia (2.72 per 1000 women-years of exposure), and Ethiopia (2.74 per 1000 women-years of exposure). See the details below in Table 1.

Table 1.
Pattern of adult female mortality rate.
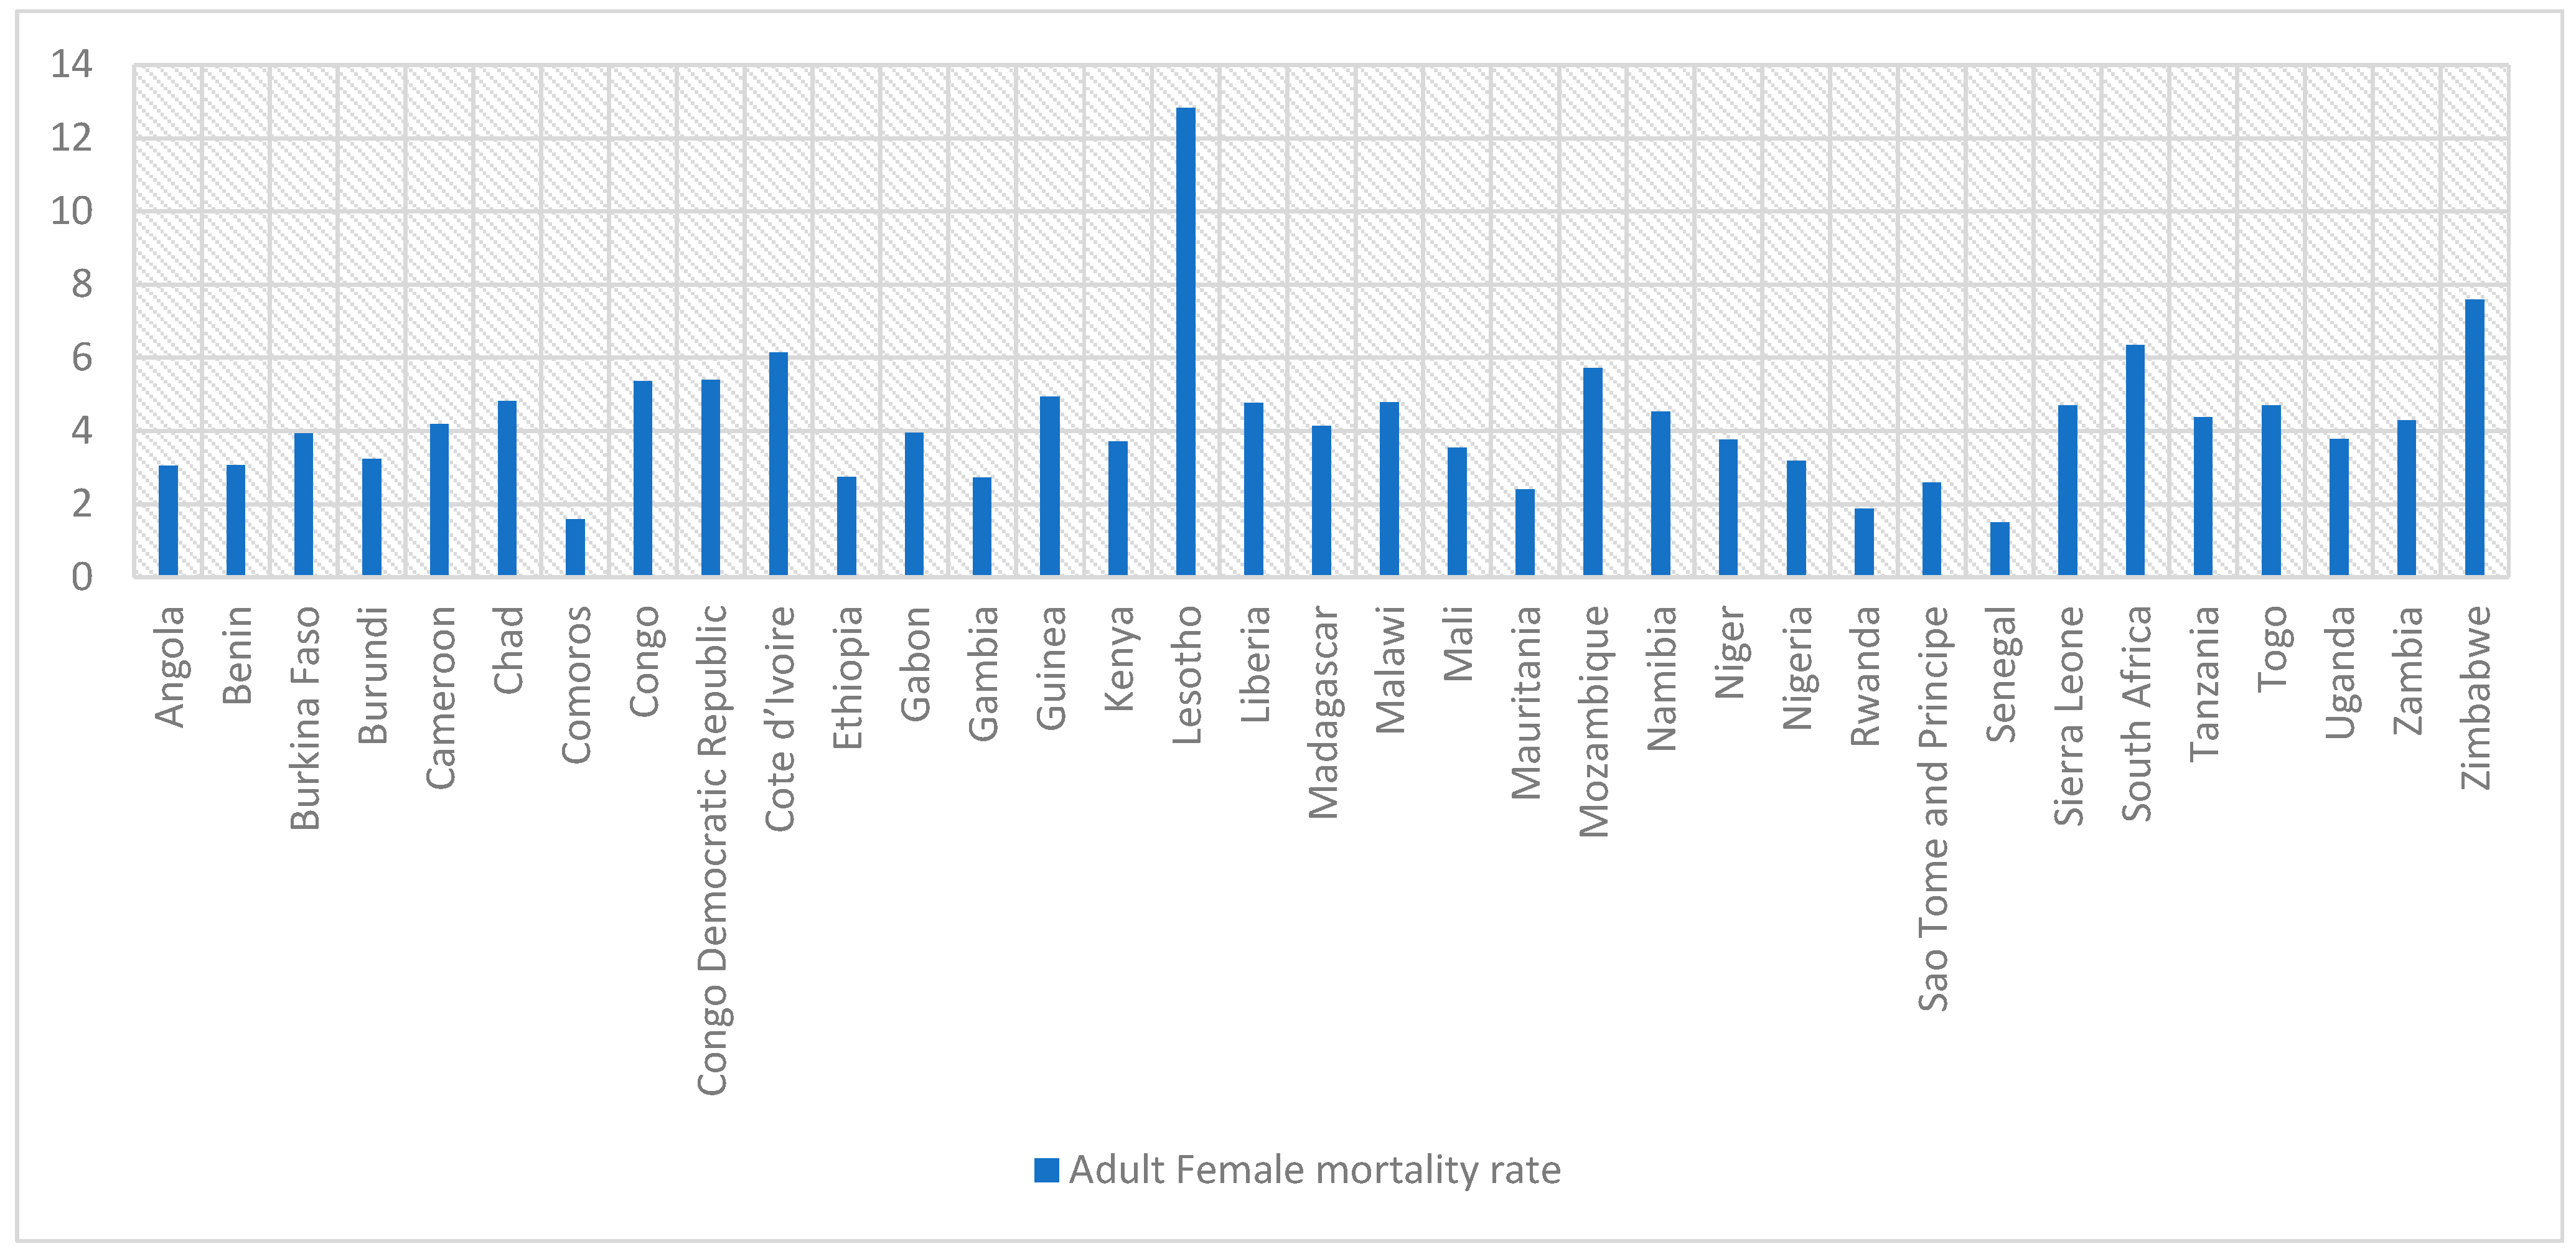
Figure 1 shows the total adult female mortality rate in SSA countries. Overall, Lesotho, Zimbabwe, South Africa, Mozambique, and Cote d’Ivoire reported the leading adult female mortality rate per 1000 women-years of exposure.
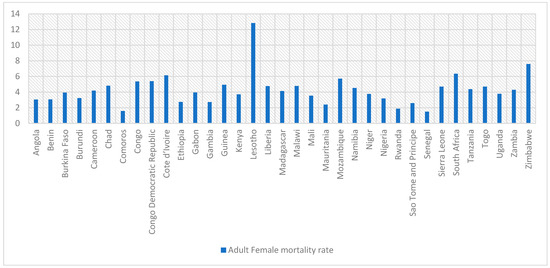
Figure 1.
Adult female mortality rate.
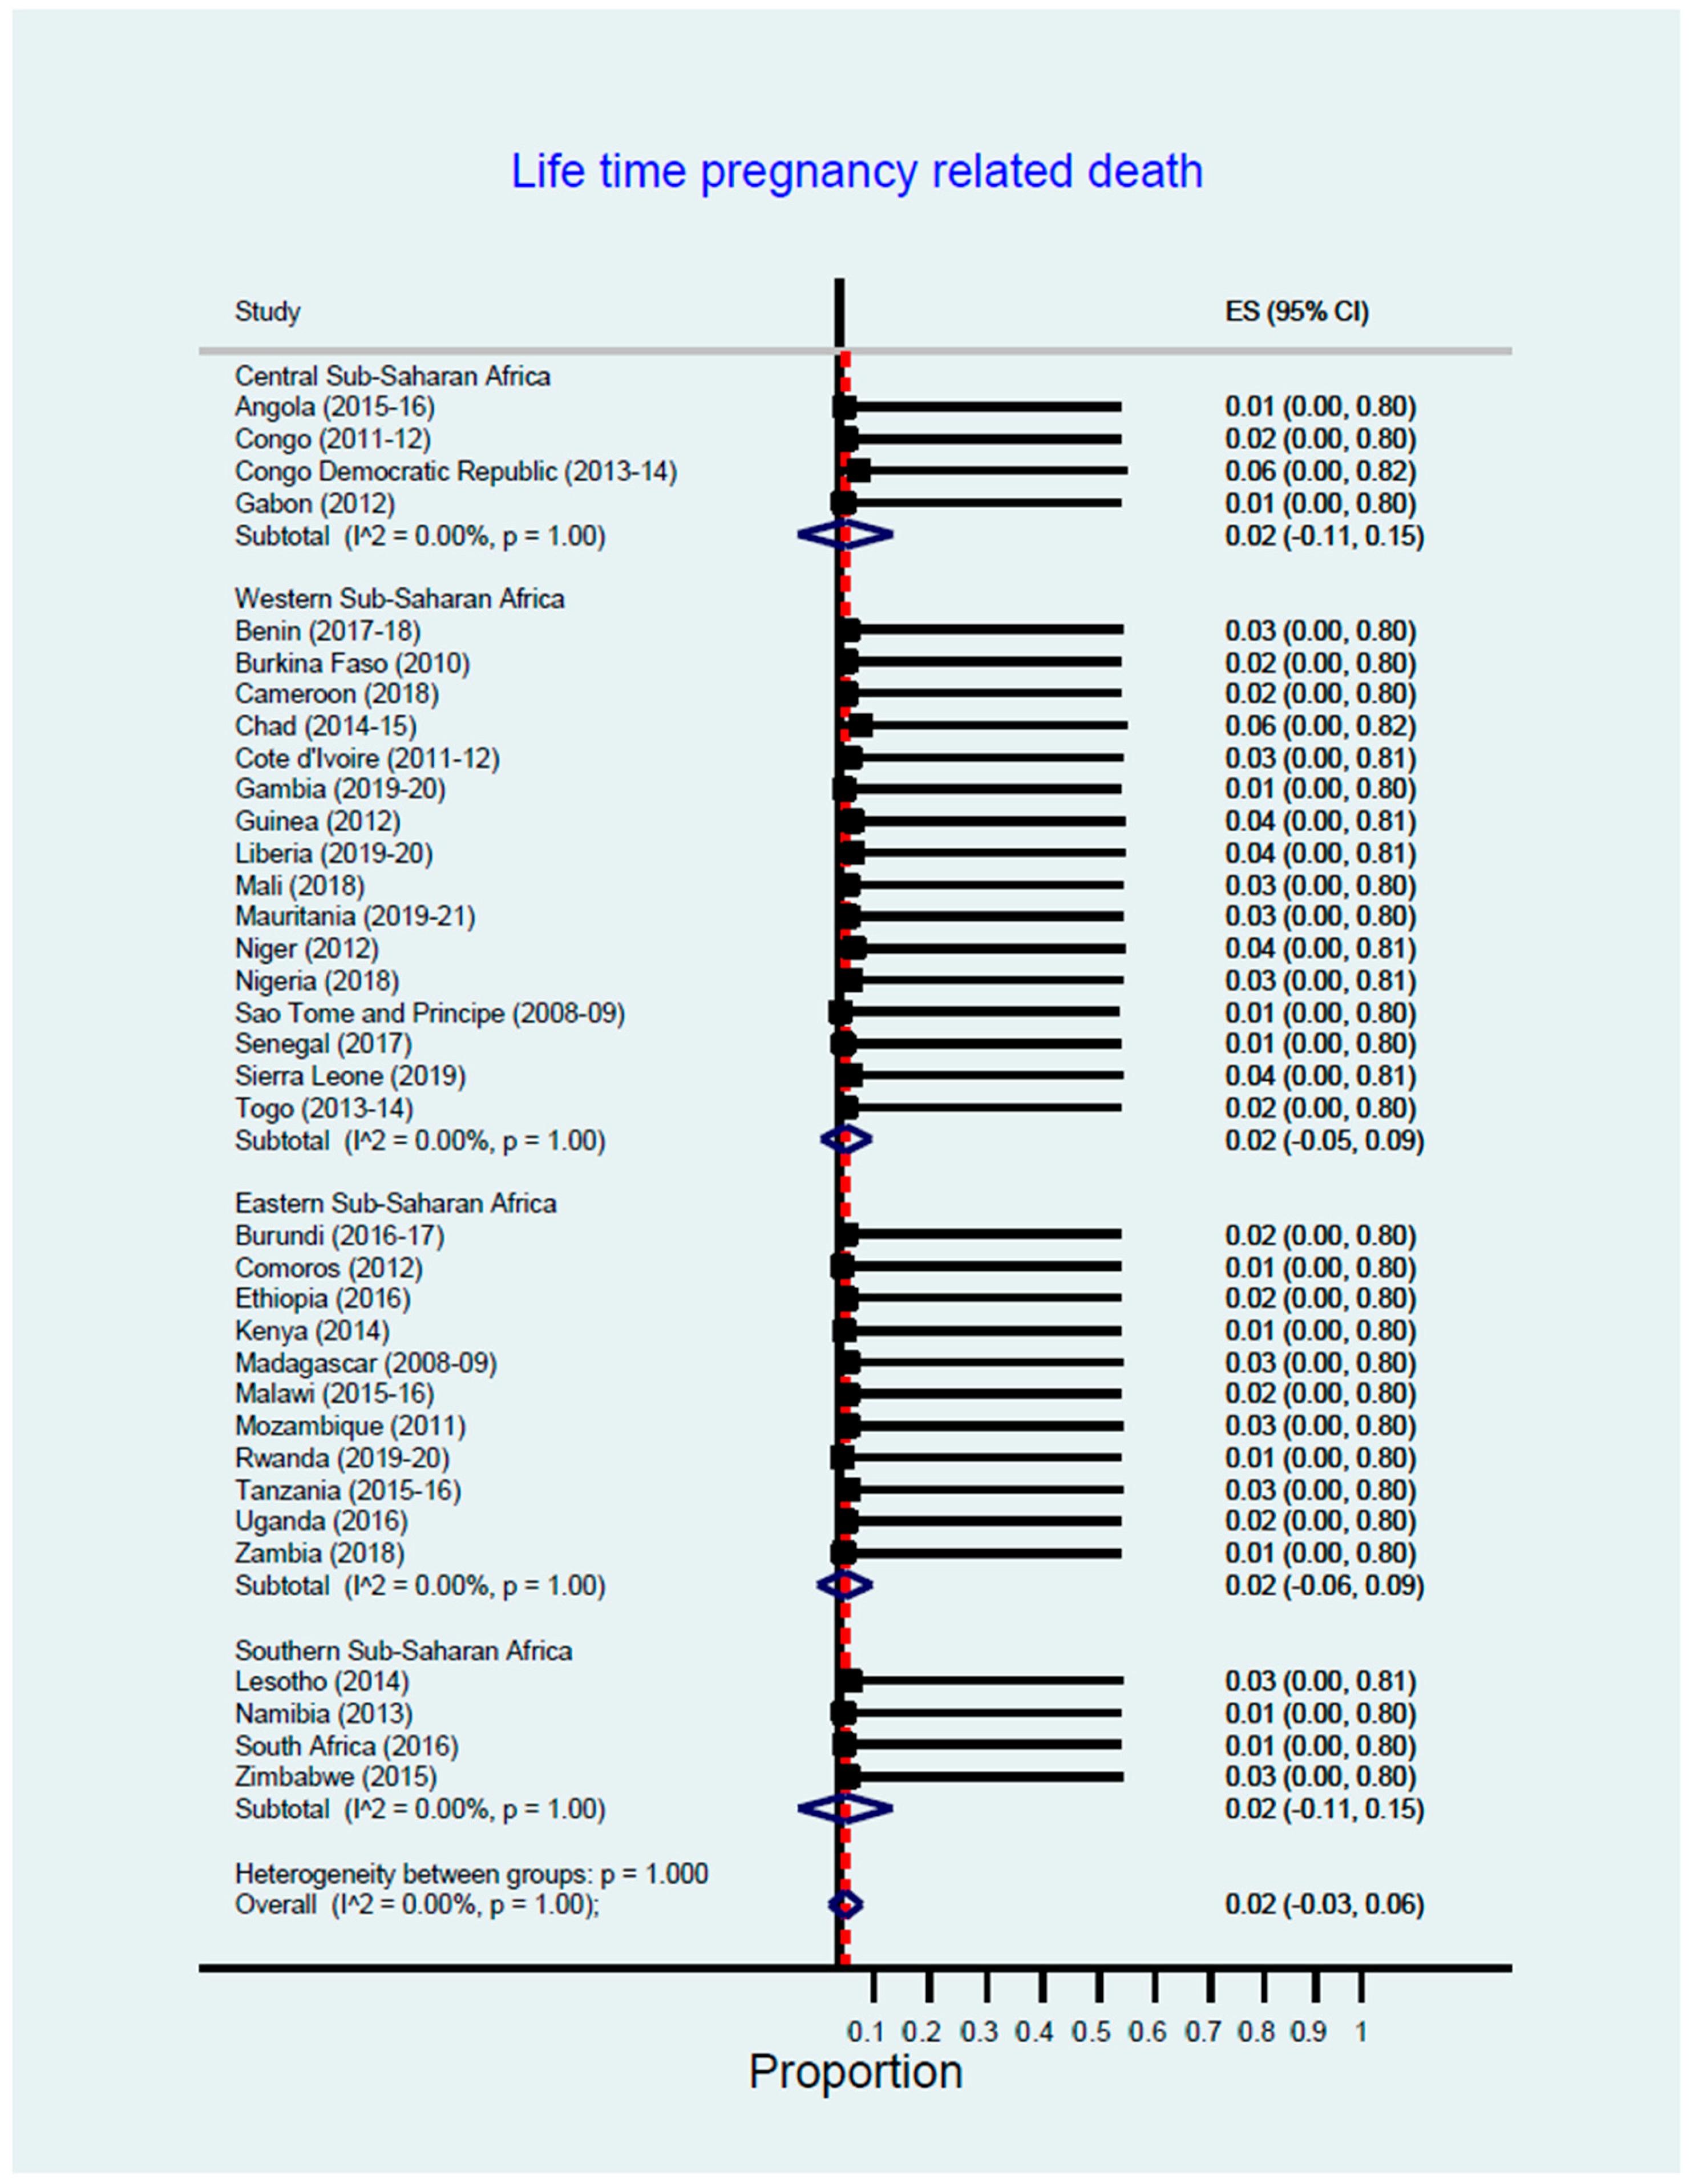
Figure 2 shows the lifetime risk of pregnancy-related death across sub-Saharan countries. The Congo Democratic Republic (0.06), Chad (0.06), Guinea, Liberia, Niger, and Sierra Leone (0.04) reported the highest lifetime risk of pregnancy-related deaths, calculated as 1-(1-pregnancy-related mortality ratios (PRMR))^total fertility rate (TFR).
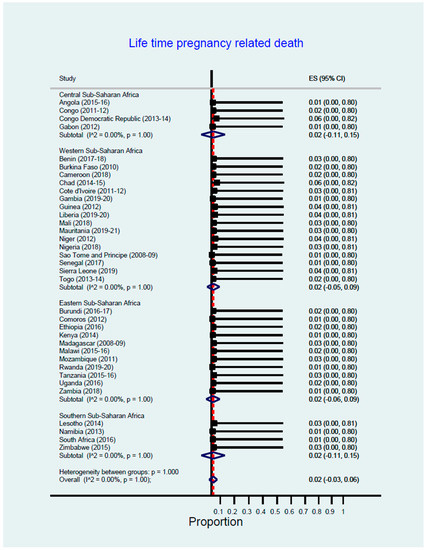
Figure 2.
Lifetime risk of pregnancy-related death.
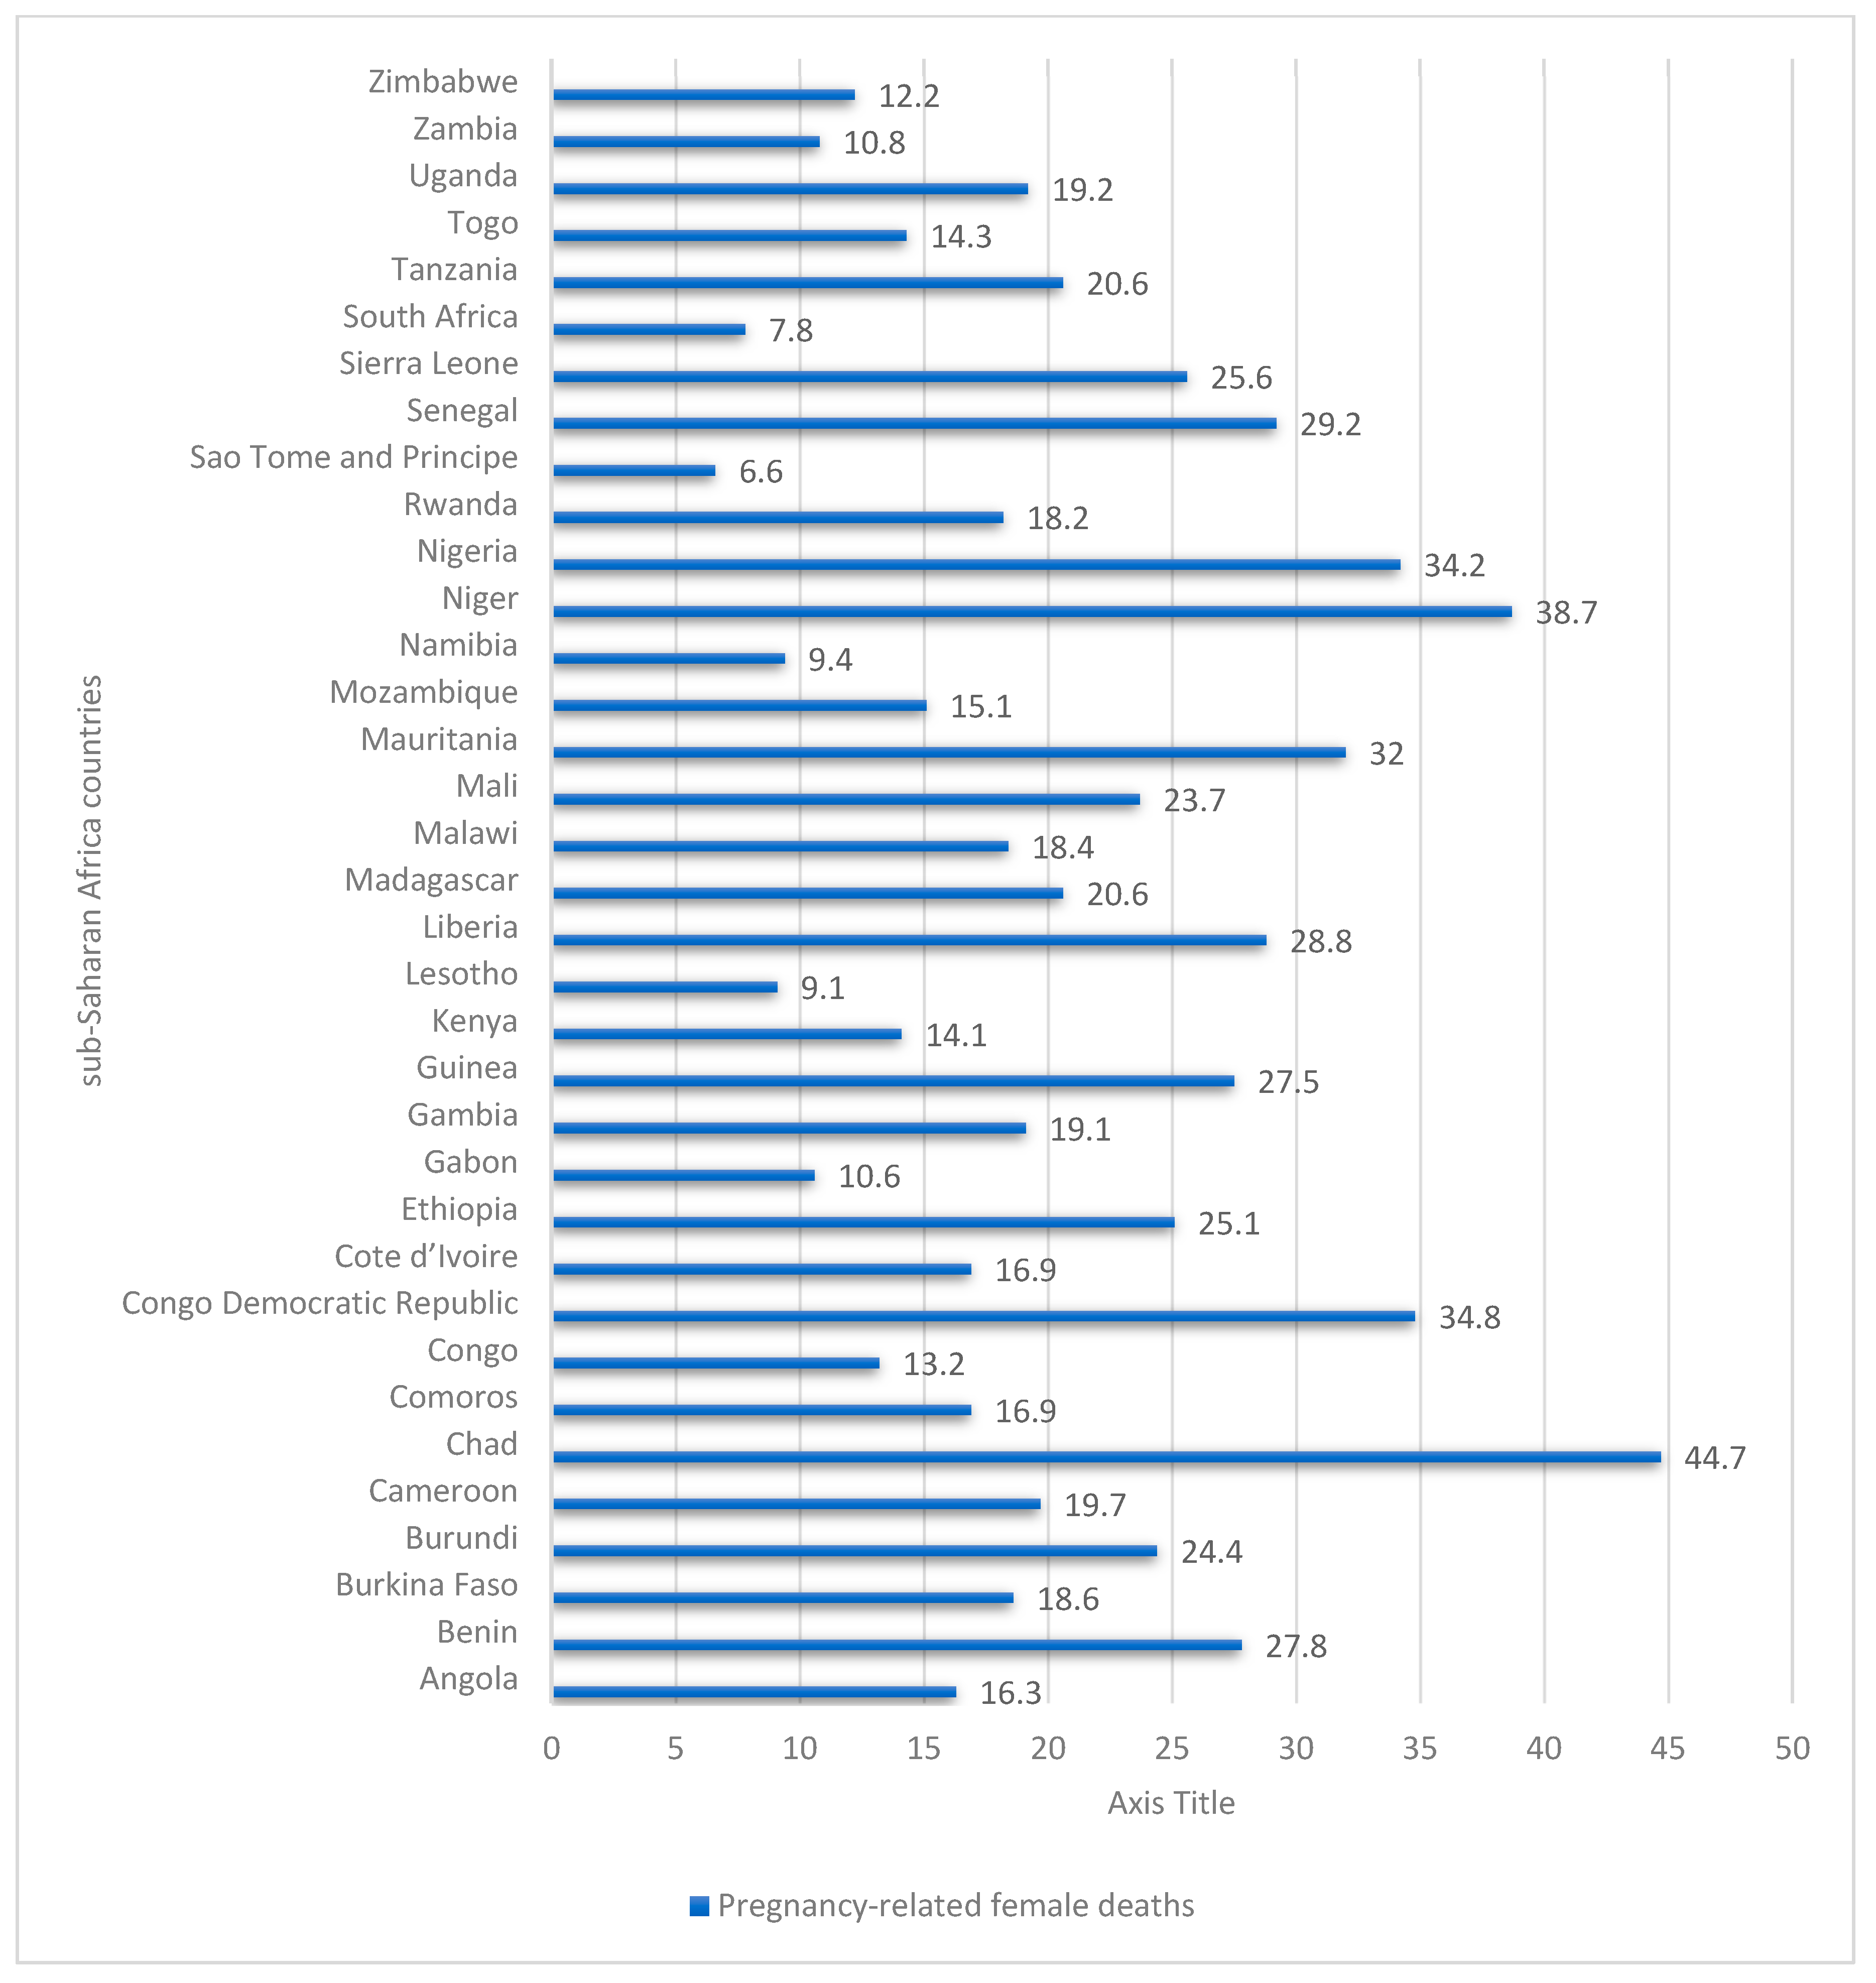
Table 2 shows female deaths that are pregnancy-related across sub-Saharan countries. The results show Chad (44.7%), Niger (38.7%), the Congo Democratic Republic (34.8%), Nigeria (34.2%), Mauritania (32.0%), Senegal (29.2%), Liberia (28.8%), Benin (27.8%), and Guinea (27.5%), respectively, reported the highest female deaths that are pregnancy-related.

Table 2.
Female deaths that are pregnancy-related.
Figure 3 shows that Chad, Niger, Congo Democratic Republic, Nigeria, Mauritania, Senegal, Liberia, Benin, and Guinea reported the highest female deaths that are pregnancy-related.
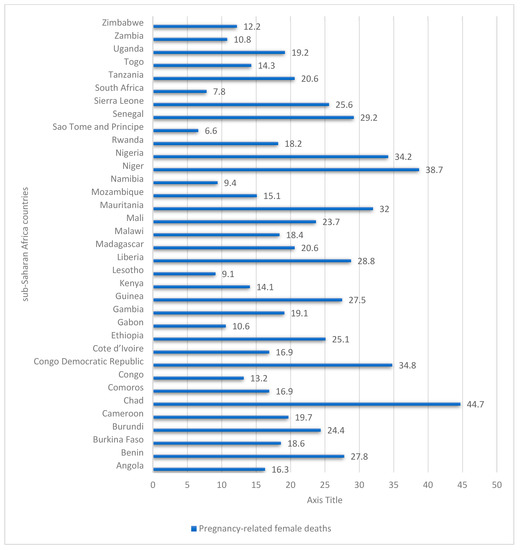
Figure 3.
Pregnancy-related female deaths in sub-Saharan Africa 2006–2021.
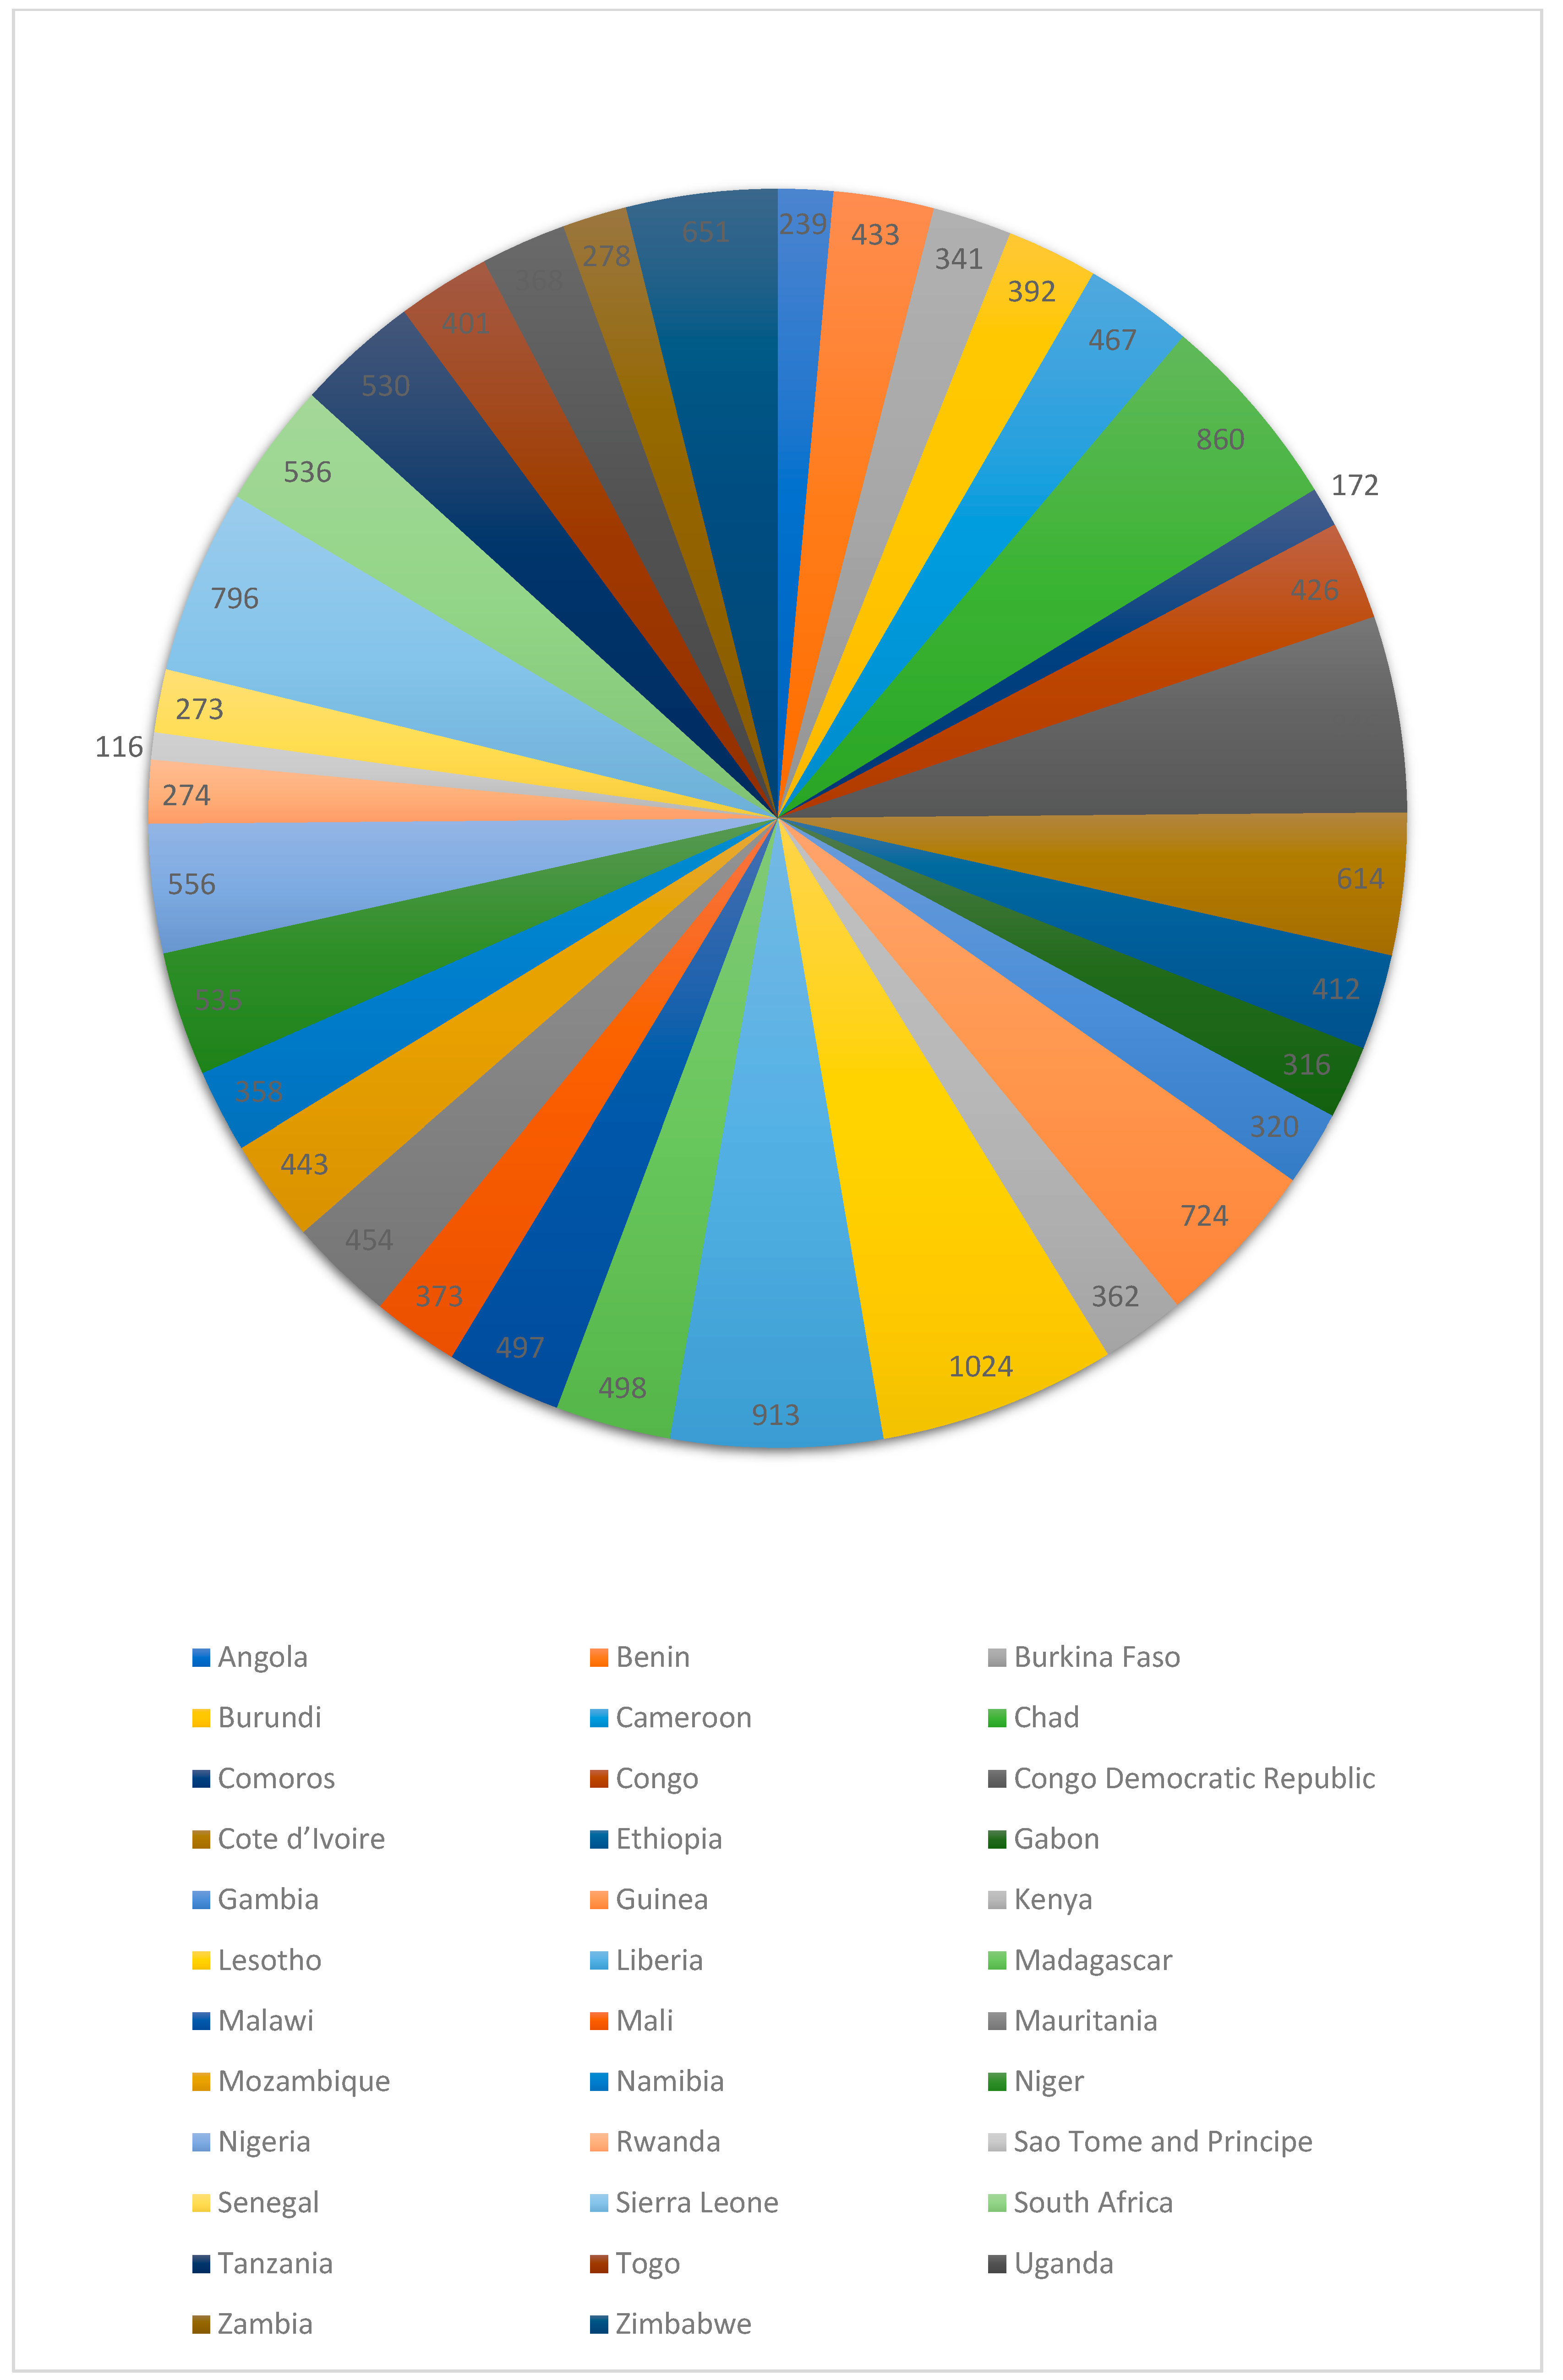
Table 3 shows the pregnancy-related mortality rate and ratio. Overall, Lesotho (1024; 95% CI: 731–1318), Liberia (913; 95% CI: 638–1189), Chad (860; 95% CI: 728–993), the Congo Democratic Republic (846; 95% CI: 690–1003), Sierra Leone (796; 95% CI: 632–960), and Guinea (724; 95% CI: 531–916) reported the leading pregnancy-related mortality ratio per 100,000 live births.

Table 3.
Pregnancy-related mortality rate and ratio.
Figure 4 shows pregnancy-related mortality rate and ratio. Overall, Lesotho, Liberia, Chad, Congo Democratic Republic, Sierra Leone and Guinea reported the highest pregnancy-related mortality ratio per 100,000 live births.
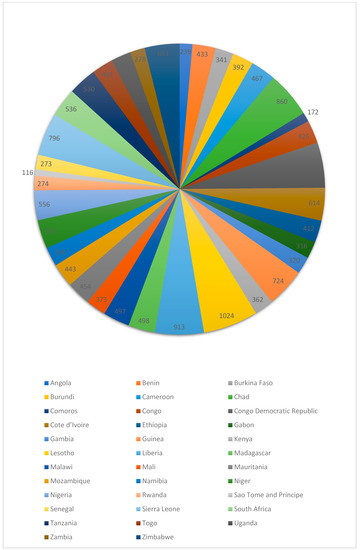
Figure 4.
Pregnancy-related mortality ratio (maternal deaths per 100 000 live births).
5. Discussion
The study examined the differentials in maternal mortality in SSA countries. We observed a large variation in maternal deaths; the large variation in maternal deaths in this region is well known and documented [3,4]. Indicating that the various strategies implemented in health facilities across SSA countries to reduce maternal deaths and improve MMR have not produced the desired result as MMR remains high. Additionally, the contrast between SSA countries with the lowest and highest MMR is indicative of what remains to be done. Similarly, a study that looked at the trends in maternal mortality in SSA reported similar results in their estimation of maternal mortality ratios, where many countries have higher MMR than the national average despite comprehensive interventions to address this issue [4].
In developing countries, maternal deaths can cause long-term social and economic breakdown in a mother’s immediate family and the wider community. The death of a mother can have a devastating impact on the livelihoods, quality of life, and survival chances of those she leaves behind. Households experiencing a maternal death spend roughly one-third of their income on pregnancy and child care, and funeral costs only add to the financial burden. Without the contribution of a mother, a family may be unable to meet basic needs such as food, shelter, and health care. In Africa, there are 985 people for every nurse-midwife and 3324 people for every medical doctor [15]. The African region has a shortage of maternity care providers, particularly midwives. Due to a lack of access to health care providers, pregnant women are unable to receive antenatal care, delivery care, or newborn care, increasing their risk of death from severe bleeding, infections, or other complications.
We examined the possibility of age-related death. The prevalence of death was higher among women who were 30 years and older than those aged 15 to 29 years. But a correlation with age in our study was only evident when comparing these two age groups. It has been hypothesized in other studies [16,17,18] that early (younger than 19) and late (above 35) pregnancy are risk factors for pregnancy-related maternal mortality, but we were not able to confirm this in our data. For women who are in their teens, their reproductive system may not be fully developed to withstand the physiological changes associated with pregnancy. Often, this age group is not psychologically, socially, or financially mature enough to make decisions concerning their health. On the other hand, women who are 35 years of age and older are at high risk of complications of pregnancy due to chronic health conditions; these health conditions expose women, particularly those aged 35 and older to a higher risk of an adverse outcome.
A notable finding from this study is the high prevalence of pregnancy-related maternal mortality among the study population. Women who were less than 30 years old in most of SSA countries had a higher prevalence of pregnancy-related death than women who were 30 years and older, though this pattern was not consistent across countries. It is well known that older women are at increased risk of maternal death. The low mortality rate among younger women less than 30 years old in some countries could be attributed to data limitations. The number of maternal deaths within each five-year age group on which these estimates are based was very small for some countries, making it difficult to reach clear conclusions and broaden uncertainty estimates. Another potential reason could be the under-reporting of maternal deaths in young women (<30 years); underreporting maternal deaths is well known in SSA [19,20] and is greater for young women than for other age groups [15]. Based on the country studied with low mortality rate in this study, maternal deaths among young women may be under-reported because of undisclosed pregnancies or fatalities linked to unsafe abortions. Further studies are needed to understand the factors that influence these different patterns.
Hemorrhage has been reported to be the leading cause of maternal death, accounting for more than one-quarter of all deaths. A similar proportion of maternal deaths were caused by pre-existing medical conditions that were exacerbated by pregnancy. A significant number of deaths are caused by hypertensive pregnancy disorders, particularly eclampsia, as well as sepsis, embolism, and complications from unsafe abortion [5,21]. The high maternal deaths observed in this study could be attributable to a lack of resources to provide quality maternal health care, as well as patient-related factors such as affordability and acceptability of maternal health services, which are common issues in SSA.
Despite established interventions to prevent and treat direct causes of maternal death, such as active management of the third stage of labor, the proportion of hemorrhage and hypertension deaths among pregnant women, especially in sub-Saharan countries, remains high. The proportion of maternal deaths caused by indirect causes has also continued to rise, and the perceived and technical quality of health care services provided is becoming increasingly important in the fight against maternal mortality, given the implications for both demand for and supply of services [22,23]. Our study observed that the pregnancy-related maternal mortality ratio was higher in western and southern sub-Saharan countries, with Lesotho, Liberia, Chad, Sierra Leone, Guinea, Zimbabwe, Cote d’Ivoire, Nigeria, South Africa, Niger, and Tanzania having the highest pregnancy-related maternal mortality ratios, in descending order. Sao Tome and Principe and Comoros have the lowest pregnancy-related maternal mortality ratios among the study countries. Differences in socioeconomic, demographic, and environmental characteristics across SSA may account for differences in maternal fatalities and MMR.
Although maternal mortality relating to pregnancy complications has not been drastically reduced in the sub-Saharan region. It is therefore necessary to affirm the submission by Batist, 2019, that maternal mortality is a human rights issue because the vast majority of maternal deaths in the sub-Saharan region are from pregnancy-related complications, which result from the region’s inequitable and oppressive conditions. He further submitted that, through an examination of the intersecting social determinants of gender, economics, and education in the regional context, maternal mortality in sub-Saharan Africa is a violation of human rights [24]. Therefore, to effectively alleviate this systemic global health burden and promote human flourishing, maternal mortality should be structured and recognized as a fundamental human rights issue.
6. Strength and Limitation
We looked for plausible comparisons using large national datasets. The ability to combine multiple countries is a significant advantage. This research can be used as a scorecard for various countries to show how well their healthcare systems fare in terms of female reproductive health issues. A call to strengthen current programs relating to appropriate reproductive and sexual health care and practices may result from this, as well as more coordinated efforts, new policies, and programs. The findings of this study should prompt further research into pregnancy-related deaths in settings with scarce resources. Nevertheless, we gathered information from various countries at various times using a cross-sectional study. It might have potential influences on the socioeconomic state of each nation that are related to the variables of the study. Political climate, the expansion of medical facilities, and governmental health policies are just a few of the factors that could result in a different capture of socioeconomic conditions over time in each country. This may result in sampling bias. Additionally, other causes of maternal mortality in sub-Saharan Africa were not explored in this study. Future studies of maternal mortality should explore the contribution of socioeconomic factors influencing maternal deaths and identify specific causes of maternal deaths overall in the region.
7. Conclusions
Sub-Saharan African countries continue to experience unacceptably high risks of maternal deaths, indicating that a number of unaddressed challenges still exist, including sociodemographic and health care delivery. The persisting variation in maternal deaths in this region suggests a greater emphasis on improving the quality of care. These high rates of maternal deaths are a significant challenge for health systems, as they point to significant inequities in access to quality obstetric care. High-quality obstetric care is crucial to addressing the high levels of maternal deaths in this region. Universal health coverage services also need to be improved throughout SSA to reduce maternal mortality. At the same time, addressing the underlying social determinants of health, such as socio-economic status and disadvantaged communities and rural areas, is crucial to reducing maternal deaths since they are linked to health conditions that result in maternal morbidity and mortality. Additionally, policies and interventions that are aimed at reducing maternal morbidity and deaths need to be revised for better and more effective maternal health services in SSA. Women should be informed about the importance of maternal care and planned births at health facilities. The government and stakeholders in SSA countries should further enhance their policies in order to reduce maternal deaths and MMR by establishing and implementing strategies to improve maternal health.
Author Contributions
Conceptualization, O.C.O. and M.E.; Methodology, O.C.O. and M.E.; Software, M.E.; Validation, O.C.O., C.I.N., M.E. and E.F.O.; Formal analysis, O.C.O. and M.E.; Investigation, O.C.O., C.I.N., M.E., E.F.O., A.I.W. and C.K.E.; Resources, M.E.; Data curation, M.E.; Writing—original draft, O.C.O., C.I.N., M.E., E.F.O., A.I.W. and C.K.E.; Writing—review & editing, O.C.O., C.I.N., M.E., E.F.O., A.I.W. and C.K.E.; Visualization, O.C.O., C.I.N., M.E. and E.F.O.; Supervision, M.E.; Project administration, O.C.O., C.I.N., M.E., E.F.O., A.I.W. and C.K.E. All authors have read and agreed to the published version of the manuscript.
Funding
The Inner City Fund (ICF) provided technical assistance throughout the survey program with funds from the United States Agency for International Development (USAID). However, there was no funding or sponsorship for this study or the publication of this article.
Institutional Review Board Statement
Ethics approval was not required for this study because the authors used secondary data that was freely available in the public domain. As a result, IRB approval is not required for this study. More information about DHS data and ethical standards can be found at: http://dhsprogram.com/data/available-datasets.cfm (accessed on 5 January 2023).
Informed Consent Statement
The Demographic and Health Survey is an open-source dataset that has been de-identified. As a result, the consent for publication requirement is not applicable.
Data Availability Statement
Data for this study were obtained from the National Demographic and Health Surveys (DHS) of the studied African countries, which can be found at http://dhsprogram.com/data/available-datasets.cfm (accessed on 5 January 2023).
Acknowledgments
The authors are grateful to the MEASURE DHS project for granting permission to use and access to the original data.
Conflicts of Interest
The authors state that the research was carried out in the absence of any commercial or financial partnerships or connections that could be interpreted as potential conflicts of interest.
References
- Maternal Mortality. Available online: https://www.who.int/news-room/fact-sheets/detail/maternal-mortality (accessed on 2 December 2022).
- UNICEF DATA. Maternal Mortality Rates and Statistics. Available online: https://data.unicef.org/topic/maternal-health/maternal-mortality/ (accessed on 2 December 2022).
- Merdad, L.; Ali, M.M. Timing of maternal death: Levels, trends, and ecological correlates using sibling data from 34 sub-Saharan African countries. PLoS ONE 2018, 13, e0189416. [Google Scholar] [CrossRef] [PubMed]
- Onambele, L.; Ortega-Leon, W.; Guillen-Aguinaga, S.; Forjaz, M.J.; Yoseph, A.; Guillen-Aguinaga, L.; Alas-Brun, R.; Arnedo-Pena, A.; Aguinaga-Ontoso, I.; Guillen-Grima, F. Maternal Mortality in Africa: Regional Trends (2000–2017). Int. J. Environ. Res. Public Health 2022, 19, 13146. [Google Scholar] [CrossRef] [PubMed]
- Musarandega, R.; Nyakura, M.; Machekano, R.; Pattinson, R.; Munjanja, S.P. Causes of maternal mortality in Sub-Saharan Africa: A systematic review of studies published from 2015 to 2020. J. Glob. Health 2021, 11, 04048. [Google Scholar] [CrossRef] [PubMed]
- GBD 2015 Maternal Mortality Collaborators. Global, regional, and national levels of maternal mortality, 1990–2015: A systematic analysis for the Global Burden of Disease Study 2015. Lancet Lond. Engl. 2016, 388, 1775–1812. [Google Scholar] [CrossRef]
- Say, L.; Chou, D.; Gemmill, A.; Tunçalp, Ö.; Moller, A.-B.; Daniels, J.; Gülmezoglu, A.M.; Temmerman, M.; Alkema, L. Global causes of maternal death: A WHO systematic analysis. Lancet Glob. Health 2014, 2, E323–E333. [Google Scholar] [CrossRef] [PubMed]
- Institutional Maternal and Perinatal Deaths: A Review of 40 Low and Middle Income Countries—PubMed. Available online: https://pubmed.ncbi.nlm.nih.gov/28882128/ (accessed on 2 December 2022).
- Neal, S.; Mahendra, S.; Bose, K.; Camacho, A.V.; Mathai, M.; Nove, A.; Santana, F.; Matthews, Z. The causes of maternal mortality in adolescents in low and middle income countries: A systematic review of the literature. BMC Pregnancy Childbirth 2016, 16, 352. [Google Scholar] [CrossRef]
- Kumar, S.; Kumar, N.; Vivekadhish, S. Millennium development goals (MDGS) to sustainable development goals (SDGS): Addressing unfinished agenda and strengthening sustainable development and partnership. Indian J. Community Med. 2016, 41, 1. [Google Scholar] [CrossRef] [PubMed]
- Demographic and Health Surveys (DHS) Data. Available online: http://api.dhsprogram.com/rest/dhs/indicators?f=html (accessed on 5 January 2023).
- Owobi, O.U.; Okonji, O.C.; Nzoputam, C.I.; Ekholuenetale, M. Country-Level Variations in Overweight and Obesity among Reproductive-Aged Women in Sub-Saharan Countries. Women 2022, 2, 313–325. [Google Scholar] [CrossRef]
- Ekholuenetale, M.; Nzoputam, C.I.; Okonji, O.C. Sub-Regional Variations in Sexually Transmitted Infections Manifesting as Vaginitis among Reproductive-Aged Women in Sub-Saharan Countries. Venereology 2022, 1, 245–261. [Google Scholar] [CrossRef]
- Corsi, D.J.; Neuman, M.; Finlay, J.E.; Subramanian, S.V. Demographic and health surveys: A profile. Int. J. Epidemiol. 2012, 41, 1602–1613 . [Google Scholar] [CrossRef]
- Global Citizen. Why Maternal Mortality Is So High in Sub-Saharan Africa. In Global Citizen [Internet]. 2022. Available online: https://www.globalcitizen.org/en/content/maternal-mortality-sub-saharan-africa-causes/ (accessed on 5 January 2023).
- Okonofua, F.E.; Abejide, A.; Makanjuola, R.A. Maternal mortality in Ile-Ife, Nigeria: A study of risk factors. Stud. Fam. Plan. 1992, 23, 319–324. [Google Scholar] [CrossRef]
- Alkema, L.; Chou, D.; Hogan, D.; Zhang, S.; Moller, A.B.; Gemmill, A.; Fat, D.M.; Boerma, T.; Temmerman, M.; Mathers, C.; et al. Global, regional, and national levels and trends in maternal mortality between 1990 and 2015, with scenario-based projections to 2030: A systematic analysis by the UN Maternal Mortality Estimation Inter-Agency Group. Lancet 2016, 387, 462–474. [Google Scholar] [CrossRef] [PubMed]
- Diguisto, C.; Saucedo, M.; Kallianidis, A.; Bloemenkamp, K.; Bødker, B.; Buoncristiano, M.; Donati, S.; Gissler, M.; Johansen, M.; Knight, M.; et al. Maternal mortality in eight European countries with enhanced surveillance systems: Descriptive population based study. BMJ 2022, 379, e070621. [Google Scholar] [CrossRef] [PubMed]
- Abouchadi, S.; Zhang, W.-H.; De Brouwere, V. Underreporting of deaths in the maternal deaths surveillance system in one region of Morocco. PLoS ONE 2018, 13, e0188070. [Google Scholar] [CrossRef] [PubMed]
- Said, A.; Malqvist, M.; Pembe, A.B.; Massawe, S.; Hanson, C. Causes of maternal deaths and delays in care: Comparison between routine maternal death surveillance and response system and an obstetrician expert panel in Tanzania. BMC Health Serv. Res. 2020, 20, 614. [Google Scholar] [CrossRef] [PubMed]
- Horon, I.L. Underreporting of Maternal Deaths on Death Certificates and the Magnitude of the Problem of Maternal Mortality. Am. J. Public Health 2005, 95, 478–482. [Google Scholar] [CrossRef] [PubMed]
- Alvarez, J.L.; Gil, R.; Hernández, V.; Gil, A. Factors associated with maternal mortality in Sub-Saharan Africa: An ecological study. BMC Public Health 2009, 9, 462. [Google Scholar] [CrossRef] [PubMed]
- Filippi, V.; Chou, D.; Ronsmans, C.; Graham, W.; Say, L. Levels and Causes of Maternal Mortality and Morbidity. In Disease Control Priorities, 3rd ed.; Reproductive, Maternal, Newborn, and Child Health; The World Bank: Washington, DC, USA, 2016; Volume 2, pp. 51–70. [Google Scholar] [CrossRef]
- Batist, J. An intersectional analysis of maternal mortality in Sub-Saharan Africa: A human rights issue. J. Glob. Health 2019, 9, 010320. [Google Scholar] [CrossRef] [PubMed]
Disclaimer/Publisher’s Note: The statements, opinions and data contained in all publications are solely those of the individual author(s) and contributor(s) and not of MDPI and/or the editor(s). MDPI and/or the editor(s) disclaim responsibility for any injury to people or property resulting from any ideas, methods, instructions or products referred to in the content. |
© 2023 by the authors. Licensee MDPI, Basel, Switzerland. This article is an open access article distributed under the terms and conditions of the Creative Commons Attribution (CC BY) license (https://creativecommons.org/licenses/by/4.0/).

