Article

Extraction, Quantification, and Characterization of Chitin from Marine Biofouling Organisms Amphipods (Jassa sp.) and Hydroids (Coryne sp.)

by
Christopher Selvoski
1,
Camila Flor Lobarbio
1,
Matthew Plowman-Holmes
2,
Peter Bell
1,
Benie Chambers
1 and
Mathew Cumming
1,*
1
Seafood Technology, Plant & Food Research Group, Bioeconomy Science Institute, 297 Akersten St., Port Nelson, Nelson 7010, New Zealand
2
Food & Bioproducts Technology, Plant & Food Research Group, Bioeconomy Science Institute, 74 Gerald St., Lincoln 7608, New Zealand
*
Author to whom correspondence should be addressed.
Polysaccharides 2025, 6(4), 87; https://doi.org/10.3390/polysaccharides6040087
Submission received: 13 August 2025 / Revised: 17 September 2025 / Accepted: 30 September 2025 / Published: 3 October 2025

Abstract

As the demand for chitin grows, new chitin sources with unique physicochemical properties are required. Abundant biofouling species, such as amphipods and hydroids, have chitinous skeletal systems that can be utilized for chitin production. However, little is known about these chitin sources. This study investigated the viability of amphipods (Jassa sp.) and hydroids (Coryne sp.) obtained from aquaculture biofouling assemblages as novel sources of chitin. Chitin was extracted from these sources and characterized in terms of its degree of acetylation (DA), crystallinity index (CrI), molecular weight (MW), thermal stability, and surface morphology. Physiochemical characteristics where then compared against commercially available shrimp chitin. Results show that a 32.75% chitin yield can be obtained from hydroids. The percentage DA for amphipod (AC) and hydroid (HC) chitin is 58.4–59.2% and 64.8–66.7%, respectively. AC is characterized as α-chitin with a low molecular weight (MW), while HC is medium-MW β-chitin. This finding is significant because it shows hydroids to be a new source of rare β-chitin. In addition, AC has higher thermal stability than HC. AC and HC greatly differ in terms of surface morphology. Therefore, the chitin biomaterials extracted from amphipods and hydroids have different but favorable properties that can be used for diverse applications.

1. Introduction

Chitin, a carbohydrate composed of β-(1,4) linked N-acetyl-D-glucosamine units, is the second most abundant biological macromolecule after cellulose [1]. Chitin and its deacetylated derivative, chitosan, are often considered good biological sources for the creation of high-value materials because they are biocompatible, biodegradable, biofunctional, and environmentally friendly [2]. These favorable characteristics allow chitin-based materials to be used in a wide range of applications, including regenerative medicine, agriculture, food technology, drug delivery, water treatment, and the fabrication of biodegradable plastics [3].
Knowing and understanding the physicochemical properties of a chitin sample is an important step in determining potential applications. Usually determined by its source, chitin exists in one of three allomorphic forms. The most abundant and chemically stable allomorph, α-chitin, has anti-parallel polymer chains and is often extracted from the exoskeletons of crustaceans and arthropods [4]. Owing to its antiparallel arrangement, α-chitin has strong inter-sheet and intra-sheet bonds and a high crystallinity index (CrI). β-chitin, which is less common, is often derived from the Loligo squid pen and has parallel polymer chains. This parallel arrangement creates weak intra-sheet bonds, leading to lower CrI and higher reactivity, solubility, and solvent affinity [5]. It has also been shown that β-chitin has lower thermal stability than α-chitin because of its parallel polymer arrangement [6]. The third allomorph, γ-chitin, has characteristics of both α- and β- chitin, because its polymer chains have an alternating parallel and anti-parallel arrangement [5,7]. Physicochemical properties such as the degree of acetylation (DA), molecular weight (MW), and CrI are affected by both extraction conditions and the source of chitin [8]. Given the variability in chitin’s physicochemical properties, identifying new sources is crucial for expanding its potential applications.
The global aquaculture industry reached a new production high of 130.9 million tons valued at over USD 312.8 billion in 2022 and is projected to increase another 17% by 2032 [9]. As global aquaculture continues to grow, it becomes increasingly important to tackle critical challenges, including the effective management, removal, and utilization of biofouling. Biofouling, the unwanted settlement and growth of aquatic species on natural and artificial surfaces, afflicts the global aquaculture industry and is one of the primary causes preventing efficient and sustainable production [10]. Current estimates place the monthly biofouling accumulation at three tonnes per 40 × 40 m aquaculture pen [11]. While the management of biofouling can vary based on location, season and species, estimates place its cost at 5–30% of total aquaculture production costs [10,12,13]. Biofouling management can also lead to negative environmental effects [14,15]. Organisms dislodged during regular, in situ net cleaning have the potential to create or exasperate health, pollution and biosecurity risks, with harmful debris impacting areas as far as 5.5 km away [11,14,15]. Alternatively, these negative environmental impacts can be avoided by capturing biofouling debris during the cleaning process. Once captured, high-value compounds can be extracted from common biofouling organisms. This practice would both reduce the amount of aquaculture waste sent to landfill and present an opportunity for the aquaculture industry to partially recuperate operational costs while also contributing to a more circular blue economy.
Biofouling is a broad term encompassing numerous species that change based on location, substrate, season and growth time. While biofouling composition is variable, some organisms are commonly found in biofouling communities globally, including barnacles, bivalves, bryozoans, ascidians, hydroids, amphipods, and algae [16,17,18]. Two organisms of particular interest are amphipods and hydroids. Amphipods are malacostracan crustaceans that can account for up to 80% of epifauna in some communities [17]. Hydroids are small, often colonial invertebrates of the class Hydrozoa, which have been found to represent 46% of some community’s biomass. Amphipods and hydroids are similar in that they both have chitinous skeletal systems [19,20]. With this inherent characteristic, amphipods and hydroids can both be possible alternative sources of chitin.
Owing to the lack of reported chitin research on biofouling species, particularly amphipods (Jassa sp.) and hydroids (Coryne sp.), we looked at the viability of these two species as new chitin sources. Amphipods and hydroids were collected from ropes and netting from aquaculture mooring sites in Tasman Bay, New Zealand. Chitin from each species was extracted and quantified. Extracted chitin was then characterized by determining the DA, structural confirmation, CrI, and MW. The thermal stability and surface morphology were also observed. All measured characteristics were then compared against those of commercial chitin derived from shrimp shells.

2. Materials and Methods

2.1. Materials

Amphipods (Jassa sp.) and hydroids (Coryne sp.) were obtained in October 2022 from a biofouling assemblage growing in Tasman Bay, New Zealand. The entire assemblage was removed from the water and transported on ice to Plant & Food Research, Nelson, New Zealand, where the different organisms were identified, separated, and stored at −20 °C before processing.
Commercial chitin from shrimp shells was purchased from Sigma Aldrich, Auckland, New Zealand. Sodium hydroxide (NaOH) pellets, 36% HCl, and urea were purchased from Thermo Fisher Scientific Ltd., Auckland, New Zealand. Unless otherwise noted, all reagents were analytical reagent grade and used as received.

2.2. Chitin Extraction and Quantification

Chitin extraction was conducted using an established method [21] with slight modifications. In brief, chitin extraction involves an initial demineralization step to remove the acid-soluble fraction, followed by a deproteinization step to remove the base-soluble fraction. After both steps, the remaining undissolved solids (chitin) are recovered.

2.2.1. Pre-Treatment

The collected organisms were defrosted and manually separated while being washed with fresh water to remove salt. After washing, the samples were frozen and stored at −20 °C before being lyophilized. Lyophilized samples were ground into a fine powder using an MF 10 basic microfine grinder drive (IKA, Staufen im Breisgau, Germany) fitted with a cutting-grinding head and a sieve insert with a hole size of 1 mm. The grinder drive was set to a speed of 5000 rpm, as per the manufacturer’s instructions

2.2.2. Demineralization

Powders (Figure 1a,c) were demineralized by combining one part powdered sample with 50 parts 1 M HCl. The mixture was held at 60 °C with shaking for 5 h, after which the mixture was filtered using a 100-µm nylon membrane and washed with deionized (DI) water until the filtrate had a pH of 7. The recovered solids were dried at 80 °C overnight.

2.2.3. Deproteinization

Demineralized powders were then deproteinized by combining one part demineralized powder with 50 parts 1.5 M NaOH. The mixture was held at 60 °C with shaking for 5 h, after which the mixture was filtered using a 100-µm nylon membrane and washed with DI water until the filtrate had a pH of 7. The recovered solids were dried at 80 °C overnight.

2.2.4. Quantification

Chitin content was calculated using the following equation:
% c h i t i n = 100 × m p m i
where mi is the initial mass and mp is the mass after deproteinization.

2.3. Degree of Acetylation (DA) Determination

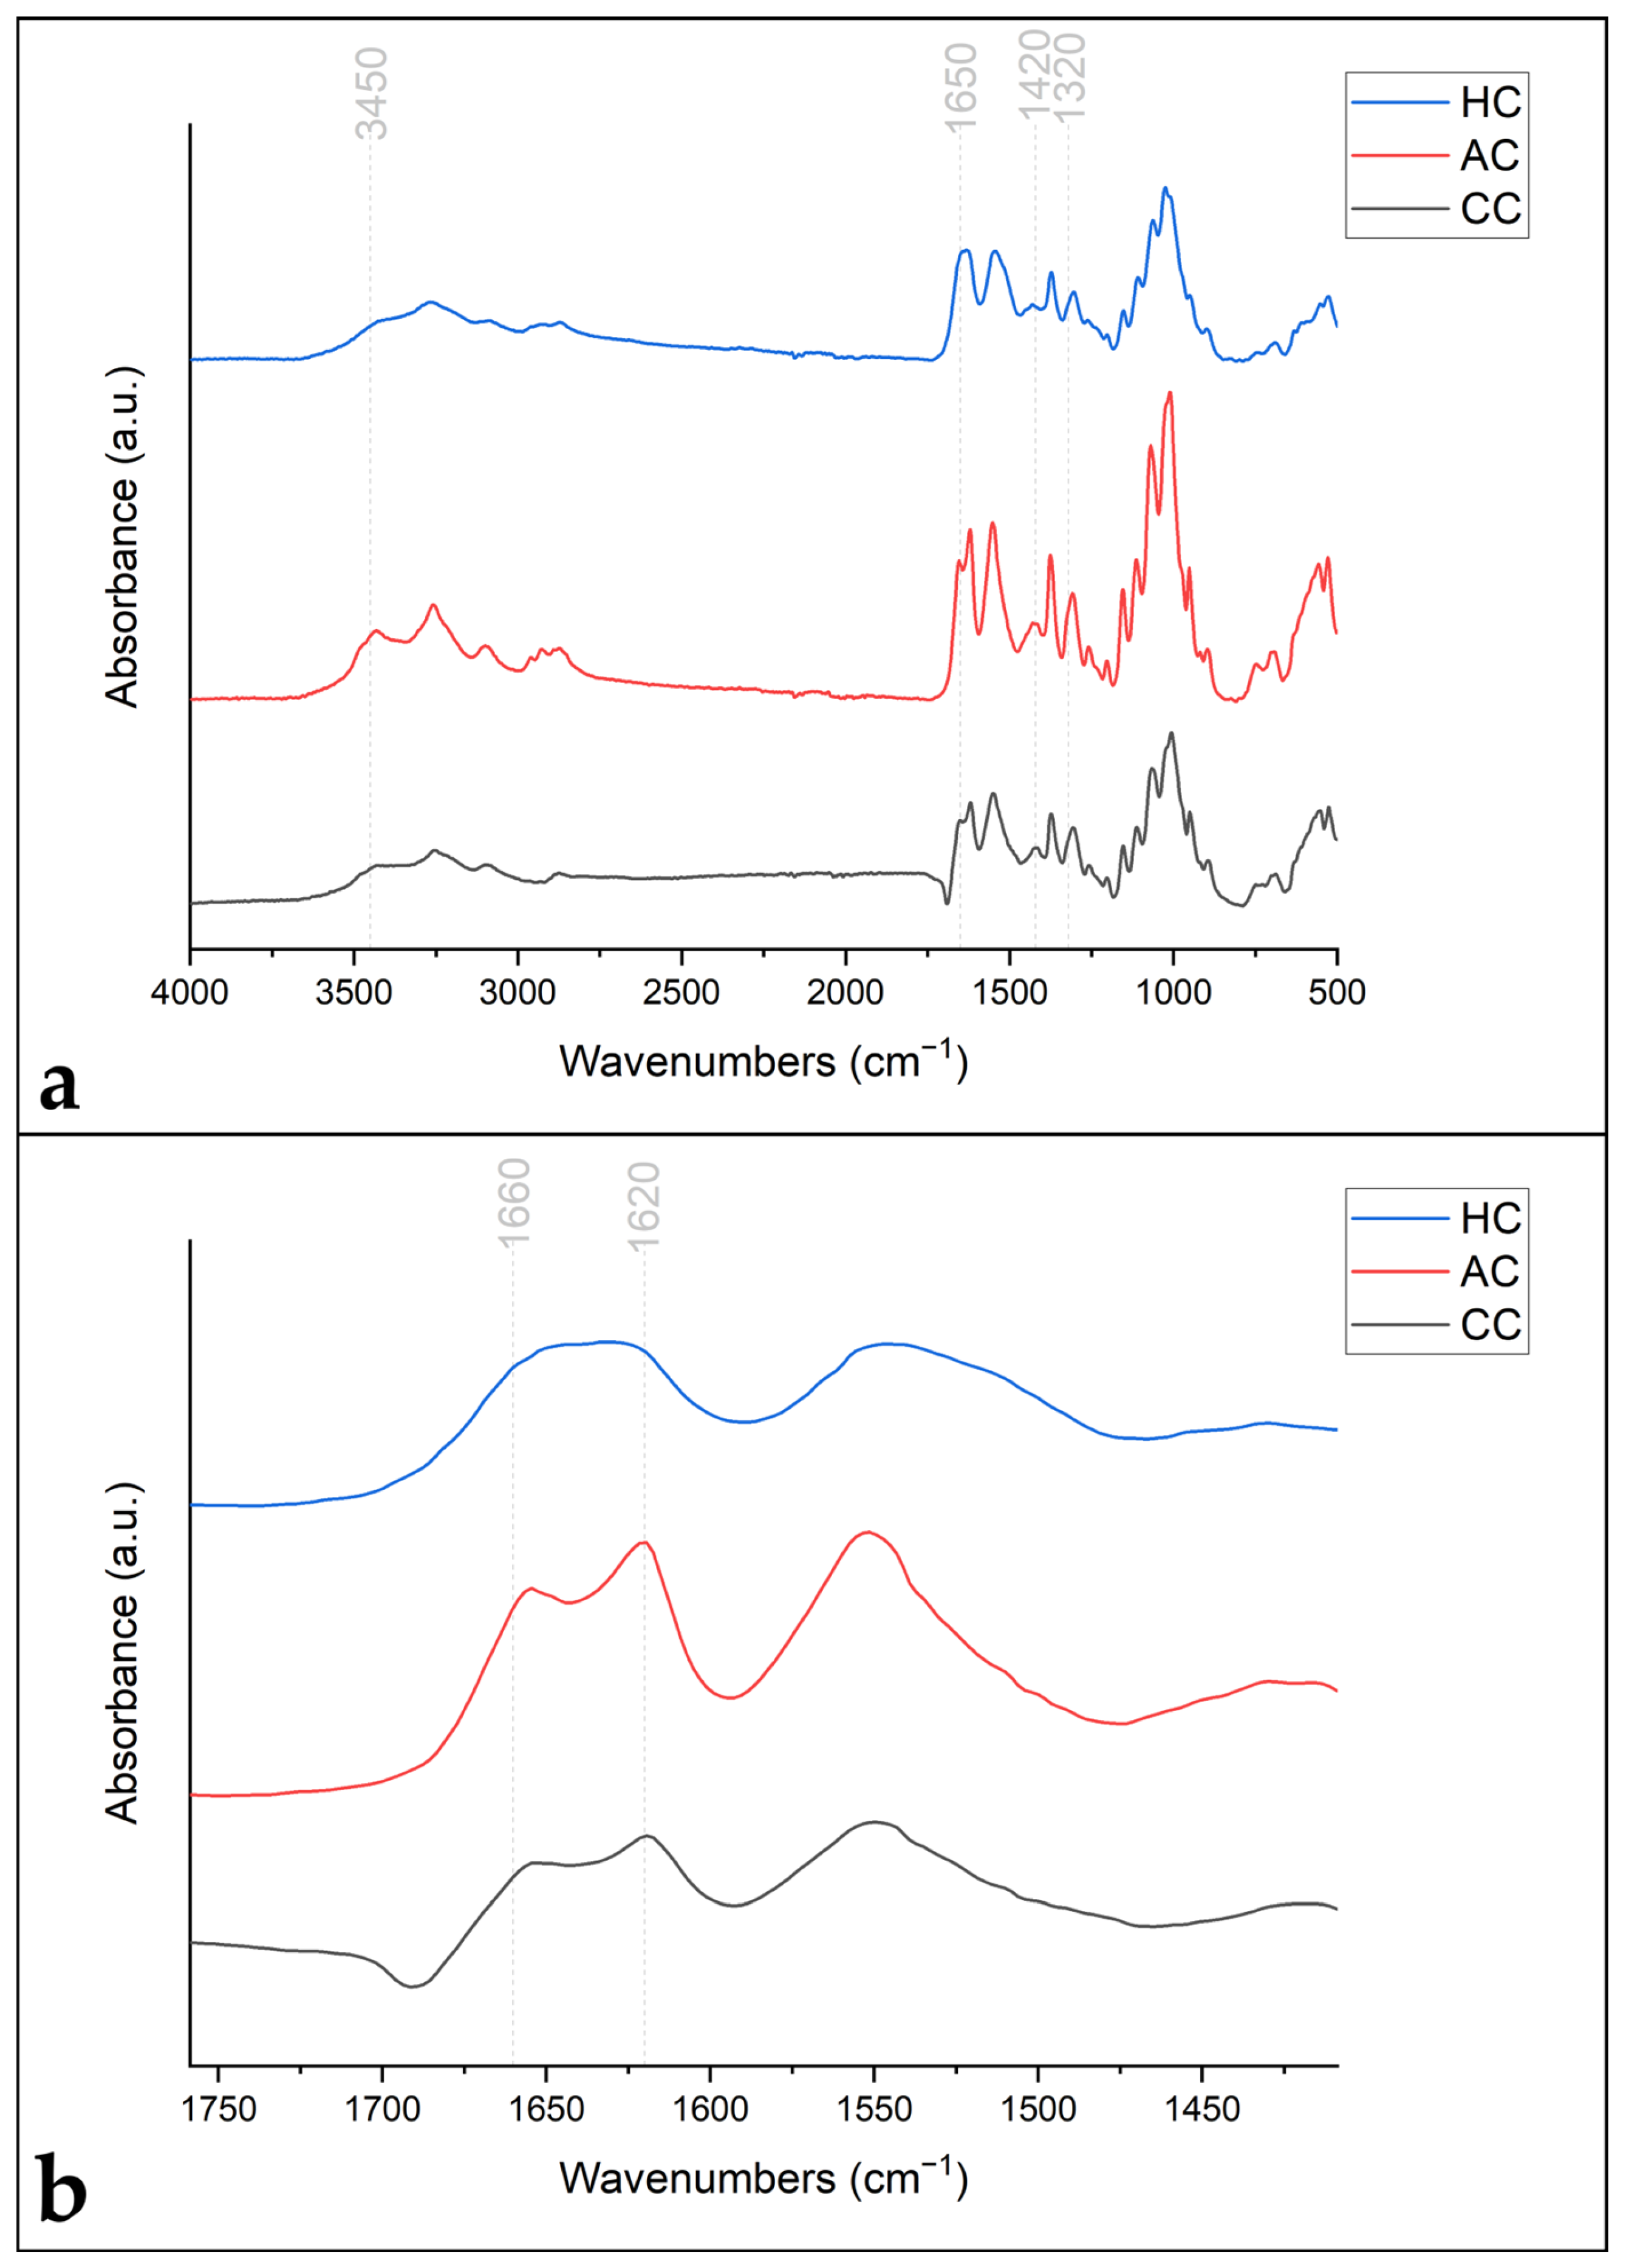
Extracted chitin samples (Figure 1b,d,e) were characterized by Fourier Transform Infrared spectroscopy (FTIR) using a Bruker (Billerica, MA, USA) Alpha II FTIR spectrometer. Absorbance values were measured between 4000 and 400 cm−1 and were recorded by accumulating 64 scans with a resolution of 4 cm−1. The degree of acetylation (DA) was first calculated using the equation [22]:
D A % = A 1320 A 1420 0.3822 0.03133
where A1320 and A1420 are the absorbance values at 1320 and 1420, respectively. DA was then confirmed using the equation [23]:
D A % = A 1650 A 3450 / 1.33 × 100
where A1650 and A3450 are the absorbance values at 1650 and 3450, respectively.

2.4. Crystallinity Index (CrI) Determination

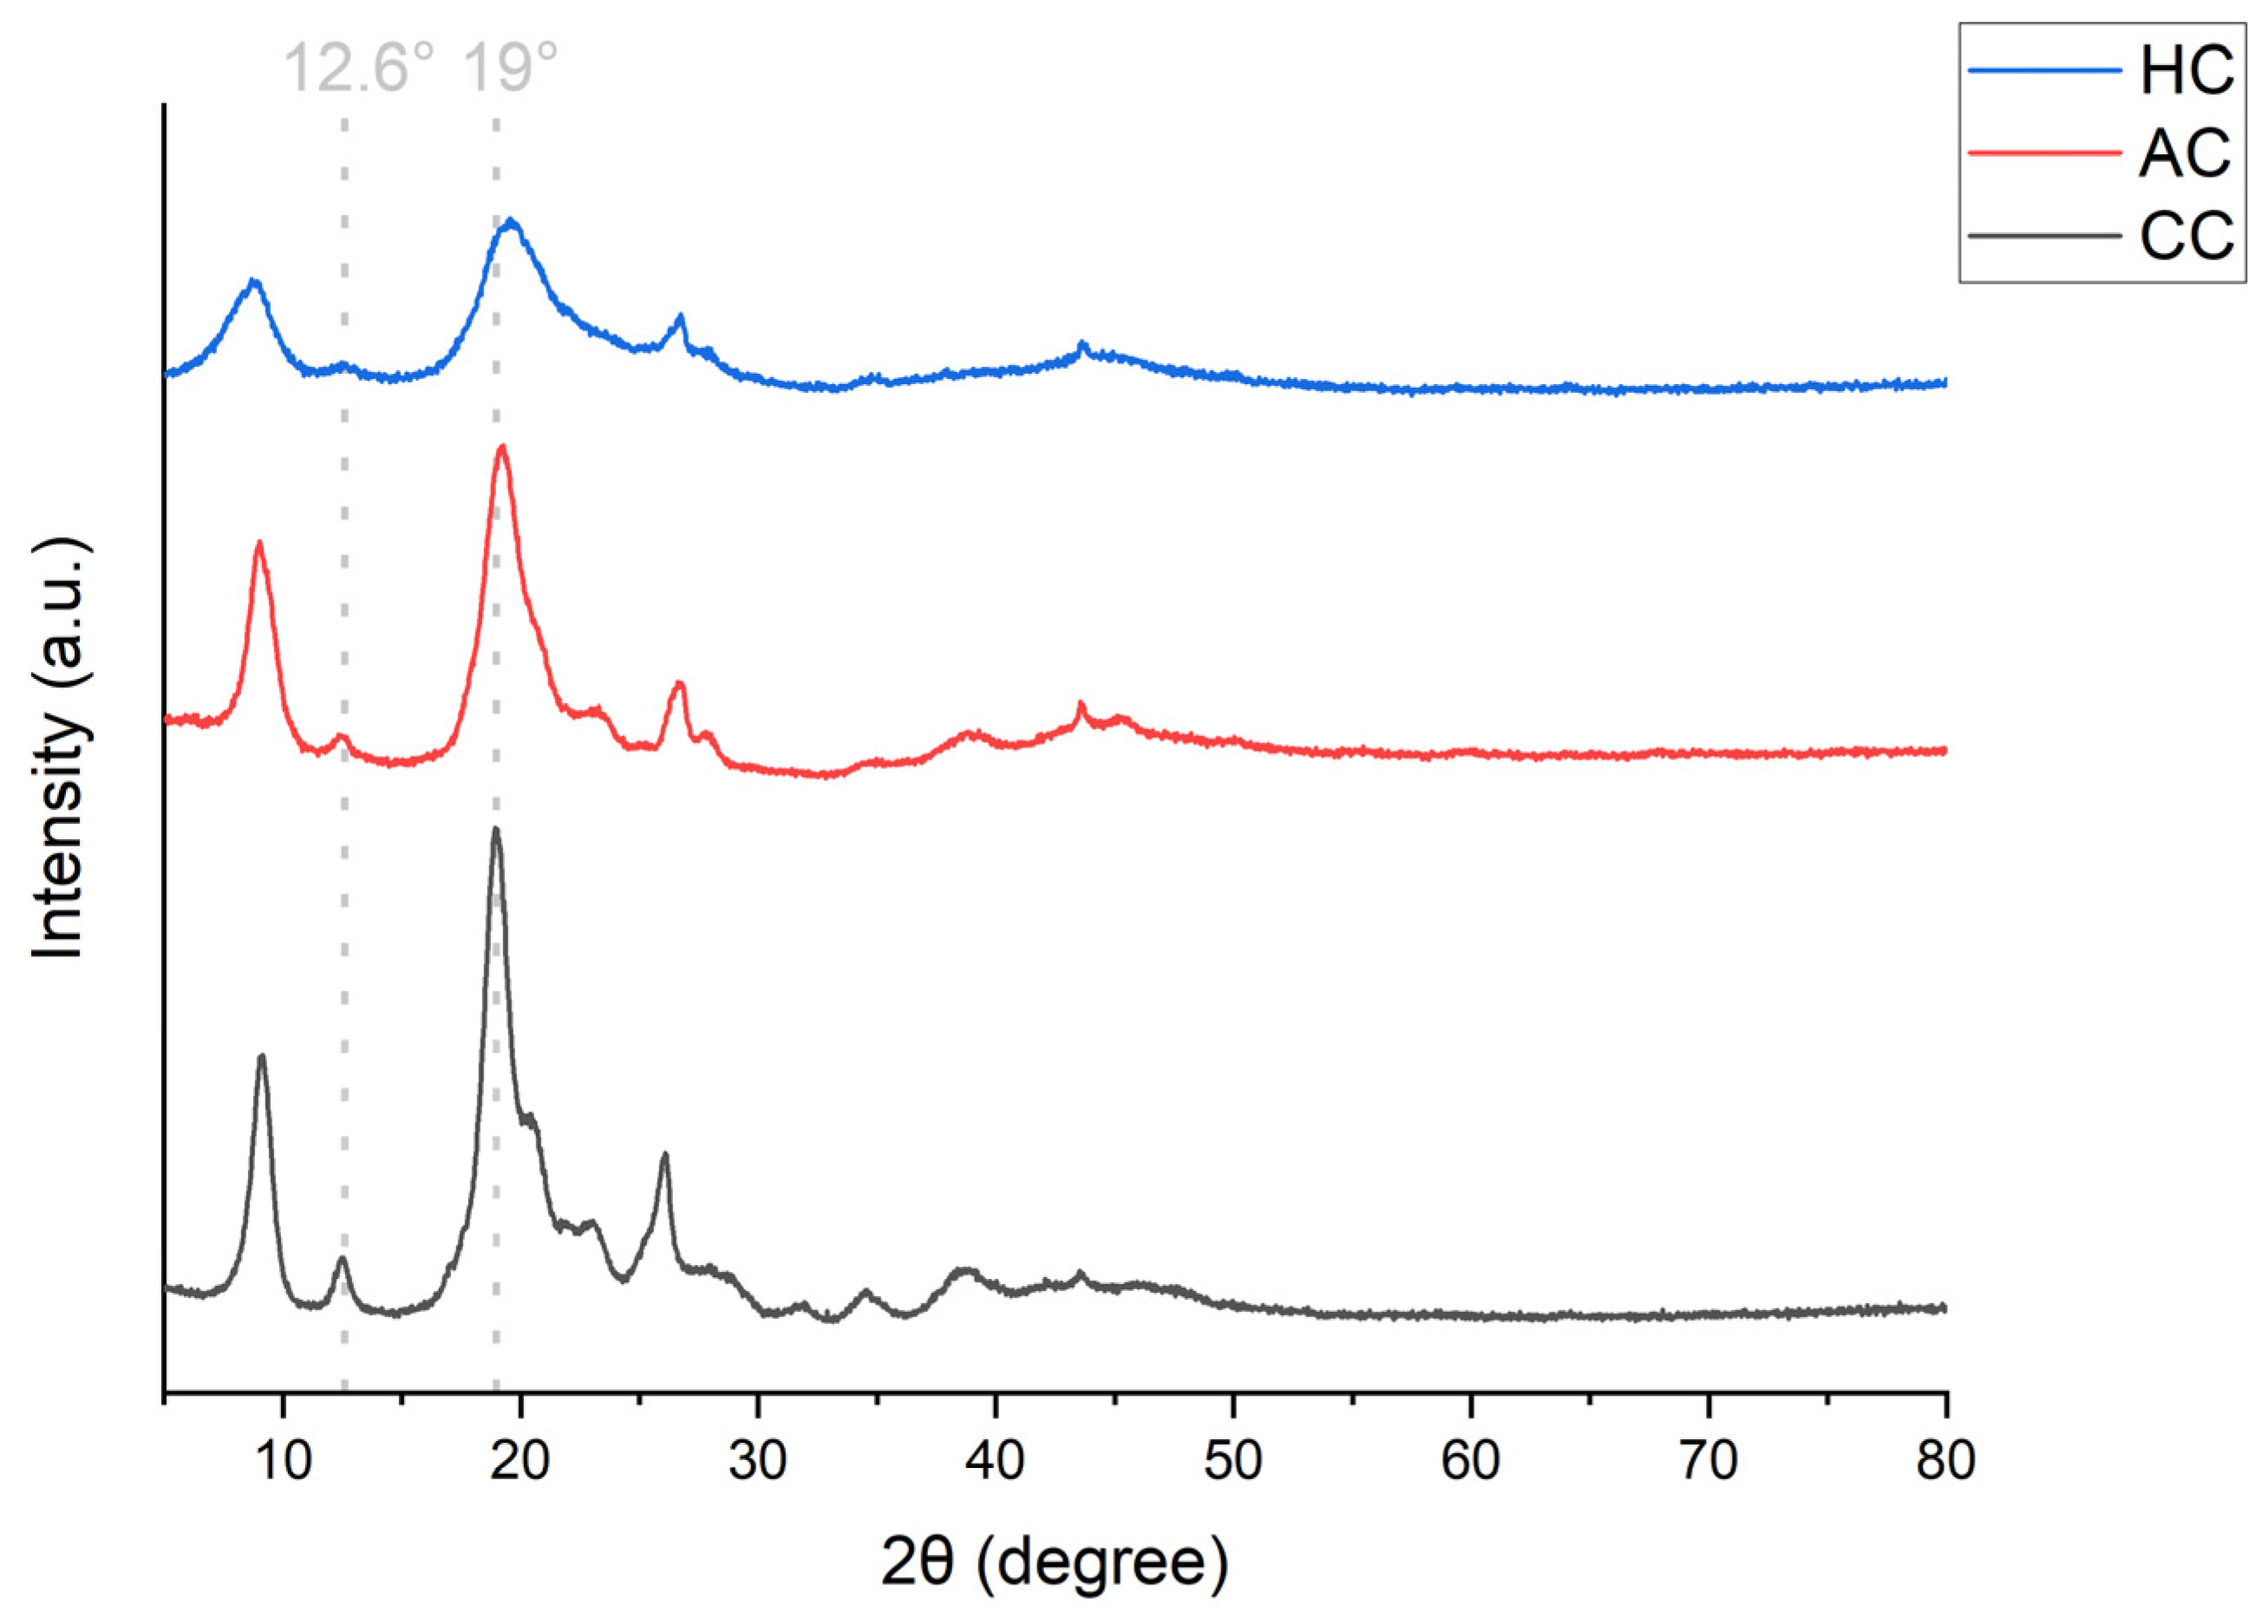
X-ray diffraction patterns of samples were analyzed with an Empyrean Series 2 (Malvern Panalytical, Malvern, UK) using Cu-Kα radiation (λ = 0.154 nm), an operating voltage of 40 kV, and a current of 40 mA. The diffraction was collected over an angular range of 5–80° 2θ (step size = 0.0262606). The crystallinity index (CrI) of chitin samples was calculated using the formula [24]:
C r I % = I 110 I a m I 110 × 100
where I110 is maximum intensity around 2θ = 19°, and Iam is the amorphous peak around 2θ = 12.6°.

2.5. Molecular Weight (MW) Determination of Chitin

The MW of extracted chitin was determined using viscometric analysis as described by [25]. In brief, chitin samples are solubilized using a NaOH-urea solvent. Once solubilized, the solution viscosity is measured. The measured viscosity is then used to determine the MW.

2.5.1. Chitin Solution Preparation

Chitin solutions were prepared by mixing one part chitin powder with 50 parts of an aqueous solution of 8% NaOH and 4% urea w/w. The mixtures were held at −20 °C in a cold bath with vigorous overhead stirring for 24 h. Mixtures were then warmed to room temperature and centrifuged for 30 min at 10,000× g rpm and 25 °C using an Avanti JXN-26 (Beckman Coulter, Brea, CA, USA) centrifuge fitted with a JLA-10.500 rotor. After centrifugation, the supernatant was filtered through a 100 µM nylon membrane to remove any remaining undissolved chitin.
The chitin concentration of prepared solutions was determined by mixing 10 mL of chitin solution with 40 mL of DI water and shaking overnight to aid chitin precipitation. Mixtures were centrifuged for 20 min at 4500 rpm and 25 °C using a Hettich Universal 320R (Hettich, Kirchlengern, Germany) centrifuge. The supernatant was discarded, and the pellet was washed with 50 mL of DI water before the sample was re-centrifuged. The washing process was repeated until the supernatant had a pH of 7, ensuring that all NaOH and urea had been removed. After washing, pellets were dried at 105 °C overnight and weighed. The dry weight was then used to determine chitin concentration in mg/mL.

2.5.2. Viscosity Measurements and MW Calculations

The viscosity of each prepared chitin solution and the starting NaOH-urea solvent was measured for a total of twenty replicates using an MCR 302 Modular Compact Rheometer (Anton Paar, Graz, Austria) fitted with a CC27/T200/SS standard measuring system. The measured viscosities were used to calculate the relative viscosity (ηrel) using the equation:
η r e l = η η s
where η is the measured viscosity of a solution and ηs is the measured viscosity of the solvent.
The intrinsic viscosity ([η]) of each solution was then calculated using the Billmeyer equation:
η = 0.25 η r e l 1 + 3 ln η r e l c
where c is the chitin concentration in g/mL of the given solution.
Finally, the MW of chitin was determined using the Mark-Houwink equation:
η = K M α
where M is the average MW and the constants α and K are functions of polymer type and solvent, respectively. It has been previously determined that α = 0.56 and K = 0.26 for chitin and an aqueous solvent of 8% NaOH 4% urea [24]. The average molecular weight was then calculated for each sample and presented with the standard deviation across replicates.

2.6. Thermogravimetric Analysis (TGA)

Thermogravimetric analysis (TGA) was carried out using a Netzsch (Selb, Germany) model TG209 F1 Libra TGA with reusable Al2O3 85 µL crucibles. Approximately 1–2 mg of chitin sample was loaded per crucible. Samples were then heated from 25 to 900 °C, at a rate of 10 °C/min under a 20 mL/min stream of nitrogen gas. Thermograms obtained were smoothed to 11% and analyzed using Netzsch Proteus® (Version 8.0.3) software with the AutoEvaluation function to determine the peak temperature and mass loss % in the corresponding DTG curves.

2.7. Surface Morphology Determination

A TM4000Plus II Tabletop SEM (Hitachi, Tokyo, Japan) was used to determine the surface morphology of chitin samples. The acquisition setting included a 15 kV accelerating voltage, set using the backscattered electron (BSE) detector. Micrographs were obtained at x1.0 K and x5.0 K magnification from randomly selected regions of the samples, for better representation.

3. Results and Discussion

3.1. Chitin Quantification

The chitin yields from amphipods and hydroids from this study are presented in Table 1, along with chitin yields from previously studied marine species [26,27,28,29]. The chitin yield of amphipods was 12.34%, while hydroids contained 32.75% chitin. Although the chitin content of amphipods is the lowest among the listed species, it is important to note that this study used whole organisms as the starting material, in contrast to the skeletal-only extraction method commonly employed in other studies. It should also be noted that the extraction method does not account for any insoluble residues in the final chitin product, such as residual lipids and pigments, which may remain in small quantities after extraction. The 32.75% chitin content in hydroids is relatively high, even before considering the whole-organism extraction approach. These results demonstrate that amphipods and hydroids have a chitin content comparable to those of other common sources, with hydroids being particularly rich in chitin.

3.2. Chitin Characterization

3.2.1. Degree of Acetylation (DA)

Defined as the percentage of units in the polymer chain containing acetyl units, DA is the fundamental parameter of extracted chitin [30]. Influenced by the chitin source and extraction method, DA affects other physicochemical properties, including MW, crystallinity, and solubility [31]. The FTIR spectra of chitin extracted from amphipods (AC) and hydroids (HC), alongside the spectra of commercially purchased chitin produced from shrimp shells (CC) (Figure 2a), was measured and analyzed. These spectra were then analyzed to determine the DA of each sample, with the results presented in Table 2. DA was calculated using two separate equations to confirm results.
The DA% of AC (58.4–59.2%) and HC (64.8–66.7%) were found to be comparable to those of chitin extracted from various other sources. These include prawn shell (51.6%), crab shell (69.4%), conus shell (80.0%), oyster shell (85.62%), black soldier fly larva (89.0%), squid pen (90.7%), and mussel shell (91.0%) [26,31,32,33]. CC was found to have a DA% of 94.4–95.6%.

3.2.2. Structural Conformation

Chitin is naturally found in the α, β or γ allomorphic form, each having a different crystalline structure. In the more common α-chitin, the polymer chains are arranged in an anti-parallel fashion, and the FTIR spectra of α-chitin will show an amide I band with two peaks, one around 1660 cm−1, because of hydrogen bonding between the carbonyl groups (-C=O) of amide I and amide II (-N-H-); and the other around 1620 cm−1, from bonding between the side chain hydroxymethyl group (-CH2OH) and the carbonyl group (-C=O). β-chitin has polymer chains aligned in a parallel fashion. This parallel arrangement leads to intra-sheet-only bonding, with an amide I band presenting as a single peak around 1650 cm−1 because of hydrogen bonding between the carbonyl groups (-C=O) of amide I and the amide II (-N-H-) [5]. γ-chitin is a mixture of the other two, containing parallel and anti-parallel chains [34]. The amide I band of γ-chitin will present as a partially divided peak, reflecting its nature as a combination of α- and β-chitin structures [7].
When examining the IR spectra of CC and AC, shown in Figure 2b, a split amide I band can be found with peaks at 1652 and 1619, and 1654 and 1619 cm−1 respectively, showing that both samples are composed of α-chitin. Conversely, the amide I band of HC has a single undivided peak at 1632 cm−1, typically expected for a sample comprising β-chitin. These results indicate that AC and CC are composed of α-chitin, while HC is chitin in its β form, which indication can be further supported by x-ray diffraction (XRD) analysis.
When examining XRD patterns, α-chitin typically exhibits multiple sharp, intense peaks around 2θ = 5–30°, while β-chitin will have fewer peaks that are broader and less intense. The difference in peak number and intensity is due to β-chitin being less crystalline than α-chitin [32]. As shown in Figure 3, AC and CC have similar XRD patterns, characteristic of α-chitin with multiple sharp peaks. The XRD pattern of HC presents differently from those of the other two samples, depicting the broad, less intense peaks expected from β-chitin.

3.2.3. Crystallinity Index (CrI)

The crystallinity index (CrI) describes the relative amount of crystalline material in a sample and is particularly important for chitin because an increase in crystallinity will correspond to a decrease in solubility [8]. When calculating CrI values, it is generally expected that β-chitins will have lower CrI values than α-chitins because of their parallel structure [5]. The XRD patterns of CC, AC, and HC (Figure 3) were used to calculate CrI for each sample. CC and AC have relatively high CrI values, at 76.11% and 75.80% (Table 2). The lower CrI value of HC (57.43%) further supports the findings that HC consists of β-chitin, while AC is composed of α-chitin.

3.2.4. Molecular Weight (MW)

The MW of extracted chitin plays a pivotal role in determining potential applications. For instance, high-MW chitin may be better suited for material applications [35], while low-MW chitin is better suited for use as an anti-microbial [36], in anti-cancer therapies [26], or in the creation of bioscaffolds [37]. Generally, chitin is considered low-MW at <50 kDa and high-MW at >150 kDa, with its medium MW falling between the two values [26]. In this study, the low-MW chitin extracted from amphipods (33 kDa) and the medium-MW chitin extracted from hydroids (101 kDa) fell well within the range of chitins extracted in other studies, which have had molecular weights ranging from as low as 25 kDa [26] to over 2000 kDa [25] (Table 2).

3.2.5. Thermal Stability

The thermal stability of chitin samples was investigated using thermogravimetric analysis. The thermogravimetric (TG) and derivative thermogravimetric (DTG) curves for CC, AC, and HC are shown in Figure 4. The first degradation step in all three thermograms occurred around 50–110 °C. This initial degradation is attributed to the evaporation of water that is either absorbed by the polymer or weakly hydrogen bonded to the chitin molecules [38]. Samples CC and AC show similar initial weight loss, at 6% and 4%, respectively. The HC sample showed slightly higher weight loss (10%) during initial degradation, which can be attributed to the β-chitin structure being more susceptible to water absorption and swelling [37,39].
The second thermal degradation step of each sample, attributed to the decomposition of the chitin polymer [40], is important to determine before considering applications. Polymers with lower degradation temperatures, and thus lower thermal stability, are generally less suitable for high-temperature processing or applications. In this study, polymer decomposition occurred in the range of 300–400 °C, with CC and AC having similar peaks, at 392 °C and 384 °C, while the peak for HC was 339 °C. Peak degradation occurring at a lower temperature indicates that HC is the least thermally stable of the samples. This finding agrees with previous studies showing β-chitin to be generally less thermally stable than α-chitin [5,6,41].

3.2.6. Surface Morphology

As shown in Figure 5, the surface morphology varies widely across the samples and even within the same sample in the case of amphipod chitin. The commercial chitin (Figure 5a) consists of sheets interspersed with small sections of delicate fibers. The surface morphology of amphipod chitin varied greatly throughout the sample. When examining amphipod chitin (Figure 5b), some areas are observed as flat, porous sheets, while other regions consist of intersecting fibrils. The variance in surface morphology of amphipod chitin may indicate different chitin organization across anatomical structures, similar to those found in insects [42]. This observation may also explain why commercial chitin, mainly produced from a single anatomical structure (shrimp shells), shows negligible surface variance. In comparison, the hydroid chitin surface (Figure 5c) was uniform throughout the sample, always showing fibrils running parallel with little intersection, irrespective of the anatomical structure.

4. Conclusions

In this study, chitin was successfully extracted from two exemplary biofouling organisms, amphipods and hydroids. We found that whole amphipods contain α-chitin in quantities comparable to other marine sources. In contrast, it was observed that hydroids contain 32.75% chitin, one of the largest percentages reported. We also observed that hydroids contain chitin in its β form. This finding is particularly significant because it shows hydroids to be a new potential source of β-chitin that is rarer and has some more favorable characteristics than α-chitin, such as increased solubility and reactivity. Overall, the chitin extracted from both exemplar organisms exhibited favorable properties comparable to those of chitin from previously studied sources, including shrimp shell, squid pen, and crab shell. While future work is needed to determine the optimal use for the chitin extracted from each of these new sources, they each hold potential for use in high-value applications. In particular, it would be valuable to determine if the low-MW α-chitin extracted from amphipods is well suited for anti-microbial and agricultural applications or if HC’s medium-MW β-chitin has potential in the material science and pharmaceutical spaces.

Author Contributions

Conceptualization, C.S., B.C. and M.C.; formal analysis, C.S., C.F.L., M.P.-H. and M.C.; investigation, C.S. and M.P.-H.; resources, P.B. and B.C.; data curation, C.S.; writing—original draft preparation, C.S. and P.B.; writing—review and editing, C.F.L. and M.C.; supervision, M.C.; funding acquisition, B.C. and M.C. All authors have read and agreed to the published version of the manuscript.

Funding

This research was funded by The New Zealand Institute for Plant and Food Research Limited Strategic Science Investment Fund (SSIF) from the New Zealand Ministry of Business, Innovation and Employment (MBIE) C11X1702.

Institutional Review Board Statement

Not applicable.

Data Availability Statement

The original contributions presented in this study are included in the article. Further inquiries can be directed to the corresponding author.

Conflicts of Interest

The authors declare no conflicts of interest.

Abbreviations

The following abbreviations are used in this manuscript:
CrICrystallinity Index
DADegree of Acetylation
MWMolecular Weight
TGAThermogravimetric Analysis
ACAmphipods Chitin
HCHydroids Chitin
CCCommercial Chitin

References

  1. Elieh-Ali-Komi, D.; Hamblin, M.R. Chitin and Chitosan: Production and Application of Versatile Biomedical Nanomaterials. Int. J. Adv. Res. 2016, 4, 411–427. [Google Scholar]
  2. Zargar, V.; Asghari, M.; Dashti, A. A Review on Chitin and Chitosan Polymers: Structure, Chemistry, Solubility, Derivatives, and Applications. ChemBioEng Rev. 2015, 2, 204–226. [Google Scholar] [CrossRef]
  3. Lv, J.; Lv, X.; Ma, M.; Oh, D.-H.; Jiang, Z.; Fu, X. Chitin and chitin-based biomaterials: A review of advances in processing and food applications. Carbohydr. Polym. 2023, 299, 120142. [Google Scholar] [CrossRef]
  4. El Knidri, H.; Belaabed, R.; Addaou, A.; Laajeb, A.; Lahsini, A. Extraction, chemical modification and characterization of chitin and chitosan. Int. J. Biol. Macromol. 2018, 120, 1181–1189. [Google Scholar] [CrossRef]
  5. Jang, M.; Kong, B.; Jeong, Y.; Lee, C.H.; Nah, J. Physicochemical characterization of α-chitin, β-chitin, and γ-chitin separated from natural resources. J. Polym. Sci. Part A Polym. Chem. 2004, 42, 3423–3432. [Google Scholar] [CrossRef]
  6. Moreno-Tovar, R.; Bucio, L.; Thions, C.; Tehuacanero-Cuapa, S. Thermal degradation and lifetime of β-chitin from Dosidicus gigas squid pen: Effect of impact at 9.7 GPa and a comparative study with α-chitin. Carbohydr. Polym. 2021, 251, 116987. [Google Scholar] [CrossRef] [PubMed]
  7. Kaya, M.; Mujtaba, M.; Ehrlich, H.; Salaberria, A.M.; Baran, T.; Amemiya, C.T.; Galli, R.; Akyuz, L.; Sargin, I.; Labidi, J. On chemistry of γ-chitin. Carbohydr. Polym. 2017, 176, 177–186. [Google Scholar] [CrossRef] [PubMed]
  8. Poerio, A.; Petit, C.; Jehl, J.-P.; Arab-Tehrany, E.; Mano, J.F.; Cleymand, F. Extraction and Physicochemical Characterization of Chitin from Cicada orni Sloughs of the South-Eastern French Mediterranean Basin. Molecules 2020, 25, 2543. [Google Scholar] [CrossRef] [PubMed]
  9. FAO. The state of world fisheries and aquaculture 2024. In Blue Transformation in Action; FAO: Rome, Italy, 2024. [Google Scholar] [CrossRef]
  10. Bannister, J.; Sievers, M.; Bush, F.; Bloecher, N. Biofouling in marine aquaculture: A review of recent research and developments. Biofouling 2019, 35, 631–648. [Google Scholar] [CrossRef]
  11. Fletcher, L.M.; Davidson, I.C.; Bucknall, B.G.; Atalah, J. Salmon farm biofouling and potential health impacts to fish from stinging cnidarians. Aquaculture 2023, 568, 739315. [Google Scholar] [CrossRef]
  12. Collaborative Effort Looks into Biofouling, IntraFish.Com|Latest Seafood, Aquaculture and Fisheries News. 2008. Available online: https://www.intrafish.com/aquaculture/collaborative-effort-looks-into-biofouling/1-1-569282 (accessed on 22 July 2025).
  13. Dürr, S.; Watson, D.I. Biofouling and Antifouling in Aquaculture. In Biofouling; John Wiley & Sons, Ltd.: Hoboken, NJ, USA, 2009; pp. 267–287. [Google Scholar] [CrossRef]
  14. Floerl, O.; Sunde, L.; Bloecher, N. Potential environmental risks associated with biofouling management in salmon aquaculture. Aquac. Environ. Interact. 2016, 8, 407–417. [Google Scholar] [CrossRef]
  15. Bloecher, N.; Broch, O.J.; Davies, E.J.; Pedersen, M.O.; Floerl, O. Catch my drift? Between-farm dispersal of biofouling waste from salmon pen net cleaning: Potential risks for fish health. Sci. Total Environ. 2024, 928, 172464. [Google Scholar] [CrossRef] [PubMed]
  16. Fitridge, I.; Dempster, T.; Guenther, J.; de Nys, R. The impact and control of biofouling in marine aquaculture: A review. Biofouling 2012, 28, 649–669. [Google Scholar] [CrossRef] [PubMed]
  17. Fernandez-Gonzalez, V.; Sanchez-Jerez, P. Fouling assemblages associated with off-coast aquaculture facilities: An overall assessment of the Mediterranean Sea. Mediterr. Mar. Sci. 2017, 18, 87–96. [Google Scholar] [CrossRef]
  18. Ulaski, B.P.; Konar, B. Seasonal and site-specific differences in biofouling communities on Pacific oyster Mariculture farms. J. Exp. Mar. Biol. Ecol. 2024, 578, 152031. [Google Scholar] [CrossRef]
  19. Tretenichenko, E.M.; Datsun, V.M.; Ignatyuk, L.N.; Nud’ga, L.A. Preparation and properties of chitin and chitosan from a hydroid polyp. Russ. J. Appl. Chem. 2006, 79, 1341–1346. [Google Scholar] [CrossRef]
  20. Ritter, C.J.; Bourne, D.G. Marine amphipods as integral members of global ocean ecosystems. J. Exp. Mar. Biol. Ecol. 2024, 572, 151985. [Google Scholar] [CrossRef]
  21. Achinivu, E.C.; Shamshina, J.L.; Rogers, R.D. Chitin extracted from various biomass sources: It’s not the same. Fluid Phase Equilibria 2022, 552, 113286. [Google Scholar] [CrossRef]
  22. Brugnerotto, J.; Lizardi, J.; Goycoolea, F.; Argüelles-Monal, W.; Desbrières, J.; Rinaudo, M. An infrared investigation in relation with chitin and chitosan characterization. Polymer 2001, 42, 3569–3580. [Google Scholar] [CrossRef]
  23. Gharibzadeh, M.; Osfouri, S.; Jamekhorshid, A.; Jafari, S.A. Microbial chitin extraction and characterization from green tiger shrimp waste: A comparative study of culture mediums along with bioprocess optimization. Int. J. Biol. Macromol. 2023, 242, 125213. [Google Scholar] [CrossRef]
  24. Focher, B.; Beltrame, P.; Naggi, A.; Torri, G. Alkaline N-deacetylation of chitin enhanced by flash treatments. Reaction kinetics and structure modifications. Carbohydr. Polym. 1990, 12, 405–418. [Google Scholar] [CrossRef]
  25. Li, G.; Du, Y.; Tao, Y.; Liu, Y.; Li, S.; Hu, X.; Yang, J. Dilute solution properties of four natural chitin in NaOH/urea aqueous system. Carbohydr. Polym. 2010, 80, 970–976. [Google Scholar] [CrossRef]
  26. Mohan, K.; Ravichandran, S.; Muralisankar, T.; Uthayakumar, V.; Chandirasekar, R.; Rajeevgandhi, C.; Rajan, D.K.; Seedevi, P. Extraction and characterization of chitin from sea snail Conus inscriptus (Reeve, 1843). Int. J. Biol. Macromol. 2019, 126, 555–560. [Google Scholar] [CrossRef] [PubMed]
  27. Rasti, H.; Parivar, K.; Baharara, J.; Iranshahi, M.; Namvar, F. Chitin from the Mollusc Chiton: Extraction, Characterization and Chitosan Preparation. Iran. J. Pharm. Res. 2017, 16, 366–379. [Google Scholar] [PubMed]
  28. Abdulkarim, A.; Isa, M.T.; Abdulsalam, S.; Muhammad, A.J.; Ameh, A.O. Extraction and Characterisation of Chitin and Chitosan from Mussel Shell. Civ. Environ. Eng. 2013, 3, 108–114. [Google Scholar]
  29. Abdou, E.S.; Nagy, K.S.; Elsabee, M.Z. Extraction and characterization of chitin and chitosan from local sources. Bioresour. Technol. 2008, 99, 1359–1367. [Google Scholar] [CrossRef]
  30. Tang, D.; Qian, J.; Wang, N.; Shu, J. Determining the degree of acetylation of chitin/chitosan using a SSNMR 13C method on the basis of cross polarization reciprocity relation. Carbohydr. Res. 2020, 498, 108168. [Google Scholar] [CrossRef]
  31. Alabaraoye, E.; Achilonu, M.; Hester, R. Biopolymer (Chitin) from Various Marine Seashell Wastes: Isolation and Characterization. J. Polym. Environ. 2018, 26, 2207–2218. [Google Scholar] [CrossRef]
  32. Lavall, R.; Assis, O.; Campanafilho, S. β-Chitin from the pens of Loligo sp.: Extraction and characterization. Bioresour. Technol. 2007, 98, 2465–2472. [Google Scholar] [CrossRef]
  33. Smets, R.; Verbinnen, B.; Van De Voorde, I.; Aerts, G.; Claes, J.; Van Der Borght, M. Sequential Extraction and Characterisation of Lipids, Proteins, and Chitin from Black Soldier Fly (Hermetia illucens) Larvae, Prepupae, and Pupae. Waste Biomass Valorization 2020, 11, 6455–6466. [Google Scholar] [CrossRef]
  34. Kaya, M.; Lelešius, E.; Nagrockaitė, R.; Sargin, I.; Arslan, G.; Mol, A.; Baran, T.; Can, E.; Bitim, B. Differentiations of Chitin Content and Surface Morphologies of Chitins Extracted from Male and Female Grasshopper Species. PLoS ONE 2015, 10, e0115531. [Google Scholar] [CrossRef]
  35. Berton, P.; Shen, X.; Rogers, R.D.; Shamshina, J.L. 110th Anniversary: High-Molecular-Weight Chitin and Cellulose Hydrogels from Biomass in Ionic Liquids without Chemical Crosslinking. Ind. Eng. Chem. Res. 2019, 58, 19862–19876. [Google Scholar] [CrossRef]
  36. Goy, R.C.; De Britto, D.; Assis, O.B.G. A review of the antimicrobial activity of chitosan. Polímeros 2009, 19, 241–247. [Google Scholar] [CrossRef]
  37. Shavandi, A.; Bekhit, A.E.-D.A.; Sun, Z.; Ali, M.A. Bio-scaffolds produced from irradiated squid pen and crab chitosan with hydroxyapatite/β-tricalcium phosphate for bone-tissue engineering. Int. J. Biol. Macromol. 2016, 93, 1446–1456. [Google Scholar] [CrossRef] [PubMed]
  38. Pereira, F.S.; da Silva Agostini, D.L.; Job, A.E.; González, E.R.P. Thermal studies of chitin–chitosan derivatives. J. Therm. Anal. Calorim. 2013, 114, 321–327. [Google Scholar] [CrossRef]
  39. Roy, J.C.; Salaün, F.; Giraud, S.; Ferri, A.; Chen, G.; Guan, J. Solubility of Chitin: Solvents, Solution Behaviours and Their Related Mechanisms. In Solubility of Polysaccharides; Xu, Z., Ed.; IntechOpen: London, UK, 2017. [Google Scholar] [CrossRef]
  40. Paulino, A.T.; Simionato, J.I.; Garcia, J.C.; Nozaki, J. Characterization of chitosan and chitin produced from silkworm crysalides. Carbohydr. Polym. 2006, 64, 98–103. [Google Scholar] [CrossRef]
  41. Stawski, D.; Rabiej, S.; Herczyńska, L.; Draczyński, Z. Thermogravimetric analysis of chitins of different origin. J. Therm. Anal. Calorim. 2008, 93, 489–494. [Google Scholar] [CrossRef]
  42. Chandran, R.; Williams, L.; Hung, A.; Nowlin, K.; LaJeunesse, D. SEM characterization of anatomical variation in chitin organization in insect and arthropod cuticles. Micron 2016, 82, 74–85. [Google Scholar] [CrossRef]
Figure 1. The starting materials ((a). powdered amphipods, and (c). powdered hydroids), their corresponding extracted chitin ((b). chitin extracted from powdered amphipods, and (d). chitin extracted from powdered hydroids), and the commercially purchased chitin ((e). chitin derived from shrimp shells).
Polysaccharides 06 00087 g001
Figure 2. Fourier transform infrared (FTIR) spectra of chitin samples: (a) Full FTIR spectra of amphipod chitin (AC), hydroid chitin (HC), and commercial chitin (CC). (b) Enhanced visual of the amide I band showing the undivided peak of HC with the split peaks of AC and CC.
Polysaccharides 06 00087 g002
Figure 3. X-Ray diffraction (XRD) patterns of commercial chitin (CC), amphipod chitin (AC), and hydroid chitin (HC).
Polysaccharides 06 00087 g003
Figure 4. Thermogravimetric (TG) and derivative thermogravimetric (DTG) curves of (a) commercial chitin (CC), (b) amphipod chitin (AC), and (c) hydroid chitin (HC).
Polysaccharides 06 00087 g004
Figure 5. Scanning electron microscopy (SEM) images of (a) commercial chitin, (b) amphipod chitin, and (c) hydroid chitin at x1.0 K and x5.0 K magnification.
Polysaccharides 06 00087 g005
Table 1. Chitin content of various marine species.
SourceChitin Content (%)Starting MaterialReference
Amphipod
(Jassa sp.)
12.34 ± 1.10Whole organism (this study)
Hydroid
(Coryne sp.)
32.75 ± 0.49Whole organism(this study)
Brown shrimp shell21.53 Skeletal-only [29]
Squid pen49.00 Skeletal-only[29]
Crab shell16.73 Skeletal-only[29]
Crayfish shell20.60Skeletal-only[29]
Conus shell21.65 Skeletal-only[26]
Mussel shell21.32 Skeletal-only[28]
Table 2. Physicochemical properties of chitin samples.
Source Degree of
Acetylation A1320/A1420
(DA, %)
Degree of Acetylation A1650/A3450 (DA, %)Structural
Conformation
Crystallinity
Index (CrI, %)
Molecular Weight
(MW, kDa)
Commercial chitin (CC)95.6 ± 5.394.4 ± 3.7α76.11336 ± 31
Amphipod chitin (AC)58.4 ± 1.459.2 ± 1.7α75.8033 ± 3
Hydroid chitin (HC)66.7 ± 1.264.8 ± 0.5β57.43101 ± 1
Disclaimer/Publisher’s Note: The statements, opinions and data contained in all publications are solely those of the individual author(s) and contributor(s) and not of MDPI and/or the editor(s). MDPI and/or the editor(s) disclaim responsibility for any injury to people or property resulting from any ideas, methods, instructions or products referred to in the content.