Article

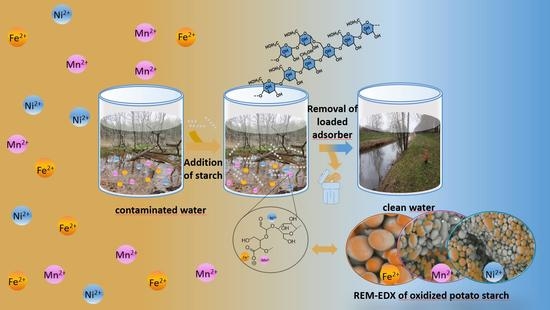
Native and Oxidized Starch for Adsorption of Nickel, Iron, and Manganese Ions from Water

by
Rahma Boughanmi
1,†,
Konstantin B. L. Borchert
1,†,
Christine Steinbach
1,
Martin Mayer
1,
Simona Schwarz
1,*,
Anastasiya Svirepa
2,3,
Johannes Schwarz
2,
Michael Mertig
2,3 and
Dana Schwarz
1,*
1
Leibniz-Institut für Polymerforschung Dresden e.V., Hohe Straße. 6, 01069 Dresden, Germany
2
Kurt-Schwabe-Institut für Mess- und Sensortechnik Meinsberg e.V., Kurt-Schwabe-Straße. 4, 04736 Waldheim, Germany
3
Institute of Physical Chemistry, Technische Universität Dresden, 01062 Dresden, Germany
*
Authors to whom correspondence should be addressed.
These authors contributed equally to this work.
Polysaccharides 2022, 3(3), 556-573; https://doi.org/10.3390/polysaccharides3030033
Submission received: 14 July 2022 / Revised: 4 August 2022 / Accepted: 5 August 2022 / Published: 10 August 2022

Abstract

:
The adsorption of heavy metal ions from surface water with ecologically safe and biodegradable biopolymers is increasingly becoming an appealing research challenge. Starch as a biopolymer is exceptionally attractive to solve this problem for its low cost and abundant availability in nature. To expel Ni2+, Fe2+/3+, and Mn2+ from water, we analyzed two native and two oxidized starches, namely potato and corn starch, as bio-adsorbers. The morphology and the surface property of the different starches were studied using SEM. To assess the effectiveness of adsorption onto the starches, we tested three realistic concentrations based on German drinking water ordinance values that were 10-fold, 100-fold, and 1000-fold the limits for Mn2+, Fe2+, and Ni2+, respectively. The concentration of the different ions was measured using the ICP-OES. Furthermore, from subsequent investigations of the adsorption isotherms, we evaluated the adsorption capacities and mechanisms. The adsorption isotherms were fitted using the Langmuir, Sips, and Dubinin–Radushkevich models, whereby Sips showed the highest correlation. Oxidized potato starch achieved viable adsorption capacities of 77 µmol Fe2+/g, 84 µmol Mn2+/g, and 118 µmol Ni2+/g. Investigating the influence of initial swelling in water on the adsorption performance, we found that especially the percentage removal with oxidized starches decreased significantly due to the formation of hydrogen bonds with water molecules at their binding sites with prior swelling.

Graphical Abstract

1. Introduction

The world is witnessing a critical shortage of fresh water due to the increasing consumption rate in industry and agriculture and the rising demand for potable water to account for the population growth and vast urbanization [1]. This deficiency makes providing enough water for all living organisms to survive an absolute priority worldwide [2]. Furthermore, poor water quality seen in many areas, which are showing high concentrations of heavy metals such as iron, has worsened the problem [1]. Upon overconsumption by humans, these minerals can cause several diseases with a potential risk of death [2]. Due to their bio-accumulation inside human and other species’ membranes [3], many heavy metals such as zinc, lead, chromium, mercury, cadmium, copper, and nickel are classified as toxic and carcinogenic [4,5]. It was found that, e.g., the accumulation of Ni ions causes dermatitis or sensitization allergies [6]. Furthermore, as Ni ions damage DNA structures even in low concentrations, Ni is a potential carcinogen [7]. The World Health Organization (WHO) guidelines put a maximum of 0.07 mg/l for permissible nickel concentrations in drinking water in effluents [8]. The majority of iron’s harmful effects result from consumption since it is quickly absorbed in the digestive system [9], which is why the WHO put a maximum of 0.3 mg/L for iron concentrations in drinking water [8]. The development and function of the brain are fundamentally influenced by Mn, as an essential element. Mn accumulating in the basal ganglia and the emergence of Parkinson-like diseases may result from environmental exposure to the metal [10]. The maximum concentration of Mn2+ set by the WHO is 0.4 mg/L [8].
Thus, the removal of exceeding levels of heavy metal ions below a critical level, specified by national guidelines the German drinking water ordinance (TrinkwV) [11], and the WHO organization [8], is crucial for environmental stability as well as human health. The values of each organization are presented in Table 1.
Although strong efforts were made to purify surface waters and wastewater streams, some heavy metals, such as iron, are still persistent. Often, iron pollution is seen at coal mining sites where groundwater levels are lowered, which before separated different minerals from air oxygen. This causes, e.g., exposed pyrite, an insoluble iron sulfide mineral, to be oxidized to more soluble Fe3+ ions and sulfate, partially forming sulfuric acid [12,13]. Afterward, when the mining site is renaturalized and flooded, for example, high levels of iron and sulfate ions are remobilized and distributed to all adjacent water bodies, causing the water to change its color into rusty brown. The chemical reactions are highly dependable on the quality of the containing rocks. Potential acidity can be neutralized when these rocks contain calcite or other carbonate minerals by immobilizing the heavy metals [14]. Nevertheless, we can still measure high dissolved metal concentrations, such as manganese and iron, due to metal compound dissolution in water [15].
In our previous work [16], we discussed how to remove different toxic heavy metals (Pb, Cd and Al) from water using the biopolymer starch. These essential heavy metals are crucial for metabolic processes in the human body; therefore, their amounts must be controlled and ingested in small quantities starch was chosen due to its many advantages, including being environmentally friendly [17], low cost, abundant availability, and being well biodegradable [18]. This paper mainly focuses on removing the heavy metal ions manganese, iron, nickel, and oxyanion sulfate, using the same successful adsorption method we used in our previous work [16].
In this article, we compare the adsorption of Ni2+, Fe2+, and Mn2+ from aqueous media onto native corn and potato starch, which have only OH groups, with the adsorption onto oxidized starches, which have COOH and CHO as essential functional groups. Firstly, we studied the adsorption at metal ion concentrations, which correspond to the 10-fold, 100-fold, and 1000-fold of German drinking water ordinance limit values for the respective ions. Secondly, we determined the adsorption isotherm at equilibrium for deeper insights into the process. Herein, the adsorption isotherms were fitted with different isotherm fitting models to determine the nature of adsorption. Furthermore, the impact of the swelling behavior of the different starches on the adsorption of FeSO4 was evaluated.

2. Experimental Part

2.1. Materials

2.1.1. Starches

For the heavy metal removal from water, we selected two groups of powder starch samples provided by AGRANA Research and Innovation Center. The native starches are abbreviated with ‘n.’: n. potato starch (Sample number A4757), n. cornstarch (Sample number A4758). The oxidized starches are referenced by ‘o.’ for simplification: o. corn starch (Sample number A4761) and o. potato starch (Sample number A4762).

2.1.2. Materials for Adsorption Experiments

FeSO4∙7 H2O (≥99%), NiSO4∙6 H2O (≥98%) from Sigma Aldrich (Munich, Germany) and MnSO4∙H2O (≥99%) from Merck (Darmstadt, Germany) were used as heavy metal salts for the adsorption experiment. For the ICP-OES (iCAP 7000 Plus, Thermo Fischer Scientific, Darmstadt, Germany), HNO3 (65%, Normapur®) from VWR (Darmstadt, Germany) was used.

2.1.3. Ultrapure Water

A Milli-Q Advantage A10® water purification system (Millipore, Darmstadt, Germany) was used to produce ultrapure water with a total organic carbon (TOC) of 5 ppb and a resistivity of 18.2 MΩ cm.

2.1.4. ICP-OES Standard Solutions

For ICP-OES measurements, the following standards were used: 9998 mg/L S was purchased from Sigma-Aldrich, Munich, Germany, while 10,000 mg/L Fe in 2 mol/L HNO3, 10,000 mg/L Ni in 2 mol/L HNO3, and 10,000 mg/L Mn in 2 mol/L HNO3 were acquired from Bernd Kraft, Duisburg, Germany.

2.2. Adsorption Experiments

2.2.1. Adsorption Isotherms

The stock solutions for the adsorption experiments were prepared in volumetric flasks without any pH modification by dissolution of the respective salt in ultrapure water. For the adsorption experiments, 0.1 g of the starch samples were placed in a 50 mL centrifuge tube and 30 mL of the desired heavy metal stock solution were added. After 2 h of stirring, the samples were centrifuged for 8 min at 11,000 rpm. Then, 8 mL of the supernatants were transferred to 15 mL centrifuge tubes with adding 2 mL of 20 wt% nitric acid for preservation. The concentrations of Ni2+, Fe2+, Mn2+, and SO42− ions were measured with ICP-OES.

2.2.2. Adsorption in Dependence on Time

To examine adsorption as a function of time, a FeSO4 stock solution with an initial concentration of 10 mg Fe2+/L was prepared and added to 0.1 g of each starch sample for varying times from 5 min to 48 h. After stirring, the samples were centrifuged for 8 min at 11,000 rpm. Then, 8 mL of the supernatants were transferred to 15 mL centrifuge tubes with addition of 2 mL of 20 wt% nitric acid for preservation. The concentration of Fe2+/3+ and sulfate ions was measured by ICP-OES.

2.2.3. Adsorption in Dependence of Swelling

A total of 0.1 g of the analyzed starch samples were stirred in 15 mL of ultrapure water at room temperature for 24 h with a magnetic stirrer. Subsequently and without removing the water, 15 mL of FeSO4 solution were added to the sample. The samples were stirred for 2 h and then centrifuged for 8 min at 11,000 rpm. Then, 8 mL of the supernatant were transferred to a 15 mL centrifuge tube with addition of 2 mL of 20 wt% nitric acid for preservation. The concentration of Fe2+ and SO42− ions were measured with ICP-OES.

3. Theoretical Model

3.1. Sorption Rates and Sorption Capacity

The calculation of the removal efficiency is shown in Equations (1) and (2), where c0 is the concentration of the respective ion before and ceq is the concentration after the adsorption process. Both concentrations c0 and ceq were measured by ICP-OES.
adsorption   ( % ) = 100 % c 0 c eq c 0
The sorption capacity qeq in equilibrium was calculated through:
q eq ( µ mol / g ) = ( c 0 c eq ) V L m A
VL is the volume of the adsorptive solution and mA denotes the mass of the sorbent material employed in the experiment.

3.2. Employed Adsorption Models

Three different non-linear fitting models were employed to model the sorption process, including the Langmuir (Equation (3)) [19], Sips (Equation (4)) [20,21], and Dubinin–Radushkevich (Equations (5)–(7)) [22] models.
q eq = Q m K L c eq 1 + K L c eq
q eq = Q m K S c eq n 1 + K S c eq n
q eq = Q m exp ( β DR ε 2 )
ε = RT ln ( 1 + 1 c eq )
E ads , DR = 1 2 β DR
qeq is the sorption capacity where Qm is the amount of adsorbed solute at equilibrium and saturation, respectively. KL and KS are the equilibrium constants from the Langmuir and Sips models, respectively. β, given mol2/J2, is the activity constant from the Dubinin–Radushkevich model, which is related to the mean free energy of adsorption per mol of the adsorbate; ε is the Polanyi potential in J/mol; R is the universal gas constant, 8.314 J/mol K; T is the absolute temperature [23]. It is noteworthy that the fitting of the Dubinin–Radushkevich model is necessary to be conducted in mol/L as the unit for concentrations, as pointed out by Zhou [24].
To determine the reaction spontaneity, the Gibbs energy change ΔG° was calculated from the Langmuir equilibrium constant. A negative value indicates that the adsorption is more energetically favorable. Furthermore, the type of adsorption is indicated by this value. Physical adsorption occurs when the value is between 2.1 and 20.9 kJ/mol. Chemical adsorption occurs when the value is between 80 and 200 kJ/mol [25].
Δ G ° = RT   ln   K L

4. Results and Discussion

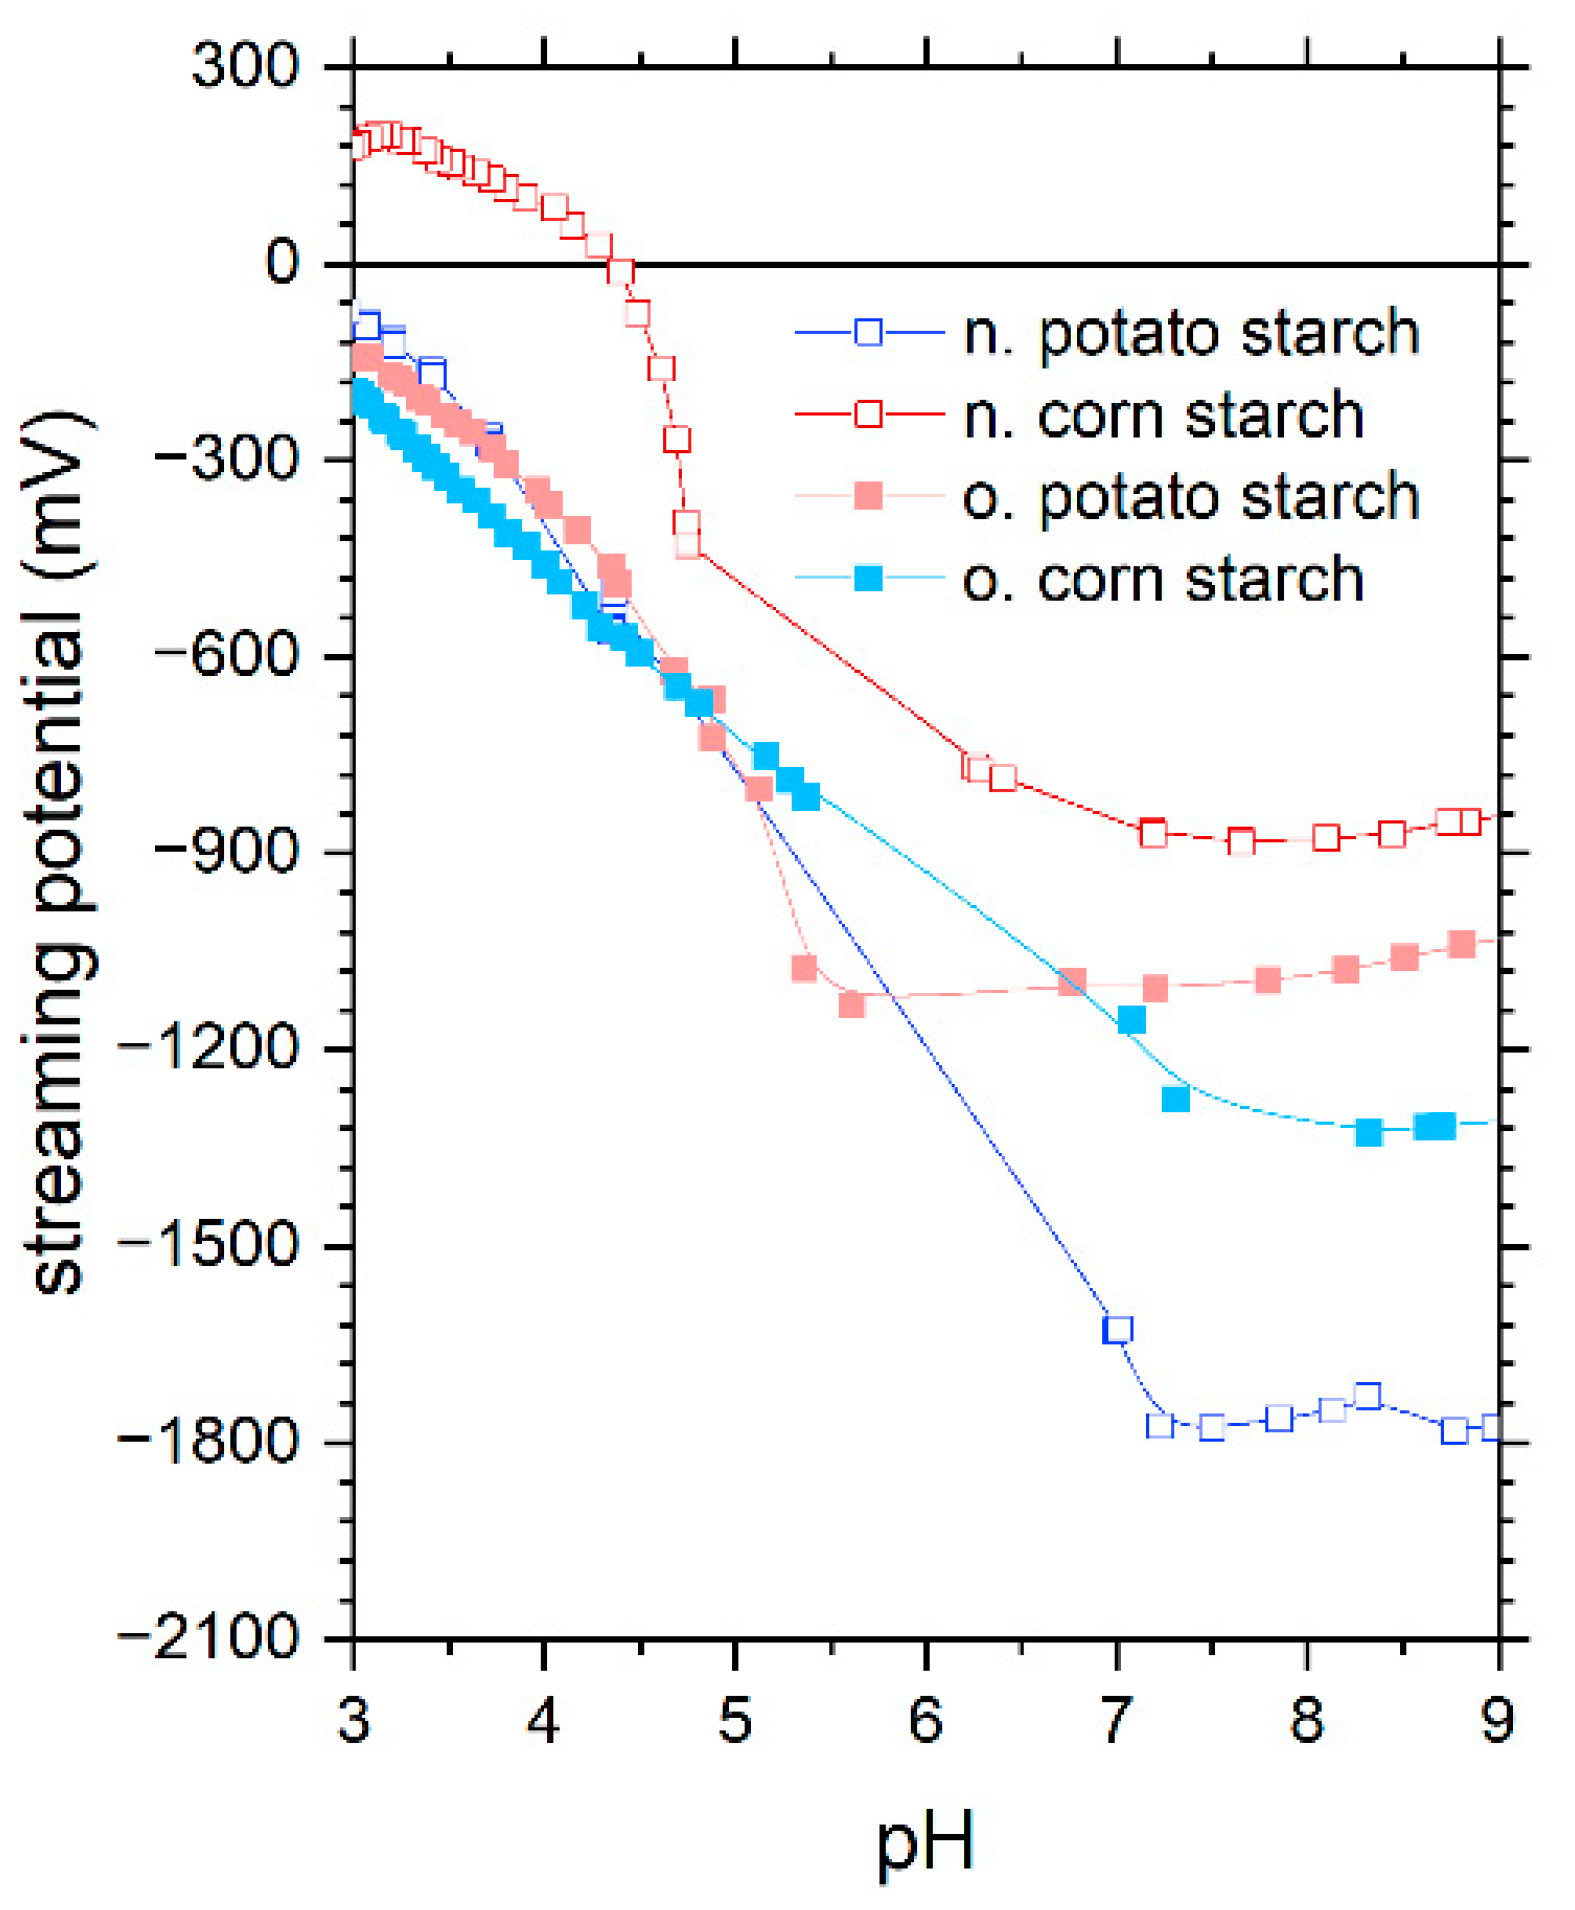
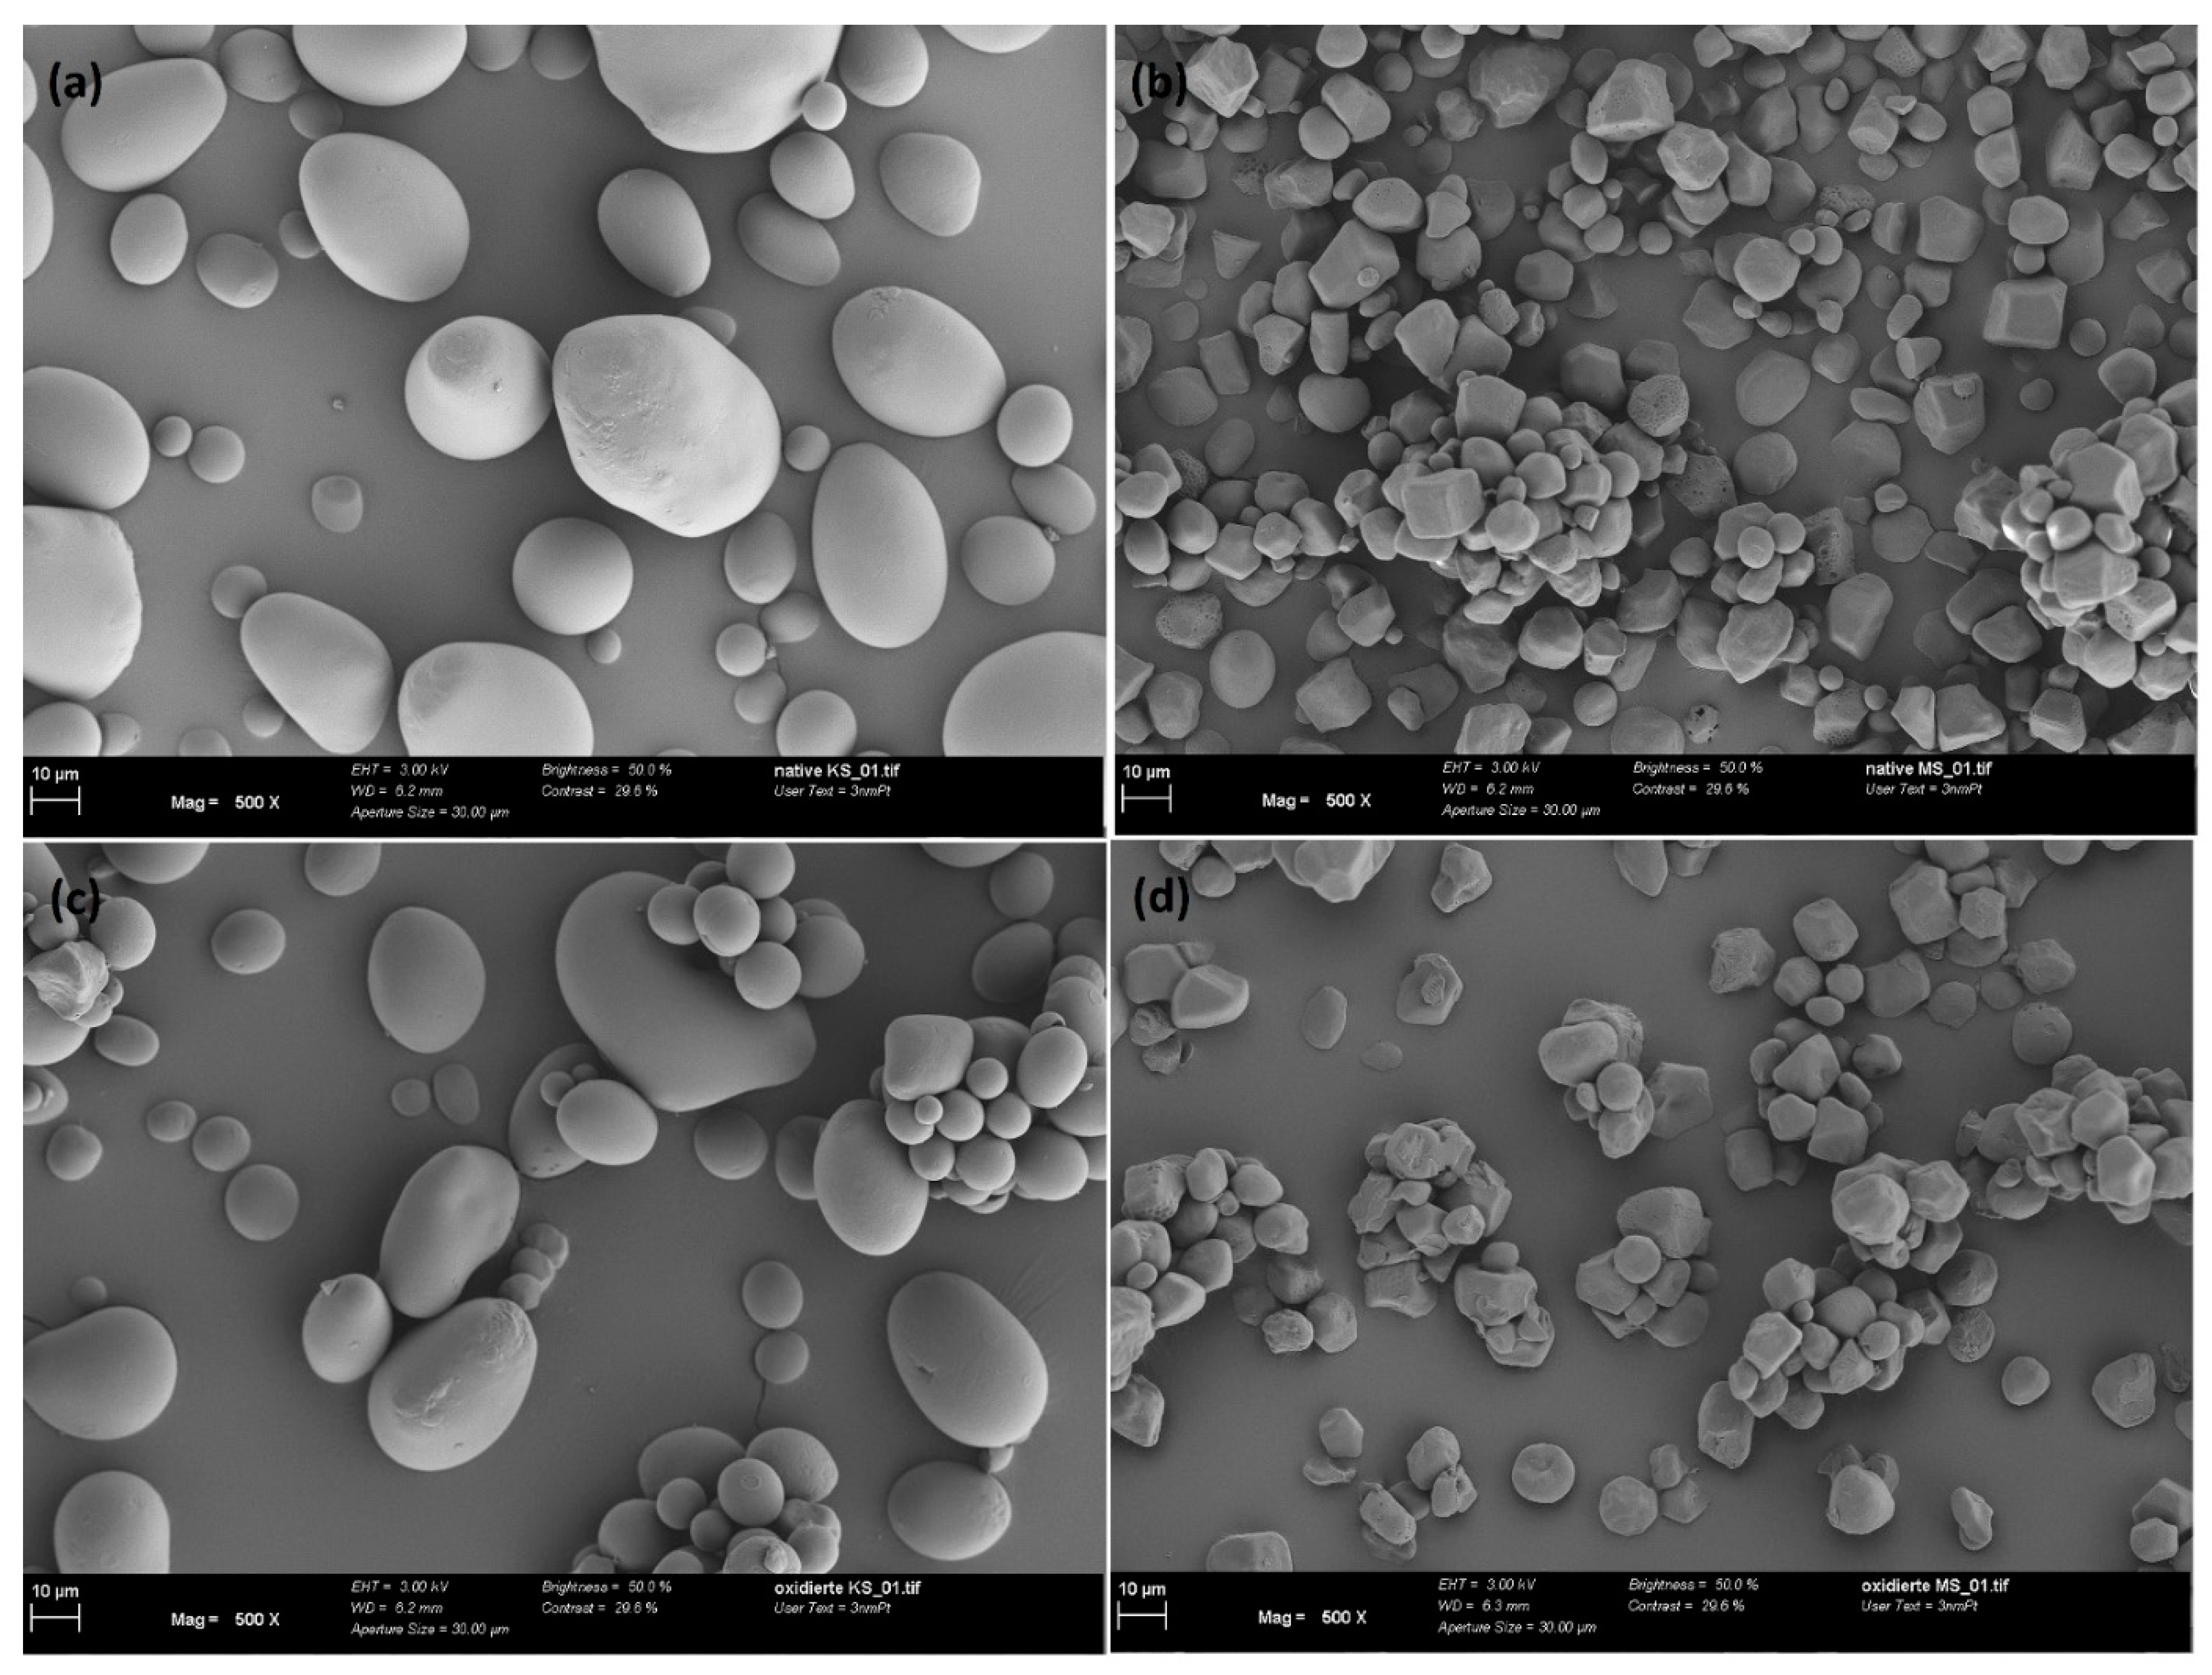
4.1. Characterization of Starch

The characterization of corn and potato starch samples, both native (abbreviated hereafter with n.) and oxidized (abbreviated hereafter with o.), was investigated by our author team [16] in detail, as summarized below. First, it was found that the charge density and zeta potential measurements as a function of pH disclose information on the starch structure and functional groups, which are critical for adsorption (Figure 1). The presence of carboxyl and aldehyde groups in both oxidized starch samples results in a negative charge in the pH range of 3 to 9. N. potato starch is also negatively charged over the tested pH range potentially due to well-accessible hydroxyl groups. In contrast, n. corn starch was found to have an isoelectric point (IEP) at 4.5. From charge density measurements, the oxidized starch exhibited the highest negative charge, whereas the native starches had the lowest. In general, the carboxyl group had the lowest pKa compared to secondary and primary hydroxyl groups. Because the o. corn starch had the largest negative charge at pH 3 among all samples, we concluded that this starch contains more carboxyl groups. As the hydroxyl group is deprotonated in alkaline pH ranges, the observed leveling in charge density values of oxidized corn starch in the pH range of 5 to 9 reveals a lower number of hydroxyl groups than all other starches and especially than o. potato starch. For the o. potato starch, we found that it potentially contained more aldehyde groups compared to the other samples, indicated by charge density measurements and especially thermogravimetric analysis under N2. ATR-FTIR spectroscopy (attenuated total reflection-Fourier transform infrared spectroscopy) supported the findings of carboxylic groups and carbonyls in the oxidized starch samples. Finally, we used NMR-1H spectroscopy (Proton nuclear magnetic resonance) to study the branching degree, which was between 3.2% and 5.5% for the samples. Elemental analysis showed that no residual proteins were left in the samples in the absence of nitrogen. Via ICP-OES analysis of microwave-assisted digested samples and via SEM-EDX (Scanning Electron Microscopy (SEM) with Energy Dispersive X-ray Analysis), we observed that starch is not a purely organic substance since it contains various inorganic elements, such as Fe, Si, P, Na, S, Cl, K, Ca, and F, at a level of milligrams per gram. Furthermore, the study also covers the morphology of the starch samples. According to the SEM images (scanning electron microscopy) in Figure 2, the starch samples exhibited µm-sized particles. The n. and o. potato starch showed a more spherical form, while the n. and o. corn starch are a polyhedral shape.

4.2. Preliminary Sorption Experiments

The purpose of this experiment is to determine the efficacy of starch in removing the heavy metal ions Mn2+, Fe2+, Ni2+ and sulfate ions from simulated wastewater. We set the concentration of the heavy metal ions in our experiments to ten, one hundred, and one thousand times the limit values specified by the German drinking water ordinance (TrinkwV) [11] to simulate three potential pollution scenarios. Figure 3 depicts the results of the adsorption screening on the four starch samples.
Ni2+ adsorption was tested with concentrations of 0.2, 2.0, and 20.0 mg/L, which were prepared from NiSO4 solution. The percentage removal is exceedingly high for the o. starches. At a concentration of 0.2 mg/L, the o. potato starch adsorption rate is 97%, and the o. corn starch adsorbs 96%, achieving drinking water quality in both cases. At a concentration of 2 mg/L of nickel, which is 100 times higher than the value given by the drinking water limit, 99% is removed onto both the o. potato starch and o. corn starch, respectively. Here, the 99% removal rate is also leading to values acceptable for drinking water, which is showing outstanding adsorption efficiency. Comparing the n. starches, the potato starch, showed a greater percentage of adsorption than corn starch at all studied concentrations. Here, n. potato starch shows 95% removal in the 0.2 mg/L concentration and around 81% and 15% adsorption in the higher concentrations. The pH values of the sorption of Ni2+ are presented in Figure S1.
The adsorption efficiency of Fe2+/3+ from aqueous media featured high adsorption values at different concentration ranges 10-, 100-, and 1000-fold values of the drinking water concentration limit. As expected, the n. potato starch has higher adsorption rates than n. corn starches because of the high negative charge caused by the presence of more OH groups on the surface of the n. potato starch than the n. corn starch (see Figure 1). The negatively charged starch (anionic surface) and cationic metal ions interact significantly. The adsorption process is facilitated by this interaction. At a concentration of 20 mg/L, which corresponds to the 10-fold of drinking water limit, the n. potato starch achieved 80% removal, while at the 100-fold concentration the adsorption lies at 16% owing to the high initial concentration. The adsorption of both o. starches is significantly higher than the removal by n. starches. At a 10-fold limit value, the adsorption corresponds to 97% and 88% for o. corn starch and o. potato starch, respectively. At the 100-fold level, 87% and 79% were adsorbed using o. corn starch and o. potato starch, respectively. At 200 mg/L Fe2+/3+, which corresponds to the 1000-fold of drinking water value, the metal ion removal lies at 7.5% and 9.5% for o. corn starch and o. potato starch, respectively. The pH values of the sorption of Fe2+/3+ are presented in Figure S2.
For Mn2+, adsorption rates for the o. starches exhibited values greater than 95% at concentrations ranging from 0.5 to 5.0 mg/L. For the experiment with initially 0.5 mg/L Mn2+, drinking water standards were reached by the o. starch samples. The measured percentage adsorption rates for the n. potato starch was 84% and 30% at 0.5 mg/L and 5 mg/L, respectively, surpassing the adsorption efficiency of the n. corn starch. At a concentration of 50 mg/L Mn2+, which corresponds to the 1000-fold of drinking water value, lies the adsorption rates with 6%, 31%, and 32% for n. potato starch, o. corn starch and o. potato starch, respectively. The pH values of the sorption of Mn2+ are presented in Figure S3.
In fact, the presence of carboxyl, carbonyl, and hydroxyl groups yielded significantly higher adsorption rates for all tested metal ions seen from the o. potato and o. corn starches as well as at low concentrations for n. potato starch.
Unlike Ni2+, Fe2+/3+, and Mn2+ adsorption, sulfate ion adsorption on o. and n. potato starches is negligible. The values fluctuate between 0% and 5%. Zeta potential and charge density measurements showed the negative charge of all starch samples between pH 4 and 7 [16]. All adsorption studies were carried out at this pH range which explains the repulsion of negatively charged sulfate to the anionic starch surface (see Figures S1–S3). However, the adsorption of sulfate in low amounts is possibly owing to a kind of cooperative mechanism with sulfate and certain cations [16].

4.3. Kinetic and Isotherm Adsorption Experiments

The successful adsorption results of Ni2+ from NiSO4 solution, Fe2+ from FeSO4 solution, and Mn2+ from MnSO4 solution on both o. starches and n. potato starch in three concentrations lead to a detailed study of the adsorption mechanism to determine the isotherm type and how the ions bind to starch. First, the kinetics of adsorption were determined in experiments with FeSO4 solution.

4.3.1. Kinetic Study of Fe2+/3+ and SO42− Adsorption

Prior to conducting the isotherm adsorption experiment, it is critical to study the adsorption kinetics as a function of time to establish the adsorption equilibrium. The adsorption equilibrium was determined using FeSO4 at a concentration of 10 mg/L Fe2+/3+ at different time periods from 5 min to 180 min on o. and n. potato and corn starch, respectively (Figure 4). We observe that equilibrium is not attained until 10 min, after which a plateau for both o. and n. starch is approached, implying that the adsorption equilibrium was reached after 10 min of adsorption time, indicating that the adsorption process is fast. To ensure equilibrium also with respect to potential deviant behavior of the other metal ions, 2 h was chosen for heavy metal ion adsorption equilibrium for greater precision. The o. potato starch showed the best adsorption rate. A total of 96% of Fe2+/3+ was removed at an iron concentration of 10 mg/L. The o. corn starch shows a good Fe2+/3+ removal value, adsorbing 92% of iron ions. The o. starch surpasses the adsorption efficiency achieved with both n. starches, whereas n. potato starch shows a better adsorption behavior than the n. corn starch, with a removal of 16%. These results support the findings from Section 4.2. No adsorption of sulfate was observed (Figure S4). Afterward, the adsorption isotherms for the metal ions Fe2+, Ni2+, and Mn2+ from the respective NiSO4, FeSO4, and MnSO4 solutions were determined.

4.3.2. Sorption Isotherm Experiments with Ni2+

Nickel’s high adsorption rate was immediately identifiable during the screening procedure in Figure 3.
The o. starch samples provide the best adsorption rate of Ni2+, as shown in the screening experiments in Figure 3. The o. potato starch and the o. corn starch almost removed 100% Ni2+ in a concentration range from 2.8 to 260 µmol/g (see Figure S5). Thus, the results agree with the first investigations in Section 4.2. The removal of the nickel ions with the n. potato starch was successful although lower than the adsorption of the o. starches; it reached 95% at 8.7 µmol/L. The uptake of Ni2+ by n. corn starch is negligible (see Figure S5). In Figure 5, the o. starches show much higher adsorption capacities of almost 120 µmol/g and 100 µmol/g Ni2+ ions for o. potato and o. corn starch, respectively. In comparison, n. potato starch has a lower value of adsorption capacity above 10 µmol/g. No adsorption of sulfate was observed (Figure S6).
We fitted the adsorption isotherms using three different fitting models, also presented in our last paper to ensure more consistent work and comparable results [16]. The three adsorption isotherms selected are Langmuir, Sips, and Dubinin–Radushkevich. Langmuir describes homogeneous monolayer adsorption where the adsorption sites must be energetically equal [19,26]. The Sips model, as a combination of Freundlich and Langmuir, describes adsorption on a potential heterogeneous surface as a combination of the Langmuir and Freundlich Isotherms [20,23]. Dubinin–Radushkevich’s observation distinguishes the sorption type as chemi- or physisorption and is based on the Polanyi potential [23,27]. The Sips model provides the greatest R2 values (coefficient of determination) for all three fitted models. The fitting results of the three distinct models are shown in Table 2 and Figure S7. As the Sips model exponent n is exhibiting values differing from unity, it leads to the conclusion that nickel ions are adsorbed on the three samples on an energetically heterogeneous surface.
The values of Eads,DR calculated through the Dubinin–Radushkevich model are almost equal for both o. starches and n. potato starch, indicating that the affinity is almost similar to the modified and unmodified starches toward Ni2+, though the maximal metal uptake amount of the three samples is different. This result could also be explained by distinct heterogeneous distributions on the surface of the starch samples with variable amounts of available binding sites. The calculated Gibbs energy change (ΔG°) from Equation (8) was calculated from the Langmuir equilibrium constant (KL) to determine the spontaneity of the adsorption process [25]. The values range between −30.3 kJ/mol and −33.0 kJ/mol, indicating that the adsorption process is physisorption of a spontaneous nature. The pH values of the sorption of Ni2+ are presented in Figure S8.

4.3.3. Sorption Isotherm Experiments with Fe2+/3+

The adsorption isotherm of FeSO4 in a concentration range between 0.1 and 40 mg/L Fe2+ is shown in Figure 6. Here, we present the initial investigation into the FeSO4 adsorption on native and oxidized starch samples.
In a small concentration range from 2 to 100 μmol/L, the Fe2+/3+ ions were almost completely adsorbed by all starches. The maximum adsorption rate for o. corn starch is 97% for a concentration of 100 μmol/L (see Figure S9). At the same initial concentration, the o. potato starch removed 96% of the Fe2+/3+ ions. For n. potato and n. corn starch. The maximum percentage of adsorption (92% and 20%., respectively) can be seen at 17 μmol/L. The adsorption of SO42− varies between 0 and 5% 8 (see Figure S10). The o. starches show the highest metal ion uptake with their respective plateaus around 85 μmol/g for the o. potato starch and 64 μmol/g for the o. corn starch. The high negative charges of the o. starches due to the carboxyl and carbonyl group here enable high adsorption capacities. The n. potato starch showed a plateau at 14 μmol/g owing to its high number of OH groups. Furthermore, during the adsorption, a slight change in the color of the solution from white to yellow can be seen. The color change indicates the oxidation of Fe2+ ions and the appearance of Fe3+ ions. Therefore, the bonding strength of Fe2+/3+ ions to o. starches is greater than that of Fe2+/3+ ions to n. starches due to its high charge bind to Fe3+ quickly with the COO group, which is a hard base according to the HSAB theory [12,28,29]. In comparison to Fe2+/3+ ions, Ni2+ ions have a greater adsorption affinity on o. starches, Ni2+ is a borderline acid that, like Fe2+/3++, prefers to attach to COO groups. Apart from that, Ni2+ has a smaller ionic radius (0.71 Å), thus is a harder acid according to HSAB, than Fe2+ (0.78 Å) [30], which explains why Ni2+ adsorption on starches is higher than Fe2+/3+ adsorption.
Only the Langmuir and the Dubinin–Radushkevich model rendered a meaningful fit for the tested Fe2+/3+ isotherm. The fitting data are shown in Table 3 and the graphical comparison of the different fitting models is presented in Figure S11. As the Langmuir model showed the best fit for the different starch samples, its graph is presented in Figure 6. The maximal adsorption capacities of the Langmuir isotherm model were 14.3 µmol/g, 86.3 µmol/g, and 65.7 µmol/g on n. potato, o. potato, and o. corn starch, respectively. This is in very good agreement with the maximum experimental adsorption capacities. The n. corn starch does not provide a fit for any of the three chosen adsorption models due to the low adsorbed amount of Fe2+/3+. The pH values of the sorption of Fe2+ are presented in Figure S12.
The mean free energy of adsorption Eads,DR of Fe2+/3+ is determined by the Dubinin–Radushkevich model and shows values of 17.03, 14.47, and 16.90 kJ/mol onto n. potato. o. potato starch and o. corn starch, respectively. The values for Eads,DR are below 80 kJ/mol; this leads to the conclusion that the adsorption is physisorption and not chemisorption. The calculated Gibbs free energy (ΔG°) from Equation (8) in Section 3.2 was calculated from the Langmuir equilibrium constant (KL) to determine the spontaneity of the adsorption process [25]. The negative ΔG° values calculated from KL are showing again that the adsorption is spontaneous.

4.3.4. Sorption Isotherm Experiments with Mn2+

Mn2+ adsorption was also further analyzed in adsorption batch experiments. The adsorption isotherms of Mn2+ from MnSO4 solution onto n. potato starch, n. corn starch, o. potato starch, and o. corn starch, depicted in Figure 7, exhibited differing adsorption rates and capacities. The results of all four selected starch samples when comparing Mn2+ to Fe2+/3+ exhibit nearly identical behavior. The percentage sorption of Mn2+ from MnSO42− is presented in Figure S13.
The adsorption of o. potato starch and o. corn starch reached a plateau at almost 65 mol/g and 80 mol/g, respectively. The presence of carboxyl and carbonyl groups accounts for the increased metal ions adsorption compared to n. potato starch and n. corn starch. N. potato starch reached a plateau with values of around qeq = 10 µmol/g. The adsorption of SO42− was not observed (see Figure S14). The pH values of the sorption of Mn2+ are presented in Figure S15.
Table 4 displays the fitting data for n. potato starch, o. potato starch, and o. corn starch. Decided on the respective R2 values, the Sips model showed the highest correlation. The Langmuir and the Dubinin–Radushkevich fitting models were presented in Figure S16. The Sips model confirmed the heterogeneous adsorption of Mn2+ onto n. potato and o. potato starch, seen from the model exponent n. The exponent n in the Sips model of all samples in Table 3 is above 1, demonstrating that the adsorption is not energetically homogeneous but rather heterogeneous and returns to the Freundlich model, indicating high interaction of sorbate Fe2+/3+ and starch [31,32].
The adsorbed amount of Mn2+ is a little lower than the adsorbed amount of Fe2+/3+ because, as mentioned in Section 4.3.3., Fe2+ oxidizes to Fe3+ ions, which is a stronger acid than Mn2+. Thus, the complex formation with COO is more favorable for Fe3+, Fe2+ than Mn2+, respectively. Moreover, the difference between the ionic radii of the metal ions influenced the adsorption. The smaller the ionic radius is, the higher is the adsorption efficiency (0.645 Å for Fe3+, 0.78 Å for Fe2+, and 0.86 Å for Mn2+) [12,33,34].

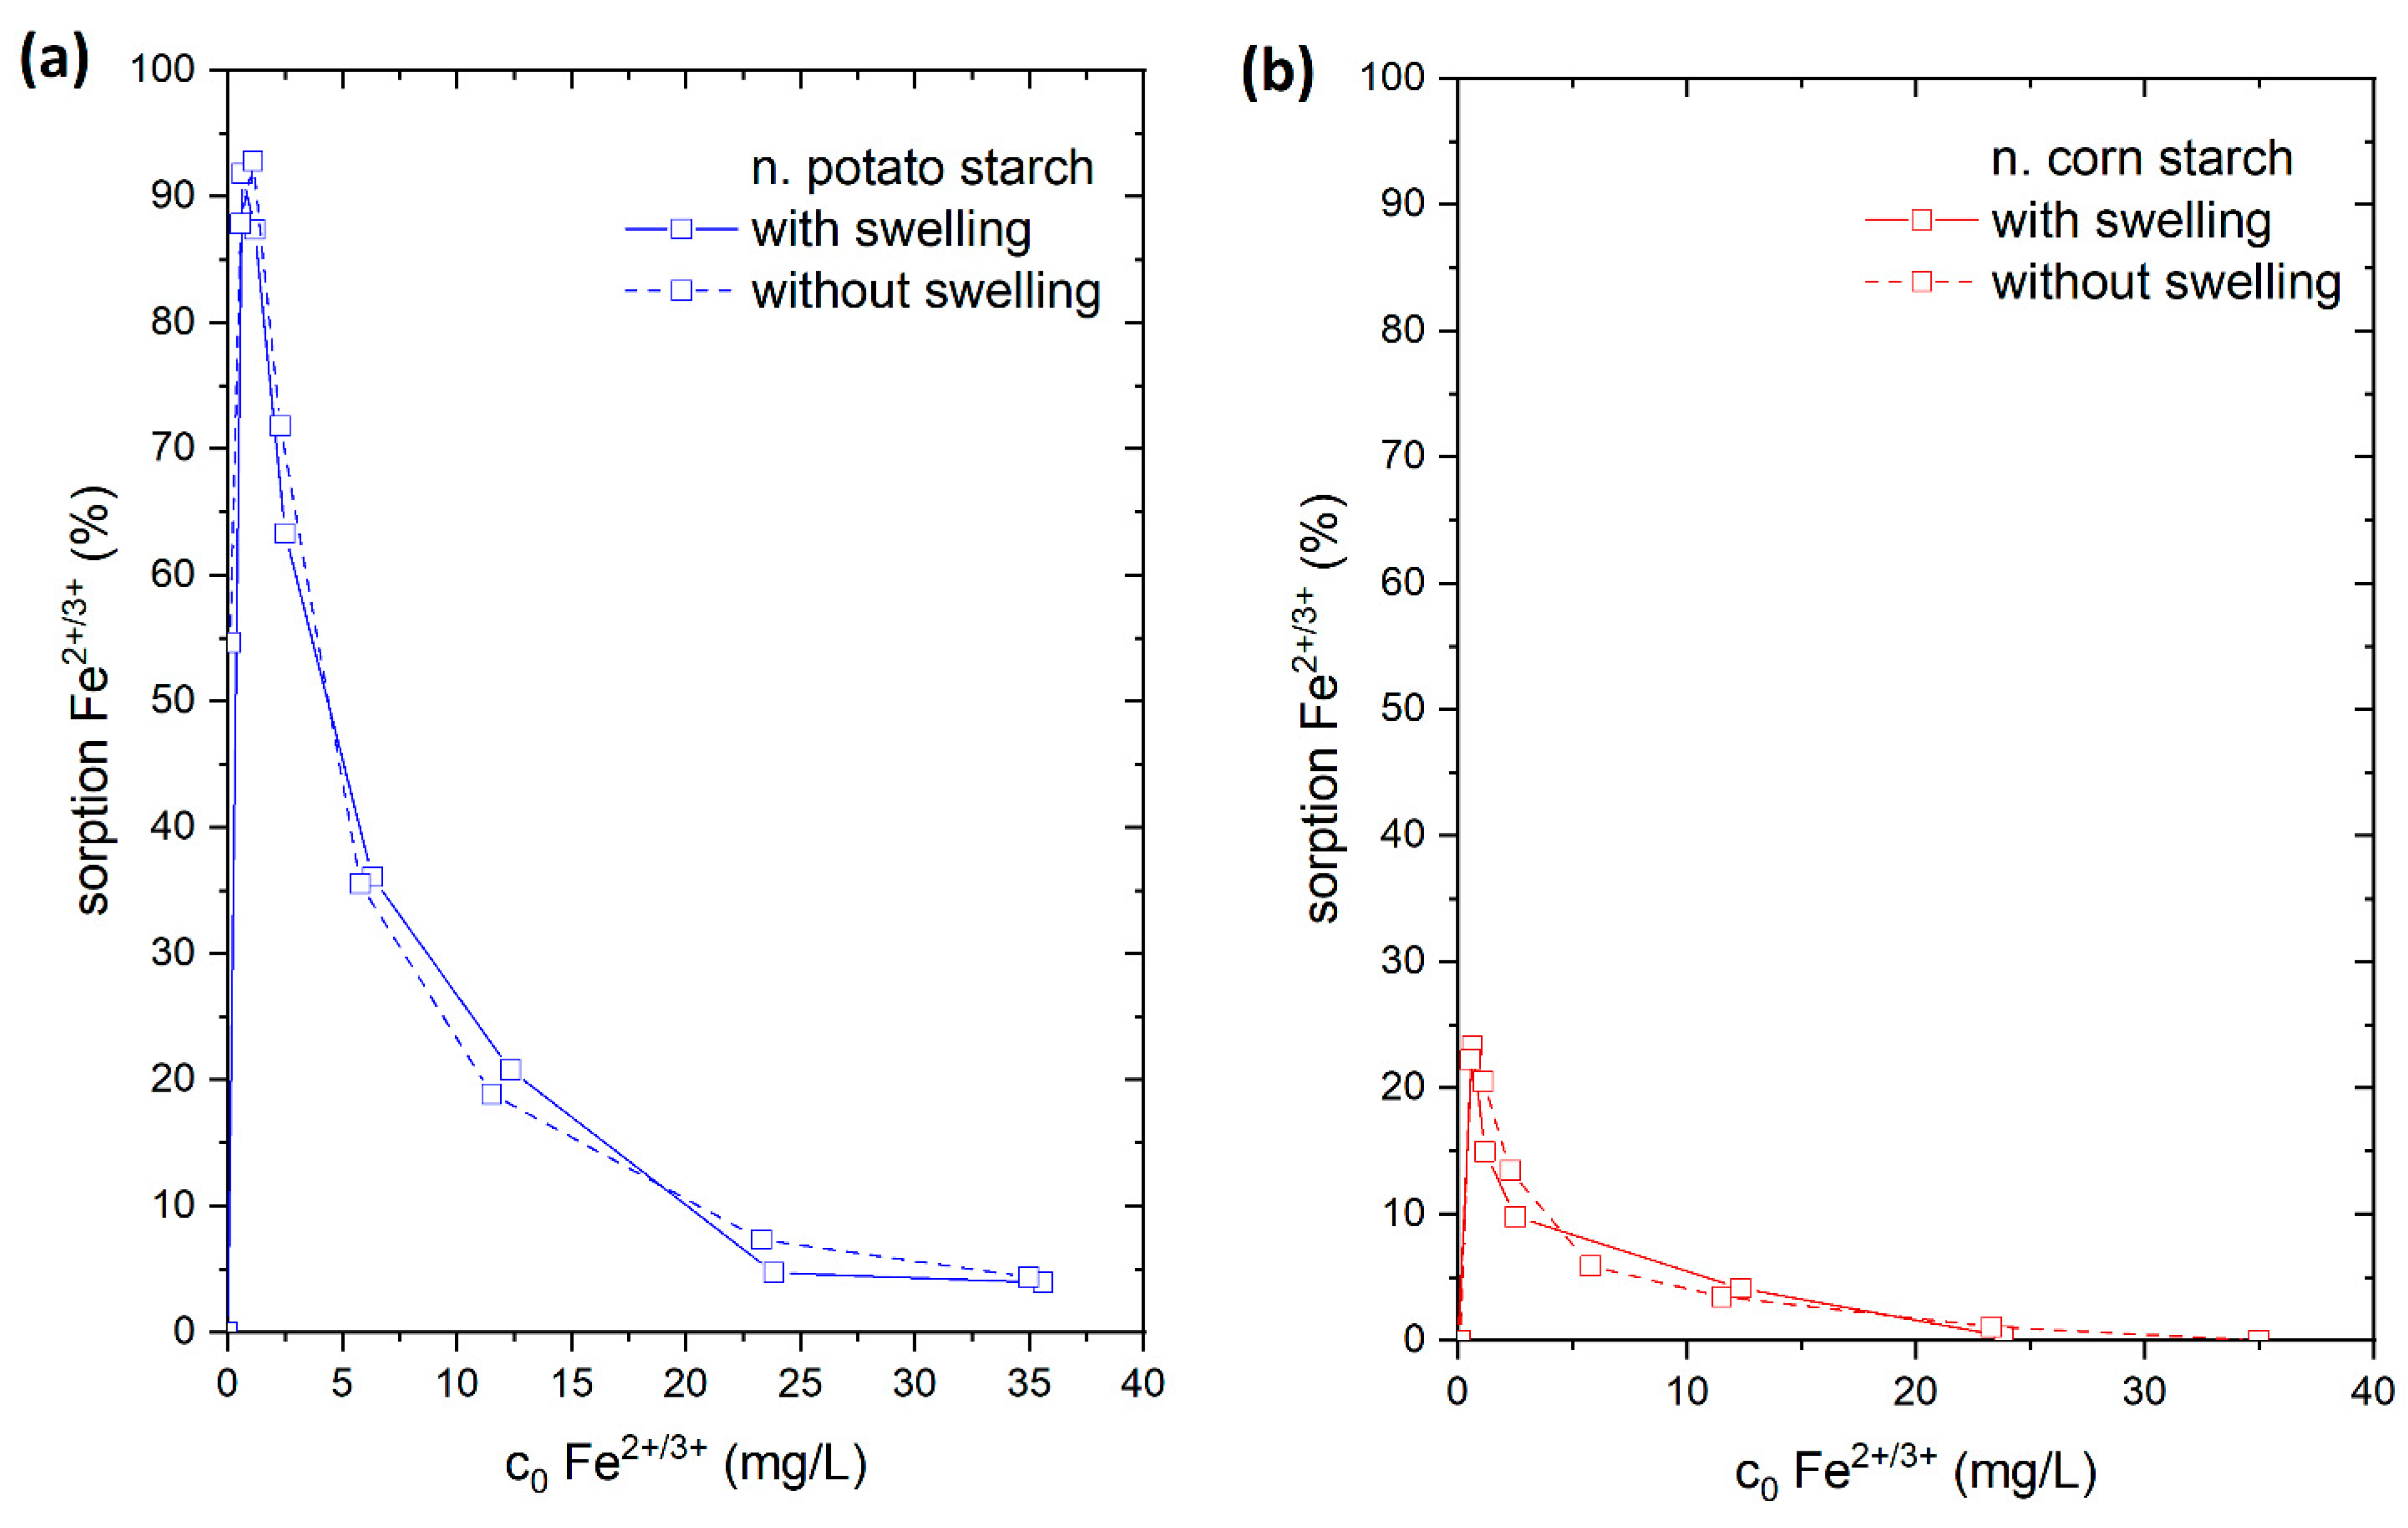
4.3.5. Adsorption of Fe2+/3+ with and without Swelling on Starch

We selected both o. and both n. starches to investigate the influence of the swelling behavior of starches on the adsorption process. The swelling does influence particle sizes, wettability, and kinetic of solute uptake and therefore significantly affects the adsorption process. Our previous article’s FTIR and NMR spectra revealed that natural starches possess OH groups, while o. starches include COOH, CHO and OH groups. These groups provide the starch with a highly hydrophilic surface, which facilitates the loading of the water molecule into the starch, resulting in starch granule swelling [35].
The adsorption of Fe2+/3+ from the FeSO4 solution was chosen for this study. For that reason, the starch samples were stirred for 24 h in 15 mL of ultrapure water prior to adding 15 mL FeSO4 solution. We compared the results to adsorption experiments where 30 mL of FeSO4 solution (in corresponding concentrations) were directly added to the starch samples. In a direct comparison of these experiments (Figure 8), we found that there was a reduction in the adsorption of Fe2+/3+ ions onto both o. starches in the swollen state. In contrast, no difference in the quantity of Fe2+/3+ adsorption was seen for n. starches. This demonstrates that the o. starches were more swollen in water than the n. starches. It is likely that the presence of hydrophilic carboxyl groups and hydroxyl groups is facilitating water uptake for the o. starches. The addition of water potentially causes the formation of hydrogen bonds with water (see Figure 9), making it difficult for the Fe2+/3+ cations to form complexes with carboxyl groups. As the adsorption of the o. starches is strongly depending on the availability of carboxyl and carbonyl groups, prior swelling is reducing the uptake of metal ions. This result indicates that n. starches and their OH groups are still available for adsorption and hydrogen bonds with water molecules are less stable. Therefore, it is easier for Fe2+/3+ to break the bonding between the water and OH groups than the carboxyl groups.

5. Conclusions

In this article, the adsorption behaviors of four different starches towards the heavy metal ions Mn2+, Fe2+, and Ni2+ were studied. Firstly, we tested the percentage removal of realistically low concentrations of these ions in simulated wastewaters. Therefore, the respective metal ion concentrations were set to 10-fold, 100-fold and 1000-fold of the drinking water limits prescribed by the German drinking water ordinance. Here, we showed that oxidized potato, oxidized corn starch and also n. potato starch are extremely valuable as they can reduce pollution by up to two orders of magnitude. With this, drinking water quality was achieved in various experiments as the samples showed viable adsorption towards these tested ions. We determined the adsorption isotherms for all three ions Mn2+, Fe2+, and Ni2+ onto all starches in the second step. Here, we could show that we reached maximum adsorption capacities of 77 µmol Fe2+/g, 84 µmol Mn2+/g, and 118 µmol Ni2+/g, all achieved with oxidized potato starch. We found that the sorption affinity of the starches towards Ni2+, Fe2+/3+, and Mn2+ was strongly influenced by the size of the ionic radius and the acidity of the respective metal ion. With a smaller ionic radius and higher acidity, the metal ion uptake consequently increases. Ni2+ shows the best adsorption results in the order rNi2+ < rFe2+ < rMn2+. The adsorption of Fe2+ is higher than the adsorption of Mn2+ because Fe2+ in the adsorption transforms to Fe3+; thus, Fe3+ is a stronger acid than Mn2+ and prefers to bind with strong bases such as COOH and OH. That is why the bonding between the o. starches and Fe2+/3+ ions are higher than Manganese ions. The metal uptake amounts onto starch were compared with the literature (see SI; Tables S1–S3). We discovered that the oxidized starch has well-adsorbed manganese and nickel, similar to the Helles brewer’s spent grain.
The adsorption behavior of each metal ion was also studied and showed that the best fitting model to describe the adsorption process is the Sips isotherm. In a third investigation, we analyzed the influence of prior swelling on the subsequent adsorption process. Here, we found that the swelling showed no significant influence on the native starches. In contrast, both oxidized starches showed a significant drop in adsorption performance. The prior swelling led to a partial blocking of their carboxyl and carbonyl groups by hydrogen bond formation with water molecules, inhibiting complexation or ionic interaction towards metal ions.

Supplementary Materials

The following are available online at https://www.mdpi.com/article/10.3390/polysaccharides3030033/s1, Figure S1: pH0 and pHeq values of the sorption of Ni2+ from NiSO42− solution at a low concentration of Ni2+ at c0 = 0.2 mg/L (10-fold of the guideline value of the drinking water ordinance “TrinkwV”), medium concentration of Ni2+ at c0 = 2 mg/L (100-fold of the guideline value of the drinking water ordinance “TrinkwV”), and high concentration of Ni2+ at c0 = 20 mg/L (1000-fold of the guideline value of the drinking water ordinance “TrinkwV”). pH0 is the initial pH before the sorption and pHeq is the equilibrium pH measured after the sorption onto n. potato starch (blue), n. corn starch (red), o. potato starch (light blue) and o. corn starch (pink); Figure S2: pH0 and pHeq values of the sorption of Fe2+ from FeSO42− solution at a low concentration of Fe2+ at c0 = 2 mg/L (10-fold of the guideline value of the drinking water ordinance “TrinkwV”), medium concentration of Fe2+ at c0 = 20 mg/L (100-fold of the guideline value of the drinking water ordinance “TrinkwV”), and high concentration of Fe2+ at c0 = 200 mg/L (1000-fold of the guideline value of the drinking water ordinance “TrinkwV”). pH0 is the initial pH before the sorption and pHeq is the equilibrium pH measured after the sorption onto n. potato starch (blue), n. corn starch (red), o. potato starch (light blue) and o. corn starch (pink); Figure S3: pH0 and pHeq values of the sorption of Mn2+ from MnSO42− solution at a low concentration of Mn2+ at c0 = 0.5 mg/L (10-fold of the guideline value of the drinking water ordinance “TrinkwV”), medium concentration of Mn2+ at c0 = 5 mg/L (100-fold of the guideline value of the drinking water ordinance “TrinkwV”), and high concentration of Mn2+ at c0 = 50 mg/L (1000-fold of the guideline value of the drinking water ordinance “TrinkwV”). pH0 is the initial pH before the sorption and pHeq is the equilibrium pH measured after the sorption onto n. potato; Figure S4: Percentage sorption of SO42− ions from time-dependent sorption experiments with FeSO4 solution with an initial concentration of Fe2+ ions of 20 mg/L onto n. potato starch (blue), n. corn starch (red), o. potato starch (light blue) and o. corn starch (pink); Figure S5: Percentage sorption of Ni2+ from NiSO4 solution with n. potato starch (blue), n. corn starch (red), o. potato starch (light blue) and o. corn starch (pink); Figure S6: Percentage sorption of SO42− from sorption experiments with NiSO4 solution onto the starch samples with n. potato starch (blue), n. corn starch (red), o. potato starch (light blue) and o. corn starch (pink); Figure S7: Graphical comparison of the Langmuir, Sips and Dubinin-Radushkevich fitting model for the sorption isotherms of Ni2+ from NiSO4 solution of the starch samples with n. potato starch (blue), n. corn starch (red), o. potato starch (light blue) and o. corn starch (pink); Figure S8: pH0 and pHeq values for the sorption of Ni2+ from NiSO42− solution where pH0 is the initial pH before the sorption and pHeq is the equilibrium pH measured after the sorption onto n. potato starch (blue), n. corn starch (red), o. potato starch (light blue), and o. corn starch (pink); Figure S9: Percentage sorption of Fe2+ from FeSO4 solution with n. potato starch (blue), n. corn starch (red), o. potato starch (light blue) and o. corn starch (pink). Figure S10: Percentage sorption of SO42− from sorption experiments with FeSO4 solution onto the starch samples with n. potato starch (blue), n. corn starch (red), o. potato starch (light blue) and o. corn starch (pink); Figure S11: Graphical comparison of the Langmuir and Dubinin-Radushkevich fitting model for the sorption isotherms of Fe2+/3+ from FeSO4 solution with n. potato starch (blue), n. corn starch (red), o. potato starch (light blue) and o. corn starch (pink); Figure S12: pH0 and pHeq values for the sorption of Fe2+ from FeSO42− solution where pH0 is the initial pH before the sorption and pHeq is the equilibrium pH measured after the sorption onto n. potato starch (blue), n. corn starch (red), o. potato starch (light blue), and o. corn starch (pink); Figure S13: Percentage sorption of Mn2+ from MnSO4 solution with n. potato starch (blue), n. corn starch (red), o. potato starch (light blue) and o. corn starch (pink); Figure S14: Percentage sorption of SO42− from sorption experiments with MnSO4 solution onto the starch samples with n. potato starch (blue), n. corn starch (red), o. potato starch (light blue) and o. corn starch (pink); Figure S15: pH0 and pHeq values for the sorption of Mn2+ from MnSO42− solution where pH0 is the initial pH before the sorption and pHeq is the equilibrium pH measured after the sorption onto n. potato starch (blue), n. corn starch (red), o. potato starch (light blue), and o. corn starch (pink); Figure S16: Graphical comparison of the Langmuir, Sips and Dubinin-Radushkevich fitting model for the sorption isotherms of Mn2+ from MnSO4 solution with n. potato starch (blue), n. corn starch (red), o. potato starch (light blue) and o. corn starch (pink). Table S1: Sorption of Fe2+/3+ onto biopolymers [12,36]; Table S2: Sorption of Mn2+ onto biopolymers; Table S3: Sorption of Ni2+ onto biopolymers.

Author Contributions

Methodology, C.S.; formal analysis, C.S. and R.B.; investigation, C.S. and R.B.; writing—original draft preparation, R.B. and K.B.L.B.; writing—review and editing, A.S., J.S., M.M. (Martin Mayer), S.S., M.M. (Michael Mertig), D.S., C.S., R.B. and K.B.L.B.; visualization, R.B., C.S., D.S., K.B.L.B. and S.S.; supervision, S.S. and D.S.; project administration, M.M. (Michael Mertig) and S.S.; funding acquisition, M.M. (Michael Mertig) and S.S. All authors discussed the results and commented on the manuscript. All authors have read and agreed to the published version of the manuscript.

Funding

The authors gratefully acknowledge the support received from the Saxonian funding organization SAB and LfULG within the cooperative projects entitled “Development of environmentally compatible biopolymers as flocculants/adsorbents for the removal of iron and sulfate ions from surface waters” (SAB no 100377122) and “Mobile sensor systems for on-site heavy metal detection in water” (contract 33-8128/157/1), respectively.

Institutional Review Board Statement

Not applicable.

Informed Consent Statement

Not applicable.

Data Availability Statement

All findings discussed are based on the data contained within this current study.

Acknowledgments

The authors thank AGRANA Research and Innovation Center GmbH from Tulln, Austria for the support of the materials, discussions and cooperativeness. Both institutes (IPF Dresden and KSI Meinsberg) gratefully acknowledge the co-financing by tax funds on the basis of the budget passed by the Saxon state parliament.

Conflicts of Interest

The authors declare no conflict of interest.

References

  1. Schwarz, S.; Steinbach, C.; Schwarz, D.; Mende, M.; Boldt, R. Chitosan—The Application of a Natural Polymer against Iron Hydroxide Deposition. Am. J. Anal. Chem. 2016, 7, 623–632. [Google Scholar] [CrossRef]
  2. Jaishankar, M.; Tseten, T.; Anbalagan, N.; Mathew, B.B.; Beeregowda, K.N. Toxicity, Mechanism and Health Effects of Some Heavy Metals. Interdisci. Toxicol. 2014, 7, 60–72. [Google Scholar] [CrossRef]
  3. Soto, D.; Urdaneta, J.; Pernía, K.; Leõn, O.; Muñoz-Bonilla, A.; Fernandez-García, M. Removal of Heavy Metal Ions in Water by Starch Esters. Starch/Staerke 2016, 68, 37–46. [Google Scholar] [CrossRef]
  4. Sinicropi, M.S.; Caruso, A.; Capasso, A.; Palladino, C.; Panno, A.; Saturnino, C. Heavy Metals: Toxicity and Carcinogenicity. Pharmacologyonline 2010, 333, 329–333. [Google Scholar]
  5. Schwarz, S.; Schwarz, D.; Ohmann, W.; Neuber, S. Adsorption and Desorption Studies on Reusing Chitosan as an Efficient Adsorbent. CSEE 2018, 128, 3–6. [Google Scholar] [CrossRef]
  6. Saito, M.; Arakaki, R.; Yamada, A.; Tsunematsu, T.; Kudo, Y.; Ishimaru, N. Molecular Mechanisms of Nickel Allergy. Int. J. Mol. Sci. 2016, 17, 202. [Google Scholar] [CrossRef]
  7. Qiao, Y.; Ma, L. Quantification of Metal Ion Induced DNA Damage with Single Cell Array Based Assay. Analyst 2013, 138, 5713–5718. [Google Scholar] [CrossRef]
  8. World Health Organization. Guidelines for Drinking—Water Quality, 4th ed.; World Health Organization: Geneva, Switzerland, 2017; ISBN 978-92-4-154995-0. [Google Scholar]
  9. Baby, J.; Raj, J.; Biby, E.; Sankarganesh, P.; Jeevitha, M.; Ajisha, S.; Rajan, S. Toxic Effect of Heavy Metals on Aquatic Environment. Int. J. Biol. Chem. Sci. 2011, 4, 939–952. [Google Scholar] [CrossRef]
  10. Lucchini, R.; Placidi, D.; Cagna, G.; Fedrighi, C.; Oppini, M.; Peli, M.; Zoni, S. Manganese and Developmental Neurotoxicity. Adv. Neutrobiol. 2017, 18, 13–34. [Google Scholar] [CrossRef]
  11. Bundesministerin der Justiz und für Verbraucherschutz-Trinkwasserverordnung, Anlage 2 (Zu § 6 Absatz 2): TrinkwV. 2019. Available online: https://www.gesetze-im-internet.de/trinkwv_2001/anlage_2.html (accessed on 9 July 2022).
  12. Carrasco, K.H.; Höfgen, E.G.; Brunner, D.; Borchert, K.B.L.; Reis, B.; Steinbach, C.; Mayer, M.; Schwarz, S.; Glas, K.; Schwarz, D. Removal of Iron, Manganese, Cadmium, and Nickel Ions Using Brewers’ Spent Grain. Polysaccharides 2022, 3, 356–379. [Google Scholar] [CrossRef]
  13. Chattopadhyay, S.; Chattopadhyay, D. Coal and Other Mining Operations: Role of Sustainability. In Fossil Energy; Springer: New York, NY, USA, 2020; pp. 333–356. [Google Scholar] [CrossRef]
  14. Jambor, J.L.; Dutrizac, J.E.; Groat, L.A.; Raudsepp, M. Static Tests of Neutralization Potentials of Silicate and Aluminosilicate Minerals. Environ. Geol. 2002, 43, 1–17. [Google Scholar] [CrossRef]
  15. Johnston, D.; Potter, H.; Jones, C.; Rolley, S.; Watson, I.; Pritchard, J. Abandoned Mines and the Water Environment; Environment Agenc: London, UK, 2008; ISBN 978-1-84432-894-9. [Google Scholar]
  16. Borchert, K.B.L.; Boughanmi, R.; Reis, B.; Zimmermann, P.; Steinbach, C.; Graichen, P.; Svirepa, A.; Schwarz, J.; Boldt, R.; Schwarz, S.; et al. Removal of Lead, Cadmium, and Aluminum Sulfate from Simulated and Real Water with Native and Oxidized Starches. Polysaccharides 2021, 2, 429–453. [Google Scholar] [CrossRef]
  17. Maniglia, B.C.; Castanha, N.; Le-Bail, P.; Le-Bail, A.; Augusto, P.E.D. Starch Modification through Environmentally Friendly Alternatives: A Review. Crit. Rev. Food Sci. Nutr. 2021, 61, 2482–2505. [Google Scholar] [CrossRef]
  18. Ma, X.; Liu, X.; Anderson, D.P.; Chang, P.R. Modification of Porous Starch for the Adsorption of Heavy Metal Ions from Aqueous Solution. Food Chem. 2015, 181, 133–139. [Google Scholar] [CrossRef]
  19. Langmuir, I. The Constitution and Fundamental Properties of Solids and Liquids. Part II.-Liquids. J. Franklin Inst. 1917, 184, 721. [Google Scholar] [CrossRef]
  20. Sips, R. On the Structure of a Catalyst Surface. J. Chem. Phys. 1948, 16, 490–495. [Google Scholar] [CrossRef]
  21. Papageorgiou, S.K.; Katsaros, F.K.; Kouvelos, E.P.; Kanellopoulos, N.K. Prediction of Binary Adsorption Isotherms of Cu2+, Cd2+ and Pb2+ on Calcium Alginate Beads from Single Adsorption Data. J. Hazard. Mater. 2009, 162, 1347–1354. [Google Scholar] [CrossRef]
  22. Dubinin, M. The Equation of the Characteristic Curve of Activated Charcoal. Proc. USSR Acad. Sci. 1947, 55, 327–329. [Google Scholar]
  23. Foo, K.Y.; Hameed, B.H. Insights into the Modeling of Adsorption Isotherm Systems. Chem. Eng. J. 2010, 156, 2–10. [Google Scholar] [CrossRef]
  24. Zhou, X. Correction to the Calculation of Polanyi Potential from Dubinnin-Rudushkevich Equation. J. Hazard. Mater. 2020, 384, 121101. [Google Scholar] [CrossRef]
  25. Liu, Y. Is the Free Energy Change of Adsorption Correctly Calculated? J. Chem. Eng. Data 2009, 54, 1981–1985. [Google Scholar] [CrossRef]
  26. Al-Ghouti, M.A.; Da’ana, D.A. Guidelines for the Use and Interpretation of Adsorption Isotherm Models: A Review. J. Hazard. Mater. 2020, 393, 122383. [Google Scholar] [CrossRef]
  27. Mittal, A.; Ahmad, R.; Hasan, I. Biosorption of Pb2+, Ni2+ and Cu2+ Ions from Aqueous Solutions by L-Cystein-Modified Montmorillonite-Immobilized Alginate Nanocomposite. Desalin. Water Treat. 2016, 57, 17790–17807. [Google Scholar] [CrossRef]
  28. LoPachin, R.M.; Gavin, T.; DeCaprio, A.; Barber, D.S. Application of the Hard and Soft, Acids and Bases (HSAB) Theory to Toxicant—Target Interactions. Chem. Res. Toxicol 2012, 25, 239–251. [Google Scholar] [CrossRef]
  29. Jones, M.M.; Vaughn, W.K. HSAB Theory and Acute Metal Ion Toxicity and Detoxification Processes. J. Inorg. Nucl. Chem. 1978, 40, 2081–2088. [Google Scholar] [CrossRef]
  30. Persson, I. Hydrated Metal Ions in Aqueous Solution: How Regular Are Their Structures? Pure Appl. Chem. 2010, 82, 1901–1917. [Google Scholar] [CrossRef]
  31. Nethaji, S.; Sivasamy, A.; Mandal, A.B. Adsorption Isotherms, Kinetics and Mechanism for the Adsorption of Cationic and Anionic Dyes onto Carbonaceous Particles Prepared from Juglans Regia Shell Biomass. Int. J. Environ. Sci. Technol. 2013, 10, 231–242. [Google Scholar] [CrossRef]
  32. Keren, Y.; Borisover, M.; Bukhanovsky, N. Sorption Interactions of Organic Compounds with Soils Affected by Agricultural Olive Mill Wastewater. Chemosphere 2015, 138, 462–468. [Google Scholar] [CrossRef]
  33. Hartman, P.; Chan, H.K. Application of the Periodic Bond Chain (PBC) Theory and Attachment Energy Consideration to Derive the Crystal Morphology of Hexamethylmelamine. Pharm. Res. 1993, 10, 1052–1058. [Google Scholar] [CrossRef]
  34. Singh, A.K.; Goel, T.C.; Mendiratta, R.G. Effect of Cation Distribution on the Properties of Mn0.2ZnxNi0.8-XFe2O4. Solid State Commun. 2003, 125, 121–125. [Google Scholar] [CrossRef]
  35. Andreas, S. Einsatz von Cellulose- Und Stärkehaltigen Naturstoffen Zur Abwasserreinigung. Ph.D. Thesis, Technischen Universität Bergakademie Freiberg, Freiberg, Germany, 2005. [Google Scholar]
  36. Weißpflog, J.; Gündel, A.; Vehlow, D.; Steinbach, C.; Müller, M.; Boldt, R.; Schwarz, S.; Schwarz, D. Solubility and Selectivity Effects of the Anion on the Adsorption of Different Heavy Metal Ions onto Chitosan. Molecules 2020, 25, 2482. [Google Scholar] [CrossRef]
Figure 1. The streaming potential of starches as a function of pH in the pH range of 3 to 9 on native potato starch (blue), native corn starch (red), oxidized potato starch (light blue), and oxidized corn starch (pink). These data were reported recently by our author team [16].
Polysaccharides 03 00033 g001
Figure 2. SEM images of (a) native potato starch; (b) native corn starch; (c) oxidized potato starch; and (d) oxidized corn starch.
Polysaccharides 03 00033 g002
Figure 3. Preliminary sorption experiments of the heavy metal ions Ni2+, Fe2+/3+, Mn2+. (a) Sorption of Ni2+ from NiSO4 with low concentration of Ni2+ 0.2 mg/L, medium concentration 2 mg/L and high concentration 20 mg/L. (b) Sorption of Fe2+/3+ from FeSO4 with low concentration of Fe2+/3+ 2 mg/L, medium concentration 20 mg/L, and high concentration 200 mg/L (c) Mn2+ from MnSO4 with low concentration of Mn2+ 0.5 mg/L, medium concentration 5 mg/L, and high concentration 50 mg/L. The pH of this experiment fluctuates between 7.2 and 4.5. The initial and equilibrium pH values of these experiments were ranging from 7.0 and 5.0. The pH diagrams of the experiments are presented in Figures S1–S3.
Polysaccharides 03 00033 g003
Figure 4. Effect of time on the percentage adsorption of Fe2+/3+ from FeSO4 with an initial concentration of Fe2+ ions of 10 mg/L on native potato starch (blue), native corn starch (red), oxidized potato starch (light blue) and oxidized corn starch (pink). The percentage adsorption of SO42− from FeSO4 is presented in Figure S4 in SI.
Polysaccharides 03 00033 g004
Figure 5. Adsorption isotherms for Ni2+ from NiSO4 solution and the respective Sips isotherm model fits. The Langmuir and the Dubinin–Radushkevich fitting are presented in Figure S7. N. potato starch is shown in blue, n. corn starch in red, o. corn starch in pink and o. potato starch in light blue.
Polysaccharides 03 00033 g005
Figure 6. Adsorption isotherms capacity for Fe2+/3+ from FeSO4 solution and the respective Langmuir isotherm model fits. The Langmuir and the Dubinin–Radushkevich fitting models were presented in Figure S11. With n. potato starch is shown in blue, n. corn starch in red, o. corn starch in pink and o. potato starch in light blue.
Polysaccharides 03 00033 g006
Figure 7. Adsorption isotherms capacity for Mn2+ from MnSO4 solution presents the Sips isotherm model fits, the Langmuir and the Dubinin–Radushkevich fitting models were presented in Figure S16. With n. potato starch is shown in blue, n. corn starch in red, o. corn starch in pink, and o. potato starch in light blue.
Polysaccharides 03 00033 g007
Figure 8. Adsorption of Fe2+ from FeSO4 solution with (connected by solid line) and without swelling (connected with dashed line) on (a) native potato starch (blue); (b) native corn starch (red); (c) oxidized potato starch (light blue); and (d) oxidized corn starch (pink).
Polysaccharides 03 00033 g008aPolysaccharides 03 00033 g008b
Figure 9. Formation of the hydrate shell because of swelling of the starch in water.
Polysaccharides 03 00033 g009
Table 1. Heavy metal ion limit values in drinking water according to the German drinking water ordinance (TrinkwV) [11] and WHO [8].
Heavy Metal IonsTrinkwV (German Organisation) mg/LWHO (World Health Organization)
mg/L
Ni2+0.020.07
Fe2+0.20.3
Mn2+0.050.4
Table 2. Fitting parameters for the adsorption of Ni2+ from NiSO4 solution onto n. potato starch, o. potato starch and o. corn starch for Langmuir, Sips and Dubinin–Radushkevich isotherm models.
SampleModelQm
µmol/g
K
L/µmol *
ßDR × 10−9 mol2/J2nEads,DR
KJ/mol
R2 (COD)ΔG°
kJ/mol
Native potato starchLangmuir11.94 ± 0.880.20 ± 0.12---- 0.847−30.3
Sips13.56 ± 3.200.34 ± 0.18--0.52 ± 0.32--0.865--
Dubinin–Radushkevich19.67 ± 3.39--1.29 ± 0.36--19.62 ± 2.740.853--
Oxidized potato starch.Langmuir114.17 ± 2.430.59 ± 0.11------0.988−33.0
Sips117.50754 ± 2.62390.57 ± 0.07--0.76 ± 0.07--0.993--
Dubinin–Radushkevich199.07 ± 21.40--1.36 ± 0.21--19.15 ± 1.440.930--
Oxidized corn starchLangmuir101.24 ± 3.330.57 ± 0.16------0.975−32.9
Sips106.68 ± 4.760.46 ± 0.10--0.69 ± 0.11--0.982--
Dubinin–Radushkevich184.99 ± 20.31--1.50 ± 0.22--18.25 ± 1.340.930--
* Unit for KL is L/µmol and for KS (L/µmol)n.
Table 3. Fitting parameters for the adsorption of Fe2+ from FeSO4 solution onto n. potato starch, o. potato starch, and o. corn starch for Langmuir and Dubinin–Radushkevich isotherm models.
SampleModelQm
µmol/g
K
L/µmol
ßDR × 10−9
mol2/J2
Eads.DR
KJ/mol
R2 (COD)ΔG°
kJ/mol
Native potato starchLangmuir10.27 ± 0.900.32 ± 0.15----0.862−31.5
Dubinin–Radushkevich17.72 ± 5.39--1.39 ± 0.218.95 ± 3.570.644--
Oxidized potato starchLangmuir87.00 ± 9.130.04 ± 0.01----0.923−26.3
Dubinin–Radushkevich304.28 ± 113.80--3.22 ± 0.712.44 ± 1.420.836--
Oxidized corn starchLangmuir65.74 ± 6.370.14 ± 0.05----0.909−29.4
Dubinin–Radushkevich159.50 ± 49.04--2.20 ±0.515.07 ± 1.910.804--
Table 4. Fitting parameters for the adsorption of Mn2+ from MnSO4 solution onto n. potato starch, o. potato starch and o. corn starch for Langmuir, Sips and Dubinin–Radushkevich isotherm models.
SampleModelQm
µmol/g
K
L/µmol *
ßDR × 10−9 mol2/J2nEads.DR
KJ/mol
R2
(COD)
ΔG°
kJ/mol
Native potato starchLangmuir10.97 ± 0.51.5 ± 0.5------0.727−31.5
Sips11.66 ± 1.20.9 ± 0.5--0.5 ± 0.3--0.972--
Dubinin–Radushkevich15.39 ± 1.8--0.8 ± 0.2--24.5 ± 3.50.672--
Oxidized potato starchLangmuir82.9 ± 1.50.23 ± 0.03------0.989−26.3
Sips84.0 ± 2.00.2 ± 0.04--0.9 ± 0.1--0.990--
Dubinin–Radushkevich155.3 ± 17.8--0.1 ± 0.02--17.6 ± 1.30.922--
Oxidized corn starchLangmuir64.5 ± 1.51.5 ± 0.34------0.979−29.4
Sips68.97 ± 2.007 ± 0.1--0.6 ± 0.1--0.990--
Dubinin–Radushkevich106.6 ± 8.5--0.2 ± 1.6--20.4 ± 1.30.944--
* Unit for KL is L/µmol and for KS (L/µmol)n.
Publisher’s Note: MDPI stays neutral with regard to jurisdictional claims in published maps and institutional affiliations.

