1. Introduction
Maranta arundinacea (L.) (arrowroot) is a South American tropical crop with starch valued in the international market for its quality for application in fine confectionary. The literature shows that this starch produces a paste of greater lightness and digestibility, than more common starch sources such as cassava, and can compete with commercial modified starches [
1,
2].
Arrowroot has been widely cultivated in Brazil, but has lost ground in the last 50 years, reaching near extinction. Thus, other starches produced from different raw materials at the industrial level, such as cassava and corn, have gradually replaced arrowroot, although they do not present the same characteristics when compared to those produced from arrowroot, such as easy digestibility and gelatinization capacity [
2].
However, the scarcity of arrowroot starch on the market implies a price increase and favors the occurrence of fraud through substitution with cheaper sources, such as commercial cassava or potato starches. The major challenges in identifying this fraud are the impossibility of visual discernment and the usual inconclusive analytical approaches [
3].
Food fraud is a growing problem in the food industry, compromising the credibility of the business and, in the worst cases, the health of the consumer. These fraudulent products, when used as ingredients, produce different results from those expected for the original counterpart. This can be exemplified with tuberous starches from different vegetal sources. Due to the physical and sensory similarities, fraud in the form of substitution or counterfeiting in these products is hardly noticed by consumers.
The major composition of cassava and arrowroot products are starches, which intrinsic macro structural arrangement, leads to granules of different sizes and shapes. Other typical compounds, can be also explored for differentiation, such as amylose and amylopectin [
4]. Sanitary inspection and quality control are mainly responsible for identifying these frauds, however, new analytical approaches to evaluate the differences between similar products, such as arrowroot and cassava, are constantly in demand [
5,
6].
Techniques such as spectroscopic approaches combined with chemometric techniques and microscopic analysis are commonly used to identify pure starches or quantify intentionally blended starches. However, operational costs and the need for trained professionals are drawbacks to overcome [
7,
8]. Thus, the continued development of new techniques associated with chemometrics would broaden knowledge by expanding the possibilities of identifying fraud in starches. Among the promising techniques, Raman Spectroscopy allows the chemical identification of minor compounds and also the macro structural characterization of different polymorphs. Chemometric approaches, such as principal component analysis and K-means clustering, can explore and assist in the observation correlated patterns with specific samples within a group [
9].
In this sense, the objective of this study was to evaluate the differences between arrowroot and cassava starches using Raman associated with principal component analysis and K-means clustering as an alternative for the identification of fraud in starches.
2. Materials and Methods
Starch was extracted in the laboratory from 67 cassava and 5 arrowroot samples, compared to 21 cassava and 5 arrowroot samples purchased from local businesses. The samples were coded as C for cassava and A for arrowroot, as presented in
Table 1.
Raman assays were performed in sextuplicate (n = 6) with a resolution of 16–18 cm−1 on the Mira M-1 spectrometer (Metrohm, São Paulo, SP, Brazil). The spectral range was 400–2300 cm−1, laser power of 100 mW and laser wavelength of 785.0 nm resulting in 1901 variables. Raman assays were performed for 88 cassava samples and 10 arrowroot samples (n = 98).
Raman specters were treated with a first-derivative Savitzky-Golay filter with a 2nd-degree polynomial and 21-point window. The dataset was further treated with the standard normal variate filter [
9].
Rstudio IDE [
10] for Rstudio 3.6.1 and R packages prospectr [
11], mdatools [
12], chemometrics [
13] and ggplot2 [
14] were used.
PCA was calculated through singular value decomposition. K-means clustering method was performed with the Hartigan and Wong algorithm [
15]. The K-means was calculated with the first three principal components of PCA.
3. Results
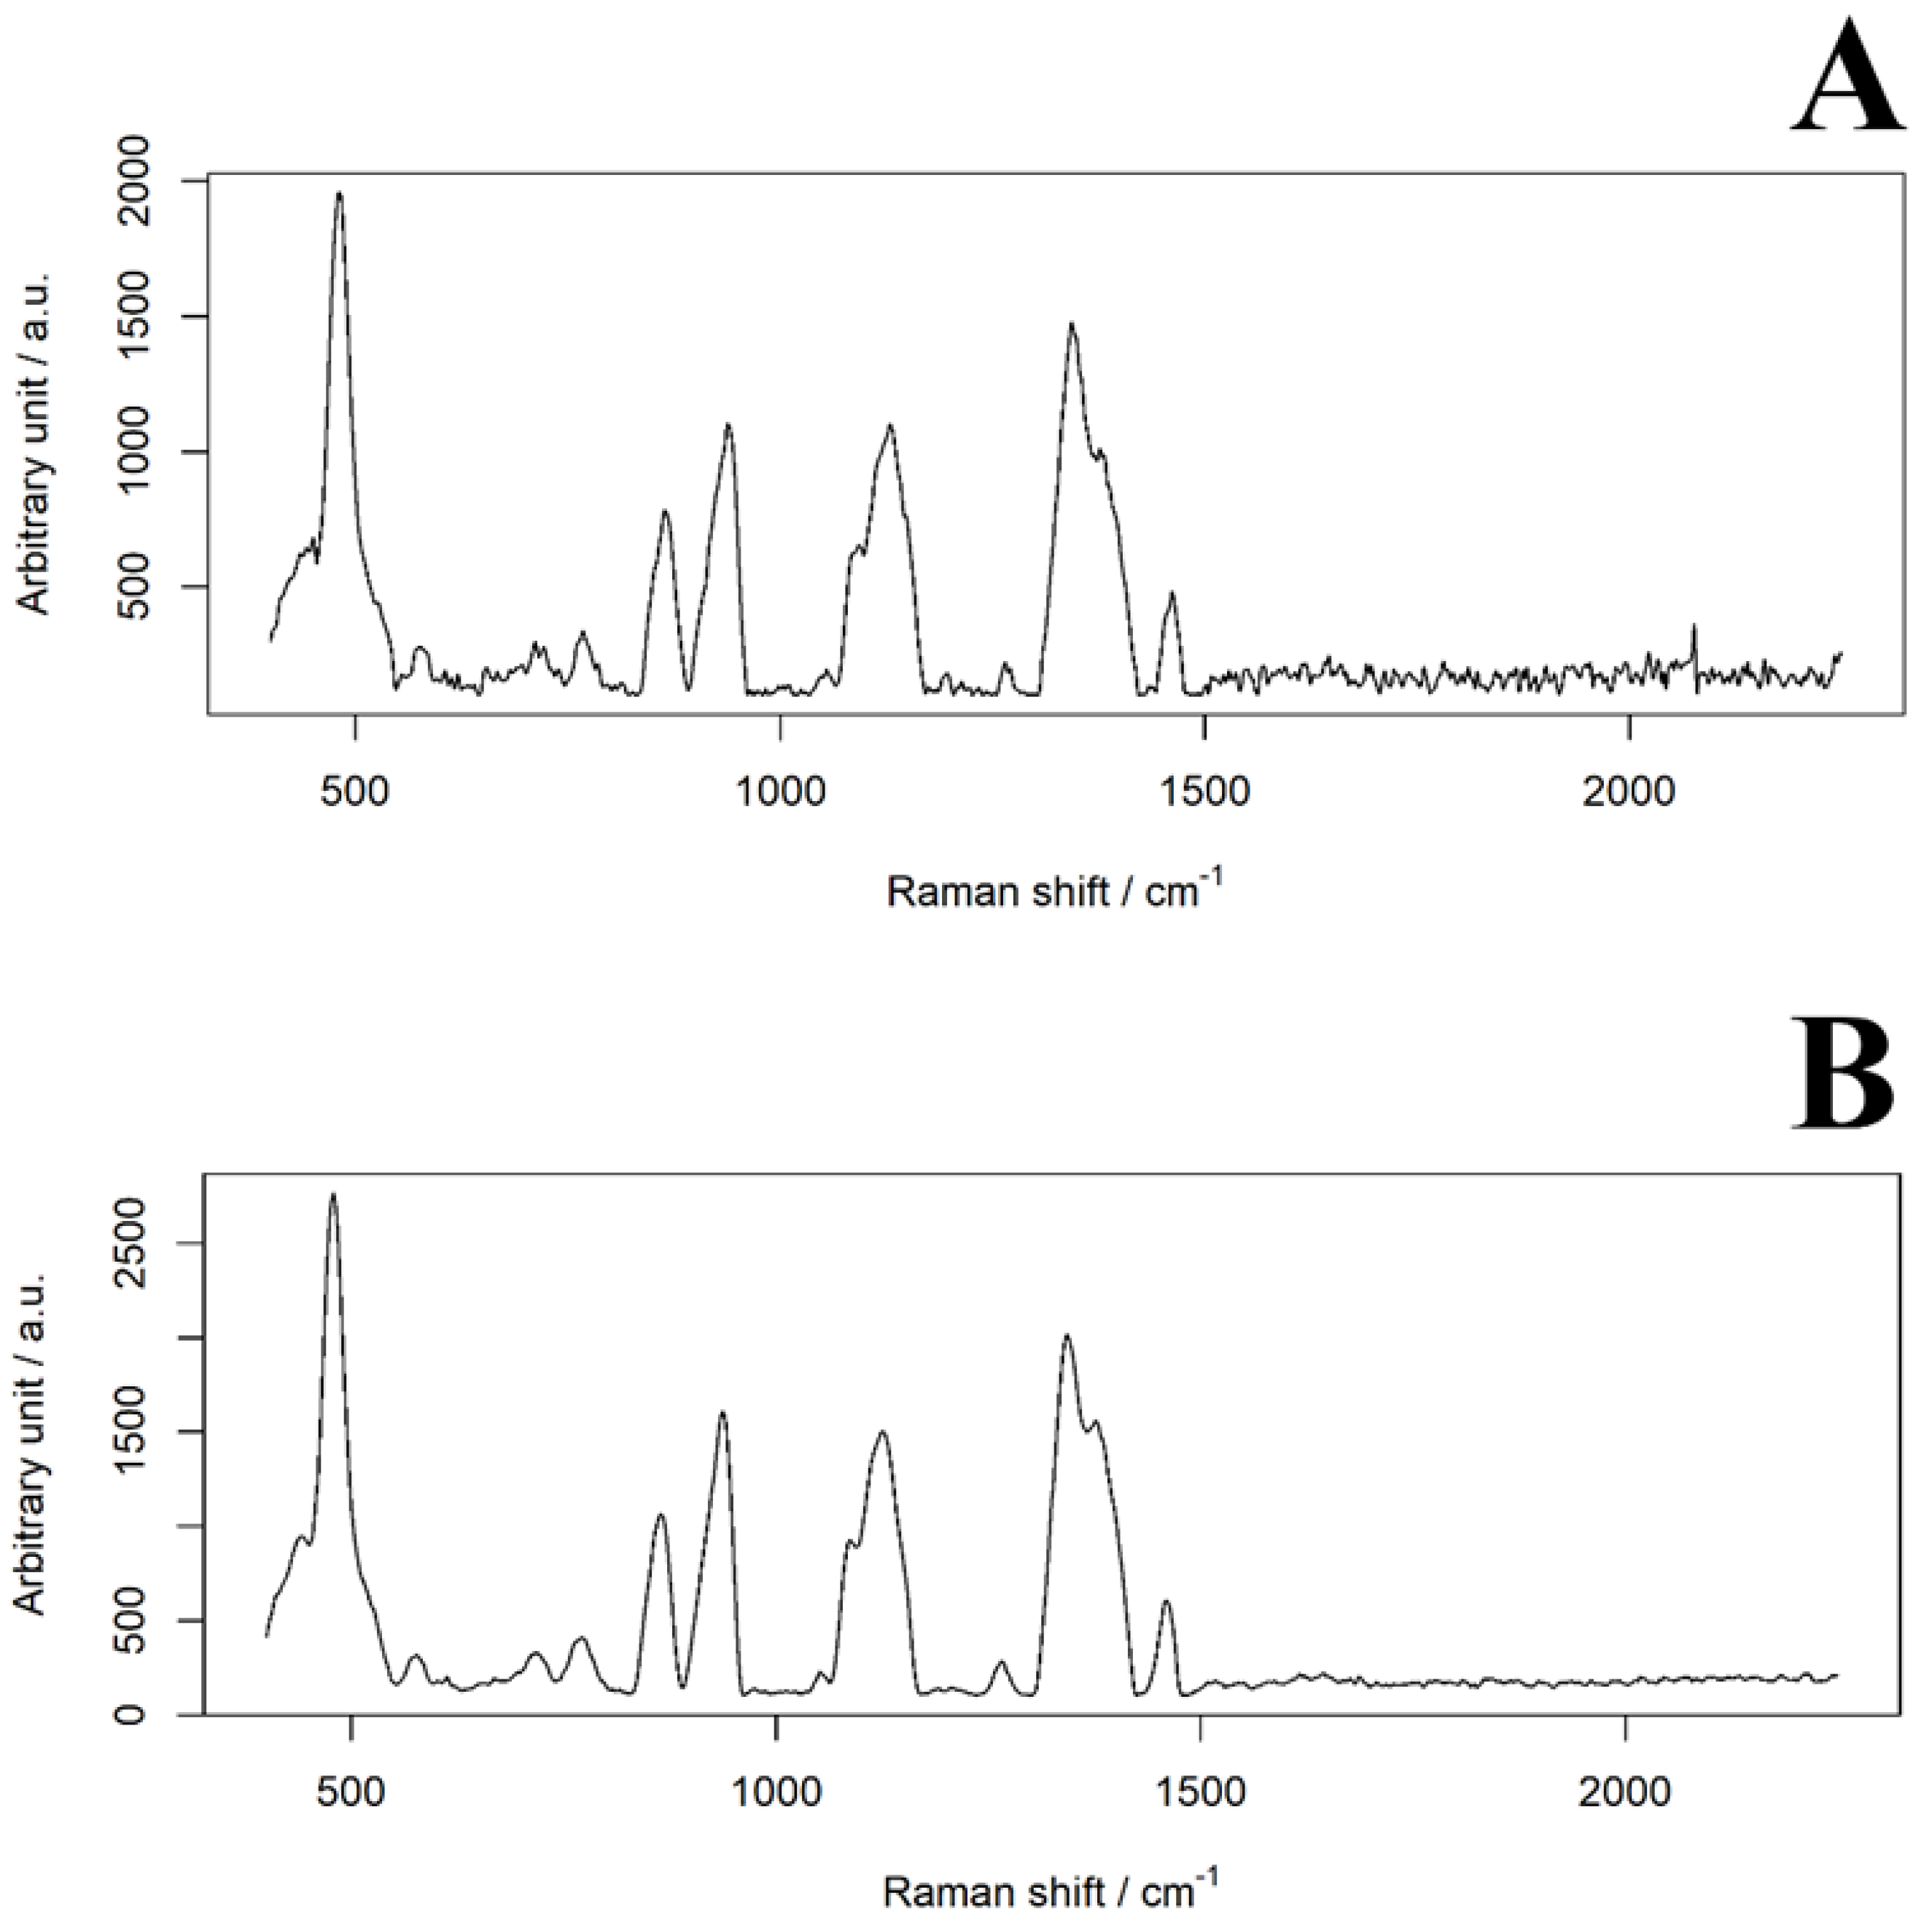
To evaluate the visual similarities between the cassava and arrowroot spectra, Raman assays were performed. The average of the spectra is shown in
Figure 1.
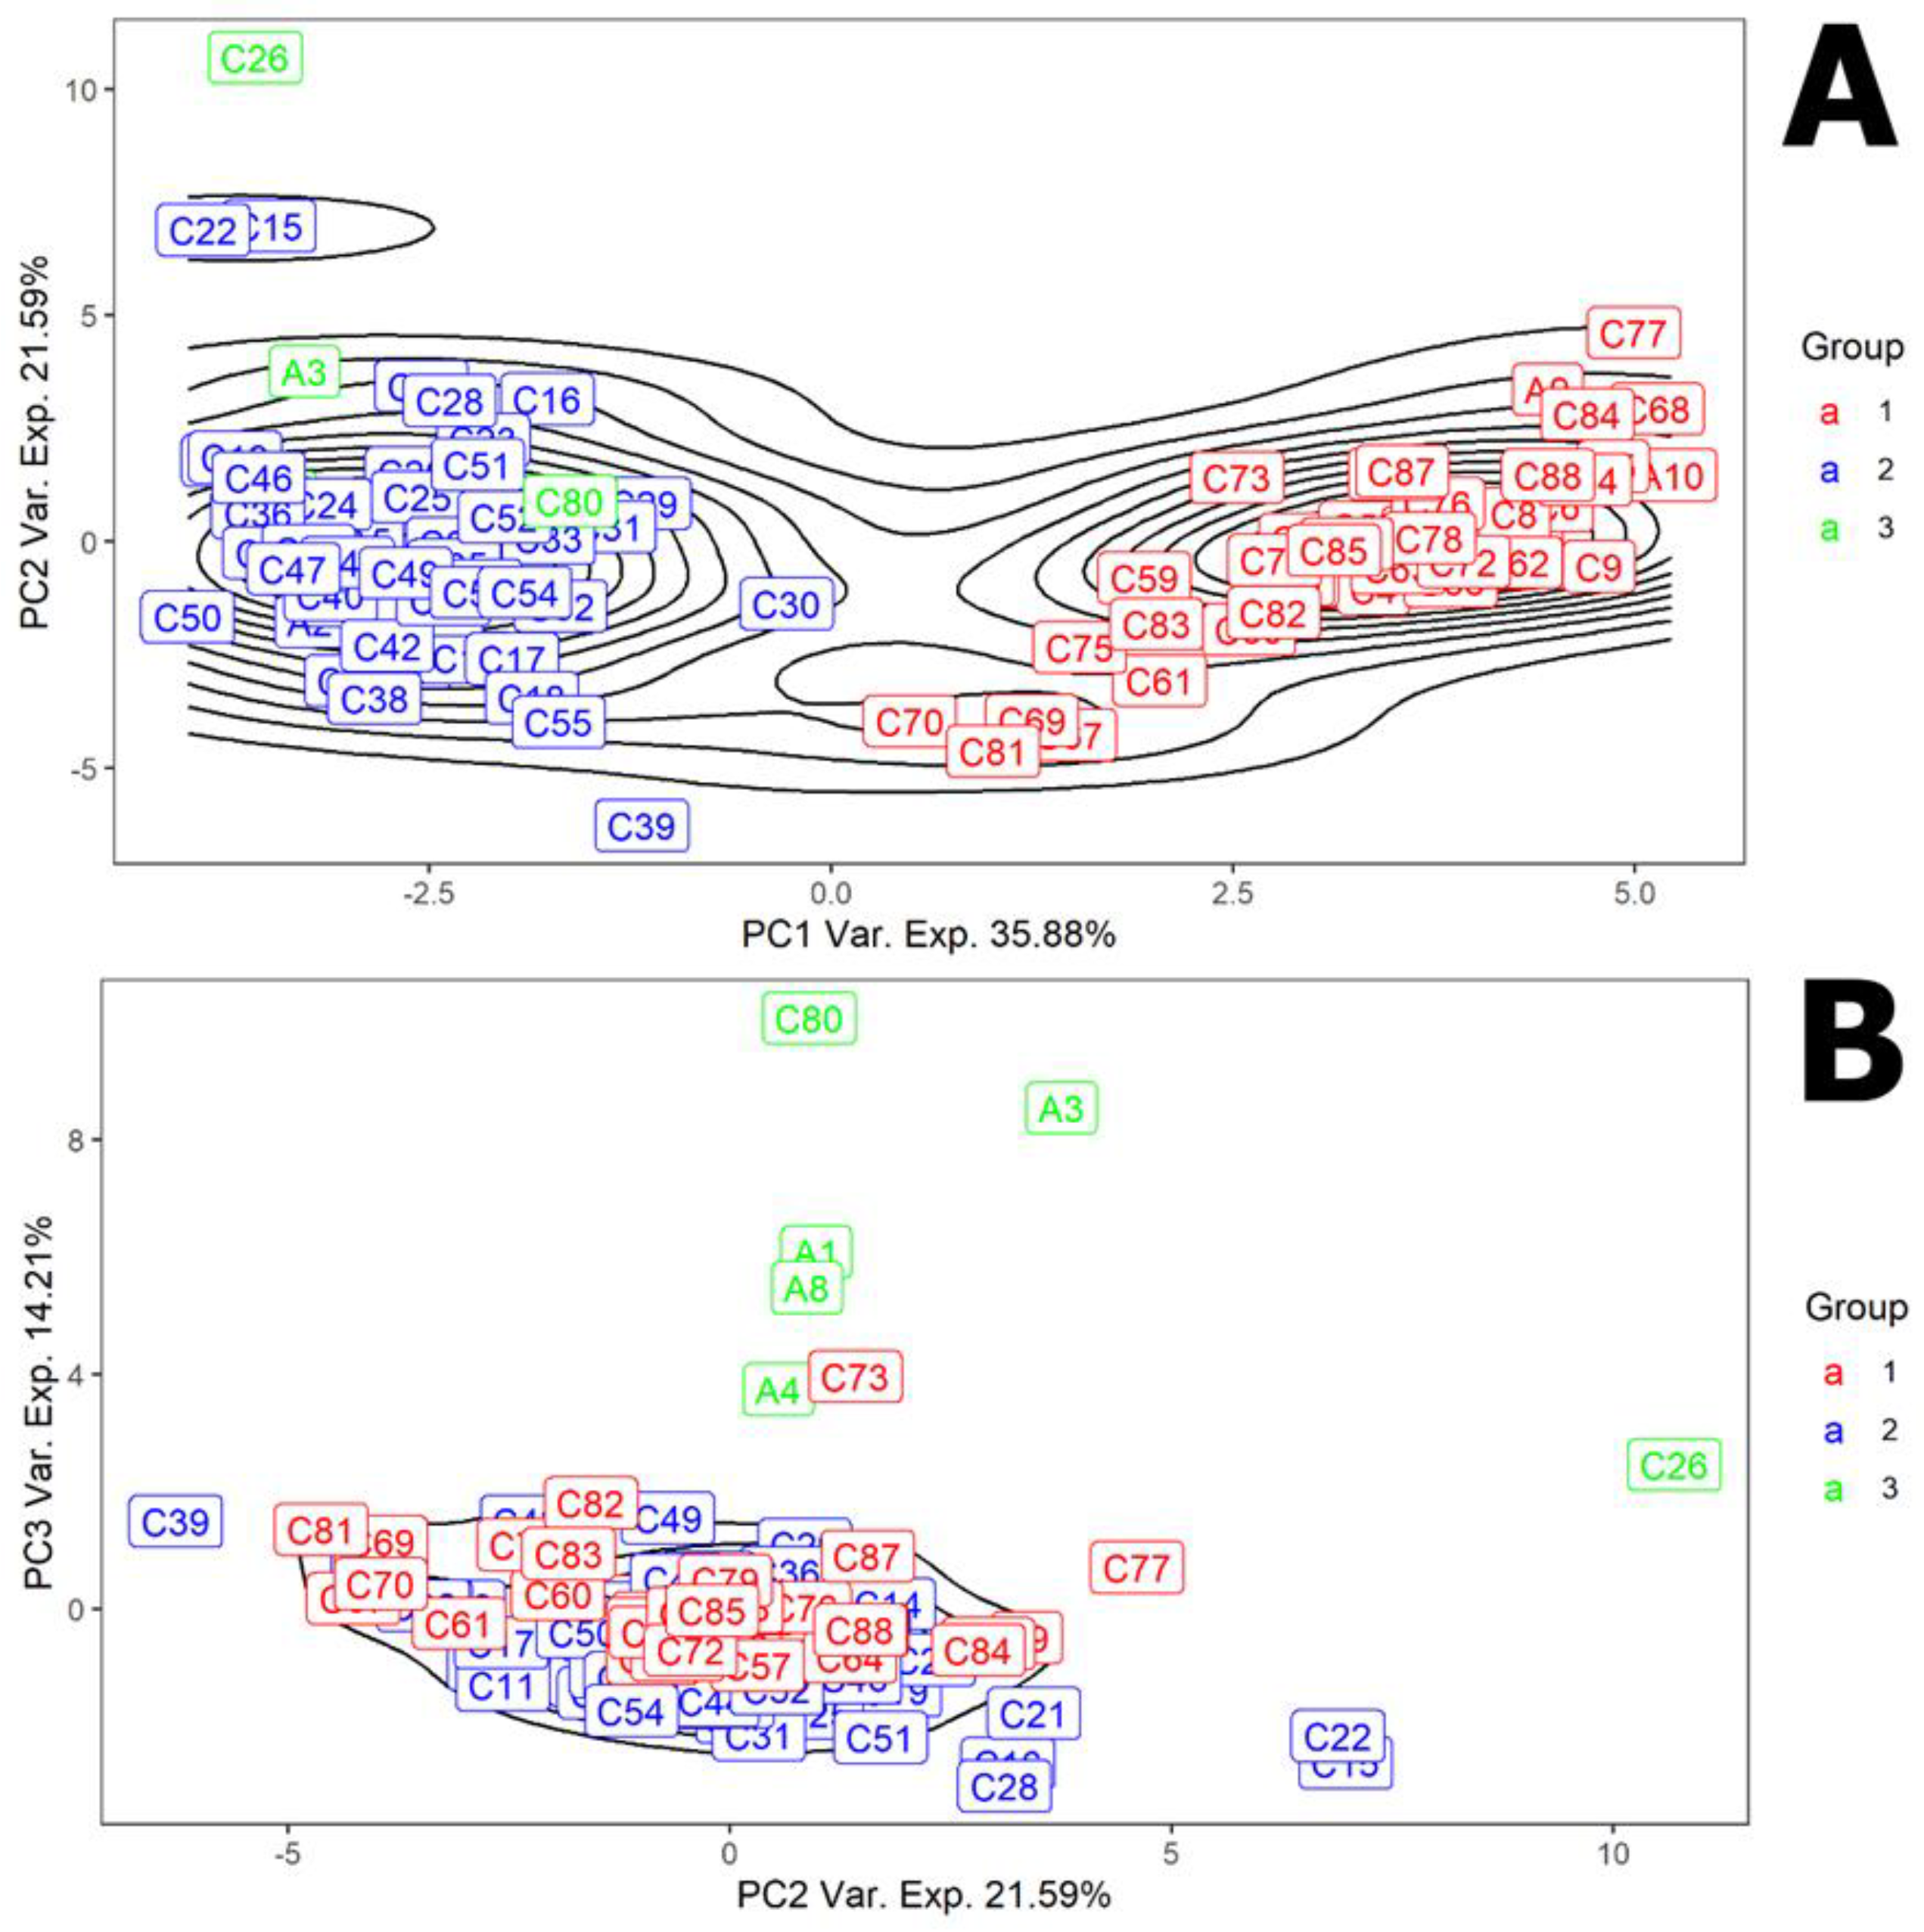
Arrowroot showed great similarities with the cassava spectra. Thus, in order to explore the possibility of differentiation between cassava and arrowroot, a principal component analysis with K-means was performed (
Figure 2).
4. Discussion
In Raman analysis (
Figure 1), both spectra showed peaks in the regions between 600–1500 cm
−1 which are linked to the C-C bond vibrations [
16], which, probably derives from the high great starch content within both samples. Arrowroot showed great similarities to the spectra of cassava. From visual inspection of the product or differentiation of the specters, both products could not be distinguished from each other.
The standard deviation of mean arrowroot specter and cassava mean specter was very similar, being 316.38 and 467.23 (Arbitrary intensity units, as displayed in the specters of
Figure 1), respectively. Likewise, the difference and division mean of cassava/arrowroot was 88.07 and 1.18, respectively.
Raman spectroscopy can be used, along with infrared analysis, to differentiate saccharide types such as monosaccharide (i.e., glucose), oligosaccharide and polysaccharides reference substances. However, complex samples such as powdered tubers and herbs, pose a greater challenge regarding differentiation, due to the presence of many substances, along with fiber and matrices that may hinder analytical signals [
17].
Therefore, in order to determine these differences, a principal component analysis with K-means was performed (
Figure 2).
The data density in the first three PC in PCA, showed that the data set was clustered into two large groups and a smaller scattered data group. Therefore, in order to separate the data into the likely groups of arrowroot, cassava and mixed products, a K-means for 3 clusters was performed. From the cassava dataset, 41 samples were assigned in group 1, 45 samples were assigned in group 2 and only 2 samples were assigned in group 3. Moreover, from the arrowroot samples, 2 were assigned to group 1 (A9 and A10), 4 were assigned to group 2 (A2, A5, A6 and A7) and 4 were assigned to group 3 (A1, A3, A4 and A8).
Group 3 seems to be related to arrowroot starch, since it grouped more samples from this botanical source, although two cassava starch samples were assigned to this group as well. Group 1 had a higher proportion of cassava starch samples. From this, group 2 may be related to mixed products, in which there is presence of both cassava and arrowroot starches.
Commercial sample A8 can be considered as pure arrowroot product, while commercial samples A6 to A10 (except A8) are most likely adulterated products.
Moreover, the laboratory extracted cassava products, i.e., C1–C67, were assigned 68.66% in group 2 and the commercial cassava products, i.e., C68–C88, 95.24% of the samples were assigned to group 1 (
Table S1). Therefore, it can be inferred that the two large clusters observed in
Figure 2A are relative to the separation between commercial cassava and laboratory extracted products.
5. Conclusions
The similarities between the spectroscopic profiles of cassava and arrowroot, makes their differentiation difficult by visual analysis. Due to the high similarity between the Raman spectra of arrowroot and cassava, the observed separation was likely derived from the content of components, namely starch. However, exploratory data analysis with k-means was able to elucidate the pattern differences in the Raman spectrum and differentiate pure arrowroot and likely adulterated arrow products. The model was able to separate between laboratory extracted and commercial products.
Author Contributions
Conceptualization, M.P.C. and I.Y.L.d.M.; methodology, M.P.C., C.D.B., M.F.d.C., E.d.S.G. and I.Y.L.d.M.; software, I.Y.L.d.M.; validation, I.Y.L.d.M.; data curation, I.Y.L.d.M.; writing—original draft preparation, I.Y.L.d.M.; writing—review and editing, M.P.C., C.D.B., E.d.S.G., M.F.d.C., I.Y.L.d.M. and J.F.S.S.J.; visualization, M.P.C., C.D.B., E.d.S.G. and J.F.S.S.J.; supervision, M.P.C. and I.Y.L.d.M.; project administration, M.P.C. and I.Y.L.d.M. All authors have read and agreed to the published version of the manuscript.
Funding
This research received no external funding.
Institutional Review Board Statement
Not applicable.
Informed Consent Statement
Not applicable.
Data Availability Statement
Not applicable.
Acknowledgments
CAPES for the academic support.
Conflicts of Interest
The authors declare no conflict of interest.
References
- Cunha, A.L. Caracterização do amido da araruta tipos seta e redonda, visando utilização na indústria de alimentos. Univ. Fed. Lavras 2016, 1, 1–112. [Google Scholar]
- Amante, P.R.; Santos, E.C.Z.; Correia, V.T.D.V.; Fante, C.A. Research Notes: Benefits and Possible Food Applications of Arrowroot (Maranta arundinaceae L.). J. Culin. Sci. Technol. 2020, 1, 1–9. [Google Scholar] [CrossRef]
- de Oliveira Guilherme, D.; Branco, F.P.; Madeira, N.R.; Brito, V.H.; de Oliveira, C.E.; Jadoski, C.J.; Cereda, M.P. Starch valorization from corms, tubers, rhizomes and roots crops: The arrowroot (Maranta arundinacea L.) case. In Starches for Food Application; Elsevier—Academic Press: Cambridge, MA, USA, 2018. [Google Scholar]
- Khamsopha, D.; Woranitta, S.; Teerachaichayut, S. Utilizing near infrared hyperspectral imaging for quantitatively predicting adulteration in tapioca starch. Food Control. 2021, 123, 107781. [Google Scholar] [CrossRef]
- Cardoso, V.G.K.; Poppi, R.J. Cleaner and faster method to detect adulteration in cassava starch using Raman spectroscopy and one-class support vector machine. Food Control. 2021, 125, 107917. [Google Scholar] [CrossRef]
- Charles, A.L.; Cato, K.; Huang, T.-C.; Chang, Y.-H.; Ciou, J.-Y.; Chang, J.-S.; Lin, H.-H. Functional properties of arrowroot starch in cassava and sweet potato composite starches. Food Hydrocoll. 2016, 53, 187–191. [Google Scholar] [CrossRef]
- Liu, J.; Wen, Y.; Dong, N.; Lai, C.; Zhao, G. Authentication of lotus root powder adulterated with potato starch and/or sweet potato starch using Fourier transform mid-infrared spectroscopy. Food Chem. 2013, 141, 3103–3109. [Google Scholar] [CrossRef] [PubMed]
- Sheehab, A.; Rasmussen, H.; Ceglia, L. A Case of Arrowroot Starch Adulteration: Importance of Independent Testing of Dietary Supplements in Clinical Nutrition Research. Curr. Dev. Nutr. 2021, 5, 862. [Google Scholar] [CrossRef]
- de Macêdo, I.Y.L.; Machado, F.B.; Ramos, G.S.; Costa, A.G.D.C.; Batista, R.D.; Filho, A.R.G.; Asquieri, E.R.; de Souza, A.R.; de Oliveira, A.E.; Gil, E.D.S. Starch adulteration in turmeric samples through multivariate analysis with infrared spectroscopy. Food Chem. 2021, 340, 127899. [Google Scholar] [CrossRef] [PubMed]
- R, Version 4.0.3, 1st ed.; Publisher: R Studio, Place of Publication, 2019; Available online: https://www.rstudio.com/ (accessed on 14 September 2021).
- Prospectr Package, Version 0.2.1, 1st ed.; Publisher: R Studio, Place of Publication, 2013; Available online: https://www.rstudio.com/products/rpackages/ (accessed on 14 September 2021).
- Mdatools Packages, Version 0.11.3, 1st ed.; Publisher: R Studio, Place of Publication, 2020; Available online: https://www.rstudio.com/products/rpackages/ (accessed on 14 September 2021).
- Filzmoser, P.; Kurt, V. Chemometrics: Multivariate Statistical Analysis in Chemometrics; CRC Press: Boca Raton, FL, USA, 2017. [Google Scholar]
- Wickham, H. ggplot2: Elegant Graphics for Data Analysis; Springer: New York, NY, USA, 2016. [Google Scholar]
- Hartigan, J.A.; Wong, M.A. Algorithm AS 136: A K-Means Clustering Algorithm. J. R. Stat. Soc. Ser. C 1979, 28, 100. [Google Scholar] [CrossRef]
- Borgsmiller, K.L.; O’Connell, D.J.; Klauenberg, K.M.; Wilson, P.M.; Stromberg, C.J. Infrared and Raman Spectroscopy: A Discovery-Based Activity for the General Chemistry Curriculum. J. Chem. Educ. 2012, 89, 365–369. [Google Scholar] [CrossRef]
- Jin, L.; Wang, S.; Cheng, Y. A Raman spectroscopy analysis method for rapidly determining saccharides and its application to monitoring the extraction process of Wenxin granule manufacturing procedure. Spectrochim. Acta Part A Mol. Biomol. Spectrosc. 2020, 241, 118603. [Google Scholar] [CrossRef] [PubMed]
| Publisher’s Note: MDPI stays neutral with regard to jurisdictional claims in published maps and institutional affiliations. |
© 2021 by the authors. Licensee MDPI, Basel, Switzerland. This article is an open access article distributed under the terms and conditions of the Creative Commons Attribution (CC BY) license (https://creativecommons.org/licenses/by/4.0/).


 ,
, 

