Article

Surface Characterization of Powdered Cellulose Activated by Potassium Hydroxide in Dry Condition Through Ball Milling

by
Mohammadali Azadfar
1,2,* and
Michael P. Wolcott
1
1
Composite Materials and Engineering Center, Voiland College of Engineering and Architecture, Washington State University, P.O. Box 645815, Pullman, WA 99164-5815, USA
2
Division of Environmental & Renewable Resources, College of Agriculture and Technology, State University of New York, P.O. Box 901, Morrisville, NY 13408, USA
*
Author to whom correspondence should be addressed.
Polysaccharides 2020, 1(1), 80-89; https://doi.org/10.3390/polysaccharides1010006
Submission received: 11 October 2020 / Revised: 13 November 2020 / Accepted: 20 November 2020 / Published: 25 November 2020

Abstract

:
The surface chemical compositions of powdered cellulose have been characterized utilizing X-ray photoelectron spectroscopy (XPS) and attenuated total reflectance-Fourier transform infrared spectroscopy (ATR-FTIR) techniques. Powdered cellulose was prepared by milling of bleached softwood pulp residues through a lab-scale planetary ball mill. Here we show how milling a mixture of the powdered cellulose with potassium hydroxide determines the surface chemical compositions of the obtained powdered cellulose, in a completely dry condition. The XPS analysis indicated the presence of new carbon and oxygen atoms as C4, C5, and O3. In turn, the FTIR analysis showed the stretching vibrations of the carbon–carbon double bond. The results suggest the formation of active oxygenated species on powdered cellulose surfaces.

1. Introduction

The activation of reducing sugars in aqueous solution containing a base catalyst has been studied by carbohydrates chemists substantially to show that reducing sugars may yield complex mixtures of products which arise from a series of mutarotation, enolization, fragmentation, and benzylic acid-type reactions [1]. Mutarotation is the conversion of one anomeric form of a sugar (α or β) to another one (Scheme 1a). It requires the formation of a free aldehyde in two anomeric forms (α and β) in a sugar [2]. This phenomenon has been studied so far mainly in solution [3,4,5,6,7,8,9]. There is no mutarotation in the crystalline form of glucose and it is dependent on the physical state [10]. This is due to the fact that hydrogen atoms of both glucose anomeric forms implied in the mutarotation process are involved in hydrogen bonds and this prevents the mutarotation from occurring in the crystalline state [11]. To date, however, very few investigations have been performed in the dry state. It has been recently shown that the amorphization of glucose by milling leads to the formation of anomerically pure amorphous compounds [12,13]. This solid-state route to the amorphous state was found to be free of mutarotation, contrary to the usual quenching of the liquid which provides unavoidably a mixture of two monomers [14,15]. Milling methods such as ball milling are the typical mechanical techniques which have been studied for a long time to address important hurdles in cellulosic materials processing [16,17]. Ball milling does not suffer from equipment corrosion and environmental toxicity, making it a great alternative to break the robust crystalline structure of cellulose and decrease its chain length in a sustainable way [18]. The glucose C-1 end has reducing properties, while the glucose end group with a free C-4 hydroxyl group is non-reducing [1]. In cellulose, anomeric carbons (C-1) are tied up in the glycosidic bonds and thus they have no reducing properties. The breakage of cellulose chains during ball milling and mechanical cleavage of glycosidic bonds are correlated to the emergence of free reducing ends in powdered cellulose [19,20].
The activation of a reducing end begins with the formation of an acyclic intermediate by the mutarotation reaction, followed by the formation of an enediol through enolization (Scheme 1b). By the removal of the hydrogen atom on the carbon atom 2 (α-position of a carbonyl group) through enolization, d-glucose forms cis or trans-enediol [21,22]. The deprotonation in α-position (acidic proton) of a carbonyl group induced by treatment with strong alkali is the most important and most frequently applied procedure for the activation of reducing ends through the formation of enolates in solution [23,24]. The efficacy of alkali to abstract the proton atom in dry state has also been explored. In the synthesis of mono-2-tosyl-cyclodextrins in dry condition and at room temperature using a lab-scale ball mill, no reaction happened even after 1.5 h without any base [25]. To tackle the selective C2-OH monotosylation of cyclodextrins, alkali metal hydroxides KOH, NaOH, and LiOH, and to a lesser extent carbonate bases K2CO3, RB2CO3, and Cs2CO3, have been shown to be effective in the monotosylation of cyclodextrins [25]. However, nothing has been described so far on the possibility of the activation of powdered cellulose by alkali in dry condition through ball milling.
In the present work, we characterized the surface chemical compositions of powdered cellulose samples using X-ray photoelectron spectroscopy (XPS) and attenuated total reflectance-Fourier transform infrared spectroscopy (ATR-FTIR) techniques. Powdered cellulose samples were prepared by milling of bleached softwood pulp residues through a lab-scale planetary ball mill. The obtained powdered cellulose samples were then co-milled with potassium hydroxide as an alkali metal hydroxide, in a completely dry environment. XPS and FTIR are among the techniques best suited for studying the surface of lignocellulosic fibers [26]. The knowledge obtained on the surface chemical compositions of powdered cellulose will aid to establish processes to prepare functionalized cellulose for more demanding applications.

2. Materials and Methods

2.1. Materials

Bleached softwood fluff pulp, which is cellulose pulp (CP), was provided by the Weyerhaeuser company (Federal way, WA, USA). Our previous composition analysis also showed negligible lignin in the CP. The CP was stored in ambient conditions. Potassium hydroxide (KOH, ≥85%) was purchased from Sigma-Aldrich (Milwaukee, WI, USA). The chemical was used without further purification.

2.2. Preparation of Powdered Cellulose through Ball Milling

CP pulverization was conducted at ambient pressure and at room temperature using a planetary ball mill (PQ-N04 Gear Drive 4-Station, Across International), equipped with two 100 mL and two 50 mL steel jars. Each 100 mL jar was charged with 100 steel balls (Ø 6mm) and 16 steel balls (Ø 10mm). In addition, 50 mL steel jars were charged with 35 steel balls (Ø 6 mm) and 10 steel balls (Ø 10mm). The CP was weighed and added to each jar at a ball–cellulose charge ratio of 40:1 and subsequently ball milled at 30 min and labeled S2. The milling frequency throughout the experiment was 50 Hz, in single-direction mode and at a rotation speed of 550 rpm. The limited temperature increase resulting from this process was deemed to have a negligible influence on the powdered cellulose [20].

2.3. Co-Milling Powdered Cellulose with Potassium Hydroxide through Ball Milling

Powdered cellulose (S2) was co-milled with potassium hydroxide at room temperature and in dry environment using a planetary ball mill (PQ-N04 Gear Drive 4-Station, Across International) equipped with two 100 mL zirconia jars. Each jar was charged with 10 zirconia balls (Ø 10 mm) and 10 zirconia balls (Ø 6mm). The obtained powdered cellulose (S2) was weighed and added to each jar at a powdered cellulose–potassium hydroxide charge ratio of 5:1 w/w loading and subsequently ball milled at 30 min and labeled S2-1.

2.4. Characterization of Cellulose Powder Samples

After preparing powdered cellulose samples through ball milling, all test samples were characterized using X-ray photoelectron spectroscopy and ATR-FTIR techniques. (13C-NMR analysis, see Supplementary Materials).

2.4.1. X-Ray Photoelectron Spectroscopy (XPS)

The XPS analysis was performed using a Kratos AXIS-165 multi-technique electron spectrometer system (Kratos Analytical Ltd., Manchester, UK), with a base pressure of 8 × 10⁻¹⁰ Torr. Monochromatic X-ray radiation of 1487.6 eV (Al Kα) was utilized as the XPS excitation source for acquiring the XPS photoelectron spectra. Powdered cellulose samples were pressed against 99.99% pure indium flattened shots prior to placing the samples in the vacuum chamber. The powdered cellulose samples were grounded with metal clips to minimize any possible charging effect which was tested by switching the neutralizer on and off. No sample charging was detected. The atomic and deconvoluted peaks were identified by comparing their binding energy with those of the literatures and the National Institute of Standards and Technology (NIST)-XPS database [27].

2.4.2. Attenuated Total Reflectance-Fourier Transform Infrared Spectroscopy (ATR-FTIR)

The FTIR analysis was performed to characterize the functional groups of powdered cellulose samples (S2 and S2-1). The FTIR spectra were obtained using an ATR-FTIR spectrophotometer (Shimadzu, Tokyo, Japan) with 64 scans. The ATR supplement was used to measure the changes in an internally reflected infrared beam, when the beam made contact with a sample with a typical penetration depth between 0.5 µm and approximately 5 µm. Samples were then pressed onto the crystal surface of the ATR probe. Samples were analyzed for wavelengths of 3850 to 650 cm−1 at a resolution of 4 cm−1 [28].

3. Results and Discussion

3.1. XPS Analysis

The XPS analysis was performed to obtain atomic concentrations on powdered cellulose surfaces. Figure 1 shows typical XPS survey spectra for all investigated powdered cellulose samples and Table 1 lists the experimental atomic composition as determined from the XPS spectra analysis and the calculated oxygen to carbon (O/C) ratio for all samples.
Inspection of the XPS survey spectra reveals that the C and the O are the predominant species and they occur at around 286–285 eV and 532–531 eV, respectively. The binding energy value of single K2p at 291 eV corresponds to the KOH found in the S2-1 sample. Table 1 shows the decrease in carbon atoms in the S2-1 sample. The O/C ratio can be estimated from the individual ratio and abundance of each component.

3.1.1. C1s Spectra: Deconvoluted Peaks Analysis

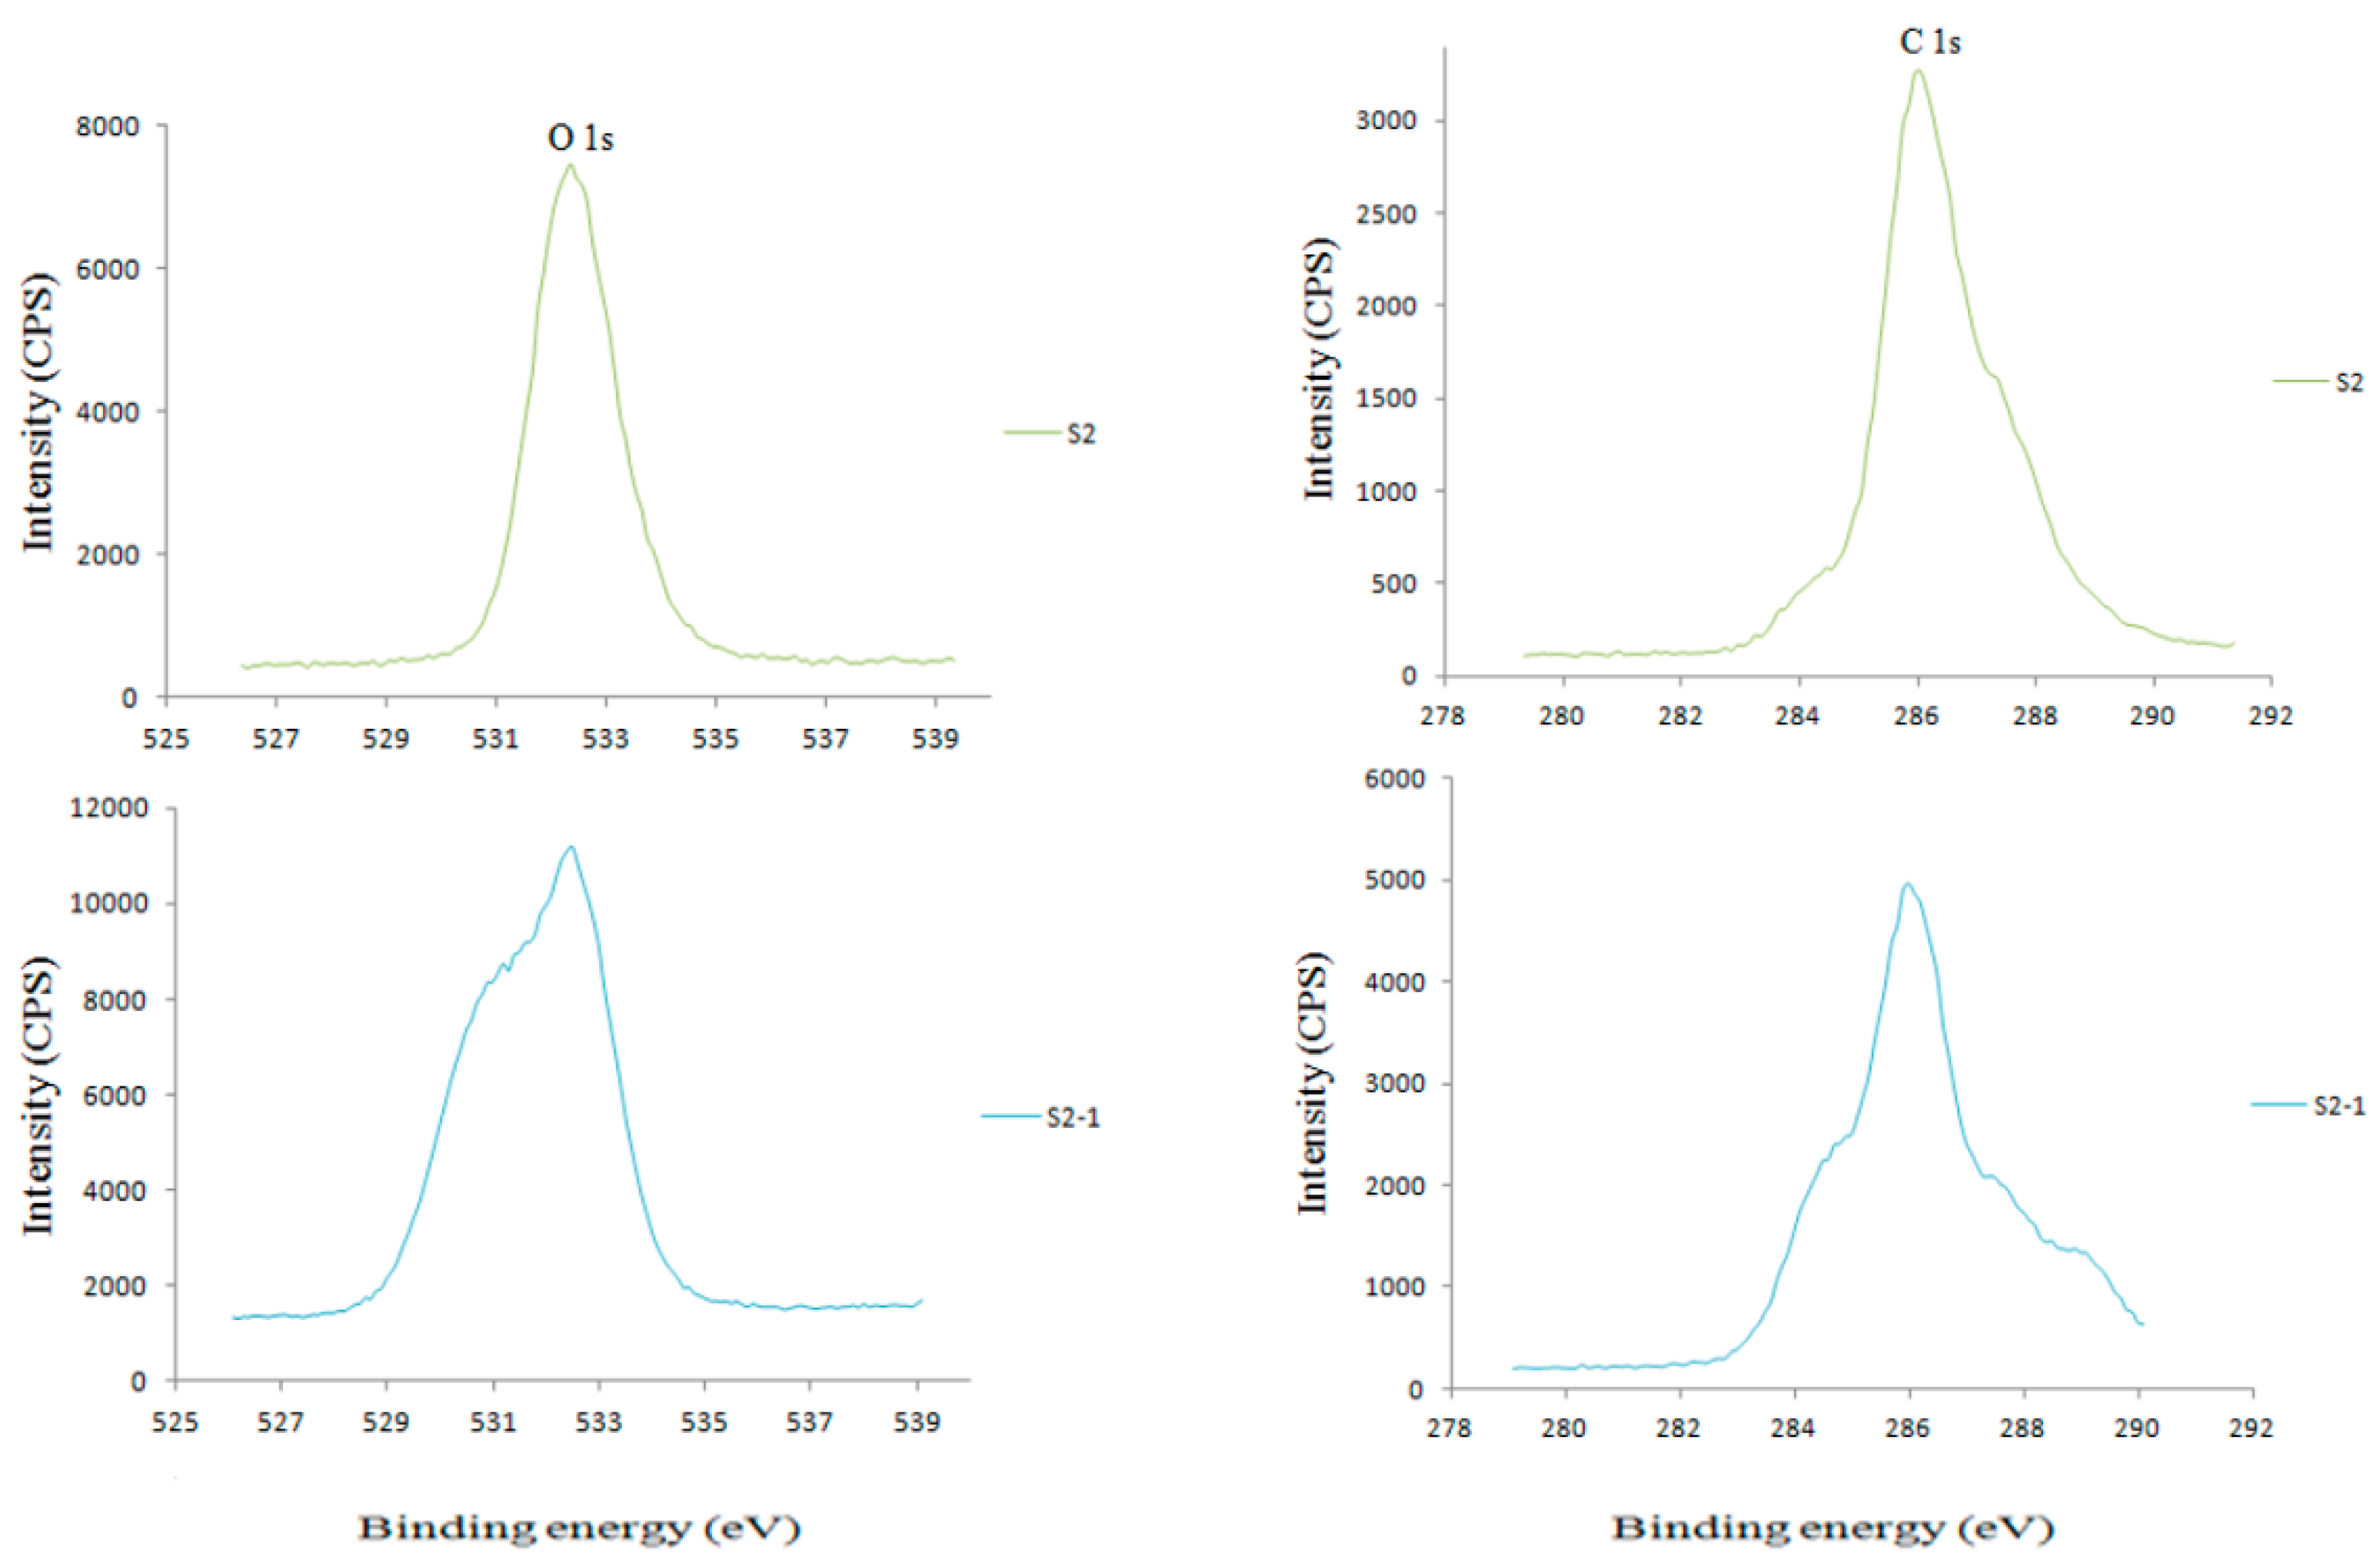
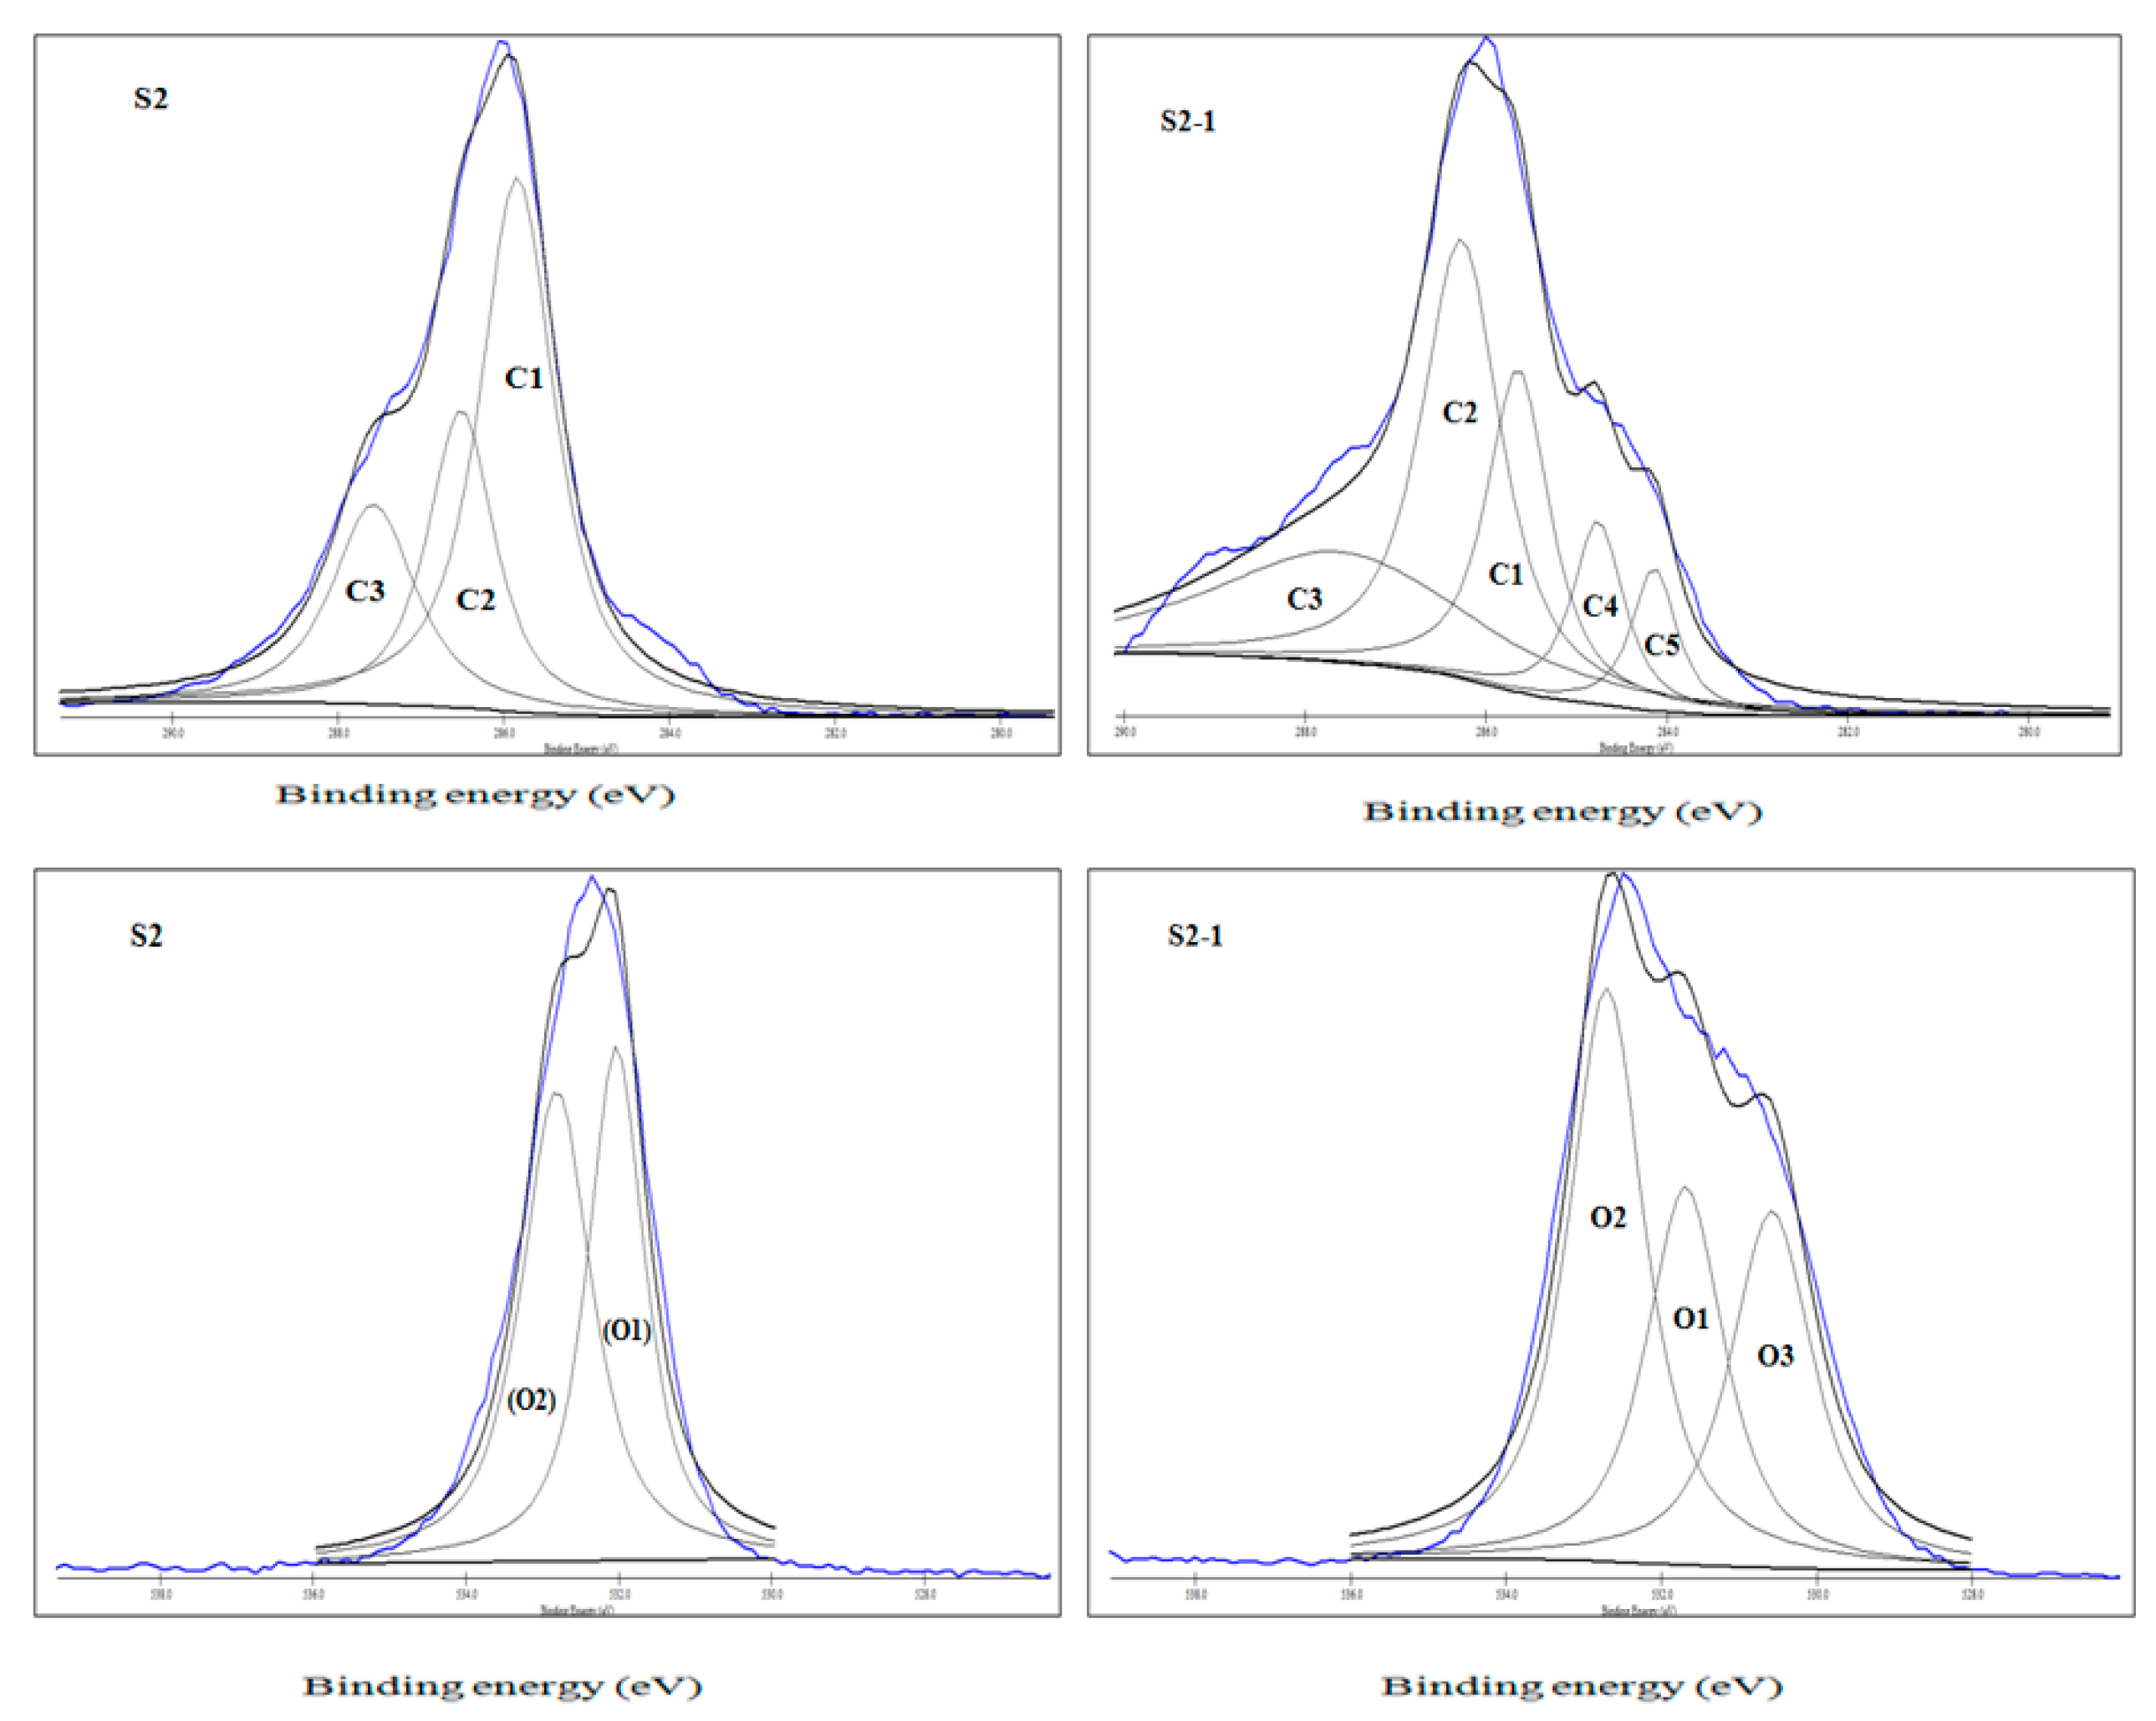
Figure 2 and Figure 3 present high-resolution scans of the XPS spectra of the C1s and the O1s levels with their deconvoluted peaks. The C1s peaks were decomposed for all samples into S2: C1, C2, C3 and S2-1: C1, C2, C3, C4, C5. The O1s peaks were decomposed into S2: O1, O2, and S2-1: O1, O2, O3 with various areas. The assignment of decomposed carbon and oxygen peaks is presented in Table 2, and the binding energy and intensity for decomposed carbon and oxygen peaks for powdered cellulose samples are shown in Table 3 and Table 4.
The C1 corresponds to a carbon atom bound only to other carbon atoms and/or hydrogen atoms (C-C/C-H). This component arises mainly from cellulose [29,30]. The C2 component is due to a carbon atom bound to a single non-carbonyl oxygen atom (C-OH), which has been shown to be mainly derived from cellulose [29,31]. The C3 peak represents a carbon atom bound to two non-carbonyl oxygen atoms or to a single carbonyl oxygen (C=O, O-C-O) atom [32]. The signals for the C1-C3 atoms are slightly shifted to lower binding energies in the S2-1 sample. The signals for C4 and C5 as new carbon atoms appeared in the lowest binding energy in the S2-1 due presumably to the formation of carbon–carbon double bond configuration on powdered cellulose surfaces (Table 2). It has been stated that the surface energy of wood fibers depends not only upon the presence of oxygenated groups on the surface but also on the specific functionality as determined by the C2/(C2 + C3) ratio [33].

3.1.2. O1s Spectra: Deconvoluted Peaks

The XPS spectra of the O1s levels are presented with their deconvoluted peaks in Figure 2 and Figure 3. The assignment of the oxygen peak components and the variation of the corresponding area are listed in Table 2 and Table 4. The binding energy of the O1s involved in the -C=O can be located at around 531.4–532.3 eV, whereas the fingerprint of the C-O-C may appear at 533.0–534.0 eV [34]. The O1 peak originates from an oxygen atom linked to a carbon atom by a double bond, and the O2 peak with higher binding energy represents an oxygen atom linked by a single bond to a carbon atom [33]. The O3 peak comes as a new oxygen atom with the lowest binding energy is detected in the S2-1 sample (Table 2). The signals for the O1, O2, and O3 atoms are shifted to lower binding energies. Likewise, the intensity for the O1, O2, and O3 peaks is considerably increased in the S2-1 compared with the S2 sample. It has been observed that the surface energy of wood fibers can be determined by interactions among oxygenated species [33]. It may indicate the formation of a greater amount of oxygenated species on the S2-1surfaces.

3.2. ATR-FTIR Analysis

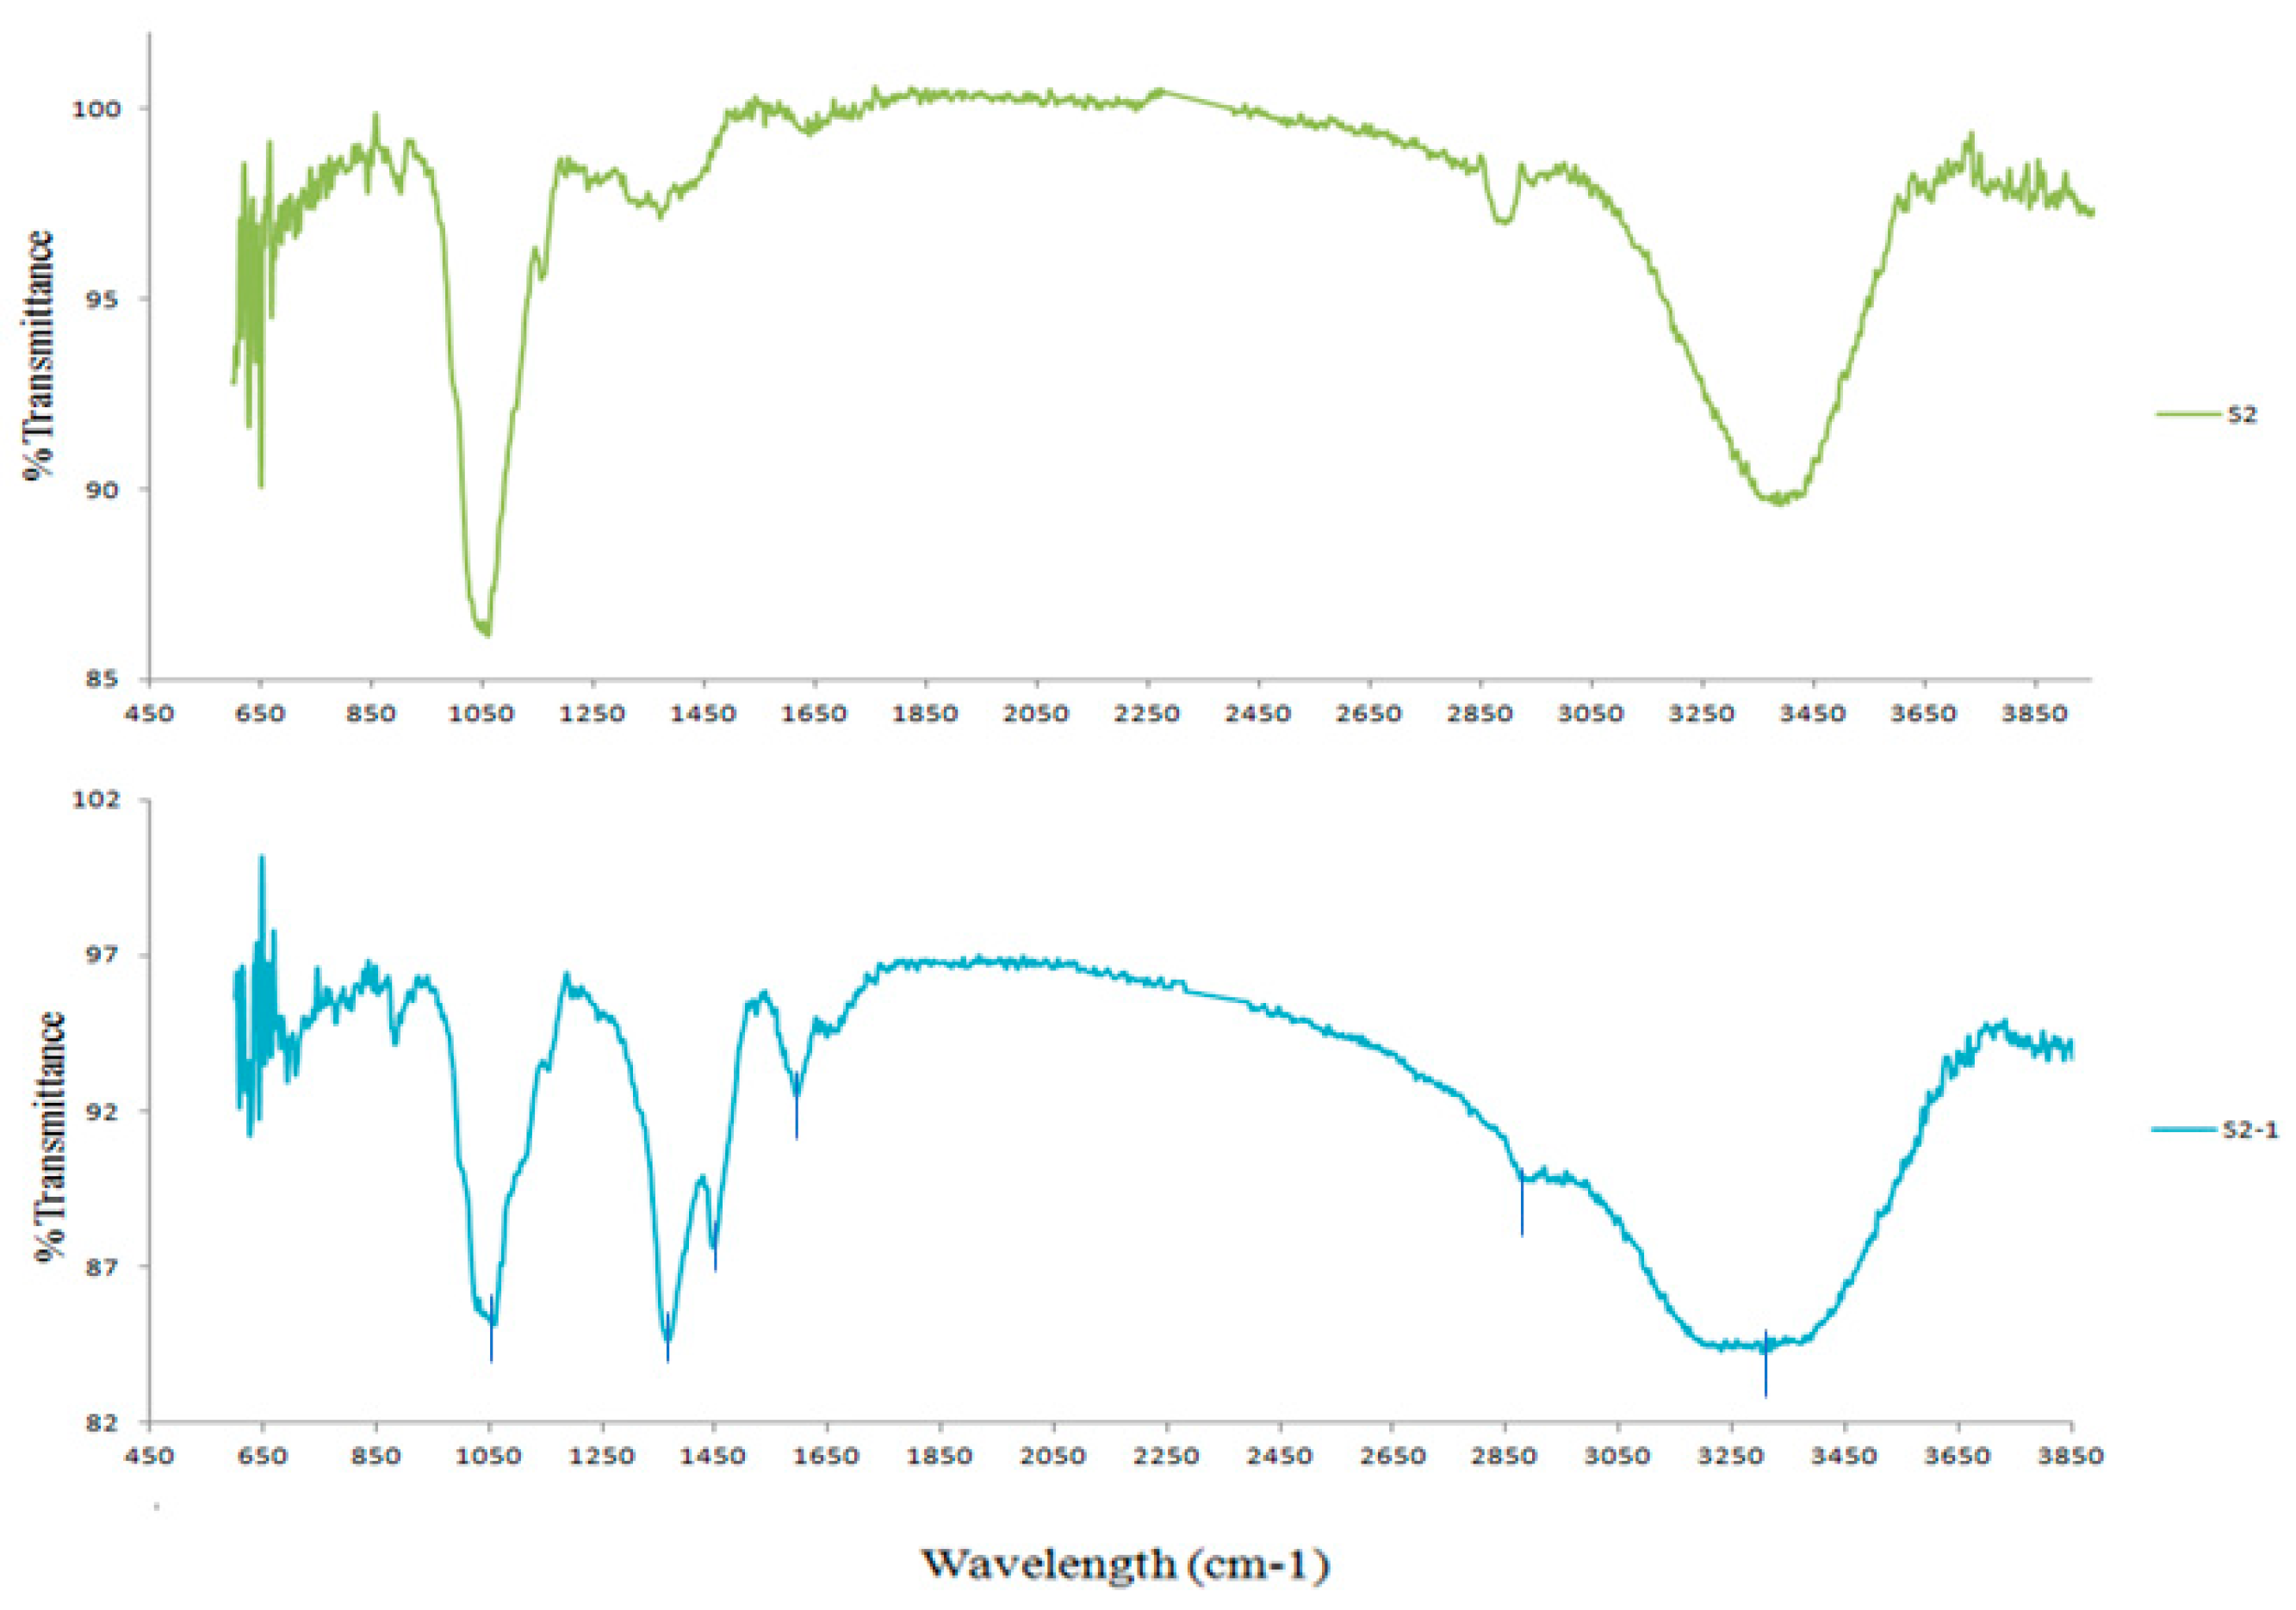
FTIR spectroscopy was used as a complementary technique to XPS spectroscopy. FTIR spectroscopy constitutes one of the most useful techniques for investigating the composition and structure of lignocellulosic fibers [35]. A comparison of the FTIR spectra of the S2 sample with the powdered cellulose, S2-1 is illustrated in Figure 4 and the corresponding assignments of bands are listed in Table 5. Figure 4 presents the view of the wavelength region from 3850 to 650 cm−1 with bands of interest identified by their wavelength (cm−1). In Figure 4 a strong hydrogen band (-OH) stretching at around 3380–3290 cm−1 is observed. A strong band between 3500 and 3100 cm−1 which is assigned to the -OH stretching vibrations is an observable characteristic for cellulosic IR spectra [36]. The hydroxyl band is attributed to hydroxyl functional groups on glucose units. The C1s deconvoluted peaks of the S2 and the S2-1 samples (Figure 3) also showed a carbon component (C2) at around 286.5 eV. The assigned bands around 2850 and 2900 cm−1 are related to the stretching vibrations of the C-H (-CH3 or -CH2-) in all samples [37]. The bands in the region 1365–1315 cm−1 are due to the CH2 and the C-H bending in cellulose samples. The broad band in the region 1125–1004 cm−1 is the characteristic band for the C-O and the C-O-C stretching vibrations in cellulose [38].
The difference between the FTIR spectra of the S2 and the S2-1 samples is striking. The emergence of a band around 1600 cm−1 in the S2-1 sample is the characteristic band for the -C=C- stretching vibrations. It may be related to carbon–carbon double bond configuration, in which a carbon atom is bound to a single carbonyl oxygen atom and/or a non-carbonyl oxygen atom (Table 2). In the S2-1 sample, the absorption bands at around 1450 and 1370 cm−1 are presumably attributed to the stretching vibrations of the -CH in alkene configuration on the surfaces.

4. Conclusions

With the support of X-ray photoelectron spectroscopy (XPS) and attenuated total reflectance-Fourier transform infrared spectroscopy (ATR-FTIR) techniques, we described the surface characteristics of the obtained powdered cellulose samples in terms of both atomic concentrations and chemical functional groups. This work showed its applicability to prepare and chemically activate powdered cellulose by co-milling powdered cellulose with potassium hydroxide, in a completely dry condition and at room temperature. One of the main advantages of this method would be the possibility to combine it with chemical treatments, thus allowing obtaining the desired products with minimal effort.

Supplementary Materials

The following are available online at https://www.mdpi.com/2673-4176/1/1/6/s1, Figure S1: CP-MAS 13C-NMR spectra of powdered cellulose prepared by ball milling of bleached softwood pulp residues. Figure S2: CP-MAS 13C-NMR spectra of powdered cellulose prepared by co-milling with maleic anhydride through ball milling. Figure S3: CP-MAS 13C-NMR spectra of powdered cellulose prepared by co-milling with maleic anhydride and potassium hydroxide through ball milling. Figure S4: CP-MAS 13C-NMR spectra (stacked plot) of powdered cellulose, powdered cellulose co-milled with maleic anhydride and powdered cellulose co-milled with maleic anhydride and potassium hydroxide. Figure S5: CP-MAS 13C-NMR spectra (stacked plot, high resolution) of powdered cellulose, powdered cellulose co-milled with maleic anhydride and powdered cellulose co-milled with maleic anhydride and potassium hydroxide. Figure S6: CP-MAS 13C-NMR spectra (stacked plot, high resolution) of powdered cellulose, powdered cellulose co-milled with maleic anhydride and powdered cellulose co-milled with maleic anhydride and potassium hydroxide.

Author Contributions

Conceptualization, M.A.; methodology, M.A.; validation, M.A. and M.P.W.; investigation, M.A.; Writing—Original draft preparation, M.A.; Writing—Review and editing, M.A. and M.P.W.; project administration, M.P.W.; funding acquisition, M.P.W. All authors have read and agreed to the published version of the manuscript.

Funding

The authors declare no competing financial interest.

Acknowledgments

This material is based upon work supported by National Science Foundation-Center for Bioplastics and Biocomposites (NSF-CB2 IUCRC) under Grant No. 1439732. The authors would like to acknowledge the Department of Chemistry and Center for NMR Spectroscopy at Washington State University for providing XPS and NMR facilities, respectively. The WSU NMR Center equipment was supported by NIH grants RR0631401 and RR12948, NSF grants CHE-9115282 and DBI-9604689 and the Murdock Charitable Trust.

Conflicts of Interest

The authors declare no competing financial interest.

References

  1. Stütz, A.E. Glycoscience: Epimerisation, Isomerisation and Rearrangement Reactions of Carbohydrates; Springer: Berlin/Heidelberg, Germany, 2001. [Google Scholar]
  2. Christiansen, J.A. Hypotheses concerning the transition states in mutarotation of pyranoses: To VK La Mer on his seventieth birthday by his friend. J. Colloid Interface Sci. 1966, 1, 1–2. [Google Scholar] [CrossRef]
  3. Lemieux, R.U.; Stevens, J.D. The proton magnetic resonance spectra and tautomeric equilibria of aldoses in deuterium oxide. Can. J. Chem. 1966, 3, 249–262. [Google Scholar] [CrossRef]
  4. Ward, P.; Isbell, H. Mutarotation of sugars in solution: Part I: History, basic kinetics, and composition of sugar solutions. Adv. Carbohydr. Chem. 1968, 23, 11–57. [Google Scholar]
  5. Le Barch, N.; Grossel, J.M.; Looten, P.; Mathlouthi, M. Kinetic study of the mutarotation of D-glucose in concentrated aqueous solution by gas-liquid chromatography. Food Chem. 2001, 1, 119–124. [Google Scholar] [CrossRef]
  6. Rony, P.R. Polyfunctional catalysis. I. Activation parameters for the mutarotation of tetramethyl-D-glucose in benzene. J. Am. Chem. Soc. 1968, 11, 2824–2831. [Google Scholar] [CrossRef]
  7. Fiandanese, V.; Naso, F. Benzamidine-catalysed mutarotation of 2, 3, 4, 6-tetra-O-methyl-D-glucose. J. Chem. Soc. Perkin Trans. 1977, 8, 1047–1051. [Google Scholar] [CrossRef]
  8. Morpurgo, S.; Grandi, A.; Zazza, C.; Bossa, M. A theoretical study on the sugars’ mutarotation: The epimerisation of 2-tetrahydropyranol catalysed by formamidine, benzamidine and by the 2-aminopyridine/2-iminopyridine tautomeric couple. J. Mol. Struct. THEOCHEM 2005, 1, 71–82. [Google Scholar] [CrossRef]
  9. Rony, P.R.; McCormac, W.E.; Wunderly, S.W. Polyfunctional catalysis. II. General base catalysis of the mutarotation of tetramethyl-D-gluose in benzene and methanol-benzene. J. Am. Chem. Soc. 1969, 15, 4244–4251. [Google Scholar] [CrossRef]
  10. Brown, G.M.; Levy, H.A. α-d-Glucose: Further refinement based on neutron-diffraction data. Acta Crystallographica Sect. B Struct. Crystallogr. Cryst. Chem. 1979, 3, 656–659. [Google Scholar] [CrossRef]
  11. Fisher, J. Modern NMR Techniques for Synthetic Chemistry; CRC Press: Boca Raton, FL, USA, 2014. [Google Scholar]
  12. Dujardin, N.; Willart, J.F.; Dudognon, E.; Danede, F.; Descamps, M. First obtaining of glass solutions and phase diagram of glucose with fully tunable anomeric concentration. J. Pharm. Sci. 2010, 3, 1476–1483. [Google Scholar] [CrossRef]
  13. Dujardin, N.; Willart, J.F.; Dudognon, E.; Hédoux, A.; Guinet, Y.; Paccou, L.; Chazallon, B.; Descamps, M. Solid state vitrification of crystalline α and β-D-glucose by mechanical milling. Solid State Commun. 2008, 1, 78–82. [Google Scholar] [CrossRef]
  14. Willart, J.F.; Carpentier, L.; Danède, F.; Descamps, M. Solid-state vitrification of crystalline griseofulvin by mechanical milling. J. Pharm. Sci. 2012, 4, 1570–1577. [Google Scholar] [CrossRef] [PubMed]
  15. Broido, A.; Houminer, Y.; Patai, S. Pyrolytic reactions of carbohydrates. Part I. Mutarotation of molten D-glucose. J. Chem. Soc. B Phys. Org. 1966, 411–414. [Google Scholar] [CrossRef]
  16. Ribeiro, L.S.; Órfão, J.J.; Pereira, M.F.R. Enhanced direct production of sorbitol by cellulose ball-milling. Green Chem. 2015, 5, 2973–2980. [Google Scholar] [CrossRef]
  17. Paakkari, T.; Serimaa, R.; Fink, H.P. Structure of amorphous cellulose. Acta Polymerica 1989, 12, 731–734. [Google Scholar] [CrossRef]
  18. Jiang, J.; Wang, J.; Zhang, X.; Wolcott, M. Evaluation of physical structural features on influencing enzymatic hydrolysis efficiency of micronized wood. RSC Adv. 2016, 105, 103026–103034. [Google Scholar] [CrossRef]
  19. Mikushina, I.V.; Troitskaya, I.B.; Dushkin, A.V.; Bazarnova, N.G. Changes in the chemical composition of wood during mechanochemical treatment. Chem. Sust. Dev. 2002, 4, 441–445. [Google Scholar]
  20. Azadfar, M.; Graham, M.R.; Wolcott, M.P. Effect of Cellulose Reducing Ends on the Reinforcing Capacity of Powdered Cellulose in Polypropylene Composites. J. Compos. Sci. 2019, 3, 98. [Google Scholar] [CrossRef] [Green Version]
  21. Yaylayan, V.A.; Ismail, A.A. Investigation of the enolization and carbonyl group migration in reducing sugars by FTIR spectroscopy. Carbohydr. Res. 1995, 2, 253–265. [Google Scholar] [CrossRef]
  22. Shaffer, P.A.; Friedemann, T.E. Sugar activation by alkali I. Formation of lactic and saccharinic acids. J. Biol. Chem. 1930, 1, 345–374. [Google Scholar]
  23. Braun, M. Modern Enolate Chemistry: From Preparation to Applications in Asymmetric Synthesis; John Wiley & Sons: Hoboken, NJ, USA, 2015. [Google Scholar]
  24. Sinnott, M. Carbohydrate Chemistry and Biochemistry: Structure and Mechanism; Royal Society of Chemistry: London, UK, 2007. [Google Scholar]
  25. Menuel, S.; Doumert, B.; Saitzek, S.; Ponchel, A.; Delevoye, L.; Monflier, E.; Hapiot, F. Selective secondary face modification of cyclodextrins by mechanosynthesis. J. Org. Chem. 2015, 12, 6259–6266. [Google Scholar] [CrossRef] [PubMed]
  26. Matuana, L.M.; Balatinecz, J.J.; Park, C.B.; Sodhi, R.N.S. X-ray photoelectron spectroscopy study of silane-treated newsprint-fibers. Wood Sci. Technol. 1999, 4, 259–270. [Google Scholar] [CrossRef]
  27. Kovac, J. Surface characterization of polymers by XPS and SIMS techniques. Mater. Tehnol. 2011, 45, 191–197. [Google Scholar]
  28. Azadfar, M.; Gao, A.H.; Bule, M.V.; Chen, S. Structural characterization of lignin: A potential source of antioxidants guaiacol and 4-vinylguaiacol. Int. J. Biol. Macromol. 2015, 75, 58–66. [Google Scholar] [CrossRef] [PubMed]
  29. Kamdem, D.P.; Riedl, B.; Adnot, A.; Kaliaguine, S. ESCA spectroscopy of poly (methyl methacrylate) grafted onto wood fibers. J. Appl. Polym. Sci. 1991, 10, 1901–1912. [Google Scholar] [CrossRef]
  30. Johansson, L.S.; Campbell, J.M. Reproducible XPS on biopolymers: Cellulose studies. Surf. Interface Anal. 2004, 8, 1018–1022. [Google Scholar] [CrossRef]
  31. Johansson, L.S.; Campbell, J.M.; Hänninen, T.; Ganne-Chèdeville, C.; Vuorinen, T.; Hughes, M.; Laine, J. XPS and the medium-dependent surface adaptation of cellulose in wood. Surf. Interface Anal. 2012, 8, 899–903. [Google Scholar] [CrossRef]
  32. Stark, N.M.; Matuana, L.M. Surface chemistry changes of weathered HDPE/wood-flour composites studied by XPS and FTIR spectroscopy. Polym. Degrad. Stab. 2004, 1, 1–9. [Google Scholar] [CrossRef] [Green Version]
  33. Liu, F.P.; Rials, T.G.; Simonsen, J. Relationship of wood surface energy to surface composition. Langmuir 1998, 2, 536–541. [Google Scholar] [CrossRef]
  34. Nzokou, P.; Kamdem, D.P. X-ray photoelectron spectroscopy study of red oak-(Quercus rubra), black cherry-(Prunus serotina) and red pine-(Pinus resinosa) extracted wood surfaces. Surf. Interface Anal. 2005, 8, 689–694. [Google Scholar] [CrossRef]
  35. Pizzi, A.; Mittal, K.L. Handbook of Adhesive Technology, Revised and Expanded; CRC Press: Boca Raton, FL, USA, 2003. [Google Scholar]
  36. Sun, X.F.; Sun, R.; Sun, J.X. Acetylation of rice straw with or without catalysts and its characterization as a natural sorbent in oil spill cleanup. J. Agric. Food Chem. 2002, 22, 6428–6433. [Google Scholar] [CrossRef] [PubMed]
  37. Khalil, H.A.; Ismail, H.; Rozman, H.D.; Ahmad, M.N. The effect of acetylation on interfacial shear strength between plant fibers and various matrices. Eur. Polym. J. 2001, 5, 1037–1045. [Google Scholar] [CrossRef]
  38. Huang, L.; Ye, Z.; Berry, R. Modification of cellulose nanocrystals with quaternary ammonium-containing hyperbranched polyethylene ionomers by ionic assembly. ACS Sustain. Chem. Eng. 2016, 9, 4937–4950. [Google Scholar] [CrossRef]
Scheme 1. Activation of reducing sugars by alkali [1,2,4,6,21].
Polysaccharides 01 00006 sch001
Figure 1. XPS survey spectra of S2 and S2-1 samples.
Polysaccharides 01 00006 g001
Figure 2. C1s peaks (right plot) and O1s peaks (left plot) of S2 and S2-1samples.
Polysaccharides 01 00006 g002
Figure 3. Deconvoluted peaks: C1s peaks of S2 and S2-1and O1s peaks of S2 and S2-1 samples.
Polysaccharides 01 00006 g003
Figure 4. ATR-FTIR spectra of S2 and S2-1 samples.
Polysaccharides 01 00006 g004
Table 1. Experimental atomic composition (%) and O/C ratio obtained by XPS analysis for all samples.
Sample% C% O% KO/C
S257.36 42.64 0.74
S2-140.76 41.4 9.79 1.01
Table 2. Assignment of the carbon and oxygen peak components, C1s and O1s for powdered cellulose samples.
GroupSymbolCarbon Atom or Oxygen Atom Bonded to
Carbon
IC1C-C/C-H
IIC2C-OH
IIIC3C=O, O-C-O
IVC4-C*=C(OH)-CHO
-C=C*(OH)-CHO
-C-C(O)-C*HO
VC5
Oxygen
IO1C=O*: (-(C6H10O5)-)n
C-O*-C: (-(C6H10O5)-)n
IIO2
IIIO3-C=C(OH)-CHO*
-C-C(O*)-CHO
Table 3. Binding energy and intensity of C1s peaks for powdered cellulose samples.
Carbon TypeBinding Energy (eV)Intensity (CPS)
S2
C1285.8343082
C2286.5112573.33
C3287.5681423.33
S2-1
C1285.6453998
C2286.2734782.66
C3287.632 2012.66
C4284.7612399.33
C5284.1391748
Table 4. Binding energy and intensity of O1s peaks for powdered cellulose samples.
Oxygen TypeBinding Energy (eV)Intensity (CPS)
S2
O1532.0326880
O2532.8125944.44
S2-1
O1531.6919206.63
O2532.70610,463.55
O3530.5777575.66
Table 5. Assignment of ATR-FTIR absorption bands of powdered cellulose samples.
AssignmentCellulose Powder Samples
λ (cm−1)T (%)
–OH stretching vibrations 3380 (S2), 3290(S2-1)89.6(S2), 84.2(S2-1)
–CH stretching vibrations (-CH2-, -CH3) 2900 (S2), 2890 (S2-1)97.1 (S2), 89.7 (S2-1)
C=C stretching vibrations1590 (S2-1)92.90 (S2-1)
-C-H stretching vibrations 1440–1370 (S2-1)87.6–84.6 (S2-1)
CH2 and C-H bending in cellulose1370 (S2)97.1 (S2)
C-O and C-O-C stretching vibrations in cellulose1050 (S2), 1050 (S2-1)86.2 (S2), 85.2 (S2-1)
Publisher’s Note: MDPI stays neutral with regard to jurisdictional claims in published maps and institutional affiliations.