Transitions among BMI States: A Test of Competing Hypotheses

Department of Sociology, College of Arts and Sciences, University of Nebraska at Kearney, Kearney, NE 68849, USA
Obesities 2021, 1(1), 1-25; https://doi.org/10.3390/obesities1010001
Submission received: 17 October 2020
/
Revised: 9 November 2020
/
Accepted: 28 November 2020
/
Published: 8 December 2020
Abstract
:Overweight/obesity and underweight among older adults remain major public health concerns in the United States. This study aims to assess cohort differences in transition among BMI (body mass index) statuses (underweight, normal weight, overweight, and obese) by various cohort and race/ethnicity–gender groups. The empirical work of this study was based on the 1992–2014 Health and Retirement Study (HRS). Multistate life tables (MSLT) were used to assess transitions among different BMI statuses. Results from multistate life tables suggested that the impact of cumulative advantage (disadvantage), persistent inequality, and aging-as-leveler on transition among BMI statuses was shaped along race/ethnicity–gender and cohort lines. Weight management and weight loss strategies should focus on ethnic minorities (i.e., Black and Hispanic populations) and White participants from recent cohorts. Programs aimed at minimizing the negative consequences associated with underweight and weight loss should focus on individuals from earlier cohorts and Black populations.
1. Introduction
Overweight/obesity and underweight among older adults remain major public health concerns in the United States. The prevalence of obesity for adults over 65 is approximately 35% [1]. During the beginning of the 21st century, the proportions of obese men and women over the age of 74 were 18% and 24%, respectively; these percentages increased to 27% and 30%, respectively, after a decade [2]. The impacts of obesity remain fully felt even at older ages [3].
Empirical evidence suggests that both overweight and underweight can increase the risk of morbidity and mortality. In fact, a distinguished legacy of researchers has illuminated the health risks associated with being overweight and obese. These health risks include but are not limited to cardiovascular disease, kidney disease, type 2 diabetes, arthritis, and declines in physical function [4,5,6,7]. The health risks associated with being underweight and low or declining BMI (body mass index) include dementia [8,9,10], fractures [11,12], functional limitations [13], cardiovascular disease [14], malnutrition [15], and osteoporosis [15,16]. Being underweight can also increase the risk for all-cause mortality [17,18,19]. The far-reaching implications of being either underweight, overweight, or obese among older adults will include unprecedented demands on aging services and the nation’s health care system.
To date, studies on transitions among BMI statuses focused on children, young adolescents [20], and adults [21,22,23]. Studies that focused on older adults examined changes in BMI trajectories in the United States, Canada, and Japan. Studies conducted in the United States focused on identifying distinct BMI trajectories by various demographic characteristics and health conditions [24,25]. Studies conducted in Canada and Japan focused on assessing the potential impacts of BMI trajectories on health outcomes [26] and mortality [27,28].
To my knowledge, only one study on racial/ethnic differences in obesity in the United States focused on older adults. Their analysis of the 1996–2006 Health and Retirement Study found higher percentages of obesity and severe obesity among Black and Hispanic groups [29]. Analyses of the 2007–2010 National Health and Nutrition Examination Survey (NHANES) disaggregated by sex also found significant differences in obesity prevalence by race and ethnicity among women who are 64 and older [1]. For men, the prevalence of obesity is slightly higher for White populations among those between 64 and 75 of age, while the reverse is true for those 75 and over [1].
Analysis of the Americans’ Changing Lives Survey revealed that more women than men are obese across all racial groups [30]. Nevertheless, analysis of the 2007–2010 NHANES revealed that the prevalence of obesity is slightly higher among men for those between 64 and 75 years of age (41.5% for men and 40.3% for women) while the reverse is true for those 75 and older (26.5% for men and 28.7% for women) [1].
To date, no researchers have attempted to model transitions among BMI statuses among older adults in the United States. There is also a dearth of research on underweight and weight loss among older adults. To fill the gaps in the body of the literature, this study will use multistate life tables to assess transitions among BMI statuses (underweight, normal weight, overweight, and obese) by cohort, race/ethnicity, and gender. This knowledge can permit effective health programs and intervention measures to be designed to target specific population subgroups in order to reduce, prevent, delay, or reverse the progression of overweight/obesity or underweight.
2. Hypotheses
Both the cumulative advantage (disadvantage) and aging-as-leveler hypotheses can be used to explain the transitions among BMI statuses. The cumulative advantage/disadvantage hypothesis states that early advantages or disadvantages are critical to the development of health inequality among different racial/ethnic groups as they age over the life course [31]. This hypothesis is supported if interethnic disparities in estimated transition probabilities from one BMI state to another increase with age (and over time), as demonstrated by diverging trends as a person ages over time. Since Black populations have lived in the United States longer than Hispanic populations, it is logical to assume that they have been exposed to racism, discrimination, and other structural disadvantages and other structurally imposed inequalities for longer periods of time than Hispanic populations. Therefore, it is expected that the cumulative advantage (disadvantage) hypothesis will have a bigger effect on Black–White differences in the estimated transition probabilities from normal to overweight and from overweight to obese than Hispanic–White differences in these transitions. Likewise, the lack of access to healthy food and the presence of health conditions such as diabetes, arthritis, and stroke as well as certain aspects of the individual’s existence and social and built environments can also contribute to wider Black–White disparities in these transitions.
The persistent inequality hypothesis relies on the premise that demographic and socioeconomic factors have consistent effects [32] on BMI trajectories over time. This hypothesis is supported if race/ethnicity differences in BMI trajectories remain stable over time, as demonstrated by parallel trends. The aging-as-leveler hypothesis applies when differences in estimated transition probabilities from one BMI state to another decrease at older ages because age is acting as a leveler for such differences among different racial/ethnic groups. The age leveling pattern can be attributable to mortality selection and access to Medicare at age 65 and older [33]. This hypothesis is supported if racial/ethnic disparities in estimated transition probabilities decrease with age, as demonstrated by converging trends as a person ages over time. Longer exposures to racism, discrimination, and other structural disadvantages and other structurally imposed inequalities can also mean higher rates of selective mortality among the Black population, which in turn results in a greater proportion of healthy, very old Black individuals with favorable BMI outcomes with reduced risks associated with overweight and obesity. Hispanic populations in the United States may have better advantages with respect to BMI outcomes due to the existence of norms and cultural support for healthier dietary habits [34], social support networks, and other informal systems of healthcare [35,36]. Since Black populations are disproportionately affected by the selection mortality processes [37], it is probable that the aging-as-leveler hypothesis will have a bigger effect on the Black–White gap in estimated transition probabilities from normal to overweight and from overweight to obese than the Hispanic–White gap in these transitions.
3. Method
3.1. Sample
The empirical work of this study was based on the 1992–2014 Health and Retirement Study (HRS). Demographic characteristics of respondents (race, sex, and education) and cohort membership were obtained from the HRS Cross-Wave Tracker file. The HRS is a collaborative effort between the Social Security Administration (SSA) and the National Institute of Health (NIH). It is an ongoing, nationally representative, longitudinal survey of more than 37,000 individuals over the age of 50 in 23,000 households in America. This biennial survey has a high re-interview rate (ranges from 92% in 1994 to 95.9% in 2008) [38]. HRS is appropriate for the purposes of this study because, in addition to providing current information on sex, age, race/ethnicity, education, and employment status, respondents are also asked about their self-report health statuses and conditions, weight, height, BMI, personal and household income, retirement planning, family structure, family support systems, health behaviors, healthcare utilizations, and insurance coverage. The final analysis sample consisted of 35,189 individuals (25,055 White, 6294 Black, and 3840 Hispanic). Because Asian, Pacific Islander, and Native American populations were not specifically identified from the survey, individuals who self-identified as other in the race category were excluded from the analyses.
3.2. Measures
The dependent variable in this study was the body mass index (BMI). Underweight, normal weight, overweight, and obesity are most commonly defined according to the BMI [39]. BMI has generally been regarded as the most common and convenient anthropometric measurement of obesity in adults [40]. BMI in each wave (1992 to 2014) was derived from the formula: . Weight was measured in pounds and height was measured in feet and inches. This continuous variable was recoded into a categorical variable to represent the commonly defined categories for BMI: underweight, normal weight, overweight, and obesity. A BMI less than 18.5 was considered underweight. A BMI between 18.5 and 24.9 was considered normal weight. A BMI of 25–29.99 was considered overweight. A BMI of 30 or over was considered obese.
Demographic variables included race/ethnicity (White, Black, and Hispanic) and gender (male and female). Cohort membership included the Asset and Health Dynamics among the Oldest Old (AHEAD), Children of Depression (CODA), original Health and Retirement Study (HRS), War Baby (WB), Early Baby Boomer (EBB), and Mid Baby Boomer (MBB). The AHEAD cohort referred to individuals born between 1890 and 1923. The CODA cohort referred to individuals born between 1924 and 1930. The HRS cohort comprised individuals born between 1931 and 1941. The WB cohort comprised individuals born between 1942 and 1947. The EBB cohort referred to individuals born between 1948 and 1953. The MBB cohort comprised individuals born between 1954 and 1959.
3.3. Analytic Strategy
Multistate life tables (MSLTs) were used to assess transitions among different BMI statuses. This is a Markov modeling of stochastic processes that involves individuals moving between a finite number of states over time, including exit and reentry into the same state [41,42]. Covariates can also be incorporated into the models to relate individual characteristics to intensity rates and probabilities to better explain the heterogeneity in the course of BMI status’ change over time. MSLTs are fitted using the R Statistical Software (msm package) [43].
The transition probability for any successive time intervals can be directly estimated by , where pij is the estimated transition probability, a conditional probability that individuals transfer to from state i to state j at time , given that . All transition rates can be put into a matrix with as its elements pertaining to states i and j.
where 1 = underweight, 2 = normal weight, 3 = overweight, and 4 = obese. The analyses were disaggregated by race/ethnicity and gender to allow for interracial/interethnic and gender differences. One MLST was estimated for each racial/ethnic gender group. Because the HRS is conducted every two years, there were 12 transition times.
4. Results
Before discussing the results from the MSLTs, it is important to note some differentials observed in the original sample of older adults. Table 1 and Table 2 presented descriptive statistics of respondents from the 1992–2014 Health and Retirement Study (HRS). As shown in these tables, the majority of the respondents were White and slightly over half of the respondents were females. The median body mass indices slightly increased over time (from 26.5 in 1992 to 27.5 in 2014). Except for year 2008, BMIs were slightly higher for males. As reported in Table 2, the majority of respondents had a high school diploma. Table 2 also showed that younger cohorts had somewhat higher percentages of respondents with 2- and 4-year college education and respondents with Master’s degrees. This table also revealed that earlier cohorts had somewhat higher percentages of respondents with no schooling.
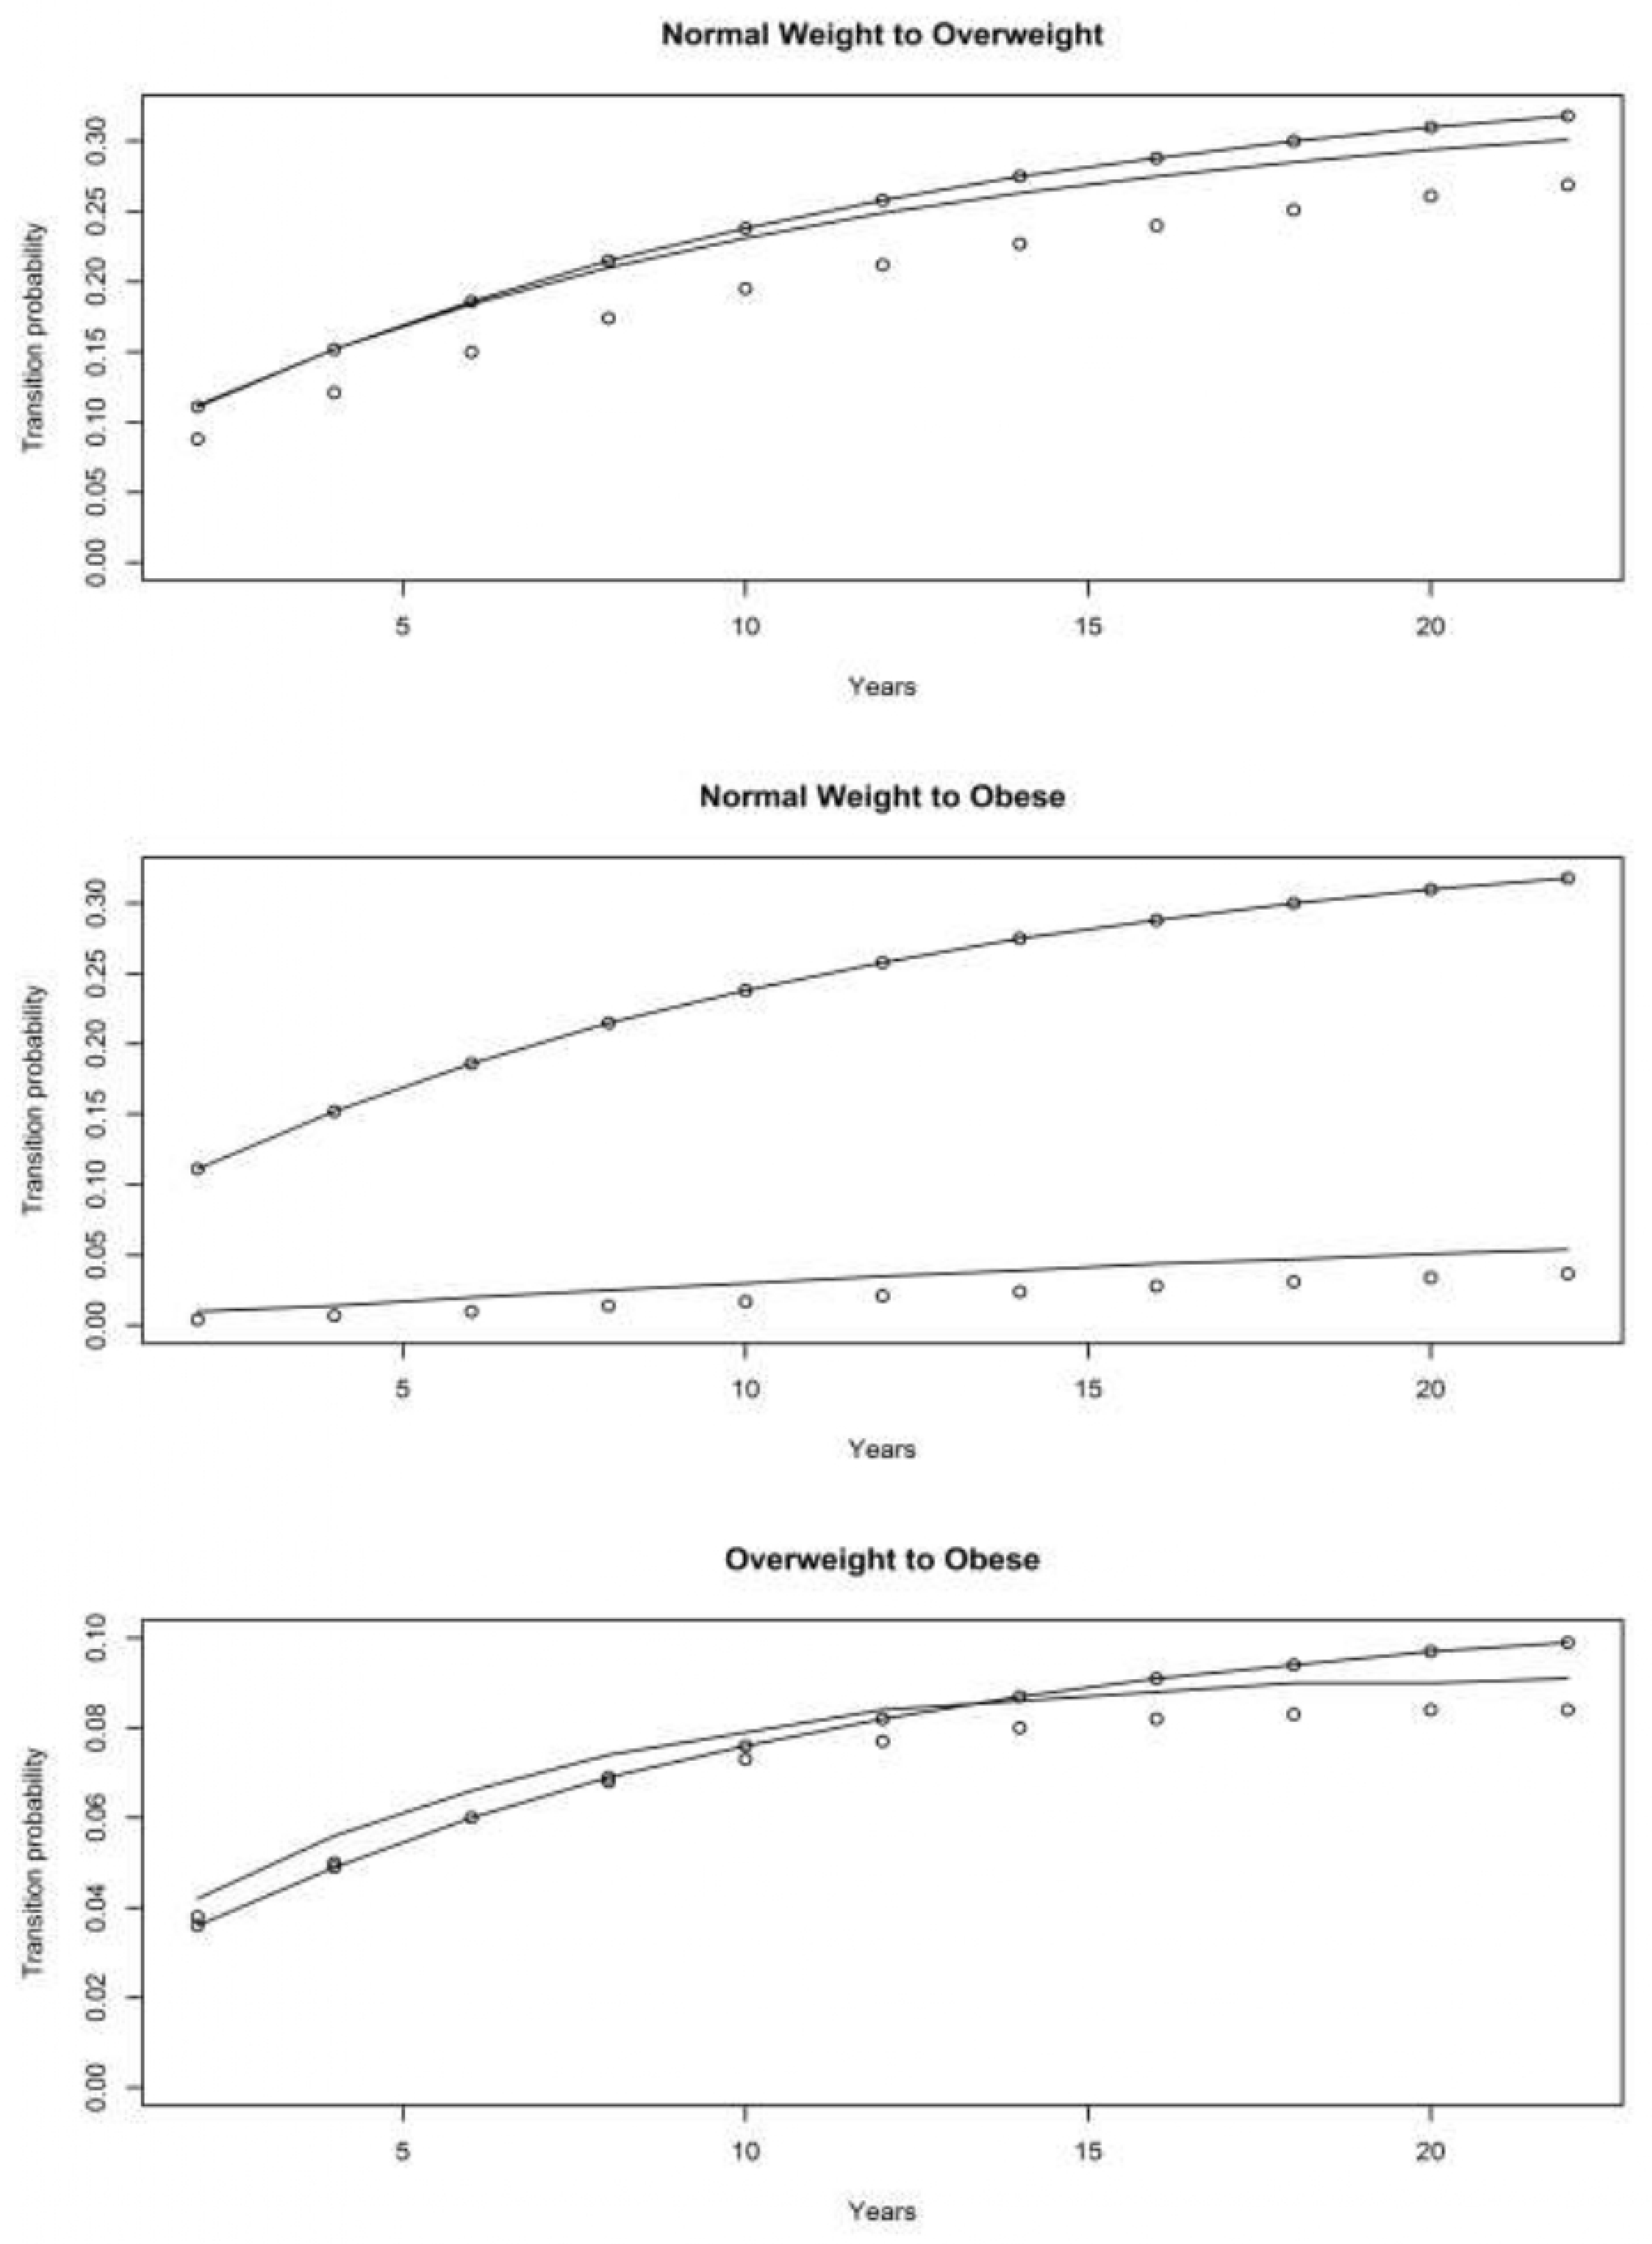
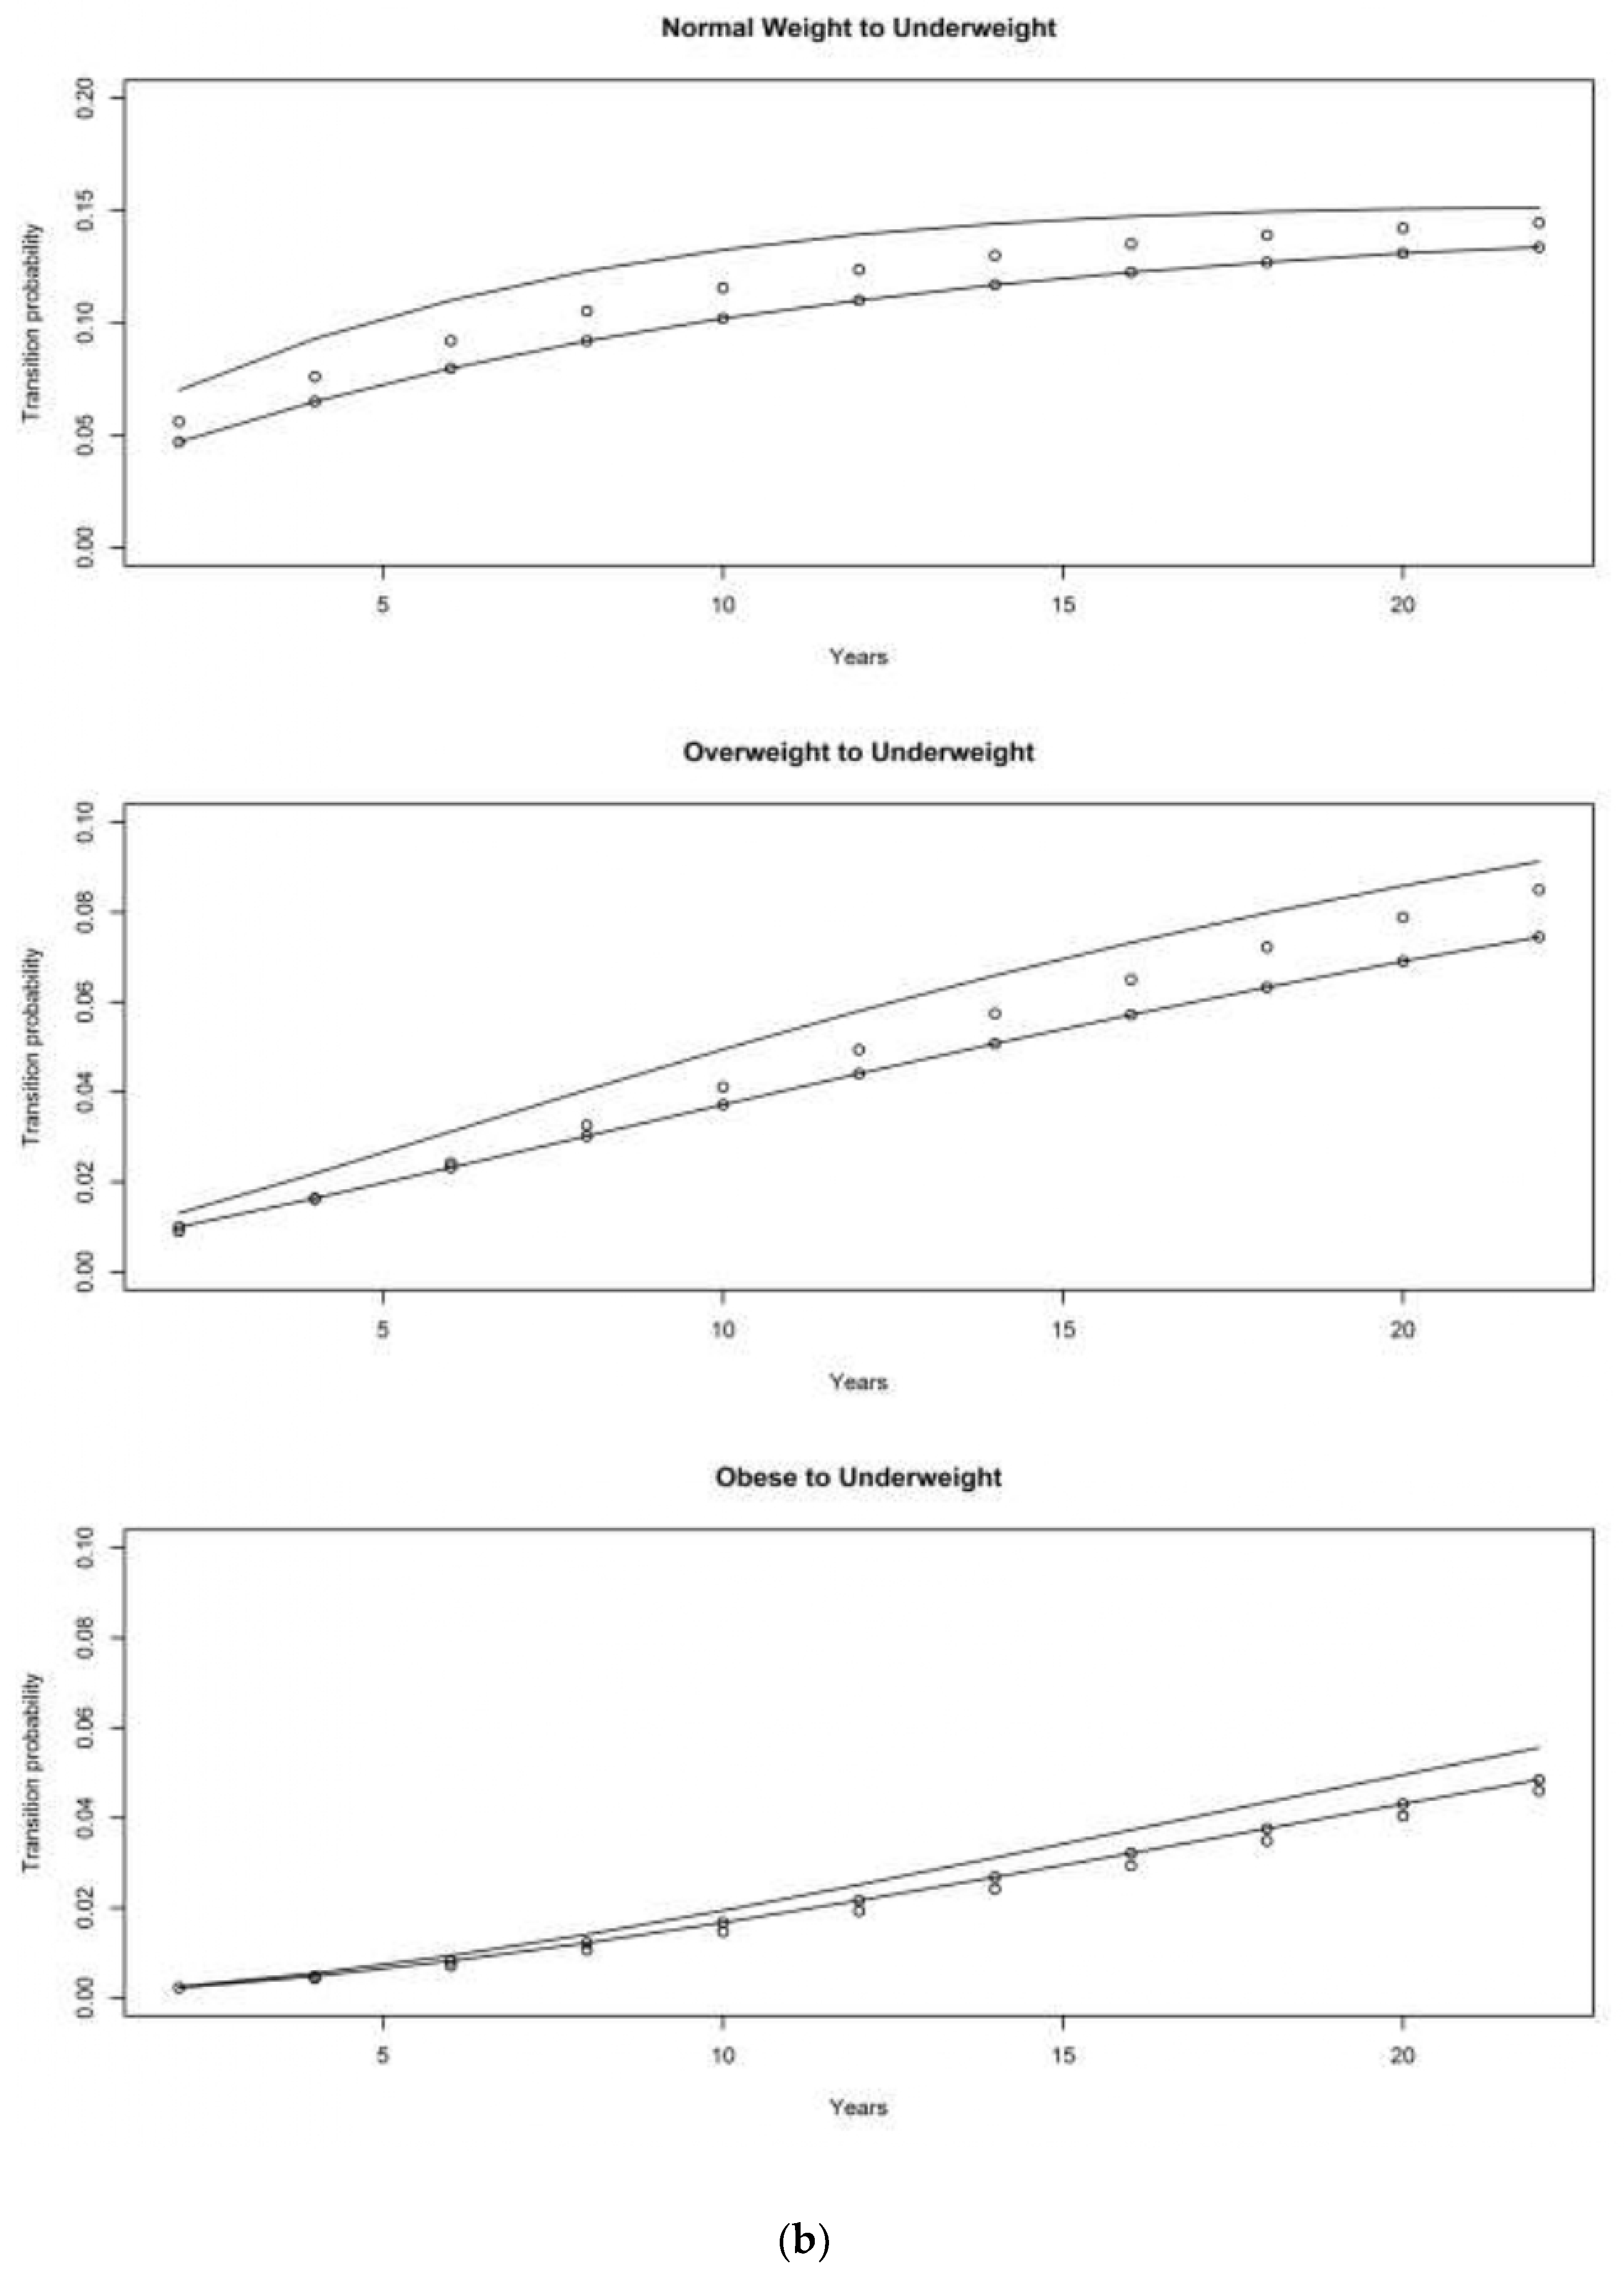
Results from the multistate life tables revealed that, regardless of cohort membership, the estimated probabilities associated with weight gain (i.e., from normal weight to overweight, from normal weight to obese, and from overweight to obese) increased for all racial/ethnic–gender groups. The estimated probabilities associated with weight loss also increased for all racial/ethnic–gender groups to a lesser extent. Important cohort differences could also be detected for all racial/ethnic–gender groups. As illustrated in Figures 1–12, there were discernable cohort trends in transition among BMI statuses in different racial/ethnic–gender groups—even as age/period trends continued upward. For the figures, the points refer to White populations, the line plots refer to Black populations, and the overplotted points and lines refer to Hispanic populations. None of the confidence intervals for these transitions contained zero, which suggested that the estimated probabilities of these transitions were statistically significant (provided upon request).
4.1. Asset and Health Dynamics among the Oldest Old (AHEAD) Cohort
The persistent inequality hypothesis was supported for interethnic differences in estimated transition probabilities associated with weight gain for males and females (i.e., from normal to overweight) (see Figure 1 and Figure 2a). Figure 1 also revealed that the estimated transition probabilities associated with drastic weight gain (i.e., from overweight to obese) were somewhat similar among the three ethnic groups for males. The cumulative advantage (disadvantage) hypothesis was also supported for males for the Hispanic–White differences in transition from overweight to obese (see Figure 1).
The cumulative advantage (disadvantage) hypothesis was supported for transitions associated with weight gain (i.e., from overweight to obese) and drastic weight gain (i.e., from normal weight to obese) for females (see Figure 2a). It is also worth noting that the estimated transition probabilities associated with weight gain (i.e., from normal to overweight and from overweight to obese) were somewhat higher among Black and Hispanic females than their White counterparts (see Figure 2a).
For the estimated transition probabilities from normal weight to underweight for females, the Black–White gap was supported by the aging-as-leveler hypothesis, as evidenced by the converging trajectories, while the persistent inequality hypothesis applied to the Hispanic–White gap (see Figure 2b). Despite the relatively low estimated probabilities, transition probabilities associated with weight loss (i.e., from normal weight to underweight) and drastic weight loss (i.e., from overweight to underweight and from obese to underweight) had notably increased for all females from the AHEAD cohort (see Figure 2b). The estimated transition probabilities from obese to underweight were somewhat similar among all ethnic groups (see Figure 2b).
4.2. Children of Depression (CODA) Cohort
The persistent inequality hypothesis was supported for interethnic differences in estimated transition probabilities from normal to overweight (see Figure 3). The cumulative advantage (disadvantage) hypothesis was supported for the Hispanic–White and, to a much lesser extent, for the Black–White gap in transitions associated with drastic weight gain (see Figure 3). For females, the estimated probability of transitioning from overweight to obese was highest among Hispanic groups, followed by White and Black populations (see Figure 3).
Except for the estimated transition probabilities from overweight to obese for males, transition probabilities associated with weight gain were somewhat higher among Black and Hispanic groups than White populations (see Figure 3 and Figure 4a). Figure 4a showed that, for females, the aging-as-leveler hypothesis was also supported for interethnic differences in the estimated transition probabilities from normal weight to obese. Figure 4a also showed that, for females, the estimated transition probabilities from normal weight to obese were characterized by the cumulative advantage (disadvantage) hypothesis, while estimated transition probabilities from overweight to obese were characterized by the persistent inequality hypothesis.
As illustrated in Figure 4b, the cumulative advantage (disadvantage) hypothesis was also applicable for estimated transition probabilities associated with weight loss (i.e., from normal to underweight) and drastic weight loss (i.e., from overweight to underweight) for females. Figure 4b also showed that the estimated transition probabilities from normal weight to underweight were somewhat higher for Black females when compared to their White and Hispanic counterparts. Despite the relatively low estimated probabilities, the estimated transition probabilities associated with weight loss and drastic weight loss had notably increased for all females (see Figure 4b).
4.3. The Original HRS Cohort
For males, the estimated transition probabilities from normal weight to overweight were highest among Hispanic groups, followed by White and Black populations, and the Hispanic–White gap was characterized by the persistent inequality hypothesis (see Figure 5a). The Hispanic–White gap in estimated transition probabilities from normal weight to obese was characterized by the cumulative advantage (disadvantage) hypothesis (see Figure 5a). Black and White males had somewhat similar estimated transition probabilities from normal weight to obese (see Figure 5a). The estimated transition probabilities from overweight to obese were characterized by the persistent inequality hypothesis and were somewhat similar among all ethnic groups (see Figure 5a).
For males, interethnic differences in estimated transition probabilities from normal to underweight were supported by the cumulative advantage (disadvantage) hypothesis (see Figure 5b). The cumulative advantage (disadvantage) hypothesis was also supported for the Black–White gap and, to a lesser extent, for the Hispanic–White gap in the estimated transition probabilities associated with drastic declines in weight (from overweight to underweight and from obese to underweight) (see Figure 5b).
Figure 6. The estimated transition probabilities from normal weight to obese confirmed the cumulative advantage (disadvantage) hypothesis (see Figure 6).
4.3.1. War Baby (WB) Cohort
For males, the aging-as-leveler hypothesis was supported for Black–White differences in the estimated transition probabilities from normal weight to overweight, as evidenced by the slightly converging trends (see Figure 7). The estimated transition probabilities from normal weight to overweight were very similar between White and Hispanic males (see Figure 7). Interethnic differences in estimated transition probabilities associated with weight gain were characterized by the cumulative advantage (disadvantage) hypothesis (see Figure 7). The estimated transition probabilities from overweight to obese were very similar between Black and White males, while the Hispanic–White gap was characterized by the aging-as-leveler hypothesis, as evidenced by the slight converging trend (see Figure 7).
For females, interethnic differences in the estimated transition probabilities from normal weight to obese supported the persistent inequality hypothesis (see Figure 8). The cumulative advantage (disadvantage) hypothesis was supported for Black–White and, to a much lesser extent, Hispanic–White gap in the estimated transition probabilities from normal weight to obese for females (see Figure 8). To a much lesser extent, the cumulative advantage (disadvantage) was also supported for interethnic differences in the estimated transition probabilities from overweight to obese (see Figure 8).
4.3.2. Early Baby Boomer (EBB) Cohort
For males, the Hispanic–White gap in estimated transition probabilities from normal to underweight confirmed the aging-as-leveler hypothesis (see Figure 9). It is also worth noting that these estimated transition probabilities from normal to underweight and from obese to underweight were highest among Hispanic populations, followed by White and Black populations (see Figure 9).
To a lesser extent, the estimated transition probabilities from overweight to obese confirmed the aging-as-leveler hypothesis for White males and Hispanic males and, to a much lesser extent, the cumulative advantage (disadvantage) hypothesis for Black males and White males (see Figure 9). The estimated transition probabilities from normal to underweight were somewhat higher among Black males when compared to their Hispanic and White counterparts (see Figure 9). To a much lesser extent, the aging-as-leveler hypothesis was confirmed for the Hispanic–White gap in estimated transition probabilities from normal to underweight for females.
For females, the estimated transition probabilities from normal to overweight provided support for the persistent inequality hypothesis for the Black–White gap and, to a lesser extent, the cumulative advantage (disadvantage) hypothesis for the Hispanic–White gap (see Figure 10). Interethnic differences in the estimated transition probabilities among females associated with drastic weight gain were confirmed by the cumulative advantage (disadvantage) hypothesis (see Figure 10). To a lesser extent, the Black–White gap in the estimated transition probabilities from overweight to obese was confirmed by the cumulative advantage (disadvantage) hypothesis (see Figure 10). The estimated transition probabilities from overweight to obese were somewhat higher among Black females when compared to their Hispanic and White counterparts (see Figure 10).
4.3.3. Mid Baby Boomer (MBB) Cohort
Among males from the MBB cohort, the estimated transition probabilities associated with weight gain were slightly higher among White populations, followed by Hispanic and Black populations (see Figure 11). White and Hispanic males had somewhat higher estimated transition probabilities from normal weight to obese and from overweight to obese than their Black counterparts (see Figure 11).
Figure 12. Likewise, the estimated transition probabilities from normal weight to obese confirmed the persistent inequality hypothesis for the Hispanic–White gap and the cumulative advantage (disadvantage) hypothesis for the Black–White gap (see Figure 12). To a lesser extent, the cumulative advantage (disadvantage) hypothesis was supported for interethnic differences in estimated transition probabilities from overweight to obese for females (see Figure 12).
5. Conclusions
This is an important and innovative area of research because it seeks to use multistate life tables to study how transitions among BMI statuses differ across race/ethnicity and gender using a comprehensive longitudinal dataset. This study is timely and warranted at a time of increasing numbers of older Americans and their growing diversity [44]. Results from multistate life tables suggested that the impact of cumulative advantage (disadvantage) and aging-as-leveler on transitions among BMI states were shaped along racial/ethnic–gender and cohort lines. Because overweight/obesity and underweight in older adults may pose a particular challenge for health systems, reducing overweight/obesity and underweight among older adults should remain a public health priority. Identification of the risk factors pertaining to overweight/obesity or underweight based on age/period and cohorts will provide guidance to policymakers and practitioners as they design and customize programs to meet the specific needs of older adults in different racial/ethnic–gender and cohort groups.
Findings implied that the age/period effect is revealed in all cohorts even though the effects of cohort membership vary by race/ethnicity–gender. The cumulative advantage (disadvantage) hypothesis was supported for all cohorts for transitions associated with weight gain and, for some cohorts, for transitions associated with weight loss. The aging-as-leveler hypothesis was also supported for a few transitions associated with weight loss and weight gain. In general, the estimated transition probabilities associated with weight gain were relatively higher than the estimated transition probabilities associated with weight loss.
The main findings were the substantial increase in the estimated probabilities associated with weight gain increased among minorities (Black and Hispanic males and females) for most (except for the MBB) cohorts over the period 1992–2014. For the AHEAD, CODA, HRS, and EBB cohorts, the age/period effects on BMI transitions were stronger among Hispanic populations (especially males) for most transitions associated with weight gain. This finding implied that Black and Hispanic populations were more likely to suffer the adverse consequences of overweight and obesity, such as diabetes, liver problems, high blood pressure, high cholesterol, the lack of physical fitness, and other types of cancer as they age. In general, findings from this study were in line with studies that found higher percentages of obesity among Black and Hispanic populations and higher odds of obesity among Black populations [24,29]. Nevertheless, findings also revealed that the dynamics of the increase in overweight/obesity differed for recent cohorts. Relative to cohorts born between the end of the nineteenth century and the early 1950s, White males from the most recent cohort (i.e., the MBB cohort) tended to have higher estimated probabilities of transitions associated with weight gain. Likewise, White males from the HRS cohort had lower transition probabilities from normal weight to overweight than their Hispanic counterparts.
Findings from this study suggested that health programs to reduce, prevent, delay, or reverse the progression of overweight/obesity may be important in improving health outcomes and in closing racial/ethnic disparities in body mass. Some awareness was already apparent, as evidenced by various strategies for weight management and weight loss for obese older adults [45,46]. Nevertheless, the appropriateness and effectiveness of overweight/obesity treatment for older adults remain questionable because weight loss may lead detrimental to muscle strength and bone mass and bone mineral density [47]. Therefore, safe and effective weight loss strategies for overweight/obese older adults should be exercised with care [4]. These strategies should be accompanied by efforts to increase physical activity and fitness, delay and prevent physical disability, improve dietary habits, and preserve muscle mass for older adults [4]. Implementing public education programs to reduce lifestyle risk factors may be another possible avenue to reduce the disease burden associated with overweight/obesity. These efforts should begin at an early age and should focus on ethnic minorities (i.e., Black and Hispanic populations) as well as White populations from recent cohorts.
Despite their low estimated transition probabilities, the cumulative advantage (disadvantage) hypothesis was also supported for Black–White and Hispanic–White differences in transitions associated with weight loss. Given the potential threat to public health caused by underweight among older adults, efforts to identify individuals at risk of malnutrition should begin during middle age or young adulthood so that appropriate interventions can be implemented. The higher transition probabilities associated with weight loss or drastic weight loss (i.e., from overweight to underweight or from obese to underweight) among men and women (especially Black and Hispanic populations) from earlier cohorts (i.e., AHEAD, CODA, and HRS) might be due in part to the effects of illness, including the loss of appetite, undernourishment, impaired dentition, decline in gastrointestinal motor functioning, decline in sensory functioning (taste and smell), grief and depression associated with widowhood and loss of social support system, or accelerated bone and muscle loss. To ensure successful aging and to minimize the negative consequences associated with underweight and weight loss, registered nutritionists, dietitians, and healthcare professionals should focus on the prevention of undernutrition among older cohorts. Priority should be given to individuals from earlier cohorts and ethnic minorities (especially Black and Hispanic groups).
6. Potential Limitations
Interpretation of these results, however, should also consider the limitations of the study. BMI is the only indicator of body weight in the HRS. Even though BMI is also an important indicator of health outcomes [48], it may not be the most appropriate measure of obesity [40]. One important limitation associated with BMI is its inability to distinguish between fat mass and fat-free mass [49]. Waist circumference (WC), a measure of adiposity that takes accumulated abdominal fat into account, is as good, or even better, as a measure of obesity and other health outcomes than BMI [49,50]. Nevertheless, the HRS does not provide information on body fat and waist circumference.
Another related limitation is that BMI is derived from self-reported weight and height among older adults who participated in the HRS. A recent study by [51] attempts to compare self-reported and measured values of height, weight, and BMI; the authors reveal that both men and women have a tendency to underreport their height while the reverse is true for weight and BMI. Two other studies find that, when compared to males, females are more likely to underreport their BMI values [52] but overreport their weight [53]. This is especially so for Black women [52]. The underreport of BMI among Black women may have increased the interethnic BMI gaps for transitions associated with weight gain and attenuated such gaps for transitions associated with weight loss. An earlier study by [52] also finds that White populations are more likely than Black and Hispanic populations to underreport their BMI values. The underreport of BMI among White populations may have attenuated the interethnic BMI gaps for transitions associated with weight gain and increased such gaps for transitions associated with weight loss.
Another concern with this study is that missing data due to nonresponse and selective mortality may change the sociodemographic (e.g., race/ethnicity, education, sex, etc.) compositions of a given cohort even though individuals need not have the same number of BMIs under the growth curve modeling approach. Potential selection bias due to nonresponse can be adjusted using weights provided by the Health and Retirement Study in order to make this longitudinal survey more representative of the older adult population in the United States [54]. It is also a reasonable assumption that, as Black individuals are disproportionately affected by the selection mortality processes [37], this process may have attenuated the Black–White BMI gaps since BMIs tend to be higher among Black participants [55,56]. As shown in Appendix A, the percentages of missing cases of the race/ethnicity and gender variables gradually increased for the latter cohorts but remained small, implying that the effects of missing data on coefficients estimates of growth curve modeling may be negligible.
Finally, researchers designing aging and health surveys should consider including racial categories such as Asian, Pacific Islander, and Native American populations. This would allow future studies to examine whether and how estimated transition probabilities associated with both weight gain and weight loss differ between White populations and the three racial groups.
Funding
This research received no external funding.
Institutional Review Board Statement
Not applicable.
Informed Consent Statement
Not applicable.
Data Availability Statement
No new data were created or analyzed in this study. Data sharing is not applicable to this article.
Conflicts of Interest
The author certifies that no conflict of interest exists regarding this manuscript and there is no connection, financial or otherwise, that might imply or introduce bias in any aspect of my work in review of the manuscript. This manuscript has not been considered for publication elsewhere. No similar works have been submitted elsewhere.
Appendix A

Table A1.
Percentages of missing cases by race/ethnicity and gender, 2016 HRS Tracker File.
| Variables | AHEAD (1890–1923) | CODA (1924–1930) | HRS (1931–1941) |
| Race/Ethnicity | 0.243% | 1.426% | 1.494% |
| Gender | 0.000% | 0.000% | 0.000% |
| N | 7819 | 4277 | 10,645 |
| Variables | WB (1942–1947) | EBB (1948–1953) | MBB (1954–1959) |
| Race/Ethnicity | 1.374% | 2.183% | 3.541% |
| Gender | 0.081% | 0.041% | 0.019% |
| N | 3712 | 4901 | 5224 |
References
- Fakhouri, T.H.; Ogden, C.L.; Carroll, M.D.; Kit, B.K.; Flegal, K.M. Prevalence of obesity among older adults in the United States, 2007–2010. NCHS Data Brief. 2012, 106, 1–8. [Google Scholar]
- Kritchevsky, S.B. Taking Obesity in Older Adults Seriously. J. Gerontol. A Biol. Sci. Med. Sci. 2017, 73, 57–58. [Google Scholar] [CrossRef] [PubMed] [Green Version]
- Wang, Y.; Beydoun, M.A. The obesity epidemic in the United States—Gender, age, socioeconomic, racial/ethnic, and geographic characteristics: A systematic review and meta-regression analysis. Epidemiol. Rev. 2007, 29, 6–28. [Google Scholar] [CrossRef] [PubMed]
- Chapman, I.M. Obesity paradox during aging. In Body Composition and Aging; Mobb, C.V., Hof, P.R., Eds.; Karger Publishers: New York, NY, USA, 2010; pp. 20–36. [Google Scholar]
- Janssen, I. Morbidity and mortality risk associated with an overweight BMI in older men and women. Obesity 2007, 15, 1827–1840. [Google Scholar] [CrossRef] [PubMed] [Green Version]
- Lu, J.L.; Molnar, M.Z.; Naseer, A.; Mikkelsen, M.K.; Kalantar-Zadeh, K.; Kovesdy, C.P. Association of age and BMI with kidney function and mortality: A cohort study. Lancet Diabetes Endocrinol. 2015, 3, 704–714. [Google Scholar] [CrossRef] [Green Version]
- Sardinha, L.B.; Cyrino, E.S.; Dos Santos, L.; Ekelund, U.; Santos, D.A. Fitness but not weight status is associated with projected physical independence in older adults. Age 2016, 38, 54. [Google Scholar] [CrossRef] [Green Version]
- Atti, A.R.; Palmer, K.; Volpato, S.; Winblad, B.; De Ronchi, D.; Fratiglioni, L. Late-life body mass index and dementia incidence: Nine-year follow-up data from the Kungsholmen Project. J. Am. Geriatr. Soc. 2008, 56, 111–116. [Google Scholar] [CrossRef]
- Chen, Y.C.; Chen, T.F.; Yip, P.K.; Hu, C.Y.; Chu, Y.M.; Chen, J.H. Body mass index (BMI) at an early age and the risk of dementia. Arch. Gerontol. Geriatr. 2010, 50, S48–S52. [Google Scholar] [CrossRef]
- Franklin, C.A.; Karkeck, J. Weight loss and senile dementia in an institutionalized elderly population. J. Am. Diet. Assoc. 1989, 89, 790–792. [Google Scholar]
- De Laet, C.; Kanis, J.A.; Odén, A.; Johanson, H.; Johnell, O.; Delmas, P.; Eisman, J.A.; Kroger, H.; Fujiwara, S.; Garnero, P.; et al. Body mass index as a predictor of fracture risk: A meta-analysis. Osteoporos. Int. 2005, 16, 1330–1338. [Google Scholar] [CrossRef]
- Pruzansky, M.E.; Turano, M.; Luckey, M.; Senie, R. Low body weight as a risk factor for hip fracture in both black and white women. J. Orthop. Res. 1989, 7, 192–197. [Google Scholar] [CrossRef] [PubMed]
- An, R.; Shi, Y. Body weight status and onset of functional limitations in US middle-aged and older adults. Disabil. Health J. 2015, 8, 336–344. [Google Scholar] [CrossRef]
- Park, D.; Lee, J.H.; Han, S. Underweight: Another risk factor for cardiovascular disease? A cross-sectional 2013 Behavioral Risk Factor Surveillance System (BRFSS) study of 491,773 individuals in the USA. Medicine 2017, 96, e8769. [Google Scholar] [CrossRef] [PubMed]
- Coin, A.; Sergi, G.; Beninca, P.; Lupoli, L.; Cinti, G.; Ferrara, L.; Benedetti, G.; Tomasi, G.; Pisent, C.; Enzi, G. Bone mineral density and body composition in underweight and normal elderly subjects. Osteoporos. Int. 2000, 11, 1043–1050. [Google Scholar] [CrossRef]
- Lee, H.S. Prevalence of osteopenia/osteoporosis and related risk factors of men aged 50 years and older: Korea National Health and Nutrition Examination Survey 2010–2011 data. J. Korean Diet. Assoc. 2016, 22, 106–117. [Google Scholar] [CrossRef] [Green Version]
- Kim, Y.H.; Kim, S.M.; Han, K.D.; Son, J.W.; Lee, S.S.; Oh, S.W.; Lee, W.Y.; Yoo, S.J.; Taskforce Team of the Obesity Fact Sheet of the Korean Society for the Study of Obesity. Change in weight and body mass index associated with all-cause mortality in Korea: A nationwide longitudinal study. J. Clin. Endocrinol. Metab. 2017, 102, 4041–4050. [Google Scholar] [CrossRef] [PubMed]
- Roh, L.; Braun, J.; Chiolero, A.; Bopp, M.; Rohrmann, S.; Faeh, D. Mortality risk associated with underweight: A census-linked cohort of 31,578 individuals with up to 32 years of follow-up. BMC Public Health 2014, 14, 371. [Google Scholar] [CrossRef] [Green Version]
- Wang, M.; Yi, Y.; Roebothan, B.; Colbourne, J.; Maddalena, V.; Sun, G.; Wang, P.P. Trajectories of body mass index among Canadian seniors and associated mortality risk. BMC Public Health 2017, 17, 929. [Google Scholar] [CrossRef]
- Tran, M.K.; Krueger, P.M.; McCormick, E.; Davidson, A.; Main, D.S. Body mass transitions through childhood and early adolescence: A multistate life table approach. Am. J. Epidemiol. 2016, 183, 643–649. [Google Scholar] [CrossRef] [Green Version]
- Basu, A. Forecasting distribution of body mass index in the United States: Is there more room for growth? Med. Decis. Mak. 2010, 30, E1–E11. [Google Scholar] [CrossRef]
- Hillemeier, M.M.; Weisman, C.S.; Chuang, C.; Downs, D.S.; McCall-Hosenfeld, J.; Camacho, F. Transition to overweight or obesity among women of reproductive age. J. Womens Health 2011, 20, 703–710. [Google Scholar] [CrossRef] [PubMed] [Green Version]
- Maddah, M.; Eshraghian, M.R.; Djazayery, A.; Mirdamadi, R. Association of body mass index with educational level in Iranian men and women. Eur. J. Clin. Nutr. 2003, 57, 819–823. [Google Scholar] [CrossRef]
- Kuchibhatla, M.N.; Fillenbaum, G.G.; Kraus, W.E.; Cohen, H.J.; Blazer, D.G. Trajectory classes of body mass index in a representative elderly community sample. J. Gerontol. A Biol. Sci. Med. Sci. 2012, 68, 699–704. [Google Scholar] [CrossRef] [PubMed] [Green Version]
- Zajacova, A.; Huzurbazar, S.; Greenwood, M.; Nguyen, H. Long-Term BMI trajectories and health in older adults: Hierarchical clustering of functional curves. J. Aging Health 2015, 27, 1443–1461. [Google Scholar] [CrossRef] [PubMed] [Green Version]
- Wang, M.; Yi, Y.; Roebothan, B.; Colbourne, J.; Maddalena, V.; Wang, P.P.; Sun, G. Body mass index trajectories among middle-aged and elderly Canadians and associated health outcomes. J. Environ. Public Health 2016, 2016, 7014857. [Google Scholar] [CrossRef] [PubMed] [Green Version]
- Murayama, H.; Liang, J.; Bennett, J.M.; Shaw, B.A.; Botoseneanu, A.; Kobayashi, E.; Fukaya, T.; Sinkai, S. Socioeconomic status and the trajectory of body mass index among older Japanese: A nationwide cohort study of 1987–2006. J. Gerontol. B Psychol. Sci. Soc. Sci. 2015, 71, 378–388. [Google Scholar] [CrossRef] [PubMed] [Green Version]
- Wang, Y.F.; Tang, Z.; Guo, J.; Tao, L.X.; Liu, L.; Li, H.B.; Li, D.T.; Guo, X.H.; Yang, X.H. BMI and BMI Changes to All-cause Mortality among the Elderly in Beijing: A 20-year Cohort Study. Biomed. Environ. Sci. 2017, 30, 79–87. [Google Scholar]
- Wei, L.; Wu, B. Racial and ethnic differences in obesity and overweight as predictors of the onset of functional impairment. J. Am. Geriatr. Soc. 2014, 62, 61–70. [Google Scholar] [CrossRef] [Green Version]
- Jones-Johnson, G.; Johnson, W.R.; Frishman, N. Race and gender differences in obesity and disease. Sociol. Mind 2014, 4, 233–241. [Google Scholar] [CrossRef] [Green Version]
- Shuey, K.M.; Willson, A.E. Cumulative disadvantage and black-white disparities in life-course health trajectories. Res. Aging 2008, 30, 200–225. [Google Scholar] [CrossRef]
- Warner, D.F.; Brown, T.H. Understanding how race/ethnicity and gender define age-trajectories of disability: An intersectionality approach. Soc. Sci. Med. 2011, 72, 1236–1248. [Google Scholar] [CrossRef] [PubMed] [Green Version]
- Dupre, M.E. Educational differences in age-related patterns of disease: Reconsidering the cumulative disadvantage and age-as-leveler hypotheses. J. Health Soc. Behav. 2007, 48, 1–15. [Google Scholar] [CrossRef] [PubMed]
- Stevens, E.P.; Pescatello, A. Marianismo: The Other Face of Machismo in Latin America; University of Pittsburgh Press: Pittsburgh, PA, USA, 1973; pp. 89–101. [Google Scholar]
- Gallo, L.C.; Fortmann, A.L.; McCurley, J.L.; Isasi, C.R.; Penedo, F.J.; Davglus, M.L.; Roesh, S.C.; Talavera, G.A.; Gouskova, N.; Gonzalez, F., III; et al. Associations of structural and functional social support with diabetes prevalence in US Hispanics/Latinos: Results from the HCHS/SOL Sociocultural Ancillary Study. J. Behav. Med. 2015, 38, 160–170. [Google Scholar] [CrossRef] [PubMed] [Green Version]
- Weigers, M.E.; Sherraden, M.S. A Critical Examination of Acculturation: The Impact of Health Behaviors, Social Support and Economic Resources on Birth Weight among Women of Mexican Descent 1. Int. Migr. Rev. 2001, 35, 804–839. [Google Scholar] [CrossRef]
- Sautter, J.M.; Thomas, P.A.; Dupre, M.E.; George, L.K. Socioeconomic status and the Black–White mortality crossover. Am. J. Public Health 2012, 102, 1566–1571. [Google Scholar] [CrossRef] [Green Version]
- Health and Retirement Study. Sample Sizes and Response Rates. Available online: http://hrsonline.isr.umich.edu/sitedocs/sampleresponse.pdf (accessed on 14 June 2020).
- Flicker, L.; McCaul, K.A.; Hankey, G.J.; Jamrozik, K.; Brown, W.J.; Byles, J.E.; Almeida, O.P. Body mass index and survival in men and women aged 70 to 75. J. Am. Geriatr. Soc. 2010, 58, 234–241. [Google Scholar] [CrossRef] [Green Version]
- Clark, A.E.; Taylor, J.Y.; Wu, C.Y.; Smith, J.A. Alternative methods for measuring obesity in African American women. Yale J. Biol. Med. 2013, 86, 29–39. [Google Scholar]
- Hougaard, P. Multi-state models: A review. Lifetime Data Anal. 1999, 5, 239–264. [Google Scholar] [CrossRef]
- Schoen, R. The multistate life table. In Modeling Multigroup Populations; Schoen, R., Ed.; Springer: Boston, MA, USA, 1988; pp. 63–105. [Google Scholar]
- Jackson, C. Multi-State Markov and Hidden Markov Model in Continuous Time. Available online: https://cran.r-project.org/web/packages/msm/msm.pdf (accessed on 14 June 2020).
- Ortman, J.M.; Velkoff, V.A.; Hogan, H. An aging nation: The older population in the United States. Available online: https://www.census.gov/content/dam/Census/library/publications/2014/demo/p25-1140.pdf (accessed on 14 June 2020).
- Baruth, M.; Schlaff, R.A. Behavioral Mediators of Weight Loss in Two Group-based Behavioral Interventions in Older Adults. Am. J. Health Educ. 2017, 48, 108–115. [Google Scholar] [CrossRef]
- Batsis, J.A.; Gill, L.E.; Masutani, R.K.; Adachi-Mejia, A.M.; Blunt, H.B.; Bagley, P.J.; Lopez-Jimenez, F.; Bartels, S.J. Weight loss interventions in older adults with obesity: A systematic review of randomized controlled trials since 2005. J. Am. Geriatr. Soc. 2017, 65, 257–268. [Google Scholar] [CrossRef]
- Villareal, D.T.; Apovian, C.M.; Kushner, R.F.; Klein, S. Obesity in older adults: Technical review and position statement of the American Society for Nutrition and NAASO, The Obesity Society. Obesity 2005, 13, 1849–1863. [Google Scholar] [CrossRef] [PubMed]
- Flegal, K.M.; Kit, B.K.; Orpana, H.; Graubard, B.I. Association of all-cause mortality with overweight and obesity using standard body mass index categories: A systematic review and meta-analysis. JAMA. 2013, 309, 71–82. [Google Scholar] [CrossRef] [PubMed] [Green Version]
- Seidell, J.C.; Pérusse, L.; Després, J.P.; Bouchard, C. Waist and hip circumferences have independent and opposite effects on cardiovascular disease risk factors: The Quebec Family Study. Am. J. Clin. Nutr. 2001, 74, 315–321. [Google Scholar] [CrossRef]
- Leitzmann, M.F.; Moore, S.C.; Koster, A.; Harris, T.B.; Park, Y.; Hollenbeck, A.; Schatzkin, A. Waist circumference as compared with body-mass index in predicting mortality from specific causes. PLoS ONE 2011, 6, e18582. [Google Scholar] [CrossRef] [PubMed] [Green Version]
- Flegal, K.M.; Ogden, C.L.; Fryar, C.; Afful, J.; Klein, R.; Huang, D.T. Comparisons of Self-Reported and Measured Height and Weight, BMI, and Obesity Prevalence from National Surveys: 1999–2016. Obesity 2019, 27, 1711–1719. [Google Scholar] [CrossRef]
- Wen, M.; Kowaleski-Jones, L. Sex and ethnic differences in validity of self-reported adult height, weight and body mass index. Ethn. Dis. 2012, 22, 72–78. [Google Scholar] [PubMed]
- Fernández-Rhodes, L.; Robinson, W.R.; Sotres-Alvarez, D.; Franceschini, S.F.; Buelna, C.; Moncrieft, A.; Llabre, M.; Daviglus, M.L.; Qi, Q.; Agarwal, A.; et al. Accuracy of Self-reported Weight in Hispanic/Latino Adults of the Hispanic Community Health Study/Study of Latinos. Epidemiology 2017, 28, 847–853. [Google Scholar] [CrossRef] [PubMed]
- Michaud, P.C.; Kapteyn, A.; Smith, J.P.; Van Soest, A. Temporary and permanent unit non-response in follow-up interviews of the Health and Retirement Study. Longit. Life Course Stud. 2011, 2, 145–169. [Google Scholar]
- Hendley, Y.; Zhao, L.; Coverson, D.L.; Din-Dzietham, R.; Morris, A.; Quyyumi, A.A.; Gibbons, G.H.; Vaccarino, V. Differences in weight perception among blacks and whites. J. Womens Health 2011, 20, 1805–1811. [Google Scholar] [CrossRef] [Green Version]
- Chithambo, T.P.; Huey, S.J. Black/white differences in perceived weight and attractiveness among overweight women. J. Obes. 2013, 2013, 320–326. [Google Scholar] [CrossRef]
Figure 1.
Transition probabilities associated with weight gain—males from AHEAD cohort.

Figure 2.
(a) Transition probabilities associated with weight gain—females from AHEAD cohort. (b) Transition probabilities associated with weight loss—females from AHEAD cohort.
Figure 2.
(a) Transition probabilities associated with weight gain—females from AHEAD cohort. (b) Transition probabilities associated with weight loss—females from AHEAD cohort.
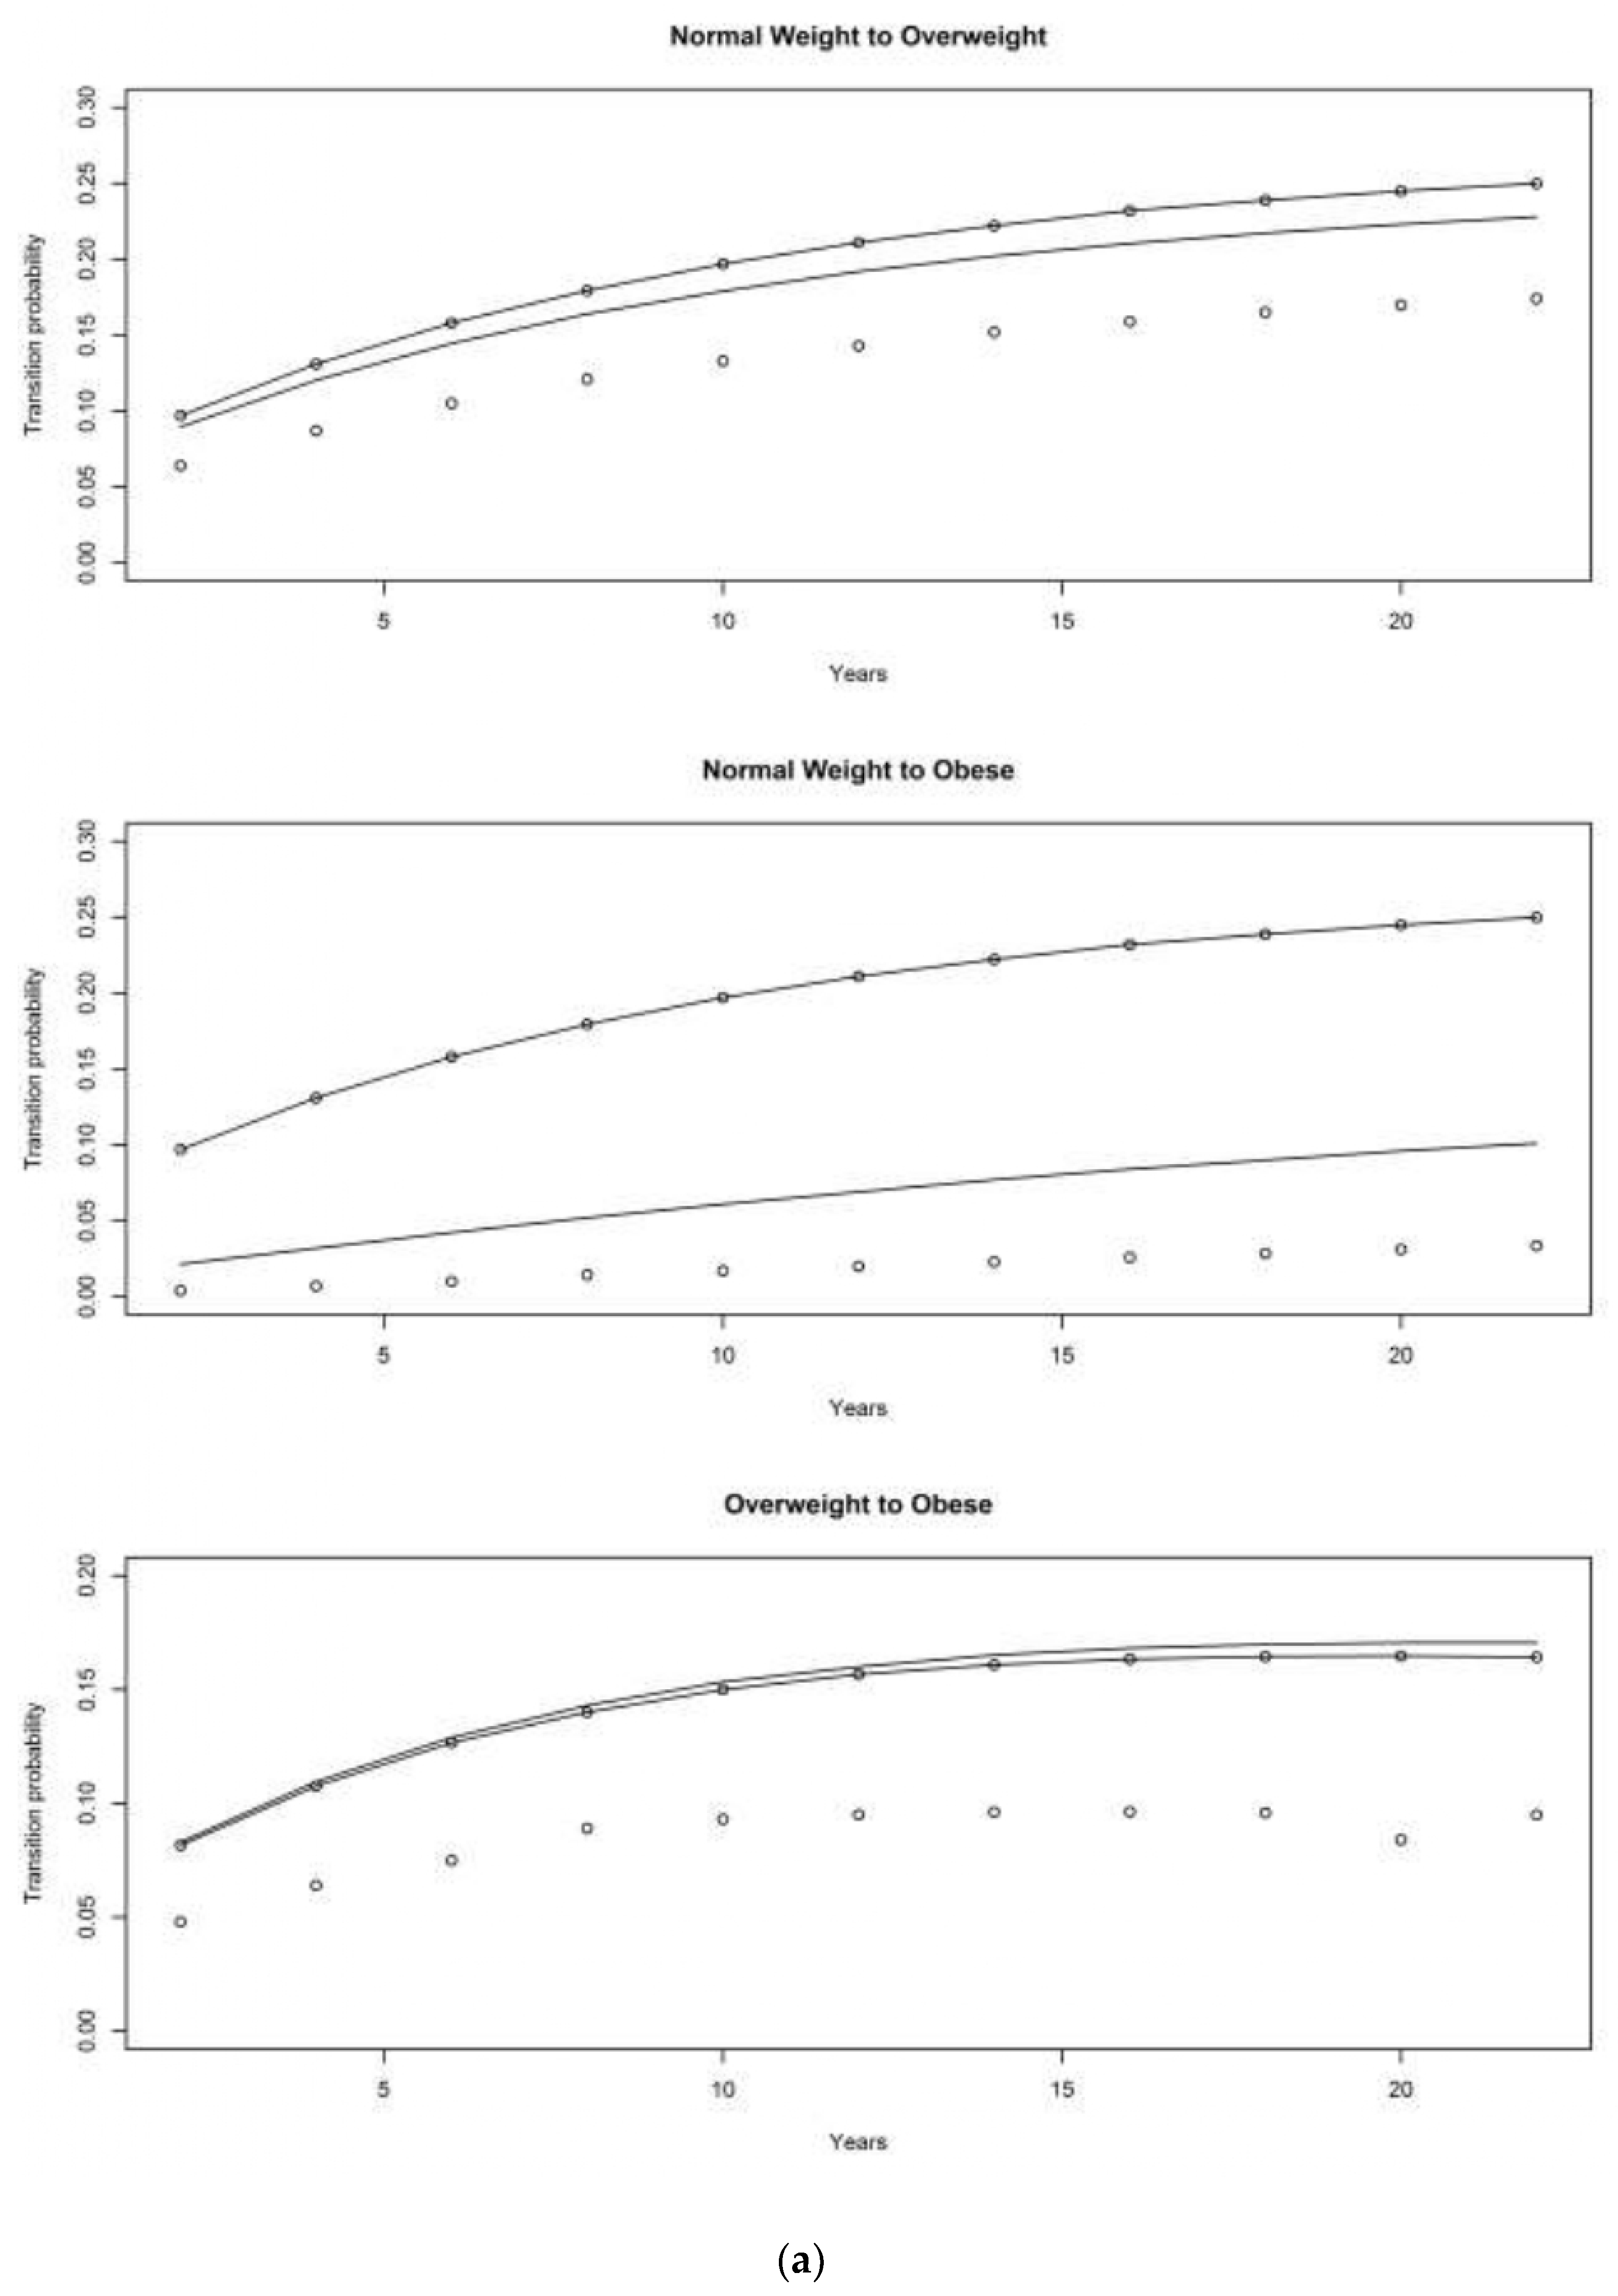

Figure 3.
Transition probabilities associated with weight gain—males from CODA cohort.
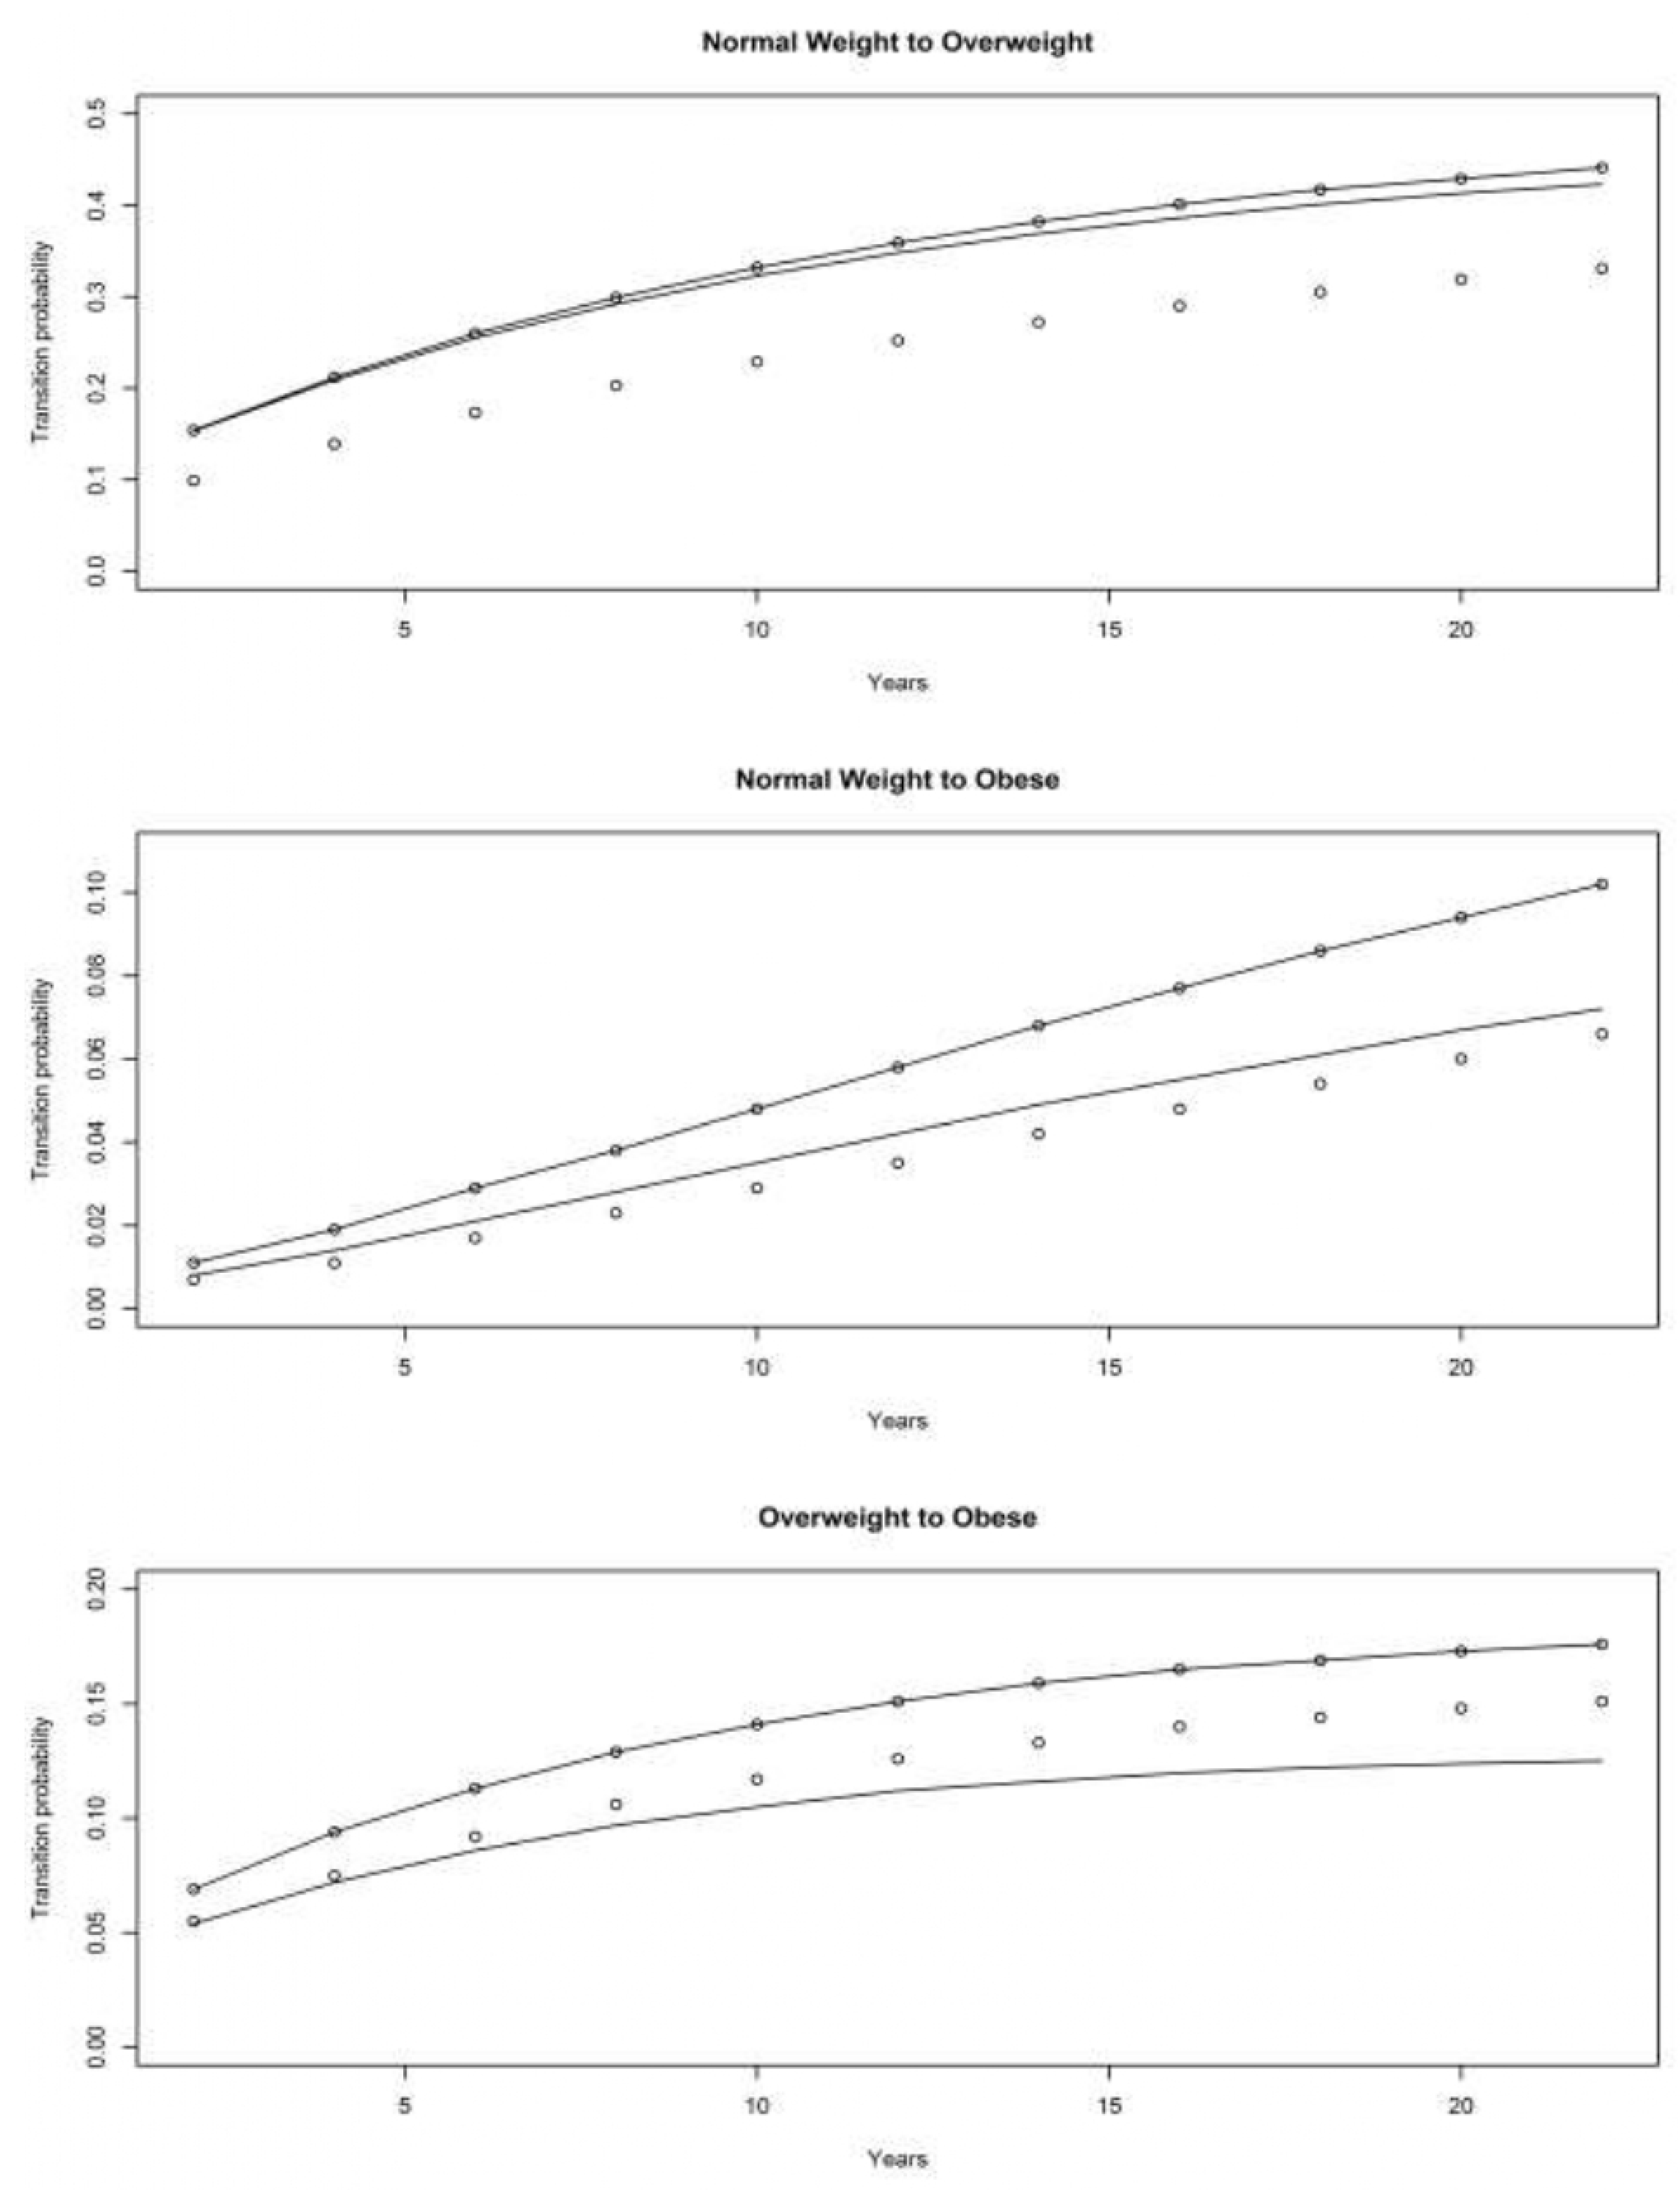
Figure 4.
(a) Transition probabilities associated with weight gain—females from CODA cohort. (b) Transition probabilities associated with weight loss—females from CODA cohort.
Figure 4.
(a) Transition probabilities associated with weight gain—females from CODA cohort. (b) Transition probabilities associated with weight loss—females from CODA cohort.
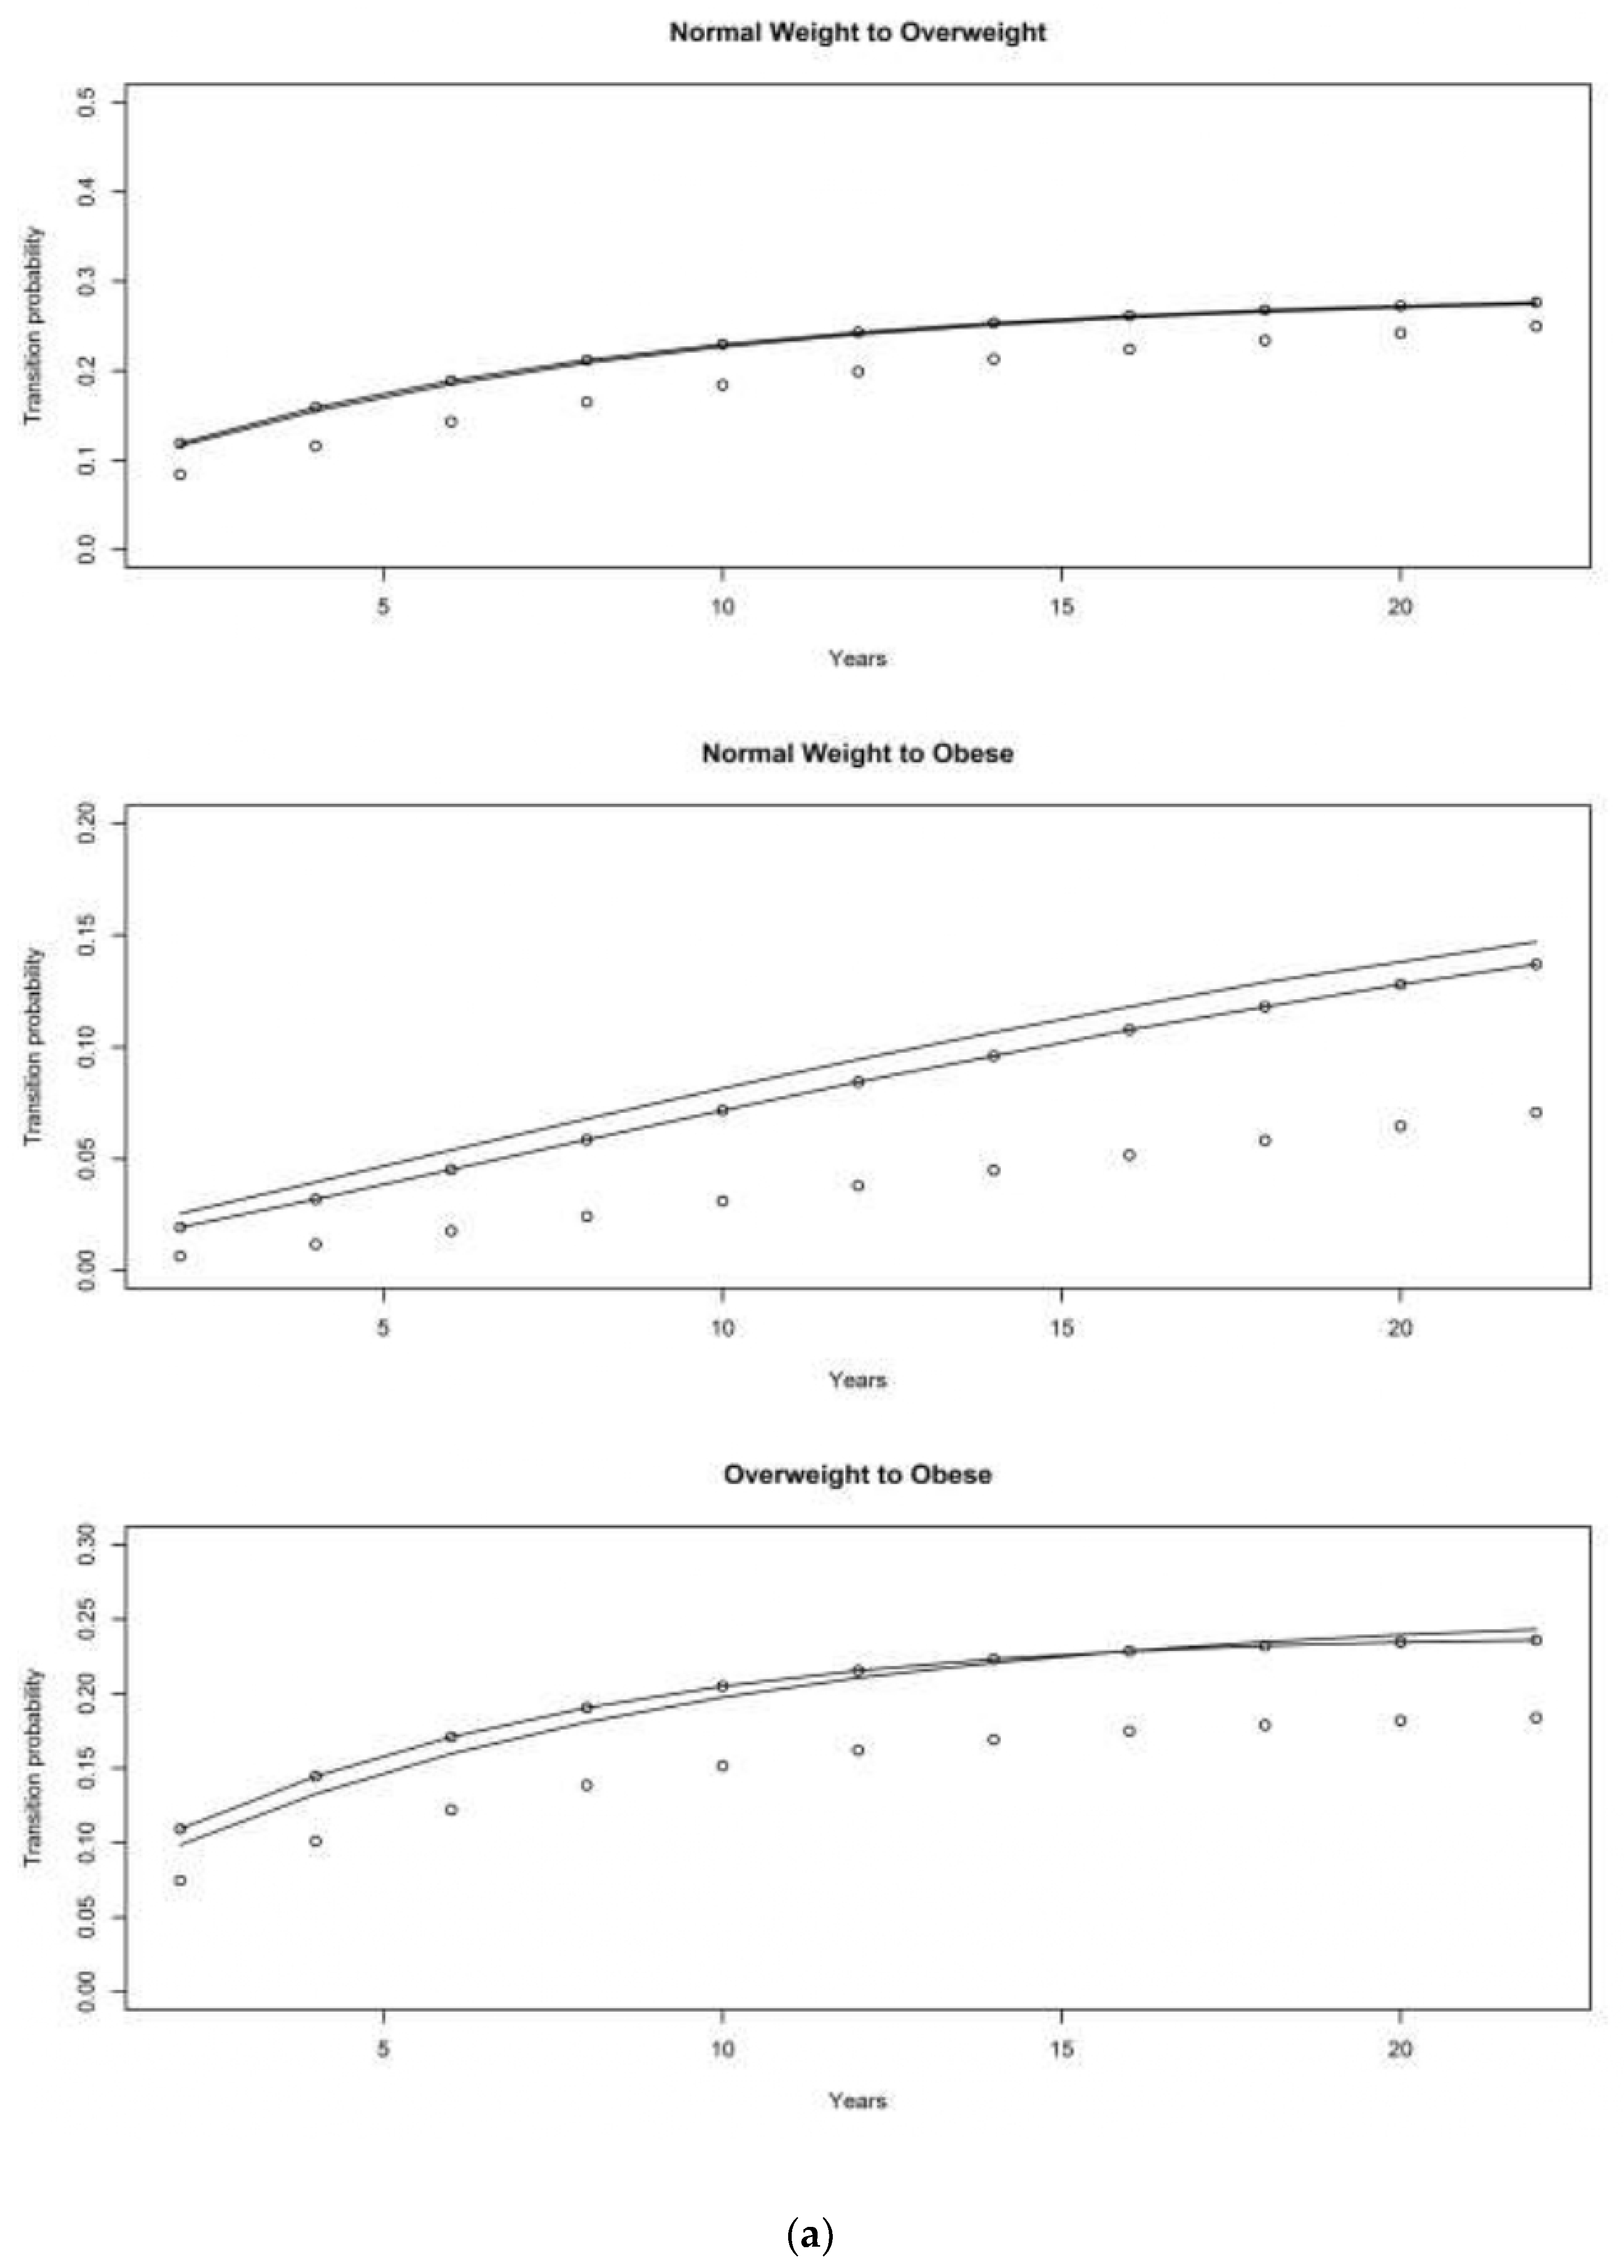
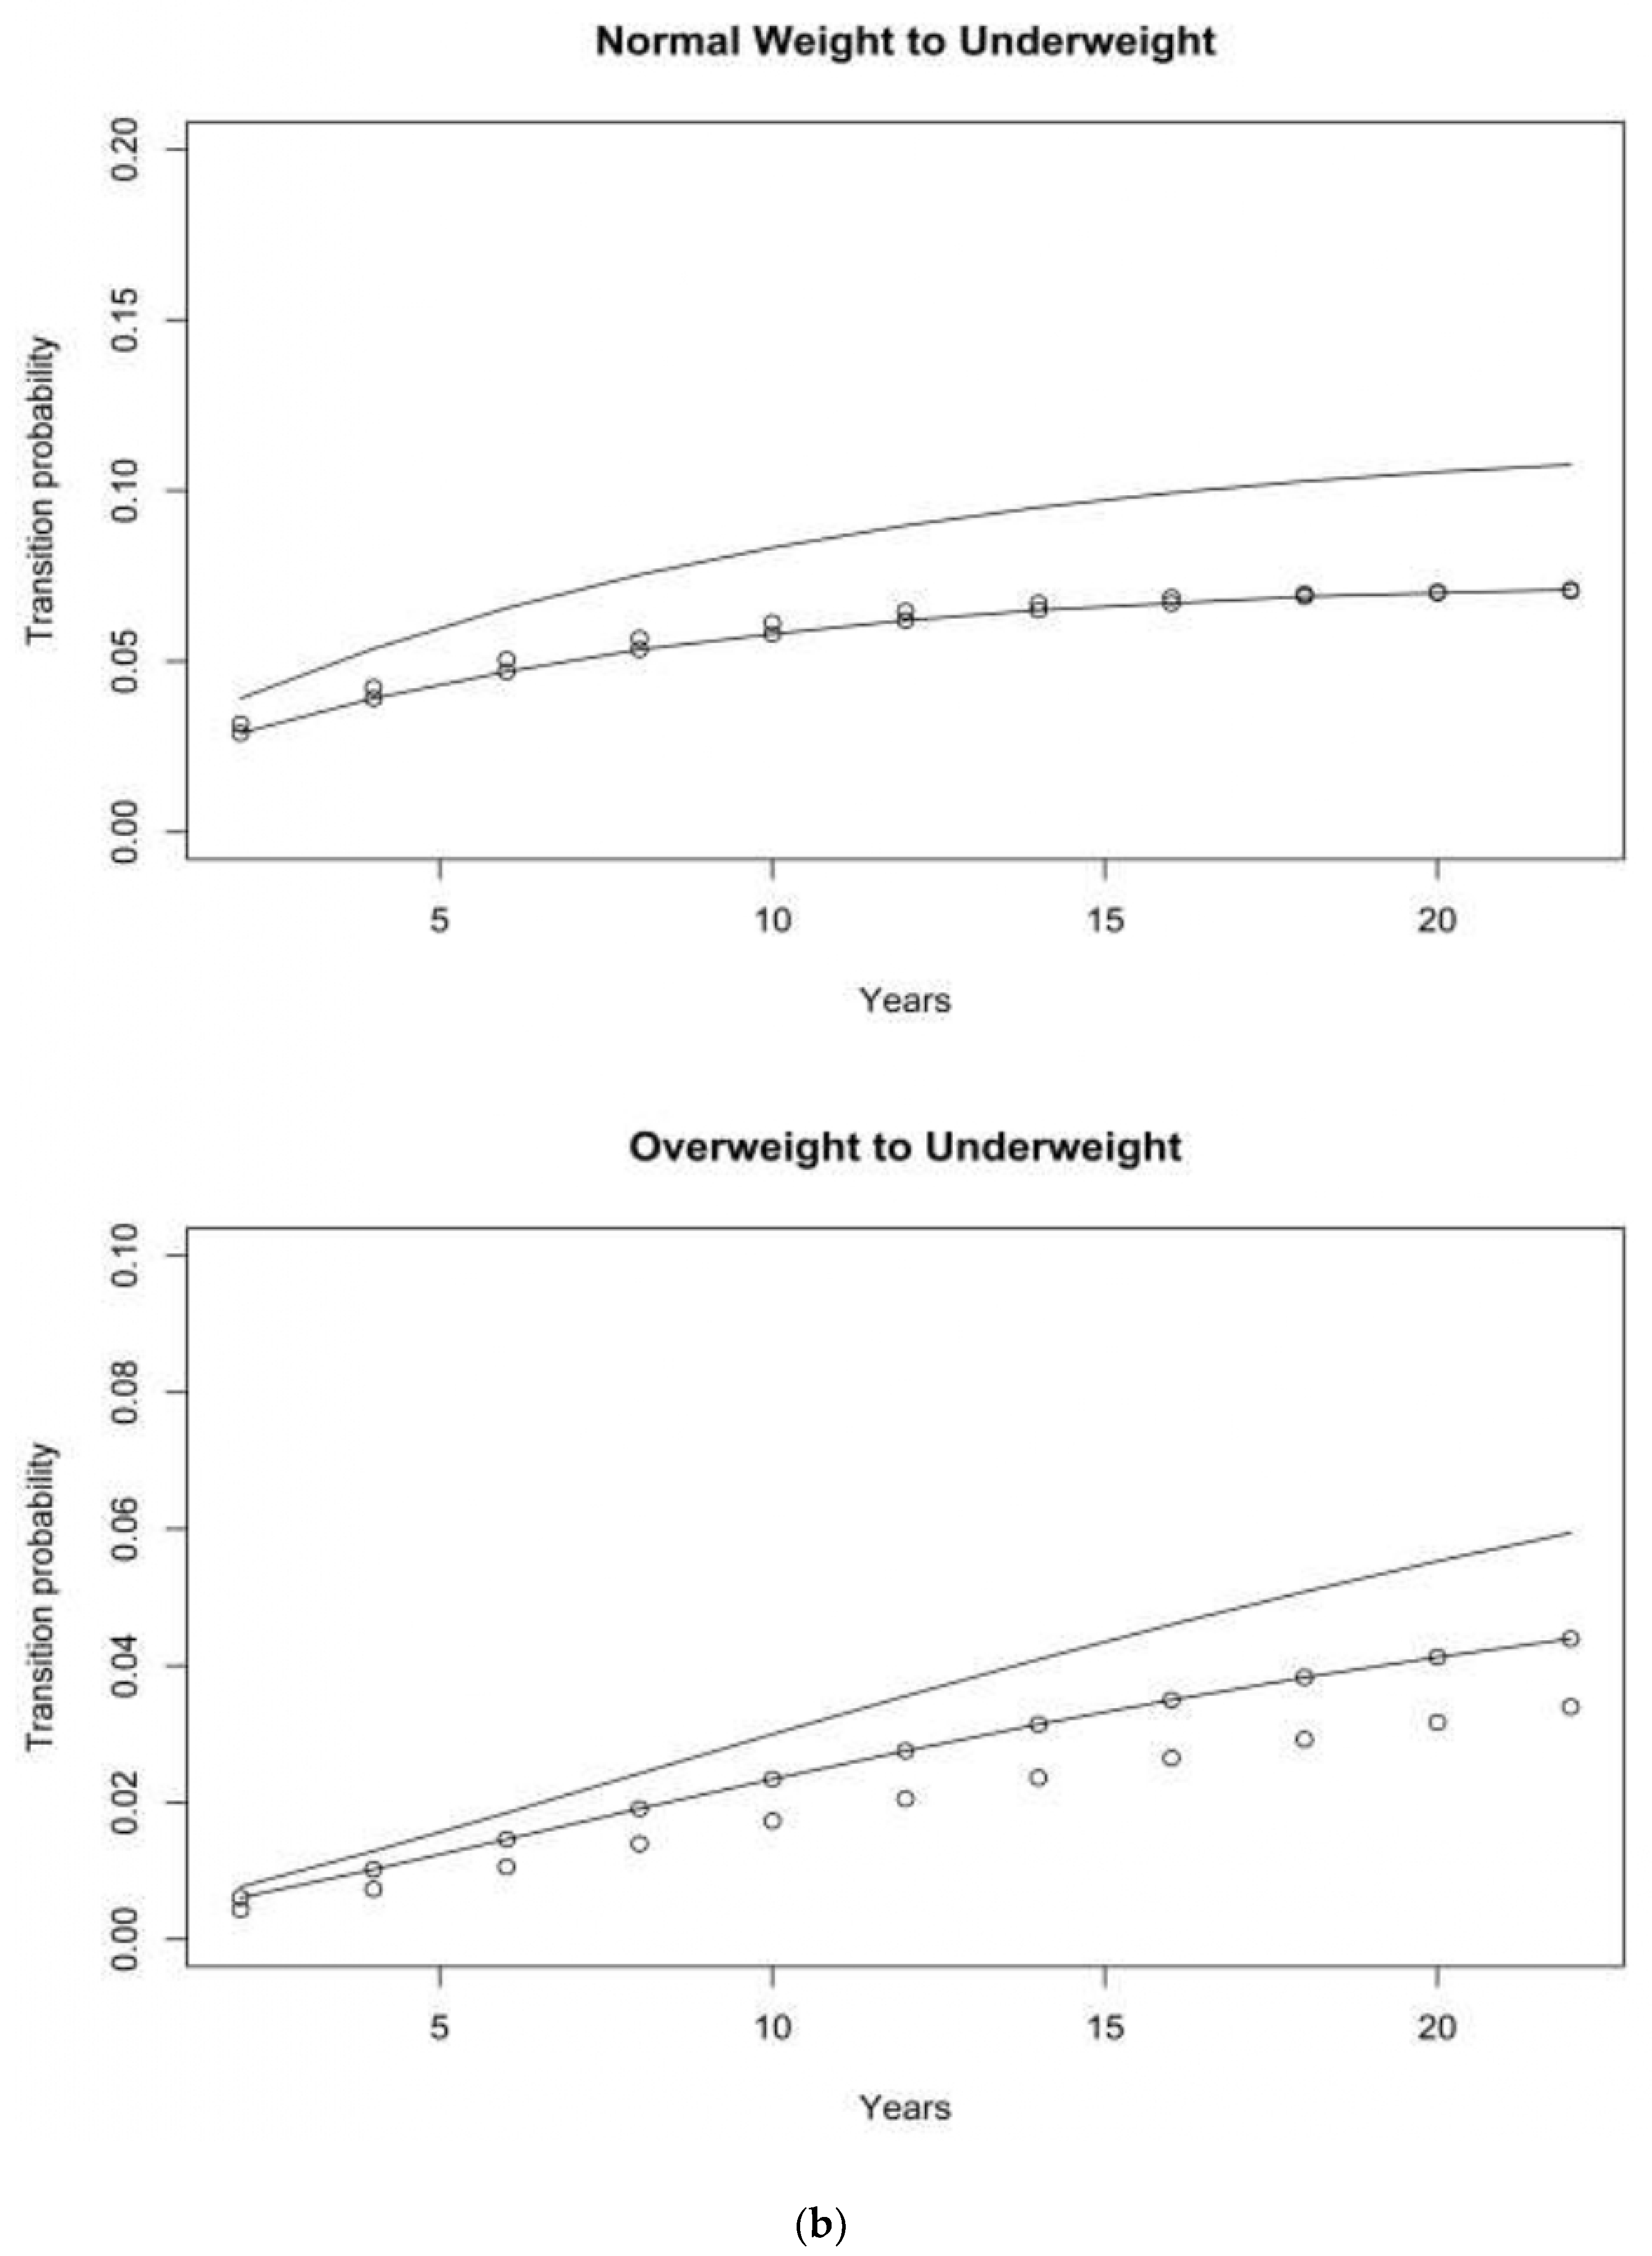
Figure 5.
(a) Transition probabilities associated with weight gain—males from HRS cohort. (b) Transition probabilities associated with weight loss—males from HRS cohort.
Figure 5.
(a) Transition probabilities associated with weight gain—males from HRS cohort. (b) Transition probabilities associated with weight loss—males from HRS cohort.
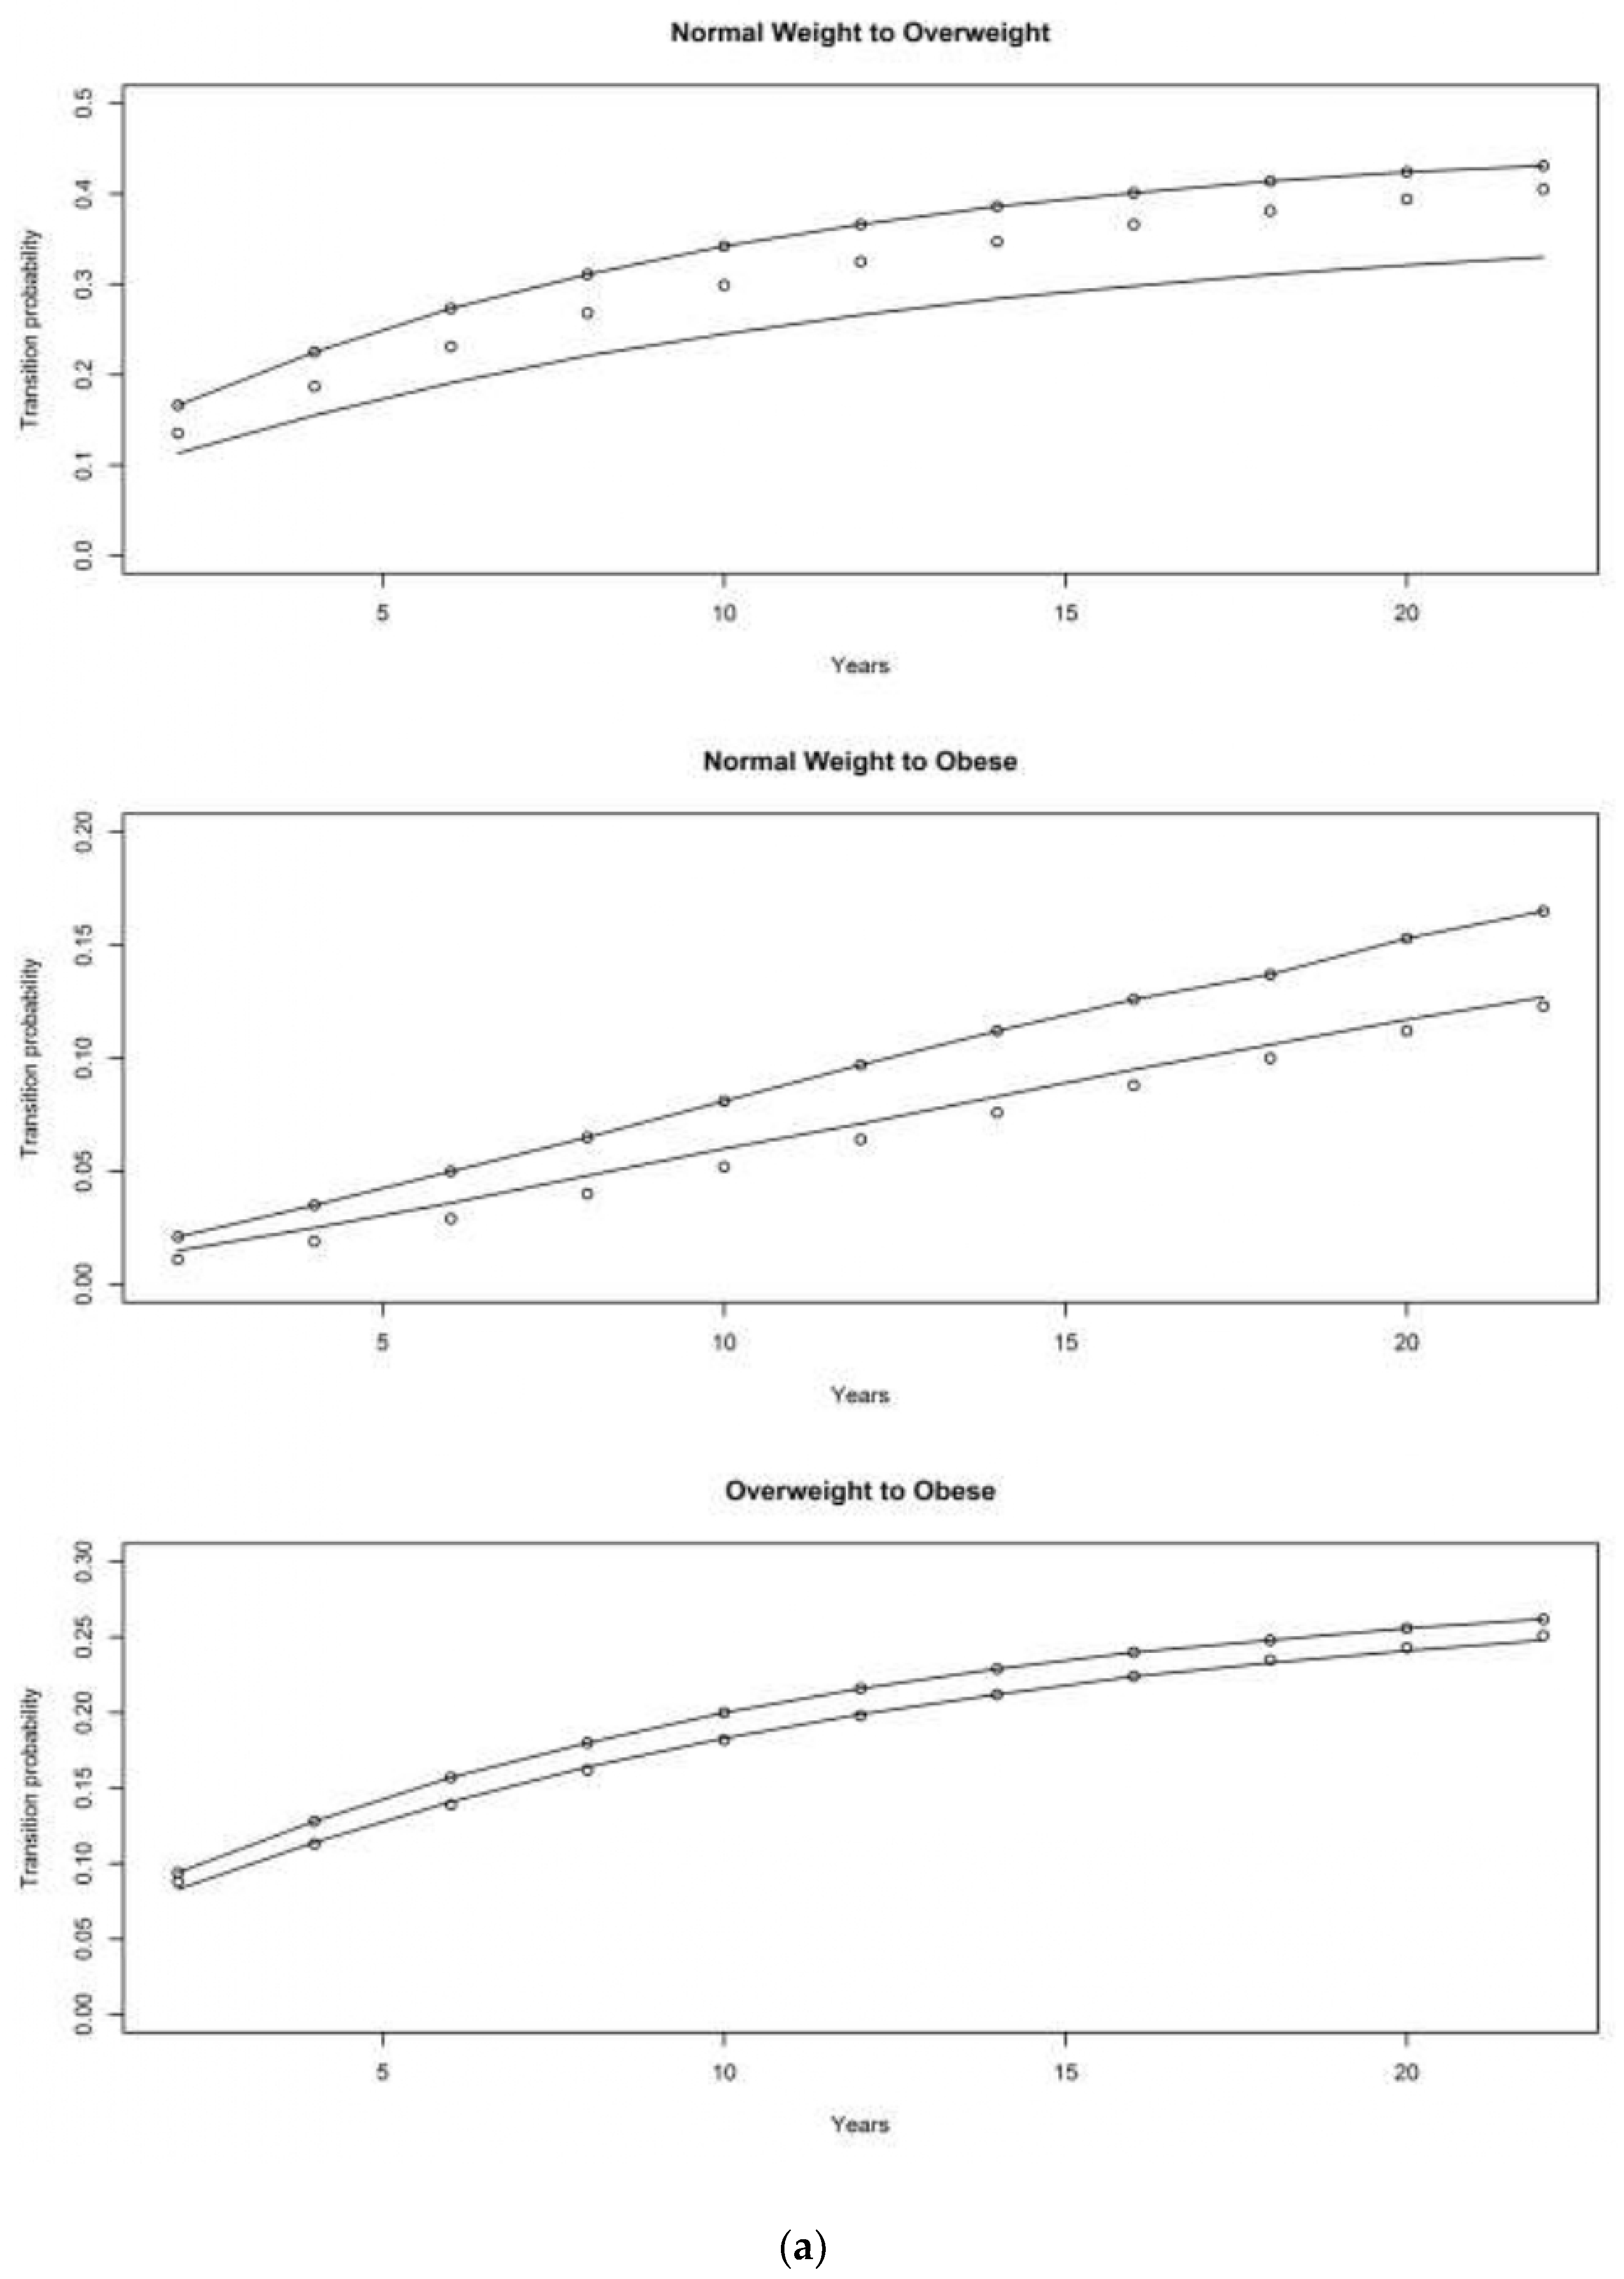
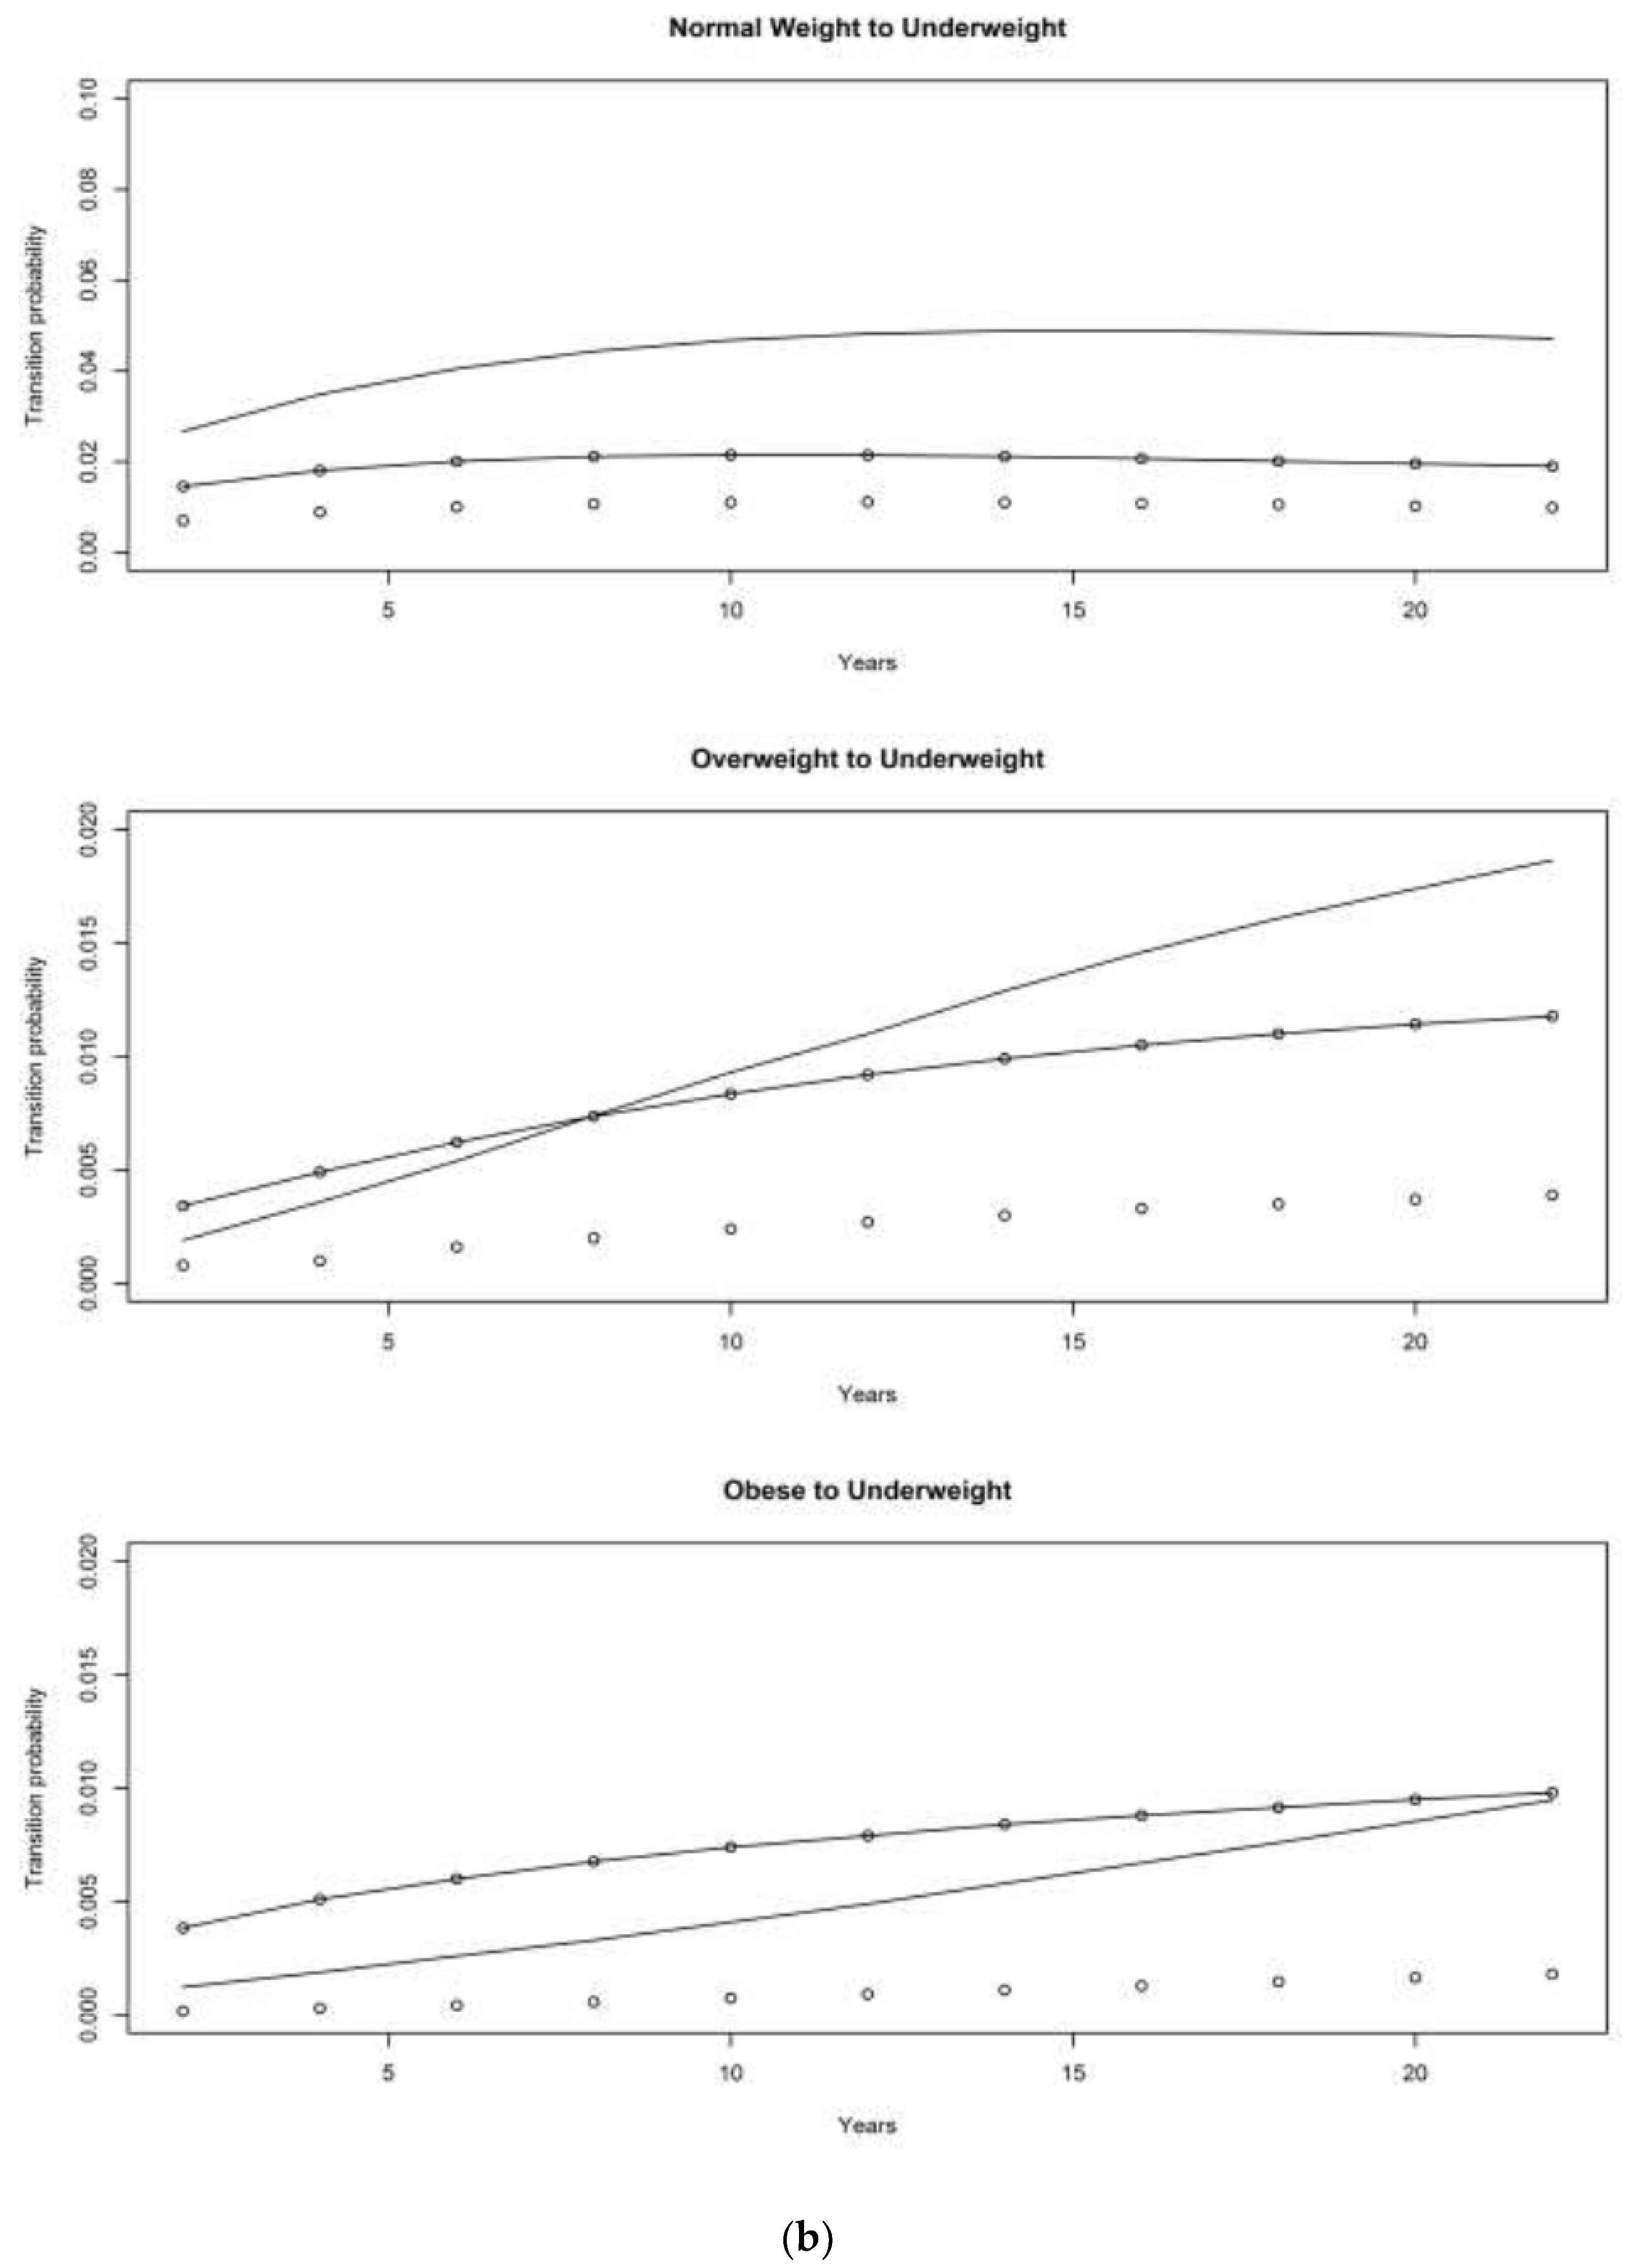
Figure 6.
Transition probabilities associated with weight gain—females from HRS cohort.
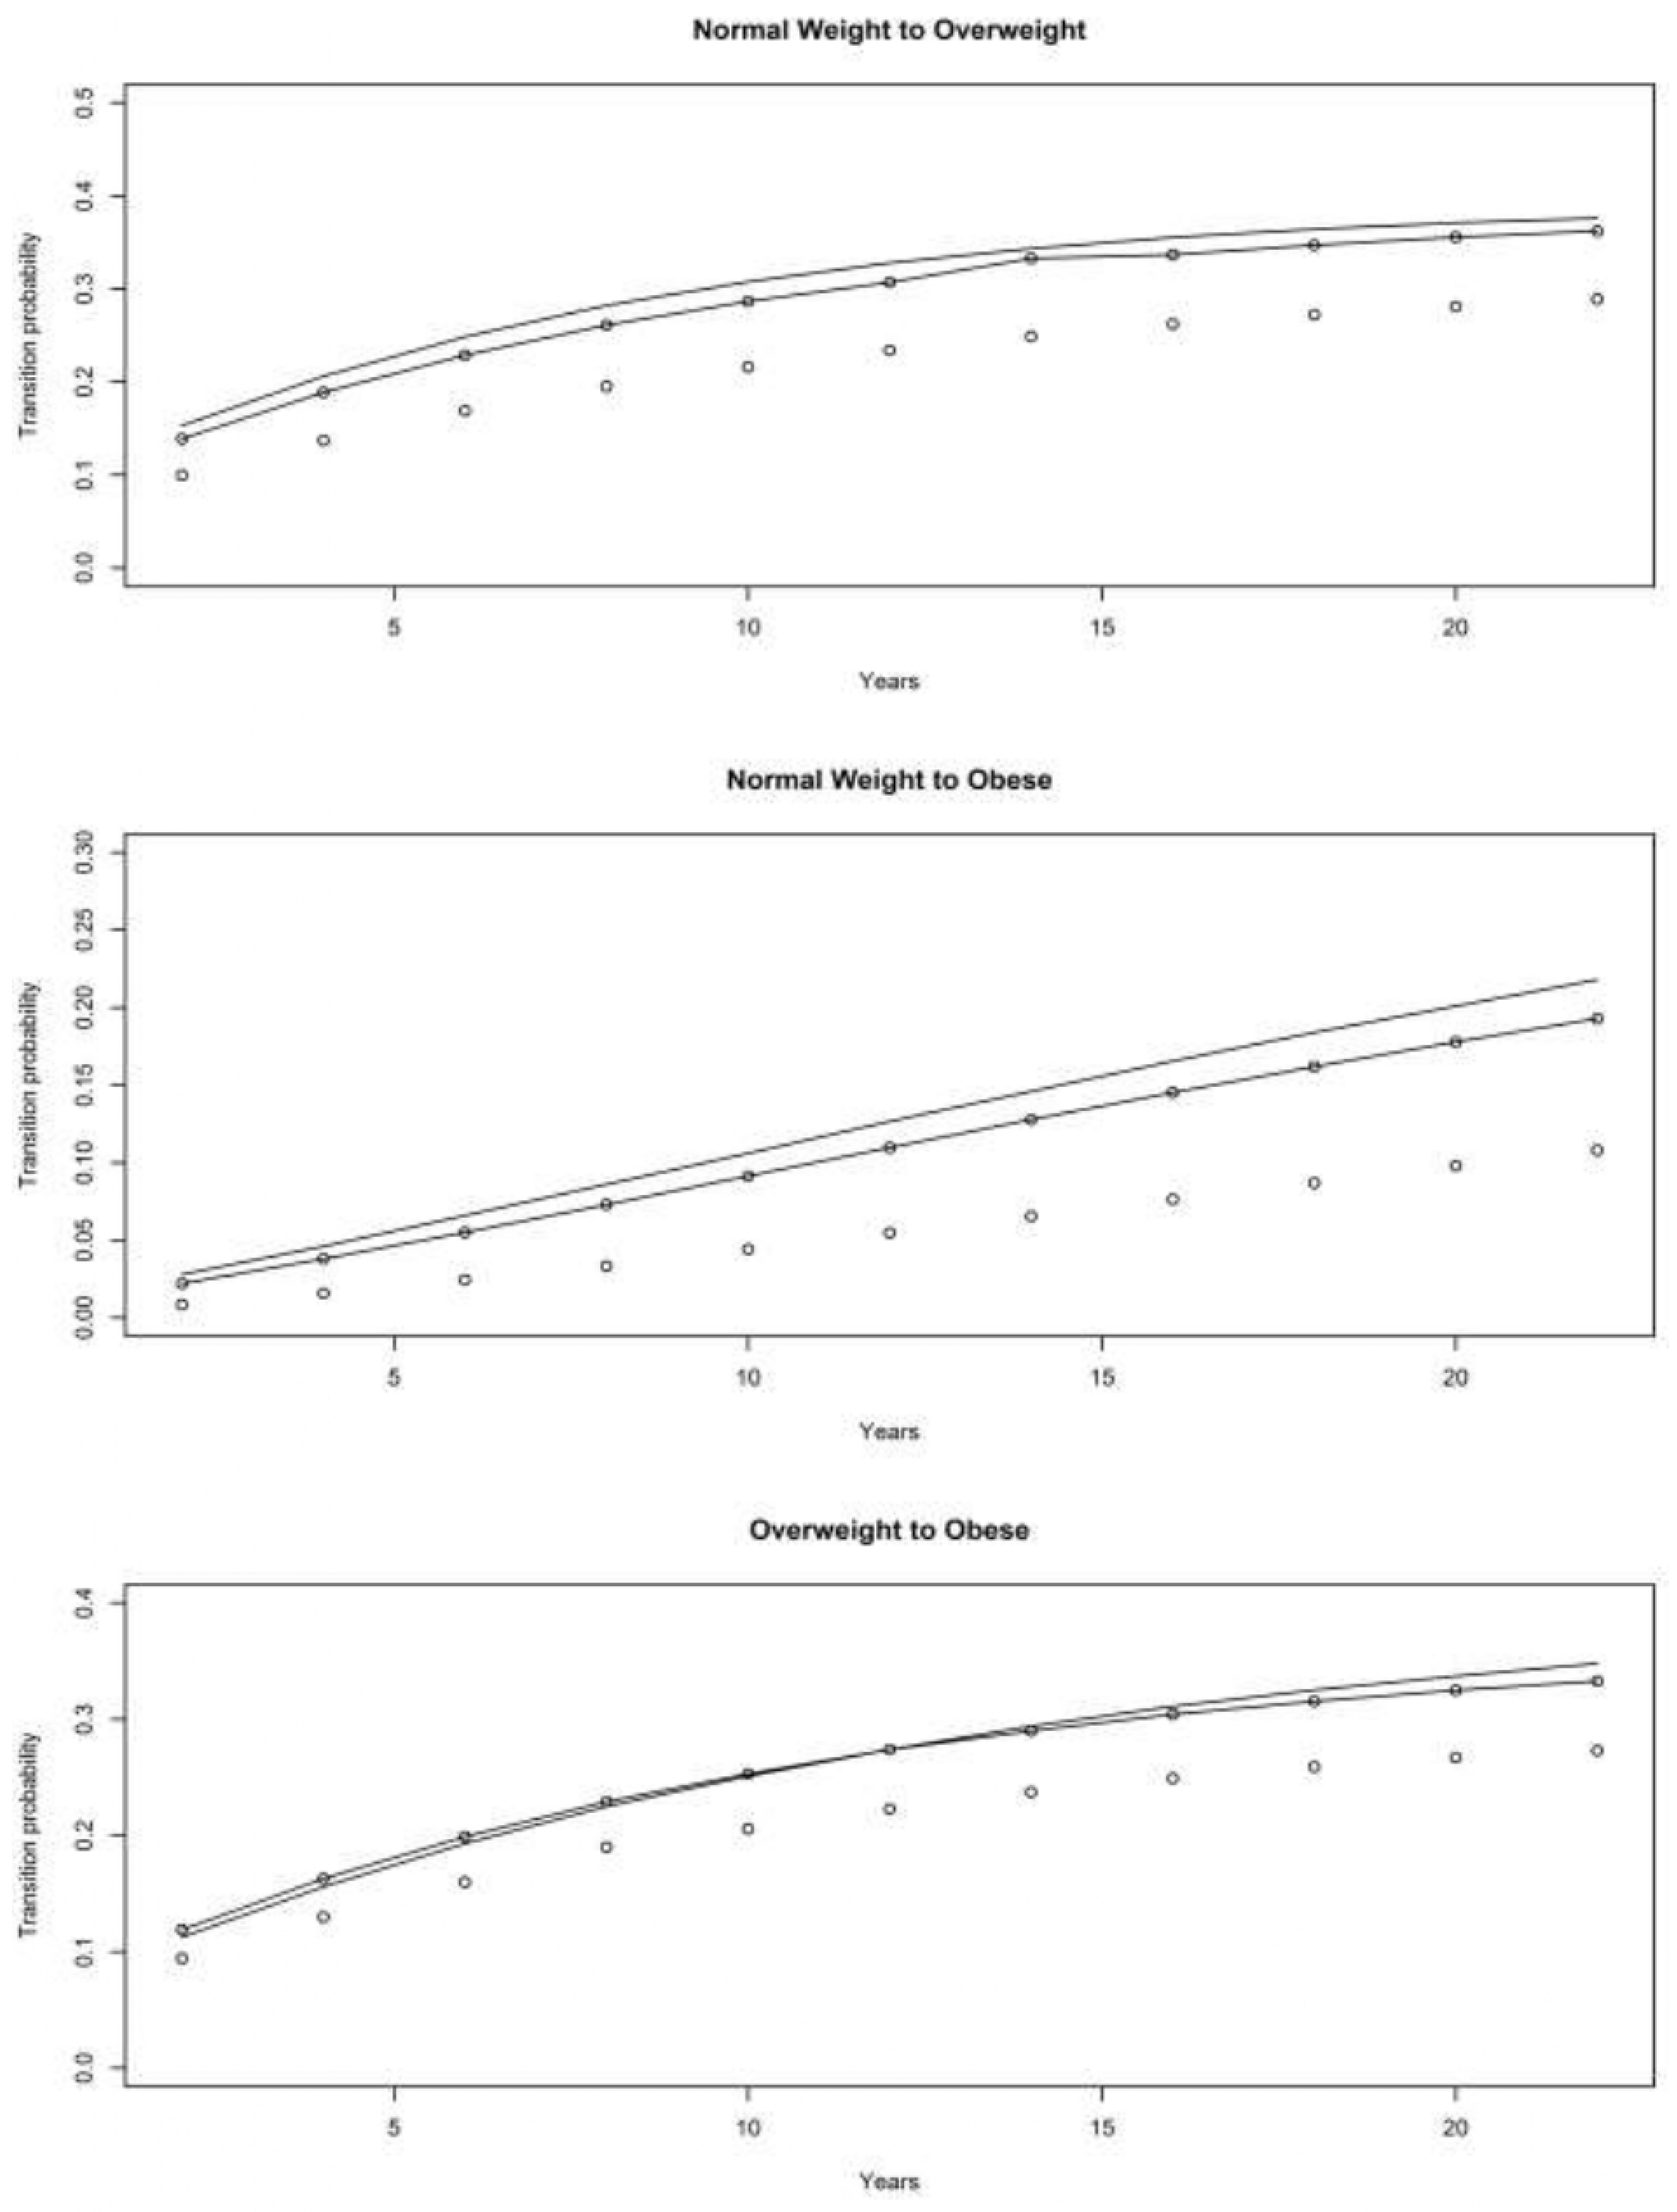
Figure 7.
Transition probabilities associated with weight gain—males from WB cohort.
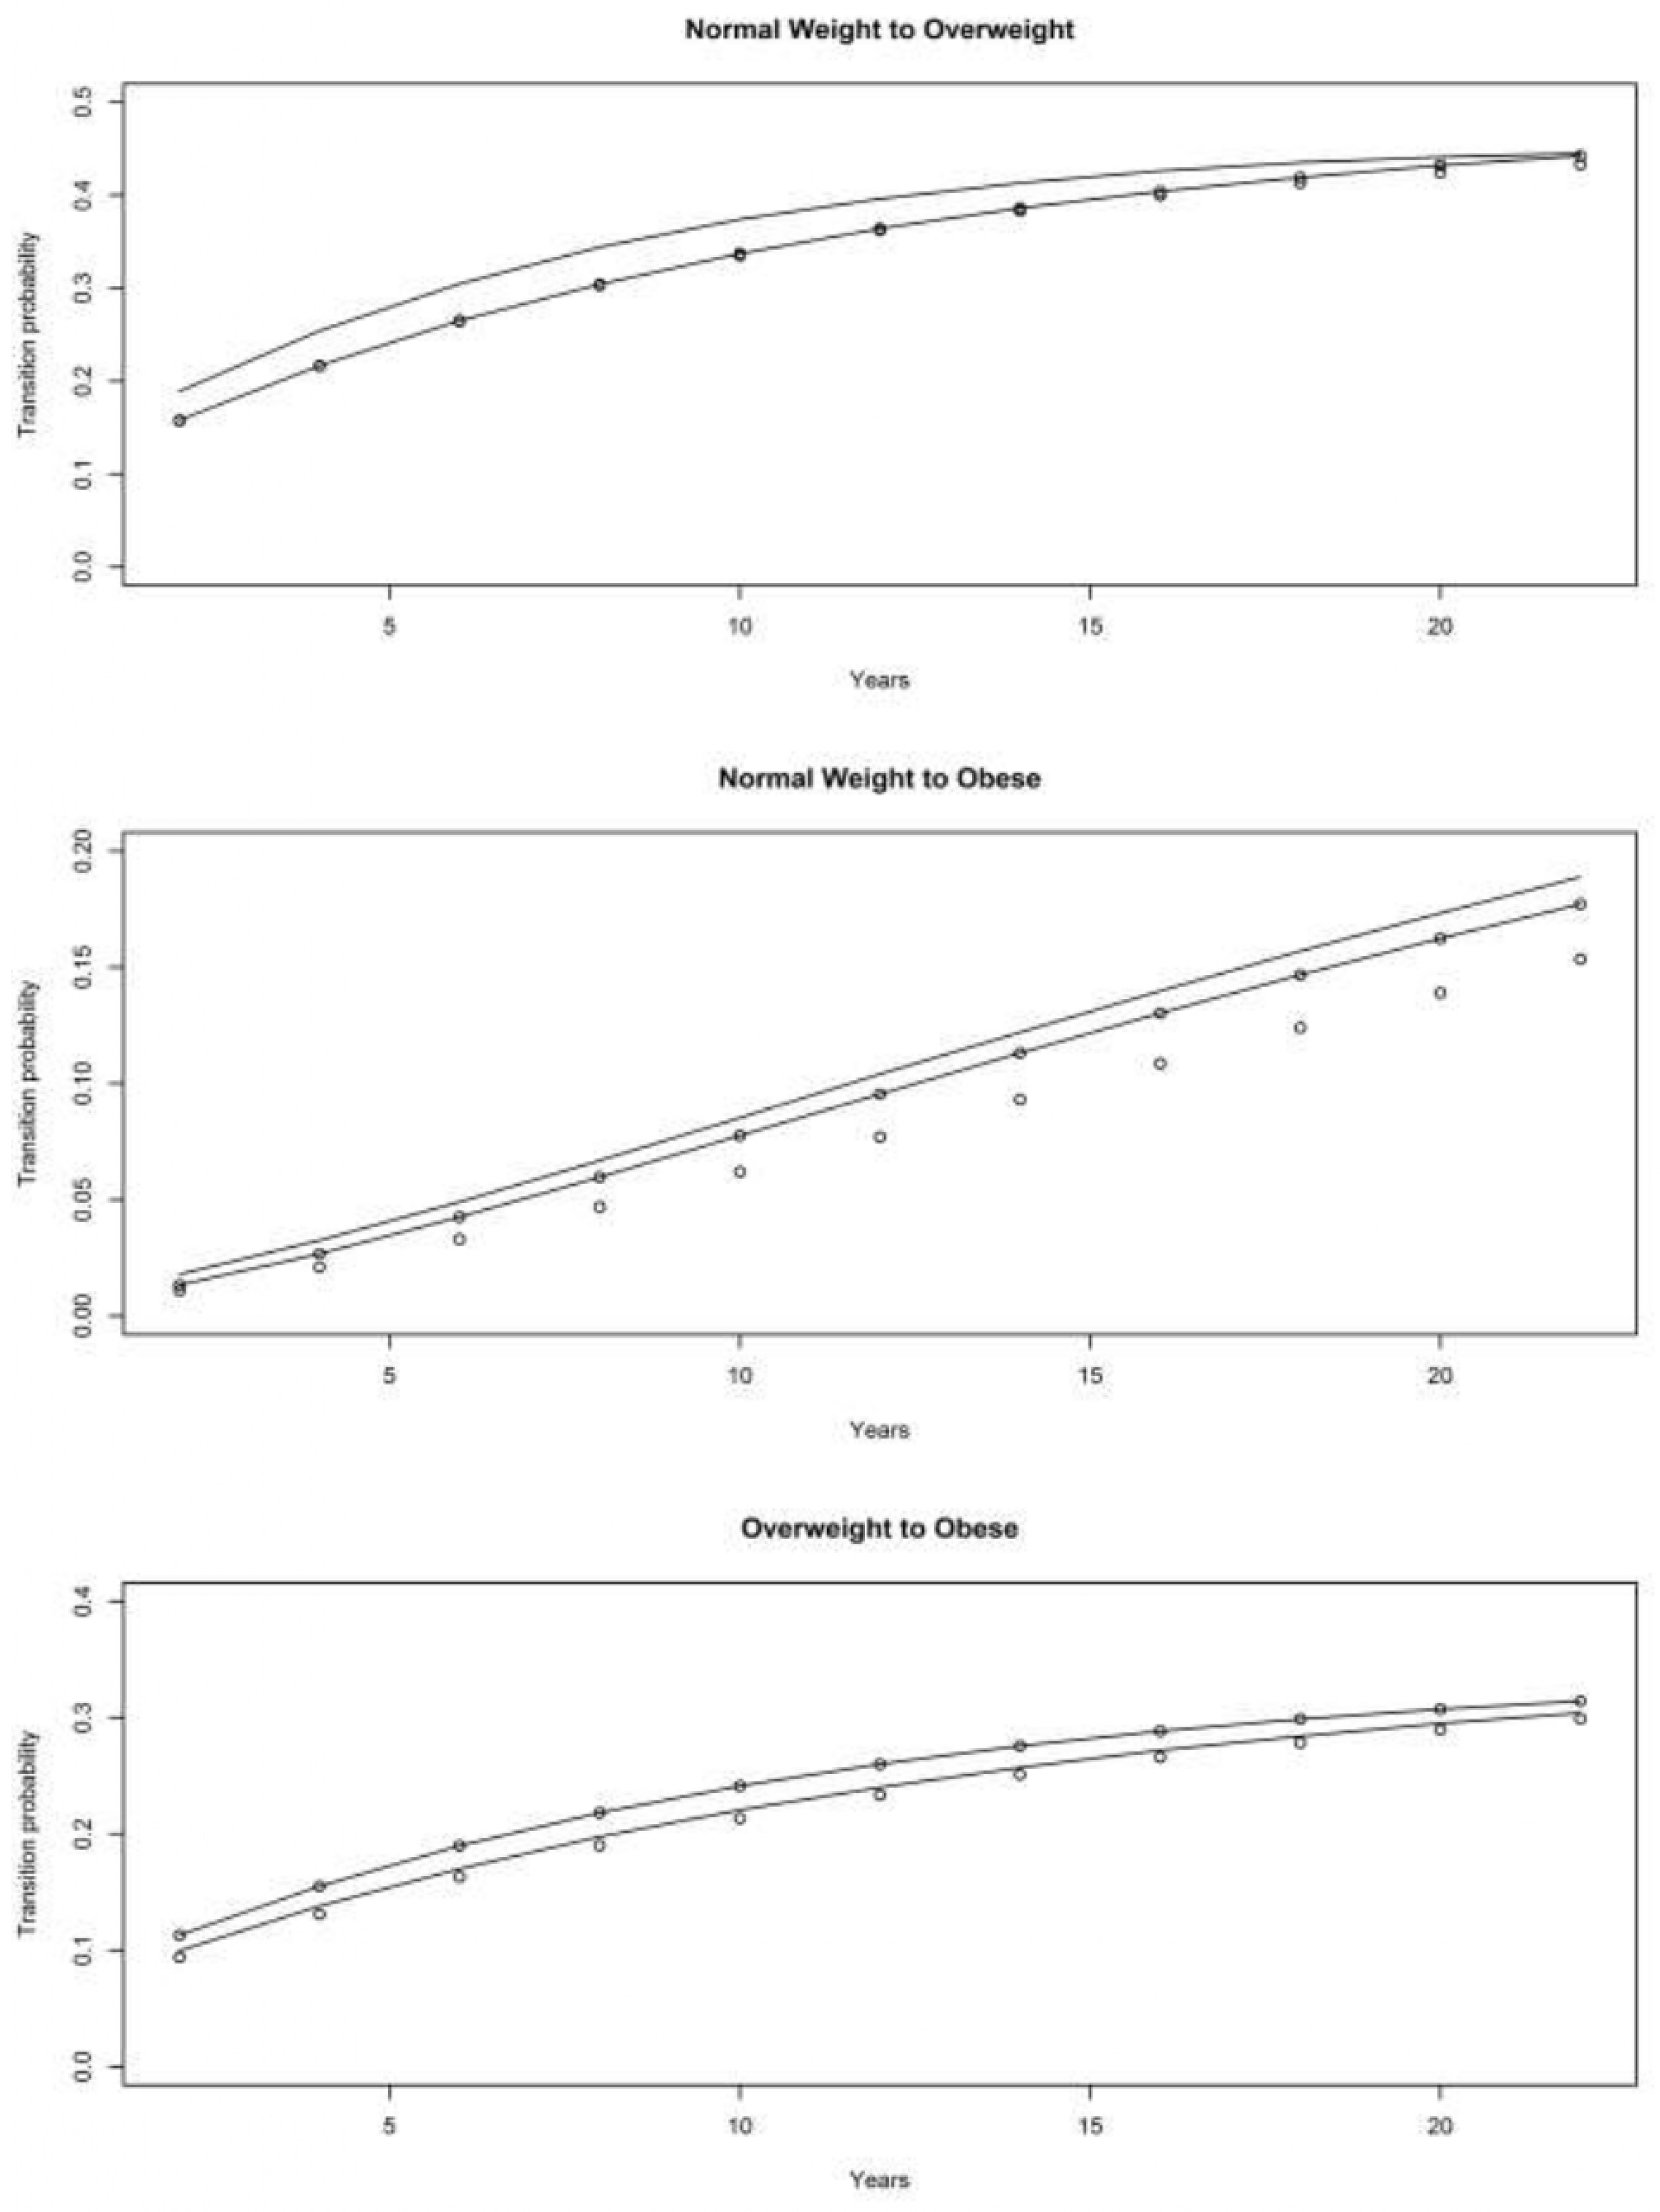
Figure 8.
Transition probabilities associated with weight gain—females from WB cohort.
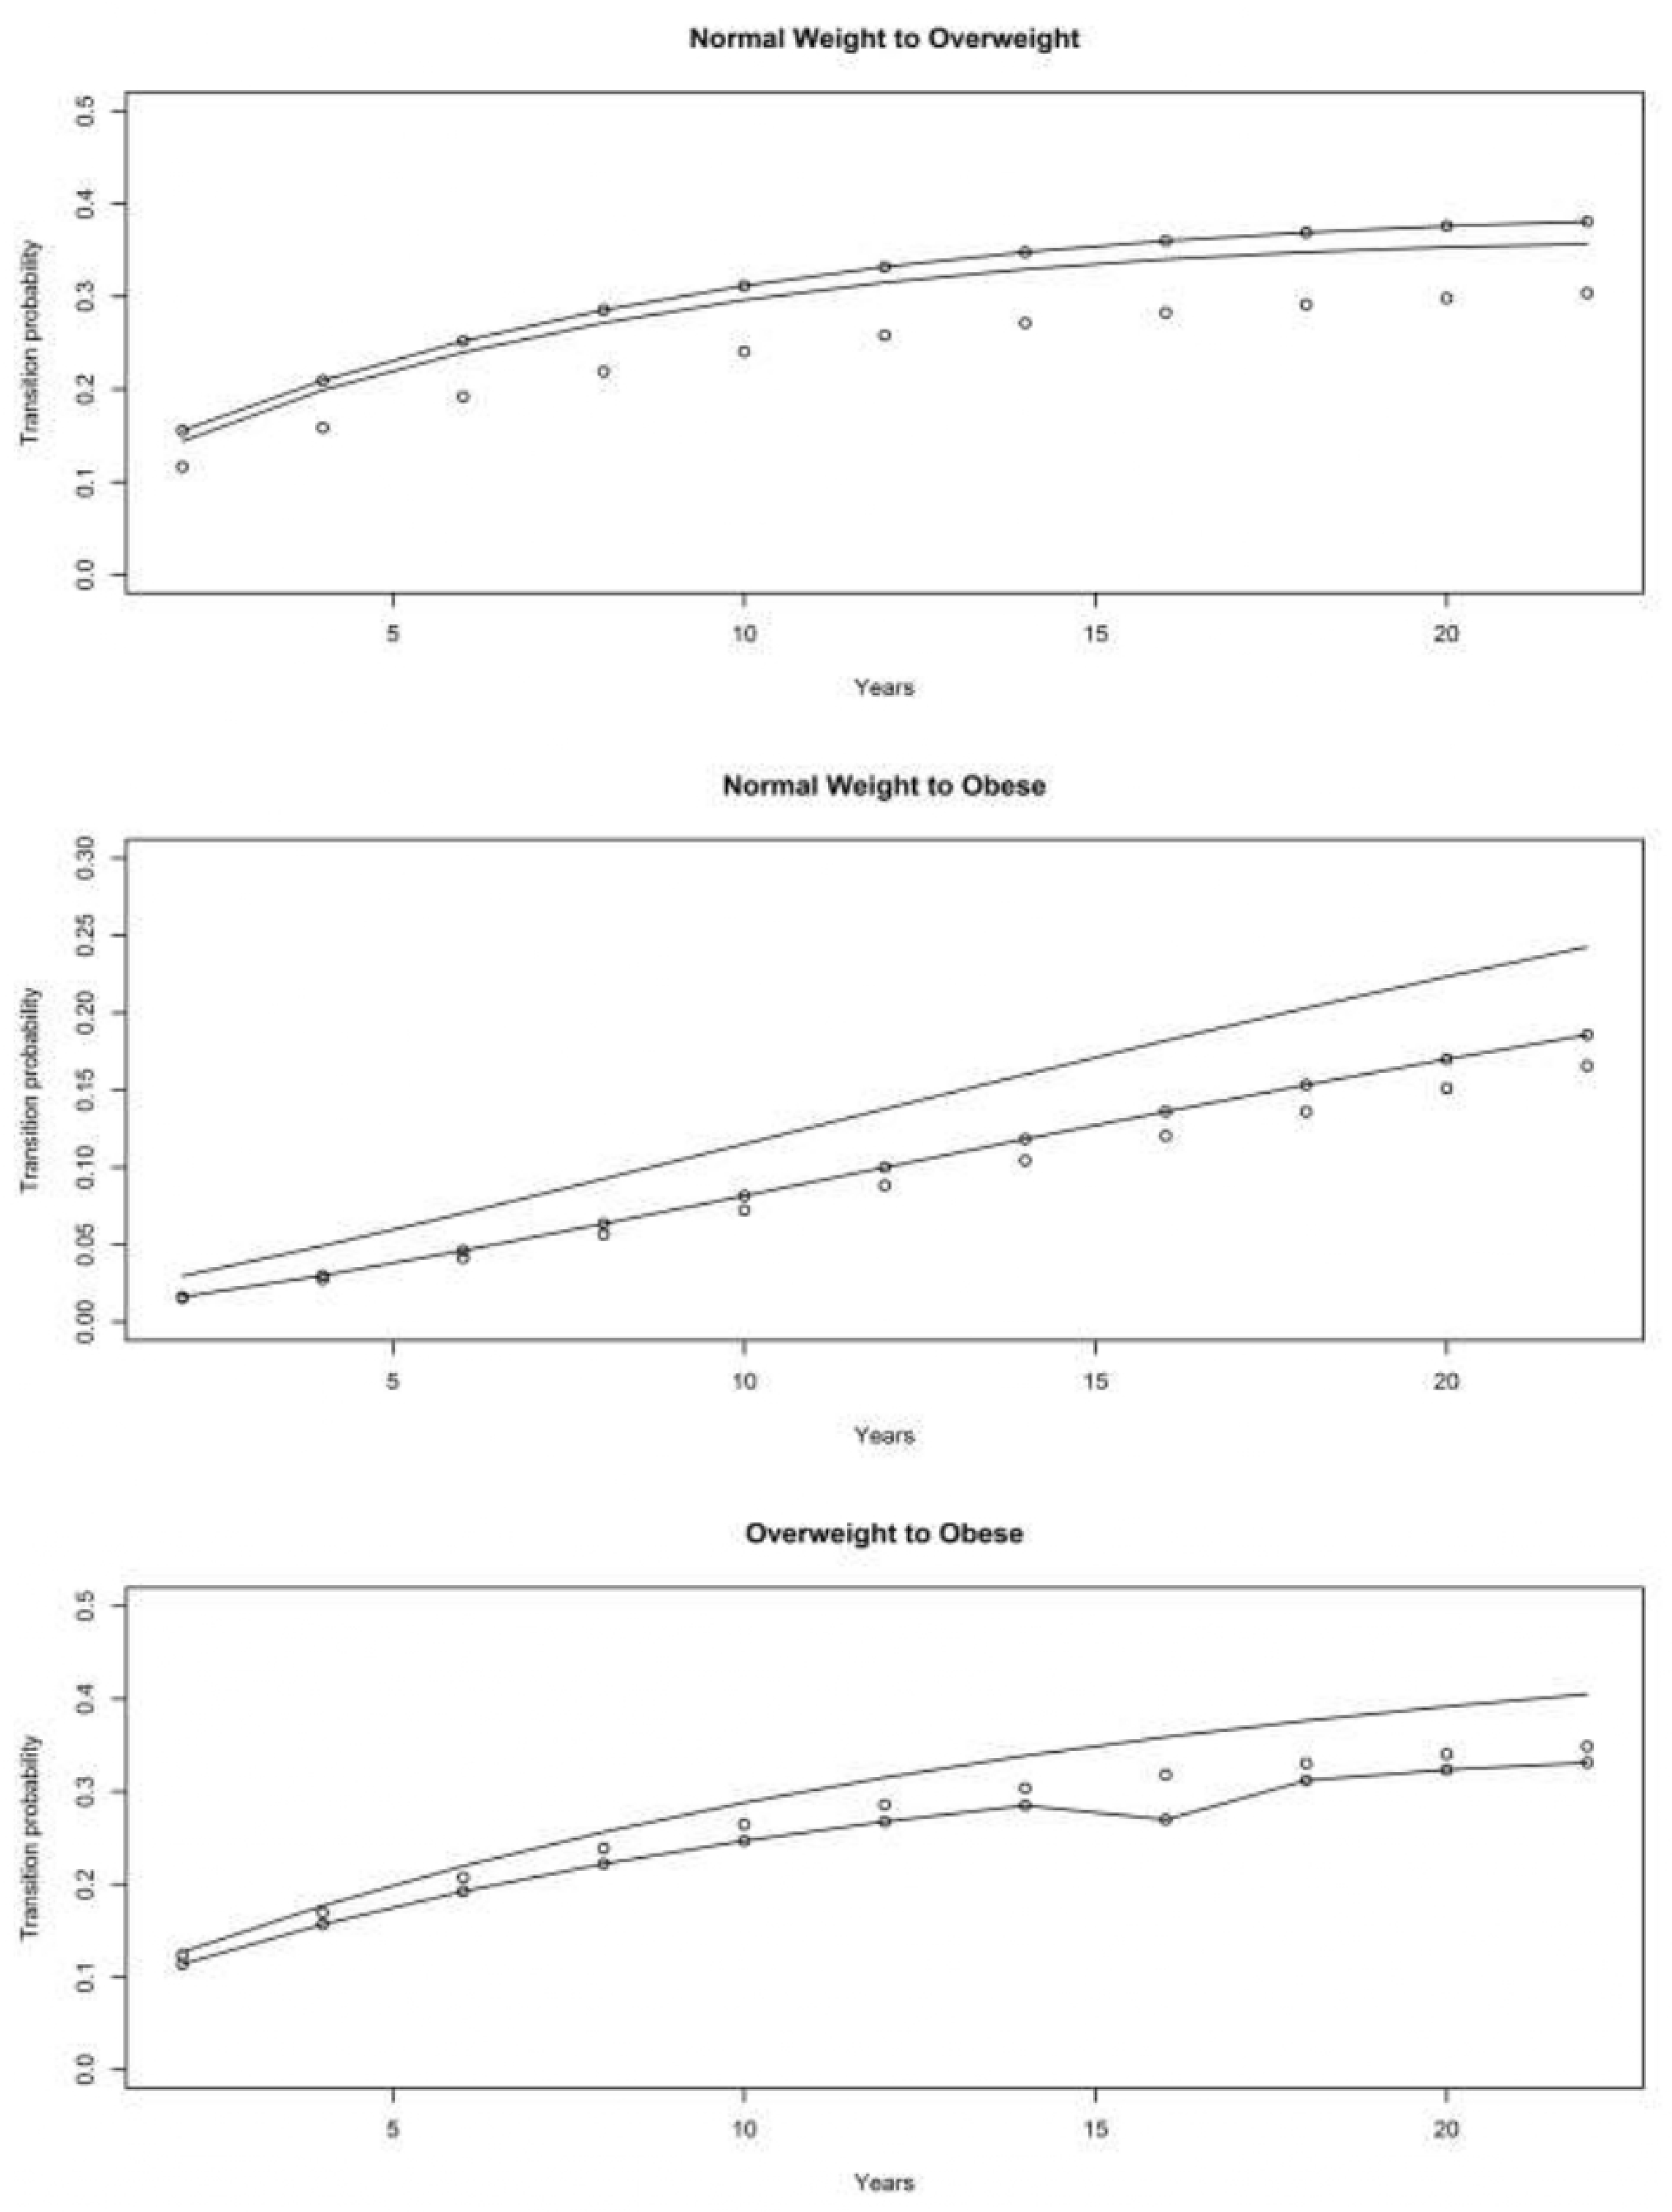
Figure 9.
Transition probabilities associated with weight gain—males from EBB cohort.
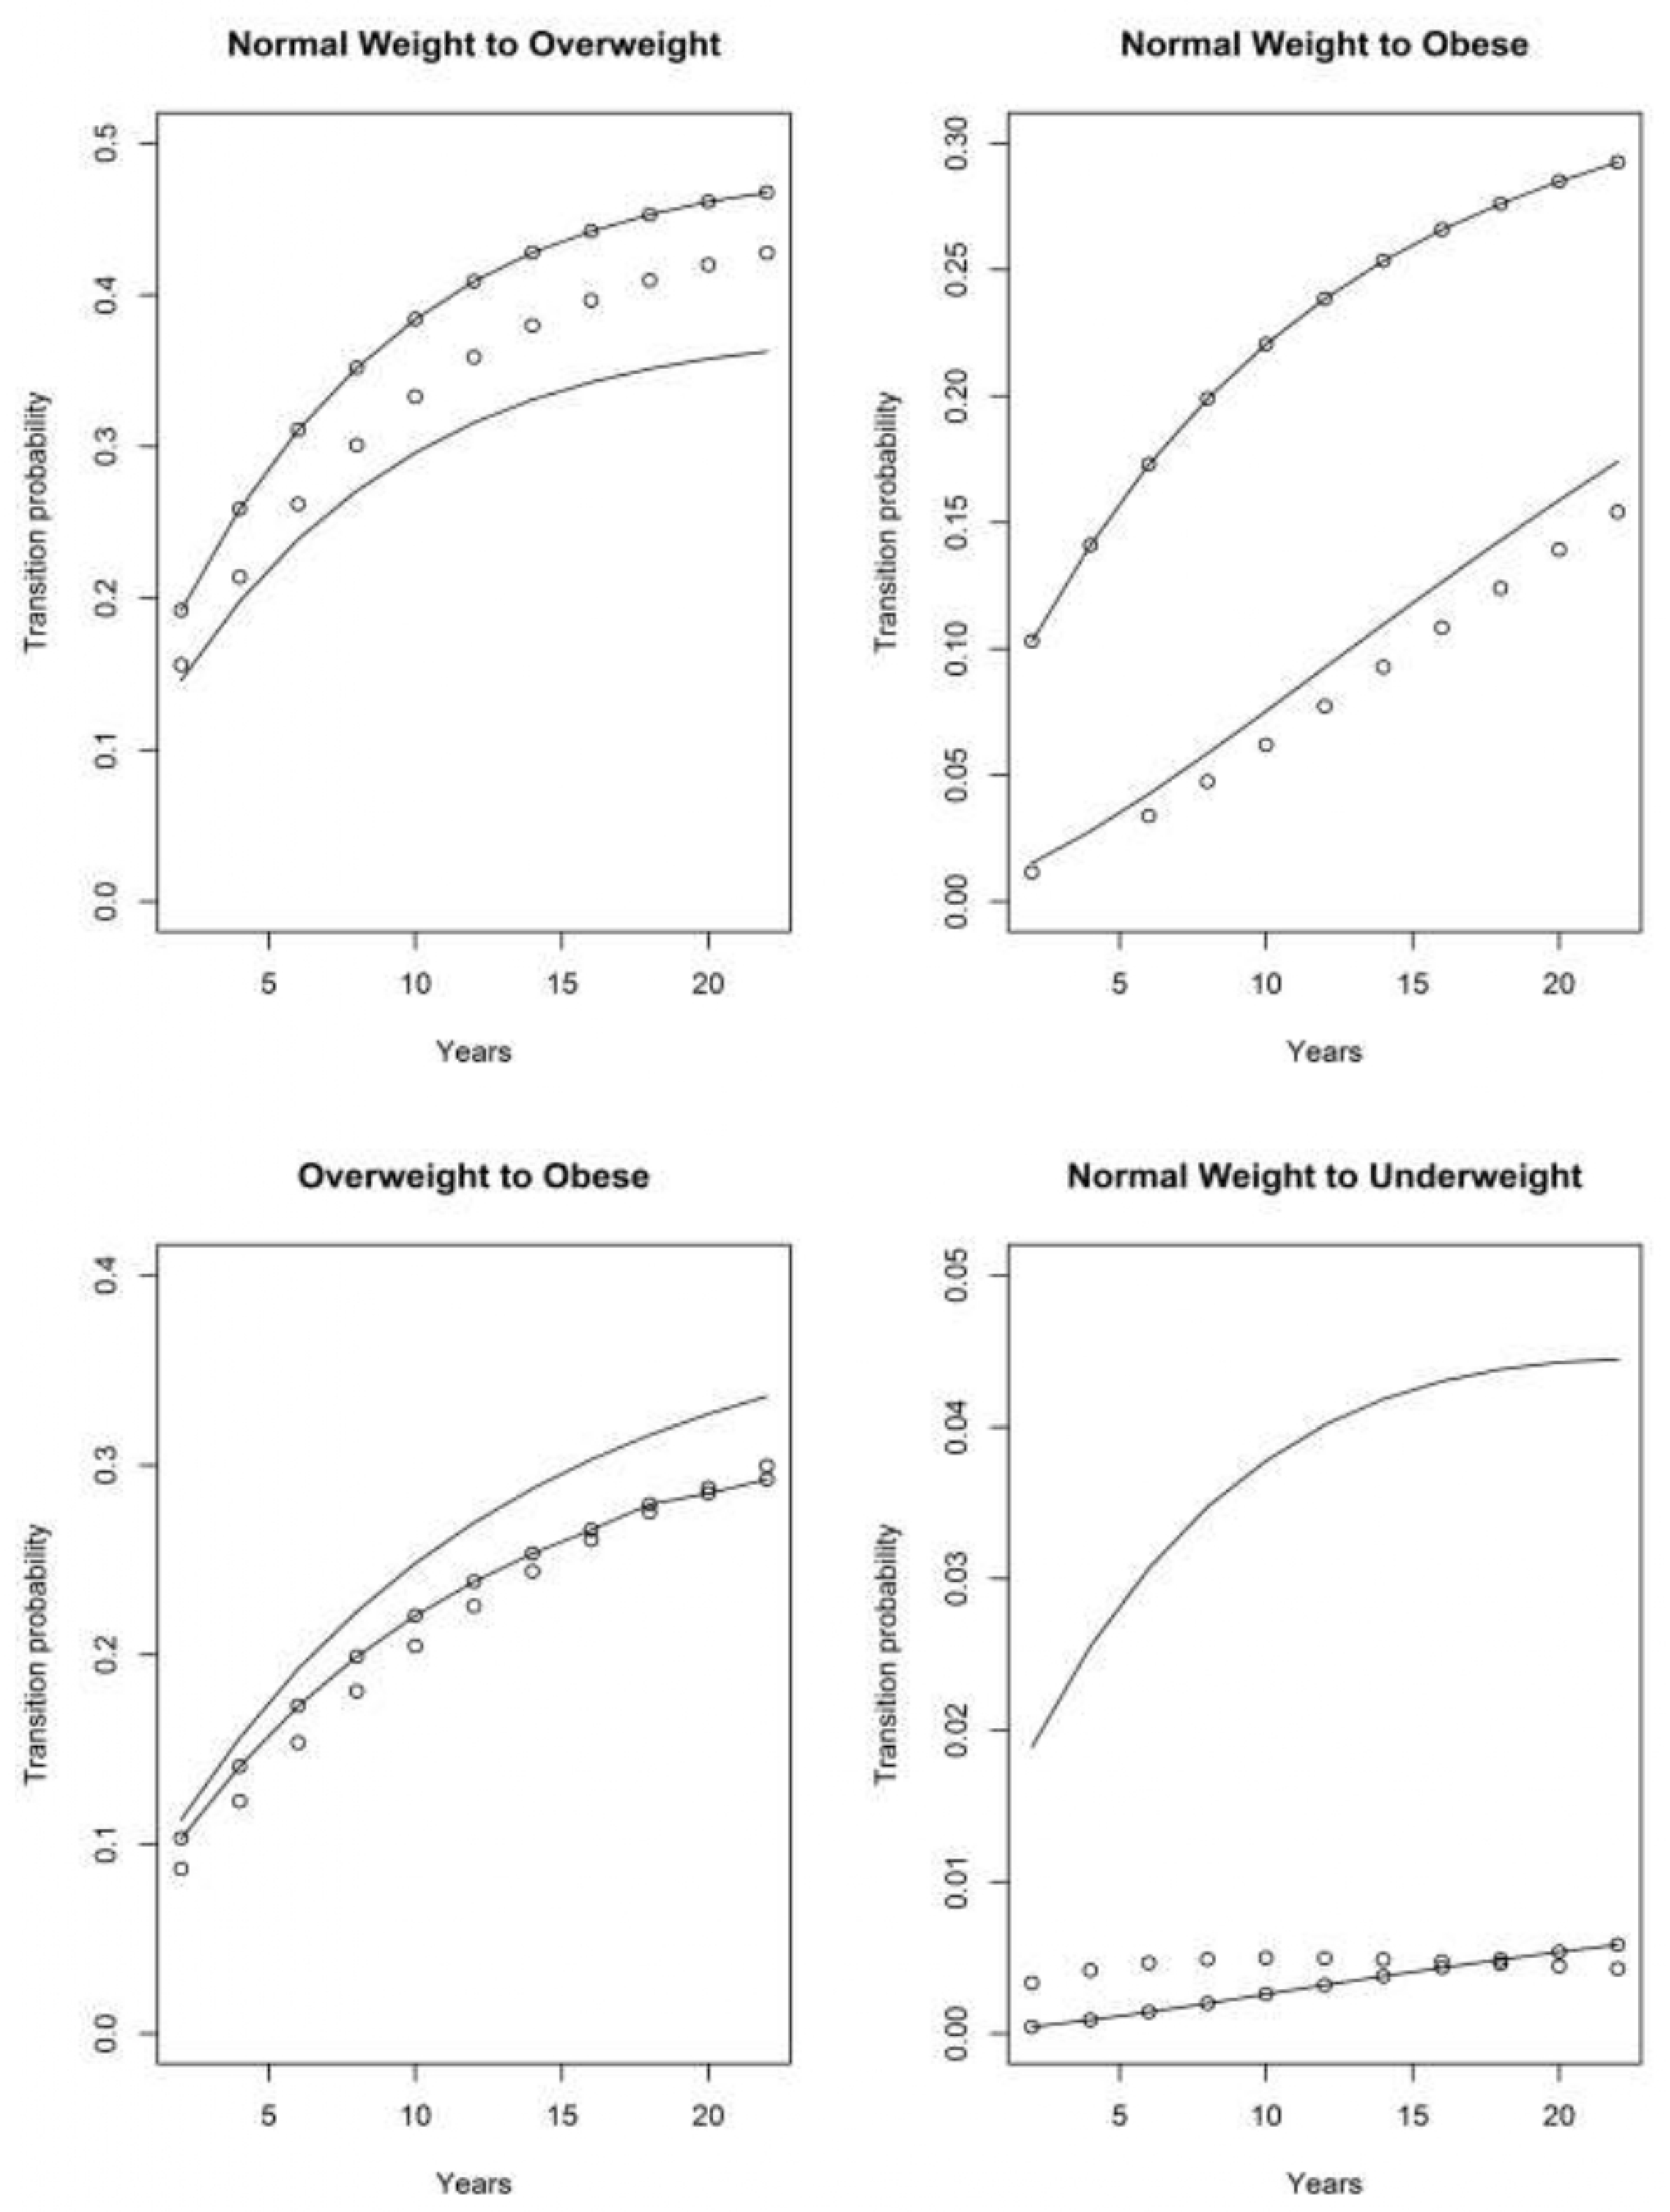
Figure 10.
Transition probabilities associated with weight gain—females from EBB cohort.

Figure 11.
Transition probabilities associated with weight gain—males from MBB cohort.
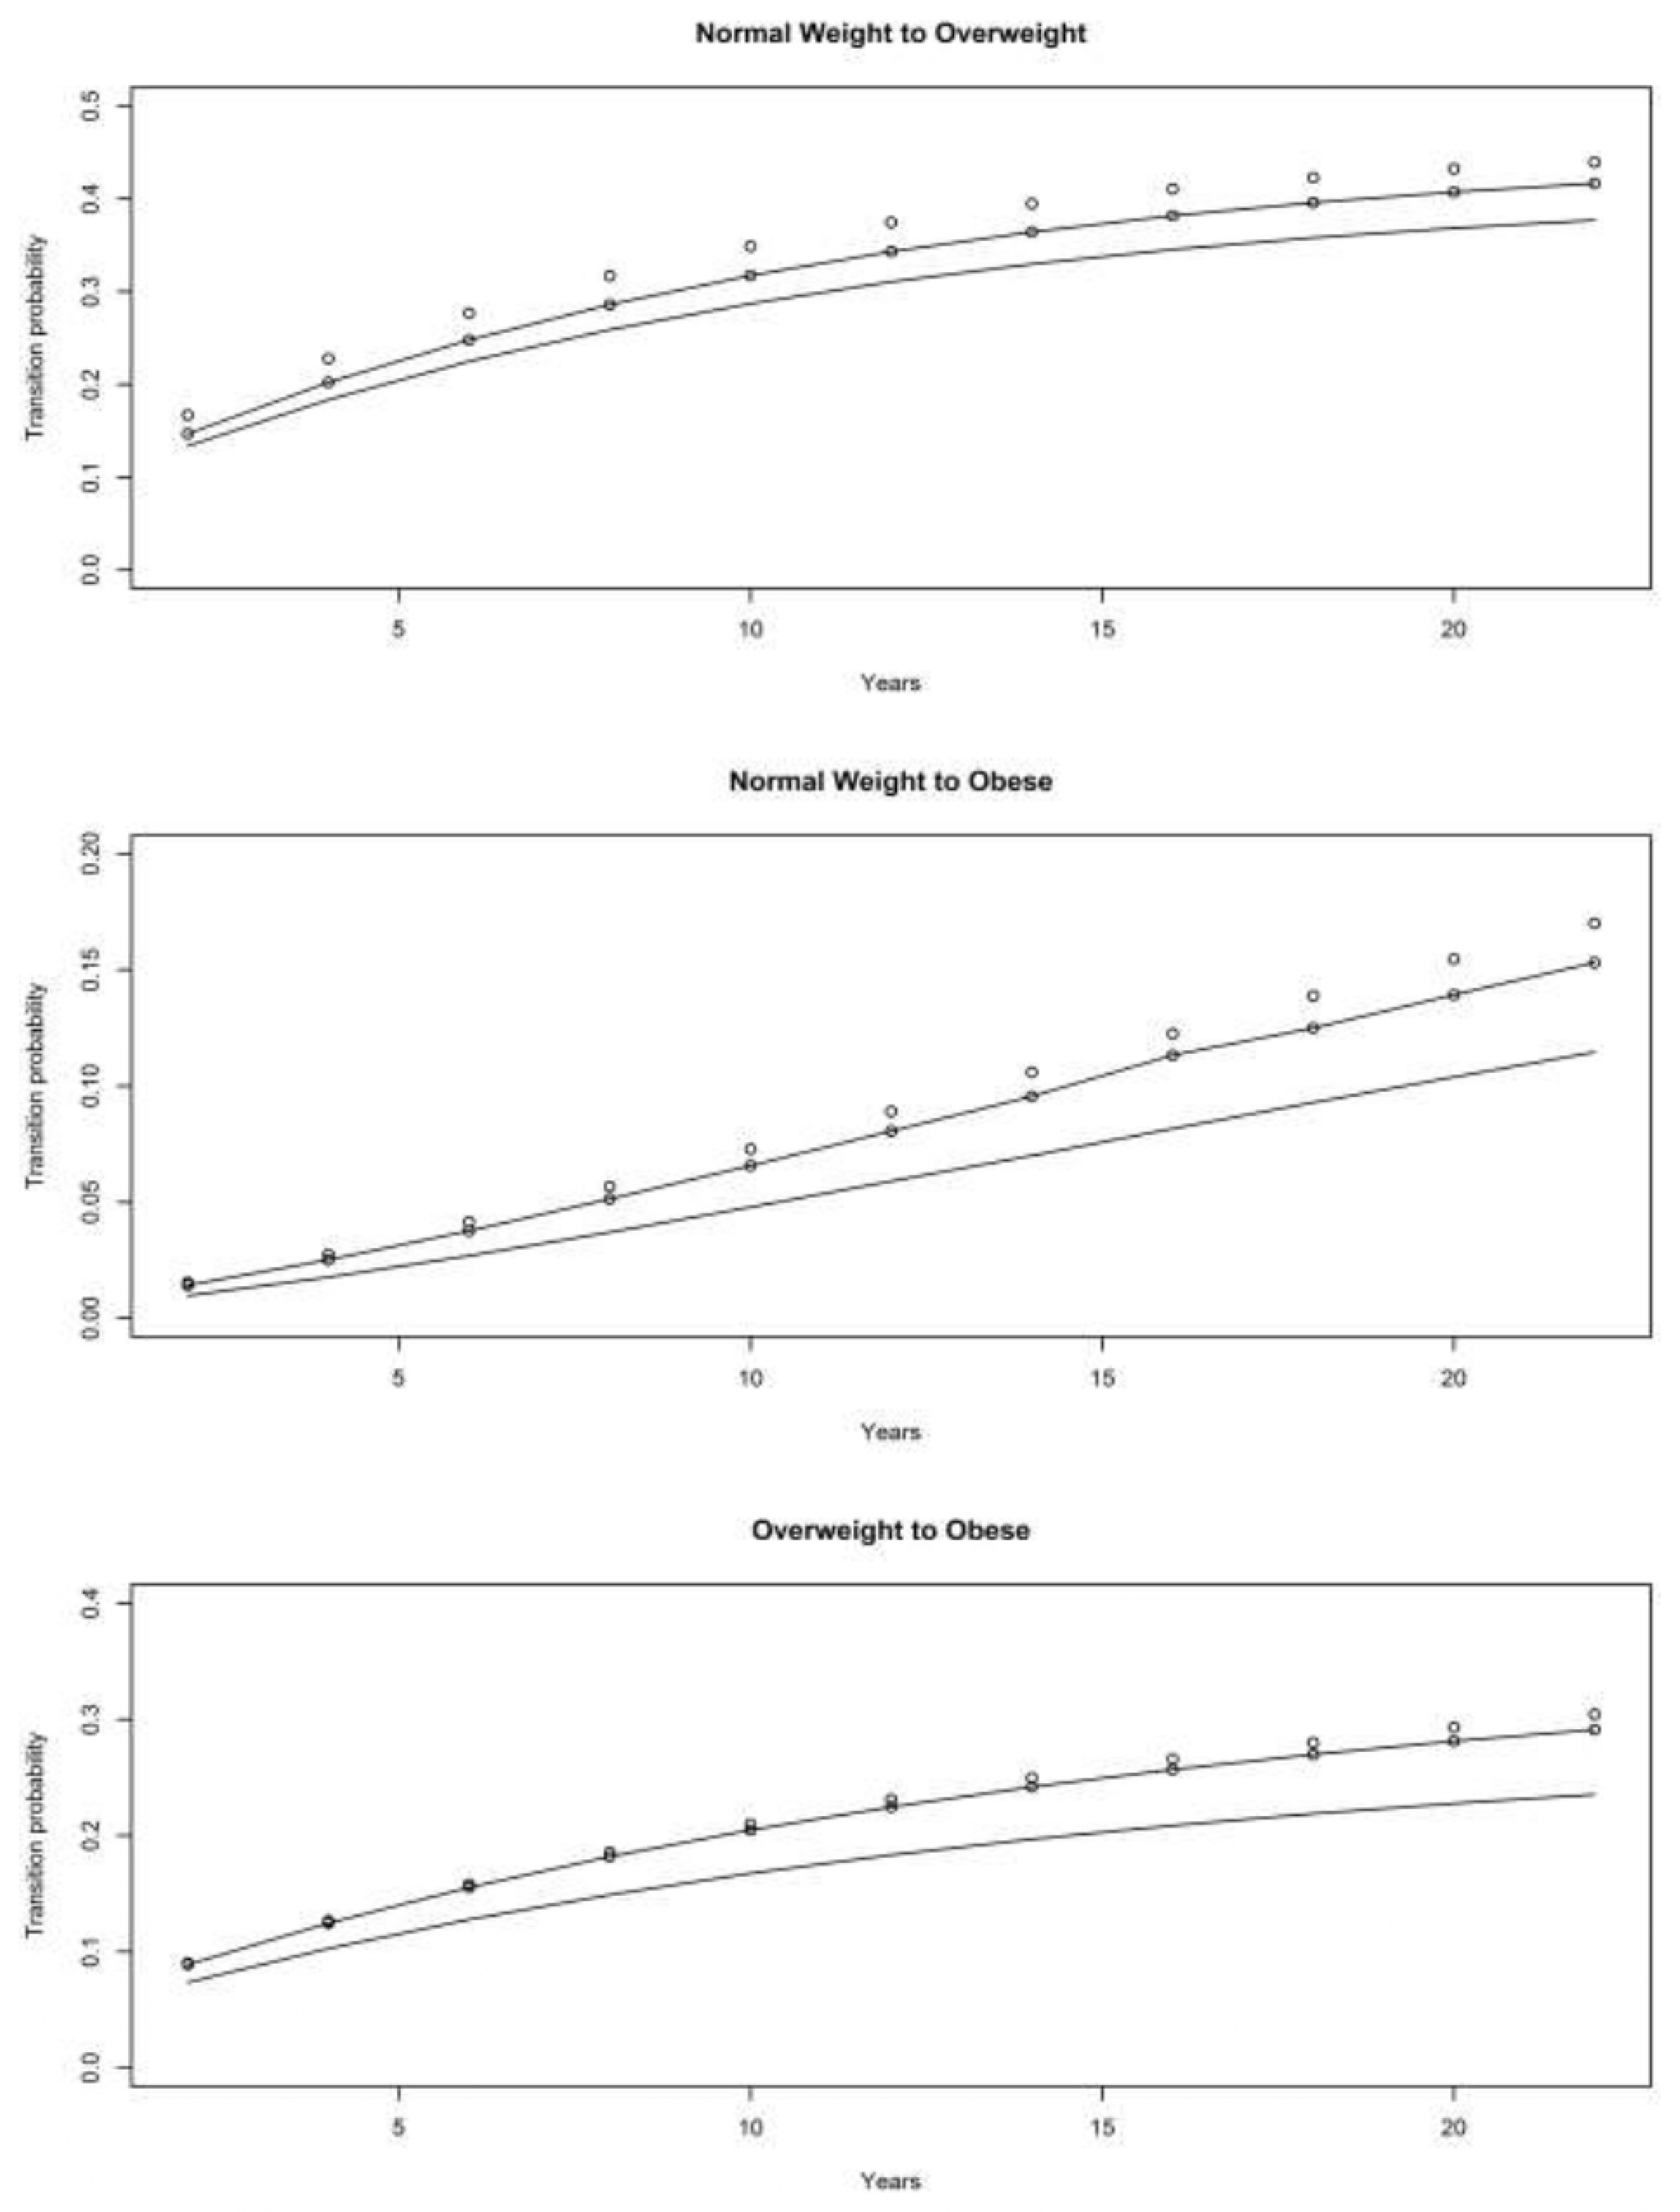
Figure 12.
Transition probabilities associated with weight gain—females from MBB cohort.

Table 1.
Variable descriptions, percentages, and means, HRS 1992–2014.
| Variables | Mean, Median, N or (Range) | ||
|---|---|---|---|
| Age | 76 (50 to 98) | ||
| Race/Ethnicity/Gender | |||
| White Male | 11,414 | ||
| White Female | 13,641 | ||
| Black Male | 2579 | ||
| Black Female | 3715 | ||
| Hispanic Male | 1725 | ||
| Hispanic Female | 2115 | ||
| Race | |||
| White | 68.37% | ||
| Black | 17.68% | ||
| Hispanic | 11.08% | ||
| Other | 2.87% | ||
| Sex | |||
| Male | 43.97% | ||
| Female | 56.03% | ||
| BMI | All | Male | Female |
| 1992 | 26.5 (12.8–102.7) | 26.6 (13.6–102.7) | 25.8 (12.8–60.6) |
| 1994 | 25.8 (12.6–92.2) | 26.1 (12.6–92.2) | 25.5 (12.8–74.5) |
| 1996 | 25.8 (10.8–75.5) | 26.4 (10.8–54.9) | 25.6 (11.9–75.5) |
| 1998 | 26.2 (9.6–74.5) | 26.6 (12.8–65.0) | 25.8 (9.6–74.5) |
| 2000 | 26.4 (11.5–75.5) | 26.6 (11.7–64.6) | 25.8 (11.5–75.5) |
| 2002 | 26.5 (9.5–70.9) | 26.6 (9.5–59.1) | 26.2 (11.1–70.9) |
| 2004 | 26.6 (9.6–71.3) | 26.9 (13.6–57.4) | 26.5 (9.6–71.3) |
| 2006 | 27.1 (10.6–82.7) | 27.2 (12.2–61.1) | 26.2 (10.6–82.7) |
| 2008 | 27.3 (10.6–74.4) | 27.3 (10.6–60.3) | 27.0 (10.9–74.4) |
| 2010 | 27.5 (7.0–79.1) | 27.6 (7.0–60.8) | 27.4 (9.3–79.1) |
| 2012 | 27.5 (8.9–83.0) | 27.6 (9.4–59.2) | 27.5 (8.9–83.0) |
| 2014 | 27.5 (11.0–76.6) | 27.7 (12.2–62.2) | 27.5 (11.0–76.6) |
Note: Age was described by mean with range in parentheses. Race/ethnicity/gender was described by N. BMIs were described by medians with ranges in parentheses.
Table 2.
Variable descriptions, percentages, and means by cohort, HRS 1992–2014.
| Variables | AHEAD | CODA | HRS | WB | EBB | MBB |
|---|---|---|---|---|---|---|
| n | 7846 | 4134 | 10,255 | 3557 | 4609 | 4788 |
| Years born | (1890–1923) | (1924–1930) | (1931–1941) | (1942–1947) | (1948–1953) | (1954–1959) |
| Ages observed | 91–109 | 84–90 | 73–83 | 67–72 | 61–66 | 55–60 |
| Race | ||||||
| White | 80.6% | 82.8% | 72.7% | 75.1% | 57.5% | 53.0% |
| Black | 13.5% | 10.3% | 17.6% | 15.9% | 24.4% | 27.3% |
| Hispanic | 5.9% | 6.9% | 9.7% | 9.0% | 18.1% | 19.7% |
| Sex | ||||||
| Male | 41.5% | 48.8% | 47.5% | 40.4% | 44.4% | 43.8% |
| Female | 58.5% | 51.2% | 52.5% | 59.6% | 55.6% | 56.2% |
| Education | ||||||
| No schooling | 42.2% | 30.8% | 26.8% | 17.3% | 16.5% | 16.2% |
| GED | 2.7% | 4.4% | 5.0% | 4.8% | 5.1% | 6.2% |
| High school | 42.4% | 45.7% | 48.0% | 50.0% | 45.9% | 45.7% |
| 2-year college | 1.7% | 2.7% | 3.4% | 5.1% | 7.1% | 8.6% |
| 4-year college | 6.7% | 10.0% | 9.5% | 12.5% | 15.0% | 14.8% |
| Master’s degree | 3.0% | 4.4% | 5.3% | 7.7% | 8.3% | 6.6% |
| Professional/terminal degree | 1.2% | 2.0% | 2.0% | 2.5% | 2.1% | 2.0% |
Publisher’s Note: MDPI stays neutral with regard to jurisdictional claims in published maps and institutional affiliations. |
© 2020 by the author. Licensee MDPI, Basel, Switzerland. This article is an open access article distributed under the terms and conditions of the Creative Commons Attribution (CC BY) license (http://creativecommons.org/licenses/by/4.0/).
Share and Cite
MDPI and ACS Style
Liew, H. Transitions among BMI States: A Test of Competing Hypotheses. Obesities 2021, 1, 1-25. https://doi.org/10.3390/obesities1010001
AMA Style
Liew H. Transitions among BMI States: A Test of Competing Hypotheses. Obesities. 2021; 1(1):1-25. https://doi.org/10.3390/obesities1010001
Chicago/Turabian StyleLiew, Hui. 2021. "Transitions among BMI States: A Test of Competing Hypotheses" Obesities 1, no. 1: 1-25. https://doi.org/10.3390/obesities1010001